Abstract
For a successful transition to low-carbon electricity supply, public support is essential. Citizen preferences are best understood in the process of informed citizen panels, where citizens are informed about the pros and cons of various electricity technologies and spend time reflecting on the trade-offs. We investigated how information about electricity technologies and their sustainability impacts can change citizens’ preferences and affect for the complete Swiss electricity mix 2035. The citizens received information as factsheets and, during workshops, discussed in groups and built their preferred electricity mix using an interactive tool. The informed citizen panel (N = 33) in the Swiss city of Geneva showed high support for domestic renewable technologies and end-use efficiency, as well as low support for net electricity import, natural gas, and nuclear power. Preferences and affect for unfamiliar technologies changed after receiving information and remained stable even in the longer term four weeks after. Preferences and affect for already familiar technologies, like hydropower, barely changed. The same procedure in the two Swiss cities of Geneva and Zurich (N = 46) enabled the identification of robust support for renewable technologies and efficiency with only minor context-specific differences.
1. Introduction
The mitigation of climate change through the promotion of low-carbon energy technologies is an issue on many political agendas after the Paris Agreement. The worldwide climate strikes since the fall of 2018 and the increasing public support for renewable energy emphasize the importance of an energy transition [1]. Given additional concerns about nuclear safety in the case of Switzerland, a new Swiss Energy Strategy 2050 has been adopted after the public referendum in 2017, with the three aims of phasing out of nuclear power and increasing the uptake of renewable energy and end-use efficiency measures [2]. Implementation of the Energy Strategy 2050 should be in line with the perspectives of citizens [3,4], whereas the Swiss option for public-initiated referenda is an additional powerful tool to influence the political progress [5,6].
Citizen preferences are best understood in the process of informed citizen panels, where citizens are informed about the sustainability pros and cons of various electricity technologies and spend time reflecting on the trade-offs [7,8,9]. In this way, the misconceptions and knowledge gaps can be reduced, leading to more robust preferences that are better aligned with the actual value judgements of the citizens and constitute better benchmarks for decision making than uninformed preferences [9,10,11]. Yet, the existing literature on informed citizen preferences has several gaps. First, more applications of such panels are needed for a comparative approach [8], so that the generalizable and context-specific findings could be disentangled. Second, investigation of the effectiveness of various informational tools for building informed and stable preferences over time is still at its early stage [9,12,13]. Third, simultaneous investigation of preferences and affect could further enhance the understanding of the formation of informed preferences, especially in the longer-term [14,15,16].
This article investigates the evolution of the preferences and affect of informed citizen panels for the Swiss electricity mix 2035. In particular, this study addresses three research questions: (1) What are the short-term and longer-term preferences and affect of an informed citizen panel in the Swiss city of Geneva for electricity generation technologies and the complete generation mix in Switzerland in 2035, given comprehensive information about the sustainability impacts of these technologies? (2) What are the impacts of informational factsheets, an interactive tool, and group discussions on preferences and affect in the short and longer term? (3) Using the exact same procedure in the two Swiss cities of Geneva and Zurich, which similarities and differences can be observed between informed citizen panels? This article presents the detailed results of an informed citizen panel (N = 33) in the city of Geneva and compares these results with the findings in the city of Zurich (N = 46), reported by Volken et al. [9]. Comparative analysis is particularly relevant in this case because, when voting on national issues, the populations of the German-speaking and French-speaking regions, where Zurich and Geneva are located, respectively, often express different opinions [17].
2. Literature Review
Numerous previous studies focused on the public acceptance of individual electricity generation technologies, such as nuclear power [18,19,20], wind [21,22,23], or solar energy [24]. Other studies considered several electricity technologies simultaneously [25,26,27,28,29,30]. However, the interconnectedness in the energy systems implies that multiple technologies need to be combined into mixes or portfolios. Some authors investigated citizen preferences for full mixes, including realistic resource or technical limitations [7,8,9,31,32,33,34]. While multiple studies found high citizen support for low-carbon alternatives, very few studies focused on low- and zero-carbon mixes [9,35]. The formation of citizen preferences for full technology mixes relies on balancing the pros and cons of multiple technologies, and previous research showed that citizens can make informed trade-offs when presented with the information and decision support [7,9,20,33,34,36]. The types of sustainability impacts investigated typically include climate change, water and air pollution, costs, reliability, land use, and accident risks.
Affect refers to the specific quality of something experienced as being “good” or “bad” and it can be experienced as a feeling state or as the positive or negative quality of a stimulus [37]. Affect is distinguished from emotion, which refers to specific states such as anger or happiness [37]. While it has been shown that affect plays a role in preference formation of energy technologies [38], few studies with diverging conclusions were dedicated to this topic. While Jobin and Siegrist [14] argued that affect has a stronger influence on citizens’ perception than concerns or beliefs, Visschers et al. [39] concluded that cognitive factors like social norms or beliefs are more important. Most studies focused on individual technologies [15,40] and little research was done on electricity mixes [14]. Research on the link between information, affect, and social acceptance is rather new, but crucial in the energy field. Jobin et al. [38] observed an influence of information on citizens’ affect. Bruine de Bruin and Wong-Parodi [41] called for educational communication before citizens form strong feelings about a topic. Volken et al. [9] studied the longer-term evolution of preferences for full electricity mix, but not of affect. Further research is needed to understand how affect and preferences for electricity mixes co-evolve over time, including affective evaluations (i.e., evaluations based on feelings) and image associations in the longer term after learning additional facts.
Different approaches have been used to elicit citizen preferences. Traditional surveys [3,16,23,26,28,32,42] were criticized for highlighting pseudo opinions rather than informed opinions [9,11,43]. Given the complexity of electricity generation and its sustainability impacts, people may lack knowledge on the topic, which leads them to express an opinion that is biased by misconceptions and does not truly reflect personal values. In order to measure informed preferences, some authors incorporated informational materials in their studies to engage people in a learning process before expressing preferences. Various types of materials were used, like factsheets about technologies and/or mixes [9,33,44] and interactive tools designed to create a personal electricity mix [7,9,31,32]. Group discussions were shown to be effective learning tools as well [7,9,33,44,45,46]. Volken et al. [9] proposed a process of creating an informed citizen panel, using a combination of tools (factsheets, interactive tool, and group discussions), and then to elicit informed preferences. Yet, few of these studies focused on preferences and affect together, as well as on comparative analysis of the informed citizen preferences from several regions.
3. Materials and Methods
3.1. Overall Procedure and Measurements
The procedure (Figure 1) that was used to create an informed citizen panel in the city of Geneva, elicit the evolution of preferences and affect for electricity technologies, and evaluate the informational material was based on the work of Volken et al. [9]. The process and materials were mostly identical in both studies and built on previous theoretical and conceptual work on citizen engagement [7,8,33], decision sciences [11], and risk communication, including the mental models approach [43] and the construction and stability of preferences [47]. There are two main differences between the earlier Volken et al. [9] and our study. First, we additionally studied the participants’ affect for electricity technologies and their sustainability impacts by integrating additional questions in the surveys, adapting existing affect concepts [15,48]. In this way, our study contributed to the informed citizen panel literature by introducing the aspect of affect in the process. Second, our study was conducted in French (instead of German) in a different Swiss city, allowing for a comparative approach.
Figure 1.
Procedure used to create an informed citizen panel in the city of Geneva with the measurements in all surveys.
The participants were recruited in March 2019 through advertisements displayed in various websites and public places. Interested citizens were asked to register online by completing survey #0, which included demographic questions and one question on preferences for individual electricity technologies (technology preferences, defined as agreement to further develop 13 electricity technologies to cover the Swiss electricity demand in 2035, using a seven-point Likert scale). A smaller sample of citizens was selected and invited to the workshops in order to have a diversified sample in terms of initial technology preferences, age, gender, education, and employment field. Selected citizens were asked to complete online survey #1, which included questions on interest in electricity generation in general and in the last four weeks (self-rated interest, measured by six items on a seven-point Likert scale, e.g., if participants read an article or discussed electricity supply), self-rated knowledge on electricity topics (measured by six items on a seven-point Likert scale), objective energy knowledge (20 true-or-false questions about electricity supply and its sustainability impacts), willingness-to-act (defined as the adoption of pro-environmental behaviours and measured by seven items on a seven-point Likert scale), and questions on affective evaluation.
By affective evaluation, we refer to citizens’ evaluations of technologies and their sustainability impacts, based on feelings. Two affect-related methods were used in survey #1. First, open questions, using affective imagery analysis [37], asked for up to three first thoughts or images that came to the respondents’ mind when thinking about a specific technology (image associations with technologies). Second, each thought was then evaluated on a bipolar affect seven-point Likert scale, ranging from “very negative” to “very positive” (affective evaluation of image associations; see Table S1 in the Supplementary Materials (SM)). As not all participants listed three thoughts, we merged the different evaluations related to the image associations to one general evaluation by using the mean of these evaluations. Affective evaluation of impacts was measured using the Self-Assessment Manikin (SAM) scale. Respondents were asked to indicate their experienced arousal measured by the SAM scale, which consisted of a nine-point scale [48,49] (see Table S2 in the SM).
Then, these citizens received printed informational factsheets on electricity technologies (Section 3.2) and a request to read them and take part in a workshop three weeks later. On average, citizens reported spending slightly more than one hour reading the factsheets (M = 77 ± 28 min). Four workshops of 2.5 h were organized, each involving nine citizens. All workshops followed the same script, adapted from Volken et al. [9]. First, citizens were randomly assigned to two discussion tables. After an introduction, they completed survey #2 to check if they were familiar with and understood the information in the factsheets (factsheets knowledge test). This was followed by a 25-min group discussion about the factsheets and electricity generation technologies, led by a facilitator. The citizens were then asked to complete survey #3, which repeated the questions from survey #1 on technology preferences and impact importance. After that, the citizens were introduced to the interactive tool Riskmeter (Section 3.2) and were asked to create their preferred electricity generation mix for Switzerland in 2035 (mix preferences, defined as the contribution of each technology in TWh/year to the preferred Swiss electricity mix 2035 in Riskmeter). Next, the citizens completed survey #4 with questions on their personal preferred mix (Riskmeter usability test, based on seven true-or-false questions about which technologies were included in the mix in Riskmeter). The mixes of all participants were then shown on a screen and discussed in groups for 25 min. After this, people had the opportunity to revise their individual mix that they submitted (mix preferences). Finally, citizens were asked to complete survey #5, which repeated the questions from survey #1 regarding image associations with technologies, affective evaluation of image associations and affective evaluation of impacts, and from survey #6, including evaluation questions on the factsheets, Riskmeter, group discussions, and the overall workshop (evaluation of tools, measured by 11 items on a seven-point Likert scale, e.g., usefulness, difficulty).
The participants had to return their printed factsheets at the end of the workshop. Four weeks later, they received an email inviting them to complete online survey #7, which repeated all questions from survey #1 and questions on the “evaluation of tools” from survey #6. The participants received a monetary compensation for taking part in survey #1 and the workshop. They received an additional compensation when they completed survey #7.
3.2. Informational Factsheets and Riskmeter
We used two types of materials from Volken et al. [9]. First, informational factsheets contained descriptions of 13 electricity generation technologies in Switzerland, their actual and prospective situation, resource potential, and sustainability impacts on environment, health, economy, and electricity supply reliability [50]. The factsheets also included a glossary explaining technical terms and a table summarizing the severity of the sustainability impacts for each technology using a five-colour scale (see Figure S1 in the SM). Technologies presented were the key possible alternatives for the Swiss electricity mix 2035, namely large hydro dams, large run-of-river hydropower, small hydropower, wind power, woody biomass, solar cells, biogas, deep geothermal, waste incineration, large natural gas power plants, nuclear power, net electricity import, electricity savings, and end-use efficiency improvements. The factsheets from [50] were only modified by adding one additional sentence on deep geothermal energy to ensure that people did not mix up deep geothermal plants for electricity generation with shallow- and medium-depth geothermal systems for space heating that are currently planned in Geneva. Sustainability impacts of each technology on climate change (CO2equiv), local air pollution (PM10equiv, SOx, and NOx), water resources and quality, landscape and land use (m2), biodiversity, waste management and raw material needs, electricity costs (cents per kWh), supply reliability, and accidents and risks were described qualitatively and quantitatively. Before preparing these factsheets, interviews were conducted to assess the technology knowledge of the Swiss citizens and target any knowledge gaps and misconceptions in the factsheets [51].
Second, an interactive tool Riskmeter [52] allowed the citizens to build a realistic electricity mix for 2035 in Switzerland under technology and energy resource constraints in a way that is consistent with Swiss electricity supply modelling studies [53,54]. The initial setup in Riskmeter showed the current electricity mix in Switzerland, that requires adding new technologies from the factsheets to meet the demand of 70 TWh/year in 2035. With the exception of nuclear, which is foreseen to be phased out in the long run [2], citizens could not exclude the plants existing today. While varying the contribution of technologies in TWh/year, the citizens could also see the share of each technology in the whole mix as well as the electricity import and export outcomes.
3.3. Participants of Informed Citizen Panels in Geneva and Zurich
During the informed citizen panels in the city of Geneva, 133 citizens registered in survey #0 and a diverse sample of 48 citizens was invited to fill survey #1 and participate in the workshops. From 36 citizens that showed up in the workshops, three were excluded from the sample because two of them did not complete the last survey and one person did not pass the knowledge test on the factsheets, meaning that they did not study them well enough (Section 3.2). In the final sample of 33, all participants were from the French-speaking part of Switzerland: 67% lived in the canton of Geneva and 70% lived in a medium or large city (over 30,000 or 100,000 inhabitants respectively). Most of the participants (88%) were born or lived in Switzerland for over 10 years. Only 45% of the participants were female, which is lower than the Swiss gender ratio of 50.4% [55]. The participants were between 19 and 60 years old (M = 32.3 ± 12.9 years); our sample was thus on average younger than the general Swiss population (M = 42.2 years) [55]. A total of 75% of the participants graduated from high school and 45% obtained a university degree, indicating that our sample was better educated than the general Swiss population, with 29.8% of citizens that graduated from high school and 18.2% that had a degree from university [56]. The participants were not selected in order to achieve a representative sample, but rather obtain as diverse a sample as possible in terms of demographics and technology preferences.
In the case of informed citizen panels in Zurich in May–August 2017 by Volken et al. [9], 46 citizens took part. They all came from the German-speaking part of Switzerland and 48% lived in a medium or large city. They were all born or lived in Switzerland for more than 10 years. Their age varied between 18 and 77 years old (M = 42.1 ± 16.6 years) and 50% of the participants were female. A total of 66.7% had graduated from high school and 40% had obtained a university degree. In comparison with the sample in Zurich, our sample in Geneva was younger on average, included fewer women, and had more citizens from urban areas, whereas the education level of the citizens was comparable.
4. Results
4.1. Preferences and Image Associations for Individual Electricity Technologies in Geneva
Technology preferences of the involved citizens were elicited at the beginning of the study (survey #1), after having read the factsheets and discussed them (survey #3), and in the longer-term (i.e., four weeks after the workshop, survey #7). Average preference ratings are shown in Figure 2. Electricity savings and efficiency were rated the highest (M = 6.6 ± 1.8) at the beginning of the study and similarly high after reading the factsheets. Initial (survey #1) and informed (survey #3) preferences also showed high levels of support for hydropower (M = 5.7 ± 1.6 for large run-of-river; M = 5.3 ± 1.7 for large dams; M = 5.3 ± 2.4 for small hydropower), solar cells (M = 5.7 ± 1.3), and wind power (M = 5.5 ± 1.8), and no significant changes were observed between survey #1 and survey #3. Preference rating for waste incineration increased significantly between survey #1 and survey #3 (M = 4.6 ± 2.0 versus M = 5.6 ± 1.6, t = −2.569, p = 0.012). Biogas was initially rated positively, but preference ratings decreased after receiving information (M = 5.5 ± 2.3 versus M = 4.6 ± 1.7, t = 2.178, p = 0.033). The same trend was observed for woody biomass (M = 5.1 ± 2.2 versus M = 3.8 ± 2.0, t = 3.006, p = 0.004) and deep geothermal (M = 5.5 ± 2.4 versus M = 3.6 ± 2.2, t = 3.808, p < 0.001), for which the preferences dropped under the midline of “neither agree or disagree”. Initial support for large natural gas power plants was below the midline and decreased even more in survey #3 (M = 2.9 ± 1.6 versus M = 1.8 ± 1.0, t = 3.734, p < 0.001). Nuclear and net import were rated the lowest in survey #1 (M = 2.5 ± 1.7; M = 2.9 ± 1.5, respectively) and remained as low after reading and discussing the factsheets.
Figure 2.
Average technology preferences of the informed citizen panel when asked to which extent they would agree to expanding individual electricity technologies in Switzerland in 2035 (seven-point Likert scale, 1 = Completely disagree to 7 = Completely agree). Statistically significant differences (p < 0.05) are: (a) between survey #1 and survey #3, (b) between survey #1 and survey #7), (c) between survey #3 and survey #7. Average informed preferences are: electricity savings and efficiency = 6.8 ± 1.7, large run-of-river = 6.1 ± 1.0, solar cells = 5.4 ± 1.6, wind power = 4.9 ± 1.8, deep geothermal = 3.6 ± 2.2, biogas = 4.6 ± 1.7, small hydropower = 4.9 ± 1.9, large hydro dams = 5.7 ± 1.4, woody biomass = 3.8 ± 2.0, waste incineration = 5.6 ± 1.6, net import = 2.9 ± 1.5, large natural gas = 1.8 ± 1.0, and nuclear = 2.3 ± 1.6.
In the longer-term (survey #7), technology preference ratings remained comparatively high for electricity savings and efficiency, hydropower, solar cells, and wind power, with no statistically significant changes between survey #1 and survey #7, and between survey #3 and survey #7. The same was observed for nuclear power and net electricity import, which remained the lowest rated. Preferences in the longer-term for deep geothermal, large natural gas, and biogas did not show significant differences from the informed preferences and remained much lower than the initial, uninformed preferences. In informed preferences, deep geothermal dropped below the midline of “neither agree nor disagree” (M = 5.5 ± 2.4 versus M = 2.8 ± 2.1, t = 3.375, p = 0.001 between survey #1 and survey #7). Support for waste incineration remained the same four weeks after the workshop, still being rated higher than the initial level (M = 4.6 ± 2.0 versus M = 6.0 ± 1.1, t = −3.923, p < 0.001 between survey #1 and survey #7). Preference for woody biomass, which dropped after having read the factsheets, increased to close to its initial level in survey #7 (M = 3.8 ± 2.0 versus M = 4.7 ± 1.8, t = −2.051, p = 0.044 between survey #3 and survey #7).
Figure 3 shows the average combined ratings of image associations with technologies and affective evaluation of image associations to evaluate the first affective response to specific technologies. Looking at affective evaluation of image associations, hydropower and electricity savings were rated the highest at the beginning of the study (M = 6.3 ± 2.8 and M = 5.6 ± 2.8 respectively) and remained similarly high in survey #5 and survey #7. Images associated with solar cells, biogas, wind power, and waste incineration were evaluated positively over the whole study and never dropped under the “neither positive nor negative” line. These changes were not significant, except for a positive change for waste incineration (M = 4.1 ± 2.7 versus M = 5.3 ± 1.7, t = −2.275, p = 0.027 between survey #1 and survey #7). Affective evaluations of deep geothermal and large natural gas became more negative between survey #1 and survey #7: the evaluations dropped under the midline for deep geothermal (M = 4.9 ± 2.6 versus M = 3.9 ± 1.8, t = 2.052, p = 0.045) and became the lowest for natural gas (M = 2.5 ± 1.7 versus M = 1.8 ± 1.0, t = 2.259, p = 0.028). Affective evaluations of images associated with woody biomass dropped under the midline between the beginning of the study and the workshop and increased back between survey #5 and survey #7 (not significant). Regarding nuclear power, affective evaluation of images was below the “neither positive nor negative” line at all moments of the study (between M = 2.2 ± 1.3 and M = 2.3 ± 1.7) without significant changes.
Figure 3.
Average combined ratings of the informed citizen panel of image associations with technologies and affective evaluation of image associations (seven-point Likert scale, 1 = very negative to 7 = very positive). Statistically significant differences (p < 0.05) are: (a) between survey #1 and survey #5; (b) between survey #1 and survey #7. The informed evaluation ratings are: hydropower = 5.7 ± 1.1, electricity savings = 6.0 ± 1.5, solar cells = 4.7 ± 1.3, biogas = 4.9 ± 1.5, deep geothermal = 3.2 ± 1.6, wind power = 4.2 ± 1.2, woody biomass = 3.8 ± 1.7, waste incineration = 4.9 ± 1.8, large natural gas = 1.7 ± 0.7, and nuclear = 2.2 ± 1.3.
As can be expected, “affective evaluations of image associations” in Figure 2 and “technology preferences” in Figure 3 demonstrated broadly the same technology-specific pattern, indicating the validity of our results [14,15,57]. Electricity savings and efficiency, as well as renewable technologies, such as hydropower, solar cells, and others, were judged positively. Nuclear power and large natural gas plants were judged much below the midline; affective evaluations were not measured for net electricity import. Both “affective evaluations of image associations” and “technology preferences” dropped with more information for deep geothermal, large natural gas, and woody biomass plants. Except for hydropower and electricity savings and efficiency, “affective evaluation of image associations” and “technology preferences” were positively and significantly correlated for all technologies at the beginning of the study (Table S3 in SM). Particularly strong relations were observed for deep geothermal (r = 0.745, t = 4.991, p < 0.001), waste incineration (r = 0.786, t = 5.970, p < 0.001), and woody biomass (r = 0.709, t = 4.503, p < 0.001). Similar results were observed after the participants received information, except for biogas, which did not show a significant relationship in survey #5. The strongest correlations were observed for deep geothermal (r = 0.632, t = 4.466, p < 0.001), solar cells (r = 0.640, t = 4.649, p < 0.001), and woody biomass (r = 0.717, t = 5.541, p < 0.001). In the longer-term, only nuclear, solar cells, and wind power showed significant relations, with the strongest correlation observed for nuclear (r = 0.665, t = 4.971, p < 0.001).
4.2. Ratings of Sustainability Impacts of Electricity Technologies in Geneva
“Impact importance” (Figure 4) and “affective evaluation of impacts” (Figure 5) were elicited in survey #1, survey #3, and survey #7. Regarding “impact importance”, climate change and water quality were rated as the highest concerns in the beginning of the study (M = 6.6 ± 0.7 and M = 6.5 ± 0.9, survey #1) and in the longer term (M = 6.7 ± 0.7 and M = 6.3 ± 1.1, survey #7). Impacts on electricity generation costs and land use were rated as the least important during the whole study (M = 4.6 ± 1.6 and M = 5.3 ± 1.4, survey #1). Except for water quality, biodiversity, and land use, all impacts were rated as even more important in survey #3 after receiving information. In the longer term, the only significant drop concerned accident risks (M = 5.8 ± 1.4 versus M = 5.1 ± 1.8, t = −2.207, p = 0.03 between survey #1 and survey #7).
Figure 4.
Average ratings of the citizen panel regarding sustainability impact importance (seven-point Likert scale, 1 = not important at all to 7 = very important). Statistically significant differences (p < 0.05) are: (c) between survey #3 and survey #7. The informed impact ratings from survey #3 are: climate change = 6.8 ± 0.4, air quality = 6.6 ± 0.7, water quality = 6.2 ± 1.0, resources = 6.2 ± 1.0, biodiversity = 6.0 ± 1.0, risks = 5.9 ± 1.3, reliability = 5.9 ± 1.2, land use = 4.8 ± 1.8, and costs = 4.6 ± 1.6.
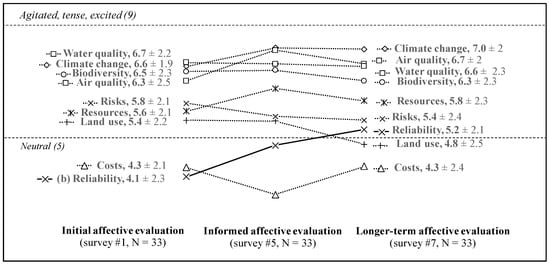
Figure 5.
Average affective evaluations of impacts by the citizen panel (nine-point Likert scale, 1 = calm, relaxed to 9 = excited, tense, agitated). Statistically significant differences (p < 0.05) are: (b) between survey #1 and survey #7. The informed feelings are: water quality = 6.7 ± 1.9, climate change = 7.1 ± 1.9, biodiversity = 6.5 ± 2.1, air quality = 7.0 ± 1.9, risks = 5.5 ± 2.6, resources = 6.1 ± 2.2, land use = 5.4 ± 2.6, costs = 3.7 ± 2.2, and reliability = 4.8 ± 2.2.
The “affective evaluation of impacts” in survey #1 showed that the citizens felt the most agitated about the impacts on water quality and climate change (M = 6.7± 2.18 and M = 6.6 ± 1.9) and the calmest about costs and reliability (M = 4.3 ± 2.1 and 4.1 ± 2.3). After receiving information, in survey #5 citizens felt more agitated about most of the impacts, except for land use, accident risks, and costs (n.s.). In the longer term, the increase in evaluation of supply reliability impact was the only statistically significant change, but the evaluation remained rated as the third least important impact (M = 4.1 ± 2.3 versus 5.2 ± 2.1, t = −2.028, p = 0.046 between survey #1 and survey #7). As in the case of technology preferences and affective evaluations of image associations for technologies (Section 4.1), impact importance and affective evaluation of impacts also showed broad consistency, indicating the validity of the results.
4.3. Preferred Swiss Electricity Mix 2035 Using Riskmeter in Geneva
Using the interactive Riskmeter tool [52], the citizens submitted two versions of their preferred Swiss electricity mix in 2035: before and after discussion. No substantial and statistically significant changes were observed between the two versions and thus only the average mix preferences after the discussion are shown in Figure 6. On average, hydropower technologies contributed the most to the preferred mixes of the citizens: 39.8 TWh/year for large hydropower plants and 4.7 TWh/year for small hydropower. However, the participants chose not to exploit the full remaining potential of hydropower above the level of the existing capacity: on average, 54% of the remaining potential of large dams, 69% of large run-of-river plants, and 53% for small hydropower plants were added to the preferred mix. Solar cells were the second major contributor (M = 11.7 TWh) and participants chose to further develop 63% of their remaining potential on average. Electricity savings and efficiency were third (5.8 TWh) and were included on average with 85% of their remaining potential. All other technologies contributed to a smaller extent to the preferred mixes, either due to their limited maximum potential or due to the extent to which the citizens included them in the mix. Half of the maximum remaining potential of wind power and biogas was typically used (2.3 TWh and 0.8 TWh, respectively), whereas waste incineration was included at 66% of its potential (3.0 TWh). Deep geothermal and woody biomass contributed to the preferred mixes with a quarter of their remaining potential, on average (1.1 TWh and 0.4 TWh, respectively). The remaining technologies were kept at very low levels compared to their potential: 6% for nuclear (1.6 TWh), 3% for net import (0.6 TWh), and 2% for large natural gas (0.4 TWh).
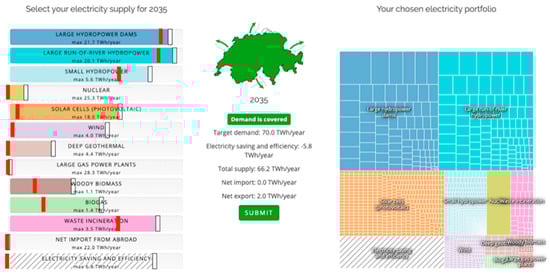
Figure 6.
Average preferred Swiss electricity mixes of the informed citizen panel using the interactive tool Riskmeter [52]. The red lines indicate the minimum amount that the participants could use for each technology (because these technologies are already built in Switzerland and will remain in 2035). The average contribution of each technology to the mix was: large hydro dams = 20.5 ± 1.1 TWh, large run-of-river hydropower = 19.3 ± 1.1 TWh, small hydropower = 4.7 ± 0.9 TWh, nuclear = 1.6 ± 4.1 TWh, solar cells = 11.7 ± 3.5 TWh, wind power = 2.3 ± 1.2 TWh, deep geothermal = 1.1 ± 1.5 TWh, large natural gas = 0.4 ± 1.5 TWh, woody biomass = 0.4 ± 0.3 TWh, biogas = 0.8 ± 0.5 TWh, waste incineration = 3.0 ± 0.5 TWh, net import = 0.6 ± 1.8 TWh, electricity savings and efficiency = 5.8 ± 1.7 TWh.
4.4. Evaluation of Informational Materials in Geneva
Table 1 shows the results of the citizens’ evaluation of our informational materials for informed citizen panels in the city of Geneva (evaluation of tools). The average evaluation ratings in survey #6 were very high for all materials and the workshops overall (M = 61.2 ± 5.9), indicating a broad satisfaction. Technology factsheets had the highest overall satisfaction score (M = 59.1 ± 5.7), being rated as the most useful tool to fill knowledge gaps (M = 6.3 ± 0.8) and to form an opinion (M = 6.2 ± 0.8). In terms of overall satisfaction, technology factsheets were followed by the interactive tool Riskmeter (M = 55.6 ± 7.4), which was in particular considered to be the most interesting (M = 6.6 ± 0.6). Group discussions (M = 53.6 ± 6.1 in overall satisfaction) were rated to be the most entertaining (M = 6.4 ± 0.7).

Table 1.
Average evaluations of informational materials in the city of Geneva.
Table 1 also shows the evolution of citizens’ interest, knowledge, and willingness-to-act in order to assess the impact of our informational materials. Before the workshop, the self-rated general interest in energy topics and the self-rated interest in the last four weeks were low (M = 24.2 ± 6.9 and M = 14.2 ± 4.3, respectively): for instance, the citizens read or talked about electricity topics either never or up to twice a week. After the workshop, self-rated interest in the last four weeks did not increase statistically significantly on the summary scale, but the separate items showed that participants talked more frequently about electricity supply to their family members during the last four weeks (t = −2.296, p = 0.024). In contrast, the self-rated general interest increased statistically significantly (t = −1.546, p = 0.027) on a summary scale, and the citizens reported that they thought more frequently about the topic (t = −2.019, p = 0.047). Self-rated knowledge was slightly above the midpoint before the workshop and increased significantly after the workshop (t = −3.36, p = 0.001 between survey #1 and survey #7). Objective knowledge showed an average of 42% correct answers in survey #1 and 54% in survey #7, increasing significantly after receiving our information materials (t = −3.318, p = 0.001). Participants performed adequately in the factsheet knowledge tasks during the workshop (M = 22.5 ± 0.7, 72% correct on average). To check the usability and the learning effect of interactive tool Riskmeter, participants had to remember which technologies they included in their electricity mix. Citizens had 70% correct answers on average and 91% of the participants reported following a specific strategy rather than choosing technologies by chance when creating their preferred mix. Willingness-to-act environmentally friendly was high in both survey #1 and survey #7 (M = 41.5 ± 5.0 versus M = 42.1 ± 4.6; n.s.).
4.5. Differences between Informed Citizen Panels in Two Swiss Cities of Geneva and Zurich
We performed a comparative analysis between the outputs of informed citizen panels in the French-speaking city of Geneva and the German-speaking city of Zurich (Table 2). All data related to the study of Zurich were provided by Volken et al. [9]. Regarding technology preferences, both panels rated small hydropower, wind power, and solar cells similarly high, and nuclear as well as net electricity import similarly low in all measurements. In both cities, preferences for deep geothermal and biogas dropped after receiving information and in the longer term. Preferences for woody biomass dropped and increased back in the longer term in both cities as well. Large run-of-river hydropower was rated more positively in Geneva than in Zurich for initial, informed, and longer-term preferences (M = 5.7 ± 1.6 versus M = 4.6 ± 1.9, t = 3.136, p = 0.002 in survey #1; M = 6.1 ± 1.0 versus M = 5.1 ± 1.8, t = 2.785, p = 0.007 in survey #3; and M = 6.0 ± 1.2 versus M = 5.3 ± 1.6, t = 2.171, p = 0.033 in survey #7). This was also the case for electricity savings and efficiency in survey #1 and survey #7 (M = 6.6 ± 1.8 versus M = 5.6 ± 2.1, t = 2.591, p = 0.012; M = 6.9 ± 2.3 versus M = 5.8 ± 1.9, t = 2.914, p = 0.004, respectively). Large natural gas plants were rated more negatively in Geneva than in Zurich in survey #1 and survey #3 (M = 2.9 ± 1.6 versus M = 3.8 ± 1.8, t = −2.593, p = 0.012; M = 1.8 ± 1.2 versus M = 2.6 ± 1.7, t = −2.664, p = 0.009, respectively), but there was no significant difference in the longer term. Preferences for large hydropower dams were similar in survey #1 and survey #7, but they were higher in Geneva after reading and discussing the factsheets (M = 5.7 ± 1.4 versus M = 4.9 ± 1.8, t = 2.08, p = 0.04 in survey #3). The citizen panel in Geneva showed higher support for waste incineration at the end of the study (M = 6.0 ± 1.1 versus M = 5.4 ± 1.6, t = 2.06, p = 0.04 in survey #7).
Table 2.
Comparison between informed citizen panels in Geneva and Zurich.
When analysing electricity mix preferences, the average preferred mixes were relatively similar in Geneva and Zurich, with some differences. Nuclear power was included to a smaller extent in Geneva than in Zurich (M = 1.6 ± 4.1 versus M = 5.0 ± 8.0, respectively, t = −2.278, p = 0.026). Moreover, the citizens included significantly more large run-of-river hydropower, waste incineration, and electricity savings in their mixes in Geneva than in Zurich (M = 19.3 ± 1.1 versus M = 18.7 ± 1.0, t = 2.710, p = 0.008; M = 3.0 ± 0.5 versus M = 2.7 ± 0.5, t = 2.556, p = 0.013; M = 5.8 ± 1.7 versus M = 3.7 ± 2.2, t = 4.159, p < 0.001, respectively) For all other technologies, there were no statistically significant differences.
Concerning the evaluation of tools, Geneva’s participants expressed a significantly higher satisfaction for all tools in both surveys and, in particular, their opinion was more influenced by the workshop in contrast to Zurich (M = 6.0 ± 1.5 versus M = 3.6 ± 1.5 respectively, t = −6.768, p < 0.001, survey #7). Citizens in Geneva were also more influenced by the factsheets and the Riskmeter in contrast to citizens in Zurich, but not by the group discussions. However, we found a statistically significantly higher score for the general liking of the discussions in both surveys in Geneva as compared to Zurich (M = 6.0 ± 0.9 versus M = 5.2 ± 1.2, t = −3.616, p = 0.001, survey #6; M = 5.9 ± 1.1 versus M = 5.1 ± 1.7, t = −2.729, p = 0.007, survey #7, respectively). Citizens in Geneva reported higher interest levels for the Riskmeter than in Zurich during the workshop (M = 6.6 ± 0.6 versus M = 4.6 ± 2.3, t = −5.037, p < 0.001) and after the workshop in survey #7 (M = 6.2 ± 1.5 versus M = 5.6 ± 1.8, t = −2.352, p = 0.021). Statistically significant differences were observed for all self-rated interest, self-rated knowledge, and willingness-to-act in survey #1: willingness-to-act was higher in Geneva, while interest and knowledge level were lower. The same pattern was identified in survey #7, but without statistically significant differences for self-rated interest.
5. Discussion
5.1. Informed Preferences and Ratings of Sustainability Impacts
We consider the technology preferences from survey #3 and the post-discussion mix preferences as the most informed, since the citizens had already used all our informational tools. The citizens’ high scores in tests of factsheet knowledge and Riskmeter usability show that they understood and could use the information provided. Informed technology preferences in Geneva showed very high support for electricity savings and efficiency, which were mostly associated with changes in behaviour and seen as a necessary effort (see Table S4 in SM). We also observed high support for all renewable electricity technologies, except for woody biomass and deep geothermal. The participants consistently rated nuclear power, net electricity import, and large gas power plants very low. These results are in line with informed mix preferences: all supported technologies were included on average with at least half of their potential, whereas all three disliked technologies only contributed marginally to the preferred mixes. This suggests that the citizens were in favour of a vast deployment of renewable electricity in Switzerland in the future and were even more ambitious than the Swiss energy experts or energy scenarios studies [53,54]. This is not only true for hydropower, which is well-known and trusted in Switzerland [58], but also for solar cells, wind power, biogas, and waste incineration.
After learning more about sustainability impacts of individual technologies, the analysis of the elicited imagery revealed that citizens in Geneva seemed concerned about local air pollution caused by woody biomass as well as seismic risks and costs associated with deep geothermal plants. Currently, Geneva has an ambitious geothermal program, GEothermie 2020, that aims to increase the use of shallow- and medium-depth geothermal energy for heating and cooling. This probably contributed to deep geothermal energy initially being seen positively and then the citizen preferences dropped substantially after the citizens realized that deep geothermal energy in our study refers to riskier and much costlier Enhanced Geothermal Systems for electricity generation. It was also specified in the factsheets that the on-going projects in Geneva are not deep geothermal projects in order to avoid misunderstanding. Waste and risks were important concerns associated with nuclear energy. After our information, the citizens disliked large natural gas plants even more than nuclear, suggesting that integrating fossil fuels into the Swiss electricity supply is not an option from the view of informed citizens. In addition to air pollution and climate change impacts associated with natural gas, the citizens also referred to fuel import and dependence on other countries. This is in line with the low ranking of net electricity import too, suggesting that the citizens were in favour of domestic electricity generation in Switzerland. Similar findings about citizen preferences for domestic, renewable, and low-carbon electricity supply were reported in other Swiss studies too [9,16,34,59,60,61]. After all, informed citizens’ preferences were well in line with the Energy Strategy 2050 in Switzerland, which prioritizes efficiency measures, renewable energy, and nuclear phase out in Switzerland [62]. Moreover, these results suggest that the citizens would not support natural gas power plants or net electricity import to compensate the phase out of nuclear, as is considered in some Swiss energy scenarios [63].
All sustainability impacts of electricity technologies were rated as important in Geneva. The highest concern was expressed about climate change, followed by air and water pollution. The impacts rated as the least important were land use and costs. High rating for climate change is in line with high informed preferences for low-carbon technologies and electricity mixes, except for nuclear, where accident risks and waste seemed to be more important to our citizens than climate change impacts. High concern for pollution may partly explain why people disliked technologies that they associated with high pollution, such as woody biomass. Although rated as the least important, costs were mentioned for most technologies. In contrast, land use seemed to be specifically associated with wind power, which is not surprising given its often debated impact on landscape. High concern for climate change has been found in previous studies [9,18,36,46] and it is probably linked to an increasing awareness of the consequences of global warming. This trend might grow even stronger considering the recent social movements demanding action to protect the climate [64]. In this context, costs and land use could be considered secondary priorities as compared to global issues, like climate change, water and air pollution, and the citizens could be willing to pay higher costs for clean energy. Other authors also found that environmental sustainability was ranked higher than economic competitiveness [9,65]. Informed affective evaluations showed similar patterns as informed impact importance ratings.
5.2. Longer-Term Stability of Preferences and Impact of Informational Tools
We present two types of findings to show that our informational materials had an impact on citizen preferences and affect. First, image associations, to some degree, explain changes during the process. At the beginning in survey #1, citizens more often mentioned positive associated words for technologies and initial preferences for most technologies were higher than informed preferences. After receiving information (survey #5), more negative words were used, reflecting the decreased preferences. Deep geothermal plants showed a pertinent evolution with terms like “earth” or “renewable” and high uninformed preferences at the beginning, followed by words like “danger”, “earthquake”, or “cost” and lower informed preferences during the workshop. As the factsheets contained technical information, people also mentioned technical terms more frequently. This suggests that information has influence across image associations on citizen preferences, as also argued in past studies [66,67]. For example, our factsheets on waste incineration described mostly low or non-existing impacts, resulting in increased preferences during the workshop. The affective evaluations of the image associations were in line with these preferences. In the longer term and during the workshop, the relationship was less pronounced than at the beginning. Even if associations like “waste” were rated negatively, the preferences for waste incineration still increased, illustrating that information could potentially have greater influence on preferences than on affect.
Second, citizen preferences and affective evaluations of well-known technologies like solar cells, hydro or nuclear power did not change during the whole study despite information, whereas there were changes for rather unfamiliar technologies, like deep geothermal or woody biomass. This indicates that information has a stronger effect before people form strong preferences and feelings about the technologies and that already determined preferences and affect about a technology are harder to change. Previous studies support this argument [9,29,41,67,68]. Over the longer term, the technology preferences that changed with information did not return to the initial preferences (except woody biomass), indicating a lasting influence of information. This result contradicts some of the argument by Volken et al. [9], who found that citizens of the informed panel in Zurich tended to revert back to their initial opinions in the longer run. A reason for the different findings in Geneva and Zurich could be the more intense engagement or higher satisfaction with the informational materials that were observed in Geneva.
Our citizens in Geneva found the factsheets helpful to form an opinion, the interactive web tool interesting, and the group discussions entertaining. After receiving information, participants performed more successfully in the knowledge tests and their interest increased. Our findings also strengthen arguments in existing literature that communicating information in a more interactive way, such as by means of Riskmeter, helps to build informed preferences [9,32,33,69]. However, more conventional informational tools like written factsheets also prove to be very effective for information [70,71]. Recent studies concluded that citizens could be able to extract information better from short written texts than from an interactive tool [72] or from long text [29]. In our case, group discussions and interactive tools required particular involvement, likely leading to stable deeper value-based perspectives [12]. On the other hand, group discussions demand participants to justify their views and can hence reinforce existing preferences, as could have been the case for hydro or wind power [8,10]. This assumption is coherent with the findings from the evaluation of group discussion that showed a smaller influence on the opinion.
5.3. Contextual Differences between Two Swiss Cities
The main finding from the informed citizen panels in the French-speaking city of Geneva and the German-speaking city of Zurich is that the preferences for technologies and electricity mix were relatively similar, especially for solar cells, wind power, deep geothermal, woody biomass, biogas, and net import. This indicates that there is some generalizability in the outputs of informed citizen panels, despite a small sample of participants. Genevan citizens had higher preferences for large run-of-river hydropower, waste incineration, and electricity savings and efficiency. Nuclear power and large natural gas plants were also less preferred than in Zurich. To some extent, the differences can be attributed to some contextual factors, such as better knowledge of large run-of-river hydropower in Geneva, as there is such a plant in the city centre. Geneva’s local energy utility also has a relatively known program on energy efficiency. In a broader way, cultural and political differences between the French- and the German-speaking parts of Switzerland also exist. Respondents living in the French-speaking part of Switzerland were shown to be more inclined to energy efficiency [73,74]. However, our citizens in both studies were mostly from urban areas and this could partly explain why their preferences were similar.
The second finding is the difference in longer-term stability of preferences. Citizens in Zurich had less stable enduring preferences as compared to Geneva. Disparities were also observed regarding the evaluation of the information tools. The citizens in Geneva gave a higher evaluation for all the tools and were more satisfied with the group discussions. Additionally, their willingness-to-act environmentally friendly was higher, whereas the general interest in electricity supply topics was lower to start with. This could also explain why the Genevan citizens were more responsive to our information. Another possible reason for the differences in longer-term stability of preferences could be the difference in demographics or the two-year gap between the panels in Geneva and Zurich, or the dominant political views. For example, a link could be made to the more liberal-left political view in Geneva in general [75], which gives more added value to scientific information than a conservative view [76]. Parallels can also be drawn between the technology preferences that were elicited by us and the results of the popular referendum in Switzerland in 2017 about the Energy Strategy 2050, in which the canton of Geneva had a yes-vote of 72.5% and the canton of Zurich–at 59% [77].
5.4. Limitations and Future Research
Several limitations of this study should be addressed in future research. First, it was impossible to present the participants with all relevant information on electricity generation technologies and mixes. The choices in our informational materials thus resulted in a framing effect: the way in which information was selected and presented had an influence on how the informed preferences were formed [9,32]. Future research could therefore investigate the robustness and sensitivity of the preferences under different framing conditions. Second, our panels in both Geneva and Zurich were not representative of the Swiss population, which means that our conclusions should not be overgeneralized even if the results in Geneva and Zurich have many commonalities. Future research could explore the preferences of the underrepresented segments of the population in our panels, like citizens from rural and remote Swiss regions or the Swiss youth. It would be also valuable to repeat such panels in other countries in Europe and worldwide in order to understand and compare the formation and evolution of preferences and affect. Our study could provide an example of how to do such panels and can offer methodological insights, such as the usability of different informational materials. Third, affective evaluations of images associated with technologies were summed up in a single value for each technology and this does not reflect contrasted associations (e.g., someone has both positive and negative thoughts about the same technology). Future research should investigate these contrasted and sometimes contradictory images and their relationship to the formation of preferences. Fourth, the longer-term evolution of the preferences and affect was only investigated four weeks after the workshops. Future work could focus on the evolution of preferences over longer periods of time. Finally, this study only elicited general preferences of the citizens for electricity generation technologies without asking the more difficult question about where these technologies should be sited. Future research could therefore create a methodology for informed citizen panels on spatial siting of new technologies, adopting information from spatial energy analysis [78,79].
6. Conclusions and Policy Implications
This research study provides insight on informed citizen preferences for the Swiss electricity mix 2035. The informed preferences in Geneva indicated high support for a domestic, renewable electricity mix in Switzerland, combined with electricity savings and efficiency. Negative citizen views of nuclear energy, large natural gas plants, and net electricity import were consistently expressed. Informed citizen preferences appeared to be in line with the main objectives of the Swiss Energy Strategy 2050, but some additional points should be considered to ensure public support. Notably, our panel did not favour an increase in net electricity import or the construction of natural gas power plants to compensate the phase out of nuclear plants. The citizens were particularly preoccupied by climate change and pollution issues rather than costs. This highlights the importance for policy makers to consider the acceptance of electricity technologies in relation to other alternatives and general concerns of the population.
Comparison between the two Swiss cities showed many similarities, pointing to some generalizability of our findings. In both cities, we observed high overall support among the Swiss citizens for domestic renewable electricity mix in 2035. We found that multi-dimensional information on electricity technologies and their sustainability impacts influenced citizen preferences for the technologies that they were not yet familiar with. Uninformed or informed preferences and affect for known technologies were similar, indicating that strong and already formed opinions were hard to change by means of information. This awareness that information can still change some preferences underlines the importance of wider energy outreach as part of the energy transition. However, some contextual differences between both cities were observed too, suggesting that policy makers should consider regional specificities in citizen preferences and affect.
Supplementary Materials
The following are available online at https://www.mdpi.com/1996-1073/12/22/4231/s1, Table S1: Question on image associations and affective evaluations of image associations, Table S2: Question on affective evaluations of the impacts of electricity generation, Figure S1: Table summarizing the severity of the impacts for each technology using a 5-color scale, Table S3: Correlations between preferences for individual electricity generation technologies and affective evaluations of image associations, Table S4: Average mix preferences of the informed citizen panel before and after discussion during the workshops.
Author Contributions
Conceptualization, methodology, validation, writing—review and editing: all authors; investigation, formal analysis, data curation, visualization, writing—original draft: A.D. and S.H.; software: G.X.; supervision, project administration: E.T., G.X.; funding acquisition: A.D., S.H. and E.T.
Funding
This research was funded by the Swiss National Science Foundation Ambizione Energy grant number 160563, Vitale Innovation Fond of the Services Industriels de Genève (SIG), and the Renewable Energy Systems Group at the University of Geneva.
Acknowledgments
The authors thank all the participants of the informed citizen panels as well as Sandra P. Volken for her earlier contribution to the concept of informed citizen panels.
Conflicts of Interest
The authors declare no conflict of interest. The funders had no role in the design of the study; in the collection, analyses, or interpretation of data; in the writing of the manuscript, or in the decision to publish the results.
References
- Boykoff, M.; Katzung, J.; Nacu-Schmidt, A. Media and Climate Change Observatory Monthly Summary: The Earth is facing a climate change deadline-Issue 26, February 2019. Media Clim. Chang. Obs. Mon. Summ. 2019, 27. Available online: https://scholar.colorado.edu/mecco_summaries/27/ (accessed on 5 November 2019).
- Swiss Federal Office of Energy (SFOE). Statistique Suisse de L’électricité 2018; SFOE: Bern, Switzerland, 2018. [Google Scholar]
- Van Rijnsoever, F.J.; Farla, J.C.M. Identifying and explaining public preferences for the attributes of energy technologies. Renew. Sustain. Energy Rev. 2014, 31, 71–82. [Google Scholar] [CrossRef]
- Boudet, H.S. Public perceptions of and responses to new energy technologies. Nat. Energy 2019, 4, 446–455. [Google Scholar] [CrossRef]
- Vatter, A. Direkte Demokratie in der Schweiz. Entwicklungen, Debatten und Wirkungen. In Bestandsaufnahmen un Wirkungen im Internationalen Vergleich, 3rd ed.; Freitag, M., Wagschal, U., Eds.; LIT Verlag: Berlin, Germany, 2007. [Google Scholar]
- Stadelmann-Steffen, I. Citizens as veto players: Climate change policy and the constraints of direct democracy. Environ. Politics 2011, 20, 485–507. [Google Scholar] [CrossRef]
- Mayer, L.A.; de Bruin, W.B.; Morgan, M.G. Informed public choices for low-carbon electricity portfolios using a computer decision tool. Environ. Sci. Technol. 2014, 48, 3640–3648. [Google Scholar] [CrossRef] [PubMed]
- Scheer, D.; Konrad, W.; Scheel, O. Public evaluation of electricity technologies and the future low-carbon portfolios in Germany and the USA. Energy Sustain. Soc. 2013, 3, 1–13. [Google Scholar] [CrossRef]
- Volken, S.; Xexakis, G.; Trutnevyte, E. Perspectives of Informed Citizen Panel on Low-Carbon Electricity Portfolios in Switzerland and Longer-Term Evaluation of Informational Materials. Environ. Sci. Technol. 2018, 52, 11478–11489. [Google Scholar] [CrossRef] [PubMed]
- ter Mors, E.; Terwel, B.W.; Daamen, D.D.L.; Reiner, D.M.; Schumann, D.; Anghel, S.; Boulouta, I.; Cismaru, D.M.; Constantin, C.; de Jager, C.C.H.; et al. A comparison of techniques used to collect informed public opinions about CCS: Opinion quality after focus group discussions versus information-choice questionnaires. Int. J. Greenh. Gas Control 2013, 18, 256–263. [Google Scholar] [CrossRef]
- Wong-Parodi, G.; Krishnamurti, T.; Davis, A.; Schwartz, D.; Fischhoff, B. A decision science approach for integrating social science in climate and energy solutions. Nat. Clim. Chang. 2016, 6, 563–569. [Google Scholar] [CrossRef]
- Pidgeon, N.; Demski, C.; Butler, C.; Parkhill, K.; Spence, A. Creating a national citizen engagement process for energy policy. Proc. Natl. Acad. Sci. USA 2014, 111 (Suppl. 4), 13606–13613. [Google Scholar] [CrossRef] [PubMed]
- Wong-Parodi, G.; Fischhoff, B.; Strauss, B. A method to evaluate the usability of interactive climate change impact decision aids. Clim. Chang. 2014, 126, 485–493. [Google Scholar] [CrossRef]
- Jobin, M.; Siegrist, M. We choose what we like – Affect as a driver of electricity portfolio choice. Energy Policy 2018, 122, 736–747. [Google Scholar] [CrossRef]
- Truelove, H.B. Energy source perceptions and policy support: Image associations, emotional evaluations, and cognitive beliefs. Energy Policy 2012, 45, 478–489. [Google Scholar] [CrossRef]
- Visschers, V.H.M.; Siegrist, M. Find the differences and the similarities: Relating perceived benefits, perceived costs and protected values to acceptance of five energy technologies. J. Environ. Psychol. 2014, 40, 117–130. [Google Scholar] [CrossRef]
- Zierhofer, W. Switzerland. In Bordering Space; Houtoum, H.V., Kramsch, O., Zierfhoner, W., Eds.; Ashgate Publishing Limited: Hants, UK, 2005. [Google Scholar]
- Corner, A.; Venables, D.; Spence, A.; Poortinga, W.; Demski, C.; Pidgeon, N. Nuclear power, climate change and energy security: Exploring British public attitudes. Energy Policy 2011, 39, 4823–4833. [Google Scholar] [CrossRef]
- Grove-White, R.; Kearnes, M.; MacNaghten, P.; Wynne, B. Nuclear Futures: Assessing Public Attitudes to New Nuclear Power. Political Q. 2006, 77, 238–246. [Google Scholar] [CrossRef]
- Pidgeon, N.F.; Lorenzoni, I.; Poortinga, W. Climate change or nuclear power—No thanks! A quantitative study of public perceptions and risk framing in Britain. Glob. Environ. Chang. 2008, 18, 69–85. [Google Scholar] [CrossRef]
- Devine-Wright, P. Beyond NIMBYism: Towards an integrated framework for understanding public perceptions of wind energy. Wind Energy 2005, 8, 125–139. [Google Scholar] [CrossRef]
- Musall, F.D.; Kuik, O. Local acceptance of renewable energy—A case study from southeast Germany. Energy Policy 2011, 39, 3252–3260. [Google Scholar] [CrossRef]
- Walter, G. Determining the local acceptance of wind energy projects in Switzerland: The importance of general attitudes and project characteristics. Energy Res. Soc. Sci. 2014, 4, 78–88. [Google Scholar] [CrossRef]
- Zhai, P.; Williams, E.D. Analyzing consumer acceptance of photovoltaics (PV) using fuzzy logic model. Renew. Energy 2012, 41, 350–357. [Google Scholar] [CrossRef]
- de Best-Waldhober, M.; Daamen, D.; Ramirez Ramirez, A.; Faaij, A.; Hendriks, C.; de Visser, E. Informed public opinions on CCS in comparison to other mitigation options. Energy Procedia 2009, 1, 4795–4802. [Google Scholar] [CrossRef]
- Greenberg, M. Energy sources, public policy, and public preferences: Analysis of US national and site-specific data. Energy Policy 2009, 37, 3242–3249. [Google Scholar] [CrossRef]
- Lee, R.P. Stability of energy imageries and affect following shocks to the global energy system: The case of Fukushima. J. Risk Res. 2015, 18, 965–988. [Google Scholar] [CrossRef]
- Van Rijnsoever, F.J.; van Mossel, A.; Broecks, K.P.F. Public acceptance of energy technologies: The effects of labeling, time, and heterogeneity in a discrete choice experiment. Renew. Sustain. Energy Rev. 2015, 45, 817–829. [Google Scholar] [CrossRef]
- Yang, Y.; Wong-Parodi, G.; Fischhoff, B. How stable are preferences among emerging electricity generation technologies. Environ. Res. Commun. 2019, 1, 071002. [Google Scholar] [CrossRef]
- Zoellner, J.; Schweizer-Ries, P.; Wemheuer, C. Public acceptance of renewable energies: Results from case studies in Germany. Energy Policy 2008, 36, 4136–4141. [Google Scholar] [CrossRef]
- Bessette, D.L.; Arvai, J.; Campbell-Arvai, V. Decision Support Framework for Developing Regional Energy Strategies. Environ. Sci. Technol. 2014, 48, 1401–1408. [Google Scholar] [CrossRef] [PubMed]
- Demski, C.; Spence, A.; Pidgeon, N. Effects of exemplar scenarios on public preferences for energy futures using the my2050 scenario-building tool. Nat. Energy 2017, 2, 17027. [Google Scholar] [CrossRef]
- Fleishman, L.A.; De Bruin, W.B.; Morgan, M.G. Informed public preferences for electricity portfolios with CCS and other low-carbon technologies. Risk Anal. 2010, 30, 1399–1410. [Google Scholar] [CrossRef] [PubMed]
- Trutnevyte, E.; Stauffacher, M.; Scholz, R.W. Supporting energy initiatives in small communities by linking visions with energy scenarios and multi-criteria assessment. Energy Policy 2011, 39, 7884–7895. [Google Scholar] [CrossRef]
- Madlener, R.; Kowalski, K.; Stagl, S. New ways for the integrated appraisal of national energy scenarios: The case of renewable energy use in Austria. Energy Policy 2007, 35, 6060–6074. [Google Scholar] [CrossRef]
- Bessette, D.L.; Arvai, J.L. Engaging attribute tradeoffs in clean energy portfolio development. Energy Policy 2018, 115, 221–229. [Google Scholar] [CrossRef]
- Leiserowitz, A.; Smith, N. Affective imagery, risk perceptions, and climate change communication. In Oxford Research Encyclopedia of Climate Science; Oxford University Press: Oxford, UK, 2017. [Google Scholar] [CrossRef]
- Jobin, M.; Visschers, V.H.M.; van Vliet, O.P.R.; Árvai, J.; Siegrist, M. Affect or information? Examining drivers of public preferences of future energy portfolios in Switzerland. Energy Res. Soc. Sci. 2019, 52, 20–29. [Google Scholar] [CrossRef]
- Visschers, V.H.M.; Keller, C.; Siegrist, M. Climate change benefits and energy supply benefits as determinants of acceptance of nuclear power stations: Investigating an explanatory model. Energy Policy 2011, 39, 3621–3629. [Google Scholar] [CrossRef]
- Maehr, A.M.; Watts, G.R.; Hanratty, J.; Talmi, D. Emotional response to images of wind turbines: A psychophysiological study of their visual impact on the landscape. Landsc. Urban Plan. 2015, 142, 71–79. [Google Scholar] [CrossRef]
- Bruine de Bruin, W.; Wong-Parodi, G. The role of initial affective impressions in responses to educational communications: The case of carbon capture and sequestration (CCS). J. Exp. Psychol. Appl. 2014, 20, 126–135. [Google Scholar] [CrossRef] [PubMed]
- de Best-Waldhober, M.; Daamen, D.; Faaij, A. Informed and uninformed public opinions on CO2 capture and storage technologies in the Netherlands. Int. J. Greenh. Gas Control 2009, 3, 322–332. [Google Scholar] [CrossRef]
- Morgan, G.M.; Fischhoff, B.; Bostrom, A.; Atman, C.J. Risk Communication: A Mental Models Approach; Cambridge University Press: Cambridge, UK, 2002. [Google Scholar]
- Scheer, D.; Konrad, W.; Wassermann, S. The good, the bad, and the ambivalent: A qualitative study of public perceptions towards energy technologies and portfolios in Germany. Energy Policy 2017, 100, 89–100. [Google Scholar] [CrossRef]
- Bessette, D.L.; Campbell-Arvai, V.; Arvai, J. Expanding the Reach of Participatory Risk Management: Testing an Online Decision-Aiding Framework for Informing Internally Consistent Choices. Risk Anal. 2016, 36, 992–1005. [Google Scholar] [CrossRef] [PubMed]
- Stagl, S. Multicriteria evaluation and public participation: The case of UK energy policy. Land Use Policy 2006, 23, 53–62. [Google Scholar] [CrossRef]
- Slovic, P. The Construction of Preference. Am. Psychol. 1995, 50, 364–371. [Google Scholar] [CrossRef]
- Landwehr, J.R.; McGill, A.L.; Hermmann, A. It’s Got the Look: The Effect of Friendly and Aggressive “Facial ” Expressions on Product Liking and Sales. J. Mark. 2011, 75, 132–146. [Google Scholar] [CrossRef]
- Bradley, M.M.; Lang, P.J. Measuring emotion: The self-assessment manikin and the semantic differential. J. Behav. Ther. Exp. Psychiatry 1994, 25, 49–59. [Google Scholar] [CrossRef]
- Trutnevyte, E.; Volken, S.; Xexakis, G. Factsheets of Electricity Generation Technologies in Switzerland: Technical Characteristics, Resource Potentials, Environmental, Health and Economic Impacts; Zenodo: Genève, Switzerland, 2019. [Google Scholar] [CrossRef]
- Volken, S.; Wong-Parodi, G.; Trutnevyte, E. Public awareness and perception of environmental, health and safety risks to electricity generation: An explorative interview study in Switzerland. J. Risk Res. 2019, 22, 432–447. [Google Scholar] [CrossRef]
- Xexakis, G.; Volken, S.; Trutnevyte, E. Riskmeter-Portfolio Builder. Available online: https://portfolio-builder.riskmeter.ch/basic/ (accessed on 5 May 2019).
- Berntsen, P.B.; Trutnevyte, E. Ensuring diversity of national energy scenarios: Bottom-up energy system model with Modeling to Generate Alternatives. Energy 2017, 126, 886–898. [Google Scholar] [CrossRef]
- Xexakis, G.; Ralph, H.; Volken, S.; Trutnevyte, E. Models on the wrong track: Model-based electricity supply scenarios in Switzerland are not aligned with the perspectives of experts and the public. Poster presented at the Annual Conference of the Swiss Competence Center for Energy Research—Supply of Electricity (SCCER-SoE), Lausanne, Switzerland, 6 September 2019. [Google Scholar]
- Swiss Federal Office for Statistics (SFSO). Données Relatives à l’âge de la Population Résidante Permanente Selon la Catégorie de Nationalité et le Sexe; SFSO: Bern, Switzerland, 2018. [Google Scholar]
- Swiss Federal Office for Statistics (SFSO). Population Résidante Permanente de 15 Ans et Plus, Selon la Formation Achevée la Plus Élevée; SFSO: Bern, Switzerland, 2017. [Google Scholar]
- Peters, E.; Slovic, P. The Role of Affect and Worldviews as Orienting Dispositions in the Perception and Acceptance of Nuclear Power. J. Appl. Soc. Psychol. 1996, 26, 1427–1453. [Google Scholar] [CrossRef]
- Loloum, T. La vie touristique des grands barrages hydroélectriques. Mondes du Tourisme 2016, 12, 1–33. [Google Scholar] [CrossRef]
- Rudolf, M.; Seidl, R.; Moser, C.; Krütli, P.; Stauffacher, M. Public preference of electricity options before and after Fukushima. J. Integr. Environ. Sci. 2014, 11, 1–15. [Google Scholar] [CrossRef]
- Gamma, K.; Stauch, A.; Wüstenhagen, R. 7th Consumer Barometer of Renewable Energy; Good Energies Chair for Management of Renewable Energies, University of St. Gallen: St. Gallen, Switzerland, 2017. [Google Scholar]
- Cousse, J.; Wüstenhagen, R. 8th Consumer Barometer of Renewable Energy; Good Energies Chair for Management of Renewable Energies, University of St. Gallen: St. Gallen, Switzerland, 2018. [Google Scholar]
- Swiss Federal Office of Energy (SFOE). La Stratégie Énergétique 2050 Après L’entrée en Vigueur de la Nouvelle Loi Sur L’énergie; SFOE: Bern, Switzerland, 2018. [Google Scholar]
- Swiss Federal Office of Energy (SFOE). Perspectives Énergétiques 2050: Résumé; SFOE: Bern, Switzerland, 2013. [Google Scholar]
- Fisher, D.R. The broader importance of #FridaysForFuture. Nat. Clim. Chang. 2019, 9, 430–431. [Google Scholar]
- Bertsch, V.; Hall, M.; Weinhardt, C.; Fichtner, W. Public acceptance and preferences related to renewable energy and grid expansion policy: Empirical insights for Germany. Energy 2016, 114, 465–477. [Google Scholar] [CrossRef]
- Bidwell, D. The Effects of Information on Public Attitudes Toward Renewable Energy. Environ. Behav. 2016, 48, 743–768. [Google Scholar] [CrossRef]
- Stadelmann-Steffen, I. Bad news is bad news: Information effects and citizens’ socio-political acceptance of new technologies of electricity transmission. Land Use Policy 2019, 81, 531–545. [Google Scholar] [CrossRef]
- Wilson, R.S.; Arvai, J.L. When Less is More: How Affect Influences Preferences When Comparing Low and High-risk Options. J. Risk Res. 2006, 9, 165–178. [Google Scholar] [CrossRef]
- Tsay, M.; Brady, M. A case study of cooperative learning and communication pedagogy: Does working in teams make a difference? J. Scholarsh. Teach. Learn. 2010, 10, 78–89. [Google Scholar]
- Cook, T.D.; Flay, B.R. The Persistence of Experimentally Induced Attitude Change. Adv. Exp. Soc. Psychol. 1978, 11, 1–57. [Google Scholar]
- Verplanken, B. Persuasive Communication of Risk Information: A Test of Cue Versus Message Processing Effects in a Field Experiment. Personal. Soc. Psychol. 1991, 17, 188–193. [Google Scholar] [CrossRef]
- Xexakis, G.; Trutnevyte, E. Are interactive web-tools for environmental scenario visualization worth the effort? An experimental study on the Swiss electricity supply scenarios 2035. Environ. Model. Softw. 2019, 119, 124–134. [Google Scholar] [CrossRef]
- Burger, P.; Schubert, I.; Dijk, J.V.; Puntiroli, M.; Volland, B.; Weber, S.; Farsi, M. Consommation D’énergie des Ménages en Suisse: Principaux Résultats de L’enquête Sur la Consommation Énergétique des Ménages; SuisseEnergie: Ittigen, Switzerland, 2018. [Google Scholar]
- Ebers, A.; Wüstenhagen, R. 6th Consumer Barometer of Renewable Energy; Good Energies Chair for Management of Renewable Energies, University of St. Gallen: St. Gallen, Switzerland, 2016. [Google Scholar]
- Linder, W.; Vatter, A. Institutions and outcomes of Swiss federalism: The role of the cantons in Swiss politics. West Eur. Politics 2001, 24, 95–122. [Google Scholar] [CrossRef]
- Tullett, A.M.; Hart, W.P.; Feinberg, M.; Fetterman, Z.J.; Gottlieb, S. Is ideology the enemy of inquiry? Examining the link between political orientation and lack of interest in novel data. J. Res. Personal. 2016, 63, 123–132. [Google Scholar] [CrossRef]
- Swiss Federal Chancellery. Votation n°612, Résultats Dans les Cantons; Swiss Federal Chancellery: Bern, Switzerland, 2017. [Google Scholar]
- Sasse, J.-P.; Trutnevyte, E. Distributional trade-offs between regionally equitable and cost-efficient allocation of renewable electricity generation. Appl. Energy 2019, 254, 113724. [Google Scholar] [CrossRef]
- Mohr, L.; Burg, V.; Thees, O.; Trutnevyte, E. Spatial hot spots and clusters of bioenergy combined with socio-economic analysis in Switzerland. Renew. Energy 2019, 140, 840–851. [Google Scholar] [CrossRef]
© 2019 by the authors. Licensee MDPI, Basel, Switzerland. This article is an open access article distributed under the terms and conditions of the Creative Commons Attribution (CC BY) license (http://creativecommons.org/licenses/by/4.0/).