Article

Cooling Benefits of an Extensive Green Roof and Sensitivity Analysis of Its Parameters in Subtropical Areas

1
School of Chemistry and Chemical Engineering, State Key Lab of Subtropical Building Science, South China University of Technology, Guangzhou 510641, China
2
School of Architecture, State Key Lab of Subtropical Building Science, South China University of Technology, Guangzhou 510641, China
*
Authors to whom correspondence should be addressed.
Energies 2019, 12(22), 4278; https://doi.org/10.3390/en12224278
Submission received: 18 September 2019 / Revised: 5 November 2019 / Accepted: 7 November 2019 / Published: 9 November 2019
(This article belongs to the Special Issue Building Renewable Energy and Thermal Energy Storage System 2019)

Abstract

:
The present study aims to further demonstrate the cooling benefits of an extensive green roof (EGR) and fill the gap existing in the literature in terms of a sensitivity analysis of an EGR, especially in subtropical areas. First, onsite measurements were performed. The results indicated that the peak air temperatures in the chamber with the EGR were 4.0 °C and 1.9 °C lower, respectively, compared to those in the chamber with a bare roof on sunny and rainy days. Moreover, the EGR decreased the daily electricity consumption from air conditioning by up to 16.7% on sunny days and 6.7% on cloudy days. Second, the measured values were employed to validate the green roof module (GRM) in EnergyPlus. The results demonstrated that the GRM yielded accurate results in quantifying the cooling benefits of the EGR. Finally, we selected 16 factors of the EGR, each with four levels, to perform the sensitivity analysis. Range and variance analyses revealed that the factors that most significantly impacted the EGR performance were the R-value of roof construction, substrate (soil) thickness, the thermal conductivity of dry substrate, the leaf area index, leaf emissivity, and the solar absorptance of the substrate. These factors contributed 90.8% to the performance index.

1. Introduction

According to reports published by the United Nations Environmental Program, more than 40% of global energy consumption and around 30% of global greenhouse gas emissions are related to buildings [1]. During the hot season, people use air conditioning to offset rising indoor temperatures, thereby increasing electricity consumption. Air conditioning can substantially contribute to peak electricity demand, depending on local climatic conditions, a building’s parameters, and the air conditioning operating mode. Developing high-performance cooling technologies is one of the approaches to achieve energy efficiency in buildings.
Building roofs constitute approximately 20% of urban surfaces [2,3,4]. Among a building’s envelopes, the roof receives more solar radiation than that received by a vertical wall, which causes excessive heat flow into the room. In hot areas, nearly half of a building’s cooling load originates from the roof [5,6]. Thus, an increasing number of researchers are working toward the development of energy-efficient roof systems, such as reflective [7], radiative [8,9], evaporative [10], and green roofs [11].
The cooling benefits of a green roof come from the shading and transpiration of a vegetation layer and the evaporation and insulation of a substrate layer, mimicking the earth’s natural methods of cooling. A green roof acts as a thermal buffer and can reduce a room’s heat gain in summer and heat loss in winter by approximately 70–90% and 10–30%, respectively [12]. Moreover, the vegetation and substrate layers of a green roof decrease and delay the roof’s peak temperature, thereby keeping indoor conditions comfortable.
One of the most common green roof systems is the extensive green roof (EGR), which has the following characteristics: shallow substrates (<20 cm thickness), relatively lightweight components, and low cost [13]. The EGR is a very suitable technology for subtropical areas, and many studies have examined the use of the EGR in hot and humid climates, which are amenable to the growth of the necessary vegetation.
Most previous studies have focused on the thermal performance of the green roof and its impact factors. Lin et al. explored the impacts of climatic conditions on the thermal effectiveness of the ERG. Their research indicated that daytime cooling effectiveness was relatively high in tropical island climates in summer, while nighttime insulation effectiveness was more pronounced in subtropical climates. They also found that rainfall led to a decrease in the temperature of the reference roof; therefore, the cooling effectiveness of the extensive green roof was not as high as that observed on sunny days [14]. Huang et al. compared the effects of green roof vegetation on reductions in rooftop temperature and heat amplitude under hydroponic and soil culture conditions in a subtropical city (Taichung, Taiwan). They found that hydroponic roofs with varying water depths, with or without plants, could significantly decrease rooftop temperatures due to the evaporation and insulation of water [15]. Moreover, soil-based green roofs have more cooling potential because of the reflective, photosynthetic, shielding, shading, and evapotranspiration effects from their vegetation layers and the insulation, absorption, and evaporation effects from their growth medium layers [16]. Additional work has suggested that further research could explore other types of growth mediums to enhance the cooling effect of green roofs, given that most of the temperature reduction was attributed to the growth medium layer rather than the vegetation layer [16]. Jim performed a field experiment on the air conditioning electricity consumption of residential buildings in humid/subtropical Hong Kong, which has different roof schemes, including bare roofs, thermal insulation roofs, and two kinds of EGRs. The study considered sunny, cloudy, and rainy weather. The results indicated that the cooling effects from green roofs on sunny days were more significant than those on cloudy and rainy days. Additionally, it was found that the thermal performance of the EGR was directly influenced by vegetation, substrate composition, thickness, and water content. [17,18,19]. Jiang and Tang conducted field measurements to investigate the thermal performances of bare and green roofs. They found that green roofs provided an advantage in the daytime, but a disadvantage in the nighttime during summer because they acted as an insulation layer [20]. Yang et al. carried out a comparative study on the thermal performance of two new green roofs compared to three existing roofs in Guangzhou, China: a subtropical climatic region. In addition to the significant cooling effect produced by the green roofs, they further found that increasing the planting soil thickness from 100 mm to 200 mm seemed not to be able to significantly improve the thermal and indoor environment performance of the rooms [21]. Feng et al. analyzed the energy balance of the EGR and presented a simple but practical energy balance model. They carried out a field experiment in Guangzhou, China, to validate the accuracy of this model [22]. Peng and Jim studied the effects of a community-scale green roof on air temperature and human thermal comfort in five typical residential neighborhoods of subtropical Hong Kong. The results demonstrated that green roof cooling effects were not restricted to rooftops, but extended to the ground to improve the neighborhood microclimate [23]. Costanzo et al. performed a comparison between cool roofs and green roofs in three different climatic conditions in Italy. They found that the sensible heat fluxes released by the roof to the outdoor environment could be cut down by up to 75% by using green roofs. Moreover, from the aspect of the annual primary energy demands of buildings, green roofs are more preferable than cool roofs because of the shading and insulating characteristics of the former [24].
Despite the abovementioned cooling benefits, several obstacles have been encountered when using green roofs in the real world. A common obstacle against the selection of green roofs is the relatively higher initial investment when compared to a conventional roof system. A long-term cost-effectiveness analysis of green roofs should be performed to assist building designers and owners in making a reasonable decision. To this end, an accurate and reliable prediction of the energy saving rates of green roofs is needed, which can be achieved by using building energy simulation software. For example, the green roof module (GRM) in EnergyPlus, which is a new-generation building energy simulation program developed by the US Department of Energy [25], considers the impacts of thermal behaviors from vegetation and substrates on building energy consumption. In the GRM, a generic green roof system is described by a total of 16 parameters. Of these, five parameters are used to describe vegetation layer characteristics, including the height of plants (HP), the leaf area index (LAI), leaf reflectivity (LR), leaf emissivity (LE), and minimum stomatal resistance (MSR). Another 11 parameters are related to the substrate layer, namely substrate roughness (SR), substrate thickness (ST), the thermal conductivity of dry substrate (TCDS), the density of dry substrate (DDS), the specific heat of dry substrate (SHDS), the thermal absorptance of the substrate (TAS), the solar absorptance of the substrate (SAS), the visible absorptance of the substrate (VAS), the saturation volumetric moisture content of the substrate (SVMCS), the residual volumetric moisture content of the substrate (RVMCS), and the initial volumetric moisture content of the substrate (IVMCS). Accurately obtaining all 16 parameters is challenging because of the inhomogeneity of the vegetation and substrate layers. Therefore, a sensitivity analysis should be performed to determine which green roof parameters are the most important and have the most significant impact on the performance index. To this end, Zeng et al. explored the optimal properties for green roofs in different zones in China and then compared properties between different cities. They selected three parameters, namely ST, HP, and LAI, from the 16 input parameters in the EnergyPlus GRM as the main properties affecting the energy savings of green roofs [26]. Rakotondramiarana et al. developed a hygrothermal green roof model and integrated it into a thermal model of buildings to dynamically assess the impact of green roofs on the energy performance and thermal comfort of buildings in Madagascar. From the simulation results, they found that plants with greater values of the LAI and the vegetation coverage ratio significantly improved the energy performance of the buildings during summer days, and a moderate additional substrate thickness could help decrease the heating demand [27]. However, previous research may not fully reflect the impacts of green roof design factors on building energy consumption because limited green roof design factors were considered in the research.
In summary, although the effects of green roofs on the thermal and energy performances of buildings have been reported in many studies, research concerning green roofs in subtropical areas is still inadequate. To better understand the cooling benefits from the EGR, the accuracy of the GRM in EnergyPlus, and the significance order of the design parameters of a green roof in subtropical areas, this study makes new contributions, including the following: (1) we further investigated the cooling benefits of the EGR in sunny and rainy weather conditions through onsite measurements; (2) we verified the GRM in EnergyPlus by calculating the mean bias errors and cumulative variation of the root mean square errors between the simulated and measured values; and (3) we performed a sensitivity analysis to determine which green roof parameters had the most significant impact on the performance index.
This paper is organized as follows: Section 2 describes the methodology employed; Section 3 presents our analysis of the cooling benefits of the EGR and examines the accuracy of the GRM in EnergyPlus, including the significance levels of green roof factors on building cooling load; and finally, Section 4 summarizes the main conclusions.

2. Methods

2.1. Onsite Measurements

Onsite roof measurements were conducted in subtropical Guangzhou, which is located in southern China (latitude: 23.1° N, longitude: 113.3° E). The climate type of Guangzhou is Cfa (C: temperate, f: humid, a: hot summer) according to the Köppen climate classification [28].
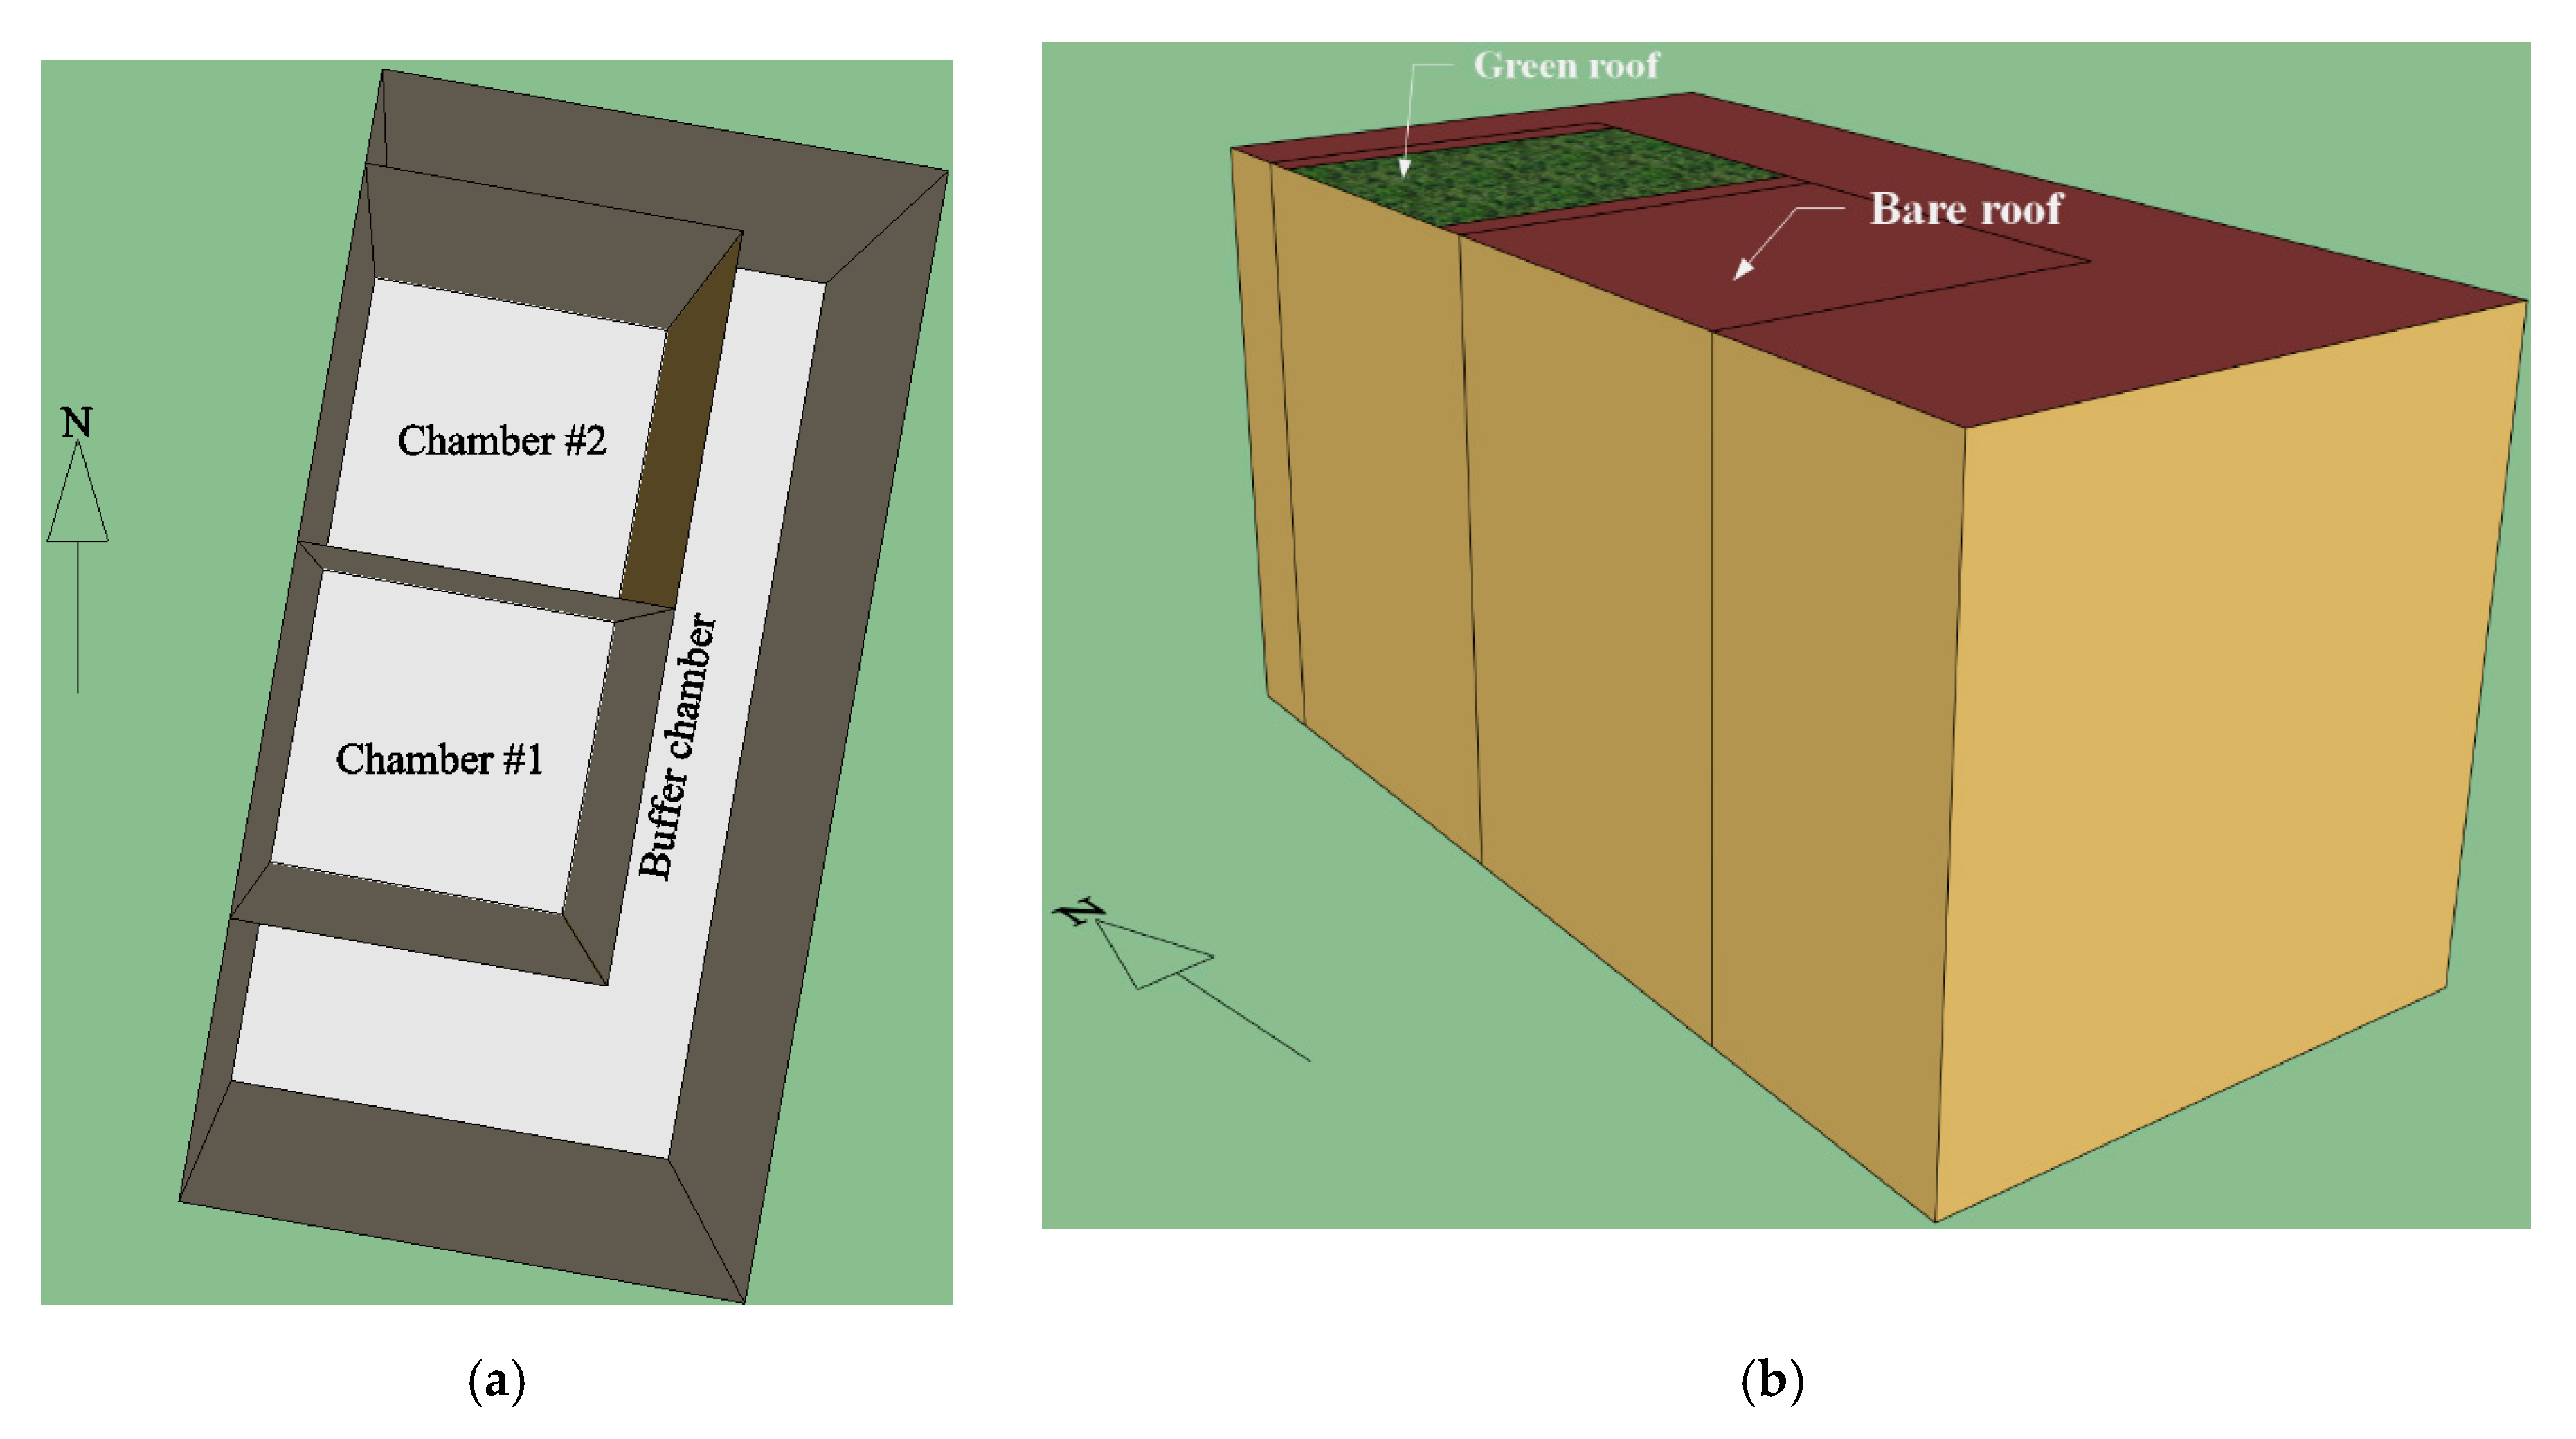
The experimental system was installed on the rooftop of the Building Energy Efficiency Research Center at the South China University of Technology and consisted of one buffer chamber and two test chambers (Figure 1). The buffer chamber was used to house a computer and data acquisition devices. During the measurement process, air conditioning was operated in the buffer chamber with a constant air temperature of approximately 24 °C. As for the two test chambers, only the roof and the west wall of each were exposed to the outdoor environment. The other walls were connected to the buffer chamber to eliminate the effect of orientation on the chambers’ heat gain. The walls and the floors were composed of white-color-coated steel sandwich panels with 100-mm-thick expanded polystyrene (EPS) board cores. The roofs were composed of blue (external surface) and white (internal surface) coated steel sandwich panels with 25-mm-thick extruded polystyrene (XPS) board cores. Twelve 0.5 m × 0.5 m × 0.1 m (l × w × h) modular green roof trays were placed on the roof of the second test chamber. The vegetation used in this experiment was Sedum lineare, a plant in the Crassulaceae family, which was approximately 0.1 m high. The substrate was approximately 0.1 m thick, as shown in Figure 1.
We used two HOBO temperature sensors (Onset Computer Corporation, USA) to record the external surface temperatures of the green roof substrate. The average temperature value was used to characterize the temperature variation of the substrate. Six T-type thermocouples were placed on the external and internal surfaces of the experimental roof (i.e., three on the external surface and three on the internal surface). In addition, three heat flow sensors were placed on the internal roof surfaces. As a control, six T-type thermocouples were placed on the external and internal surfaces of a bare roof, with three heat flow sensors placed on the internal surface of the bare roof.
Two air temperature test points were placed at the center of both test chambers. The local meteorological data, including the air temperature, relative humidity, wind speed and direction, rainfall, and solar radiation, were recorded by a weather station near the measurement site. Table 1 lists the measurement sensors used. All sensors were calibrated before use.
A data logger was used to collect and transfer the temperature and heat flux data to a personal computer via an RS-232 interface. The time interval of data collection was set to 5 min. Hourly data were used to analyze the thermal performance of the green roof and examine the differences between the measurements and the simulations.

2.2. GRM in EnergyPlus

EnergyPlus was employed for the green roof simulation analysis. The GRM integrated in EnergyPlus is based on a study by Sailor [11], which utilized a slightly modified version of the fast all-season soil strength methodology developed by Frankenstein and Koenig [29,30]. The required simulation input parameters include the substrate characteristics and the vegetation features. Sailor evaluated the model confidence using comparisons of means and observations [11]. For a detailed description of the model, the reader is referred to the EnergyPlus technical documentation [25].
In order to evaluate the accuracy of the GRM in Guangzhou’s subtropical climate, we compared the measured results from the experimental system (as shown in Figure 1) to the simulated values. As shown in Figure 2, the building model for the simulation was identical to that of the experimental system.
Table 2 summarizes the building envelope parameters for the simulation. The green roof parameters for the GRM are listed in Table 3. The parameters of the vegetation layer are from the literature [22]. The parameters of the substrate are from the laboratory measurements. The EnergyPlus energy simulation settings are presented in Table 4.
The meteorological data recorded by the weather station were utilized as the weather files in the EnergyPlus simulations. The following equations were used to calculate the horizontal infrared radiation intensity:
R i = s e · σ · T a 4 ,
s e = [ 0.787 + 0.764 · ln ( T d 273 ) ] · ( 1 + 0.0224 S c 0.0035 S c 2 + 0.00028 S c 3 ) ,
where Ri is the horizontal infrared radiation intensity in W/m2; se is the sky emissivity; σ is the Stefan–Boltzmann constant; Ta is the dry-bulb temperature in K; Td is the dewpoint temperature in K; and Sc is the opaque sky cover.
Two error indices, namely the mean bias error (MBE) and the cumulative variation of the root mean square error (CV(RMSE)), were used to evaluate the accuracy of the GRM. The MBE indicates how well the simulation results fit the measured data. Positive values indicate that the simulation results underpredict the measured data. In contrast, negative values indicate that the simulation results overpredict the measured data. The overall uncertainty in the simulation prediction is indicated by the CV(RMSE). This value is always positive, and a low value indicates that the simulation results are close to the measured data. The equations for the MBE and the CV(RMSE) are as follows:
MBE = i = 1 N ( M i S i ) i = 1 N M i ,
CV ( RMSE ) = i = 1 N ( M i S i ) 2 N ( i = 1 N M i N ) ,
where Mi is the measured data at instance i; Si is the simulated data at instance i; and N is a count of the number of values used in the calculation.

2.3. Sensitivity Analysis

We conducted the sensitivity analysis by selecting 16 green roof factors, each with four levels (Table 5). In Table 5, except for the R-value of roof construction (RRC), the other 15 parameters are input parameters for the green roof module in EnergyPlus. Although the IVMCS is also one of the parameters for the GRM, it was not considered in the sensitivity analysis because it cannot be larger than the SVMCS during the parameter input process. The RRC took the place of the IVMCS because the thermophysical properties of the roof construction under the substrate layer also influence the cooling effect of the vegetation and substrate layers. Over 4 × 10⁹ combinations needed to be simulated if the full factorial simulation were to be utilized in the present study. The full simulation would have required a large amount of computing resources and a large number of simulations; hence, a fractional factorial simulation, which selects representative combinations from the full factorial simulation, was used. A suitable sampling method is important for the fractional factorial simulation, and three sampling methods are commonly utilized to generate representative combinations: the orthogonal array (OA), Latin hypercube (LH), and Monte Carlo (MC) methods [31]. We employed herein OA sampling methods to generate representative combinations.
An OA denoted as L64 (421) was used as the scheme for conducting the simulations. This OA contained 21 columns, 16 of which denoted green roof design parameters, and five other blank columns were used to estimate the influence of random factors on the target index. Random factors are those that cannot be technically controlled, and they are usually considered to be statistically independent variables. Each row of the OA represented a run with a specific set of simulation levels, and 64 simulations were run.
In the present study, we used the experimental system on the rooftop of the Building Energy Efficiency Research Center at the South China University of Technology to validate the accuracy of the Green Roof Model in EnergyPlus under Guangzhou’s climate conditions. However, it should be noted that the experimental system is not a typical civil building because the chambers in the system do not have external windows and the space in the chambers is too small to be utilized in the real world. In order to make the results more applicable, we selected a real building model instead of the experimental system for the orthogonal simulations and the subsequent sensitivity analysis of the green roof.
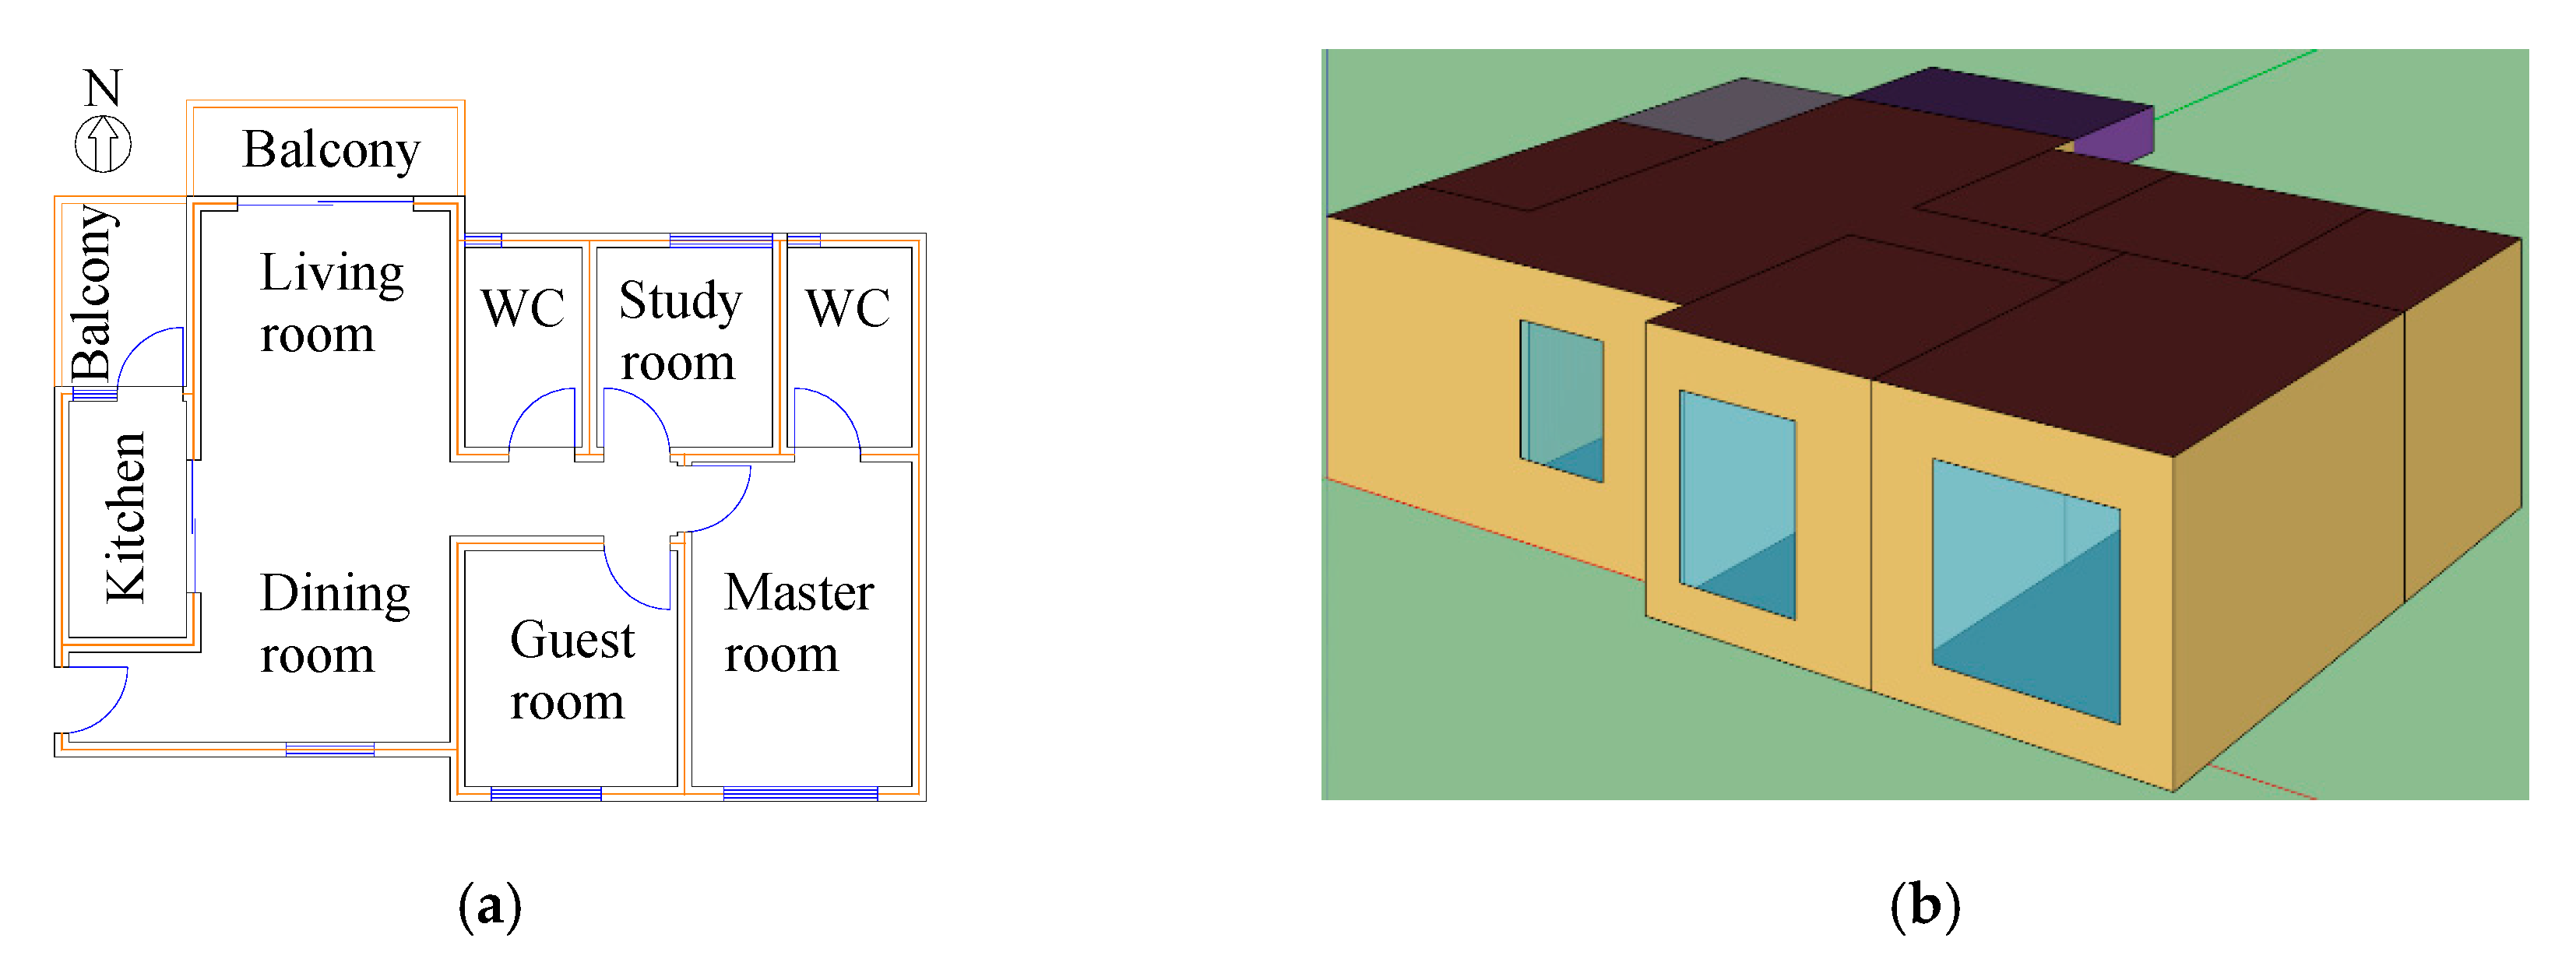
The real building model was a typical top-floor dwelling in Guangzhou. The dwelling had two bedrooms, a study room, a living room, a dining room, a kitchen, and two balconies. Its floor area was approximately 86 m2, and its main facade had a southern orientation, as shown in Figure 3.
Table 6 summarizes the building envelope specifications. All zones were air-conditioned, with the exception of the kitchen and bathrooms. Table 7 lists the thermophysical parameters of the building envelope; the setup of the heating, ventilation, and air conditioning (HVAC) system; and the internal gains of people, equipment, and lights consistent with the “Design Standard for Energy Efficiency of Residential Buildings in Hot Summer and Warm Winter Zones” [32].
We used the ratio of the total cooling load of the building zones under a green roof to that under the same roof construction without vegetation and substrate layers as the target index, as shown in Equation (5). As this equation indicates, the higher the values of the target index are, the higher the cooling load saving rates resulting from a green roof are:
t i n d e x = C l o a d , b r C l o a d , g r ,  
where tindex is the target index; Cload,br is the total cooling load of the building zones under the bare roof in kW; and Cload,gr is the total cooling load of the building zones under the green roof in kW.
Range analysis was utilized to investigate the most sensitive factor affecting the target index. The range analysis determined the relative significance of a given factor P (DP) by using Equations (6) and (7). A factor with a larger DP is one with greater importance [33].
D P = max ( V ¯ P , L ) min ( V ¯ P , L ) ,
V ¯ P , L = V P , L / k P ,
where DP is the range value of a given factor P; VP,L is the average targeting value of each simulation factor at the same level L; VP,L is the sum of the target indices of all levels in each factor P; and kP is the total number of levels for the corresponding factor P.
The range analysis intuitively showed the order of influential factors on the target index. However, a range analysis cannot distinguish whether the fluctuation of the target index results from the varying levels or from the random factors. In addition, it cannot provide a standard to assess whether the impact of a factor is noticeable. To resolve this issue, it is necessary to carry out a variance analysis to obtain the magnitudes of the influence of the factor on the target index.
In an analysis of variance (ANOVA), the total impacts were divided into two parts: impacts from the simulation conditions and impacts generated from the random factors. The ratio of the sum of squares of each factor’s mean deviation to that of the random factors was indicated by the significance value (F) for each factor [33]. Therefore, we used an F-test to analyze the simulation data and employed an F-value to assess the impact degree of a factor, which could be calculated by the following formulas:
Z = L = 1 4 V P , L ,
D R P = 1 16 L = 1 4 V P , L 2 Z 2 64 ,
D R T = L = 1 4 V P , L 2 Z 2 64 ,
where DRP is the difference in the simulation results caused by the change in every level of factor P; DRP reflects the influence of factor P on the simulation results; and L is the level number.
The variance VP of factor P is presented as follows:
V P = D R P d f P ,
where dfP is the degree of freedom of factor P, which is defined as the number of comparisons between impact factor P. For example, a three-level impact factor counts for two degree of freedom. In the present study, since each factor had four levels, dfP is equal to 3. Correspondingly, dfT is the total degrees of freedom of the simulation, which is equal to the simulation times minus 1 or 63 (in this case).
VP should be compared to VB (the blank columns in the OA L64 (421) were designed to record the random factors VE) before calculating the FP value to improve the F-test reliability. The F-value of each factor P could be expressed as
F P = V P V B ,
where FP is the F-value of factor P; VP is the variance of factor P; and VB is the variance of the blank column.
For a specific orthogonal simulation (certain f1, f2), (f1,f2) is a constant defined as the critical value of FP for different inspection levels, which can be found from the F distribution table. The influence of factor P on the experimental results is significant when FP is larger than (f1,f2). Conversely, the factor’s effect on the results is insignificant if FP(f1,f2).
Moreover, σP can be used to quantitatively assess the degree of a factor’s effect, expressed as
σ P = D R P D R T × 100 % ,
where σP is the percentage contribution of the factors to the sum of the squared deviation.
The value of σP could be used to indicate the importance of a factor. A factor with a larger σP has a more significant impact on the results. Moreover, σP is also used to verify the validity of the orthogonal simulation and results. If the percentage contribution of the random factors (σE) is less than 15%, the results of the OA simulation can be considered to be reliable, and no important factor is omitted. In contrast, if σE is higher than 50%, some important factors are omitted or the random factors are excessive. The results in the latter case should be discarded. If σE is between 15% and 50%, the results of the OA simulation are probably less reliable. The whole simulation must then be repeated, or the OA needs be redesigned, considering other factors [33].

3. Results and Discussion

3.1. Cooling Benefits of a Green Roof

The onsite measurements were divided into two stages. The measurements during the first stage occurred from 1 to 5 September, during which time the air conditioning in both test chambers was not operated. The second stage was performed from 8 to 13 September, during which time the air conditioning in both test chambers was turned on and set to 24 °C.
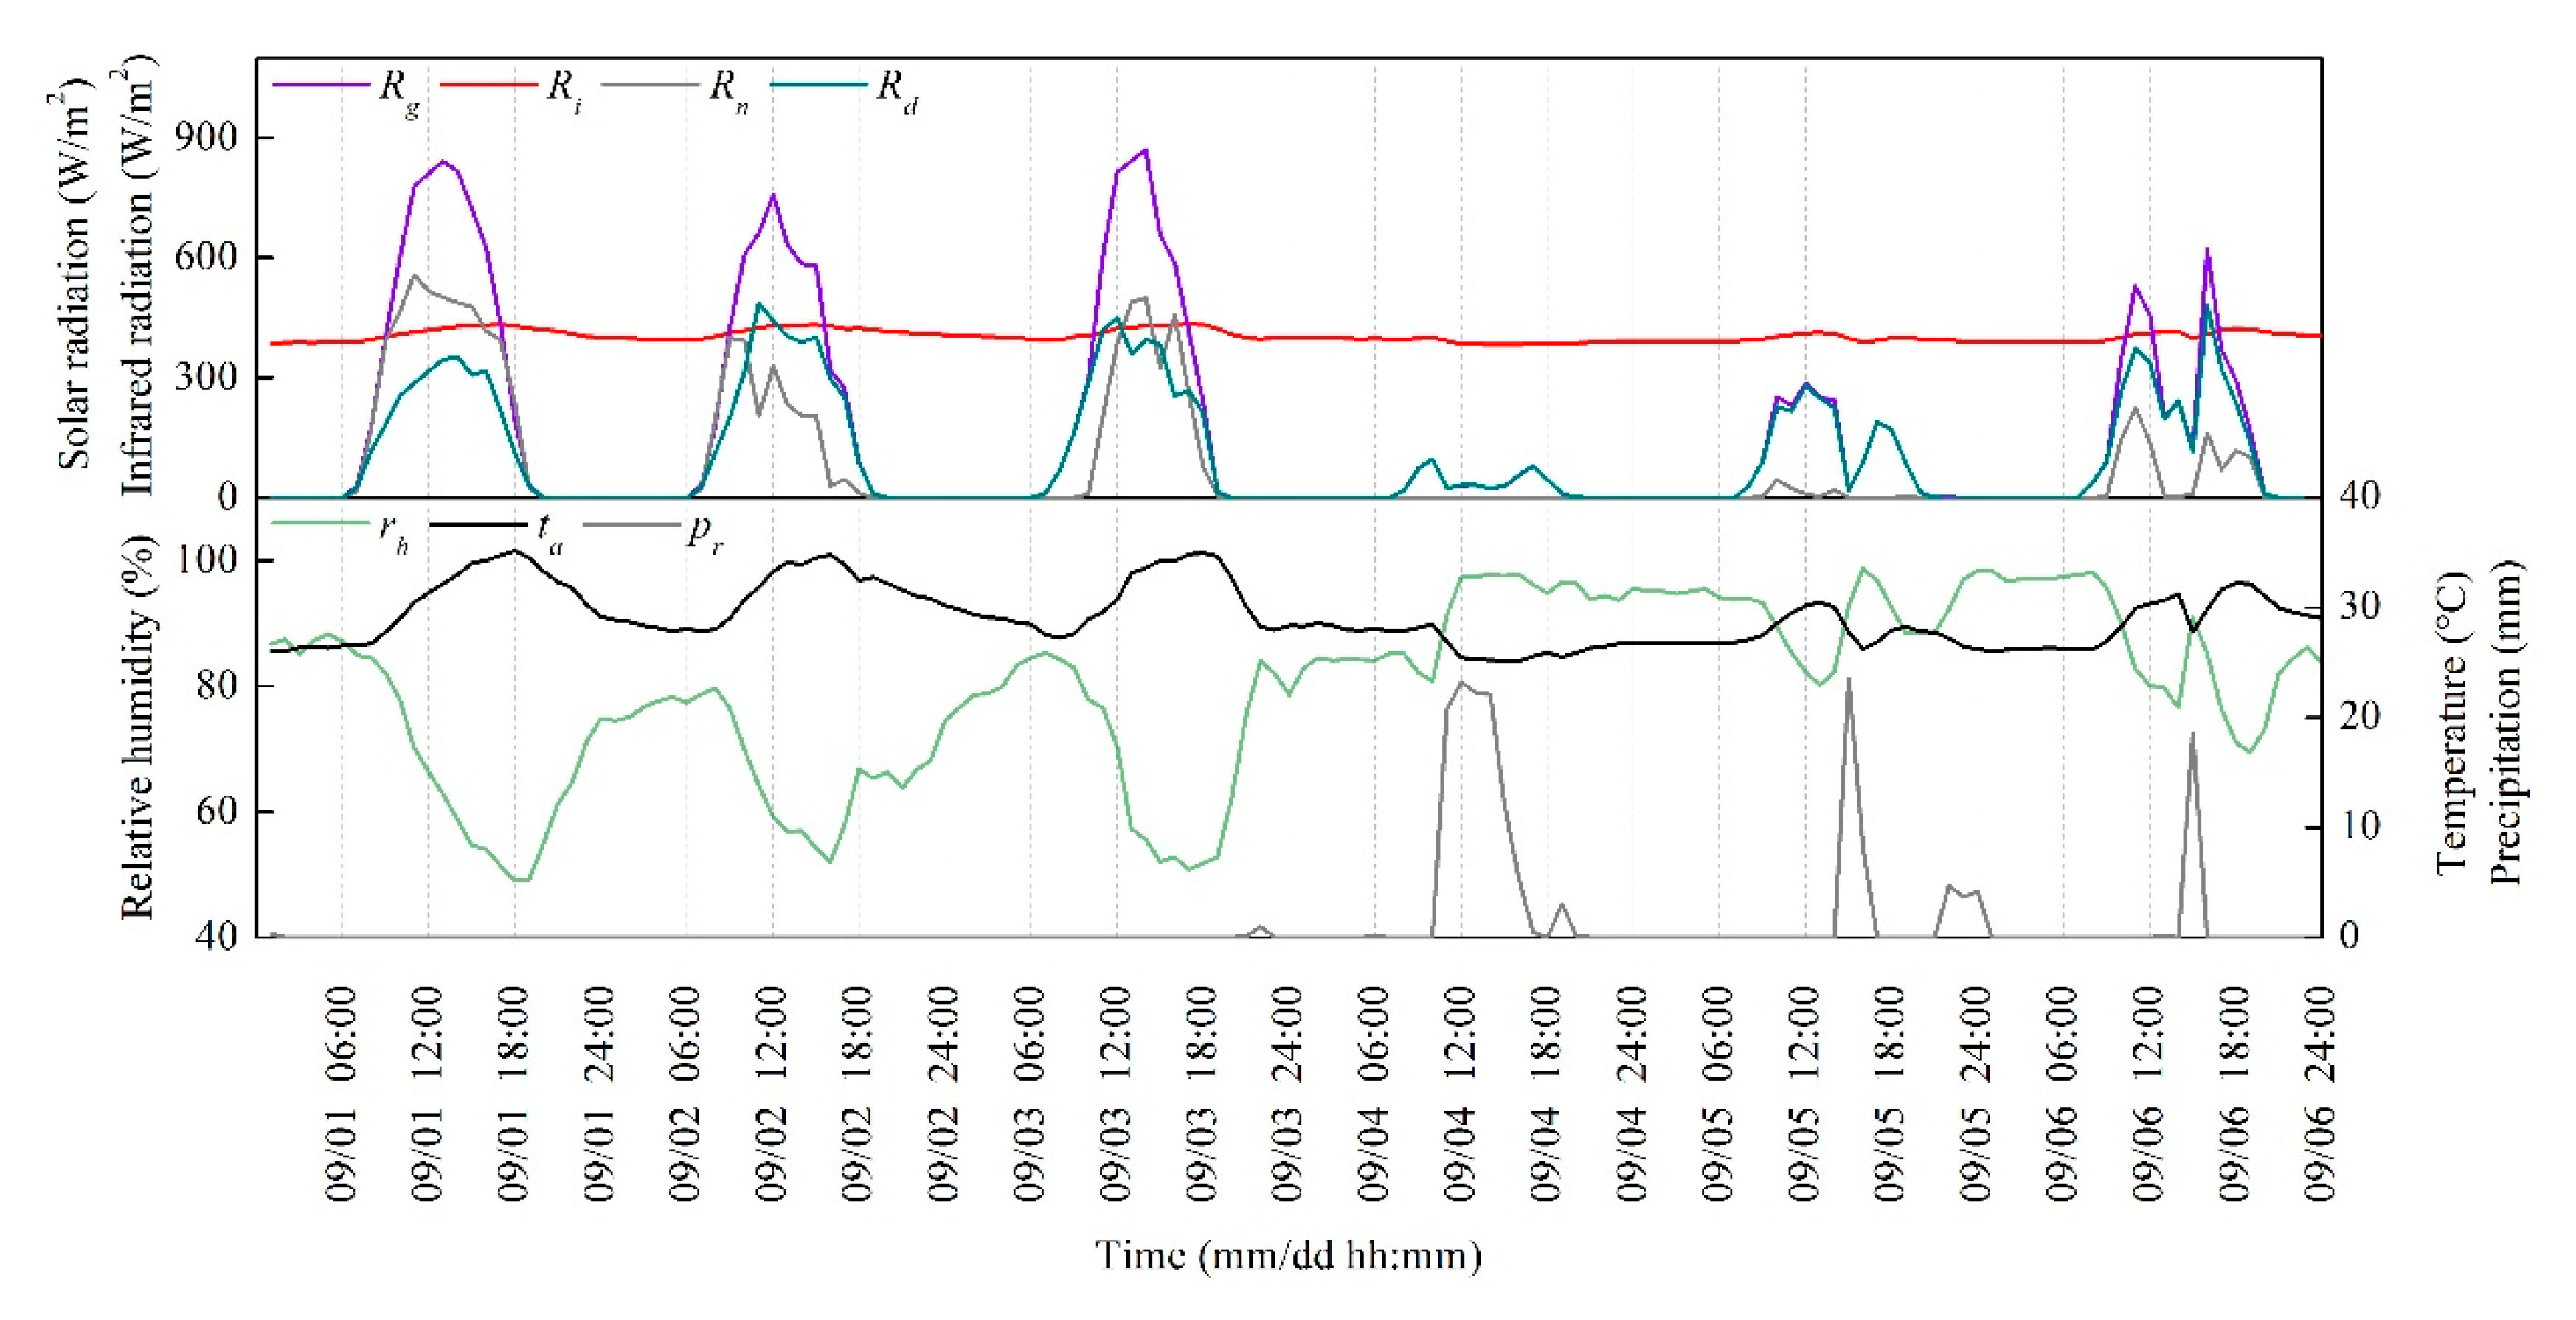
The weather conditions during each measurement stage were subdivided into sunny and rainy days, with the latter defined as days in which any amount of precipitation occurred. The first three days in the first measurement stage were sunny with intense solar radiation, as shown in Figure 4. Taking the results from 1 September as an example, the global solar radiation on the horizontal surface increased from 29.5 W/m2 at 07:00 to its peak value of 842 W/m2 at 13:00. The infrared radiation on the horizontal surface, outdoor air temperature, relative humidity, and wind velocity fluctuated between 386 and 434 W/m2, 26.0 and 35.2 °C, 49.0% and 88.3%, and 0.8 and 3.2 m/s, respectively.
The latter two days of the first measurement stage were rainy days with a total precipitation of 154.9 mm. Solar radiation decreased before the rain, approximately equaling zero during the rain events. The peak global solar radiation on the horizontal surface decreased to 286 W/m2, and the ratio of diffuse radiation to global solar radiation approached 100%, demonstrating that normal direct solar radiation was approximately zero. The infrared radiation on the horizontal surface, outdoor air temperature, relative humidity, and wind velocity fluctuated between 382 and 413 W/m2, 25.2 and 30.5 °C, 80.2% and 98.7%, and 1.1 and 3.6 m/s, respectively.
As shown in Figure 5, for the second measurement stage, the weather for the first three days was cloudy with occasional rain: 21.9 mm total precipitation was also recorded. The peak value of the global solar radiation on the horizontal surface was 690 W/m2. The infrared radiation on the horizontal surface, outdoor air temperature, relative humidity, and wind velocity fluctuated between 386 and 418 W/m2, 25.7 and 31.8 °C, 67.5% and 97.3%, and 0.8 and 3.1 m/s, respectively.
The latter three days of the second measurement stage were cloudless with high solar radiation. The peak values of global and normal direct solar radiation were observed on 12 September and were 888 W/m2 and 711 W/m2, respectively. The infrared radiation on the horizontal surface, outdoor air temperature, relative humidity, and wind velocity fluctuated between 393 and 435 W/m2, 26.8 and 35.1 °C, 52.8% and 96.5%, and 0.8 and 3.1 m/s, respectively.
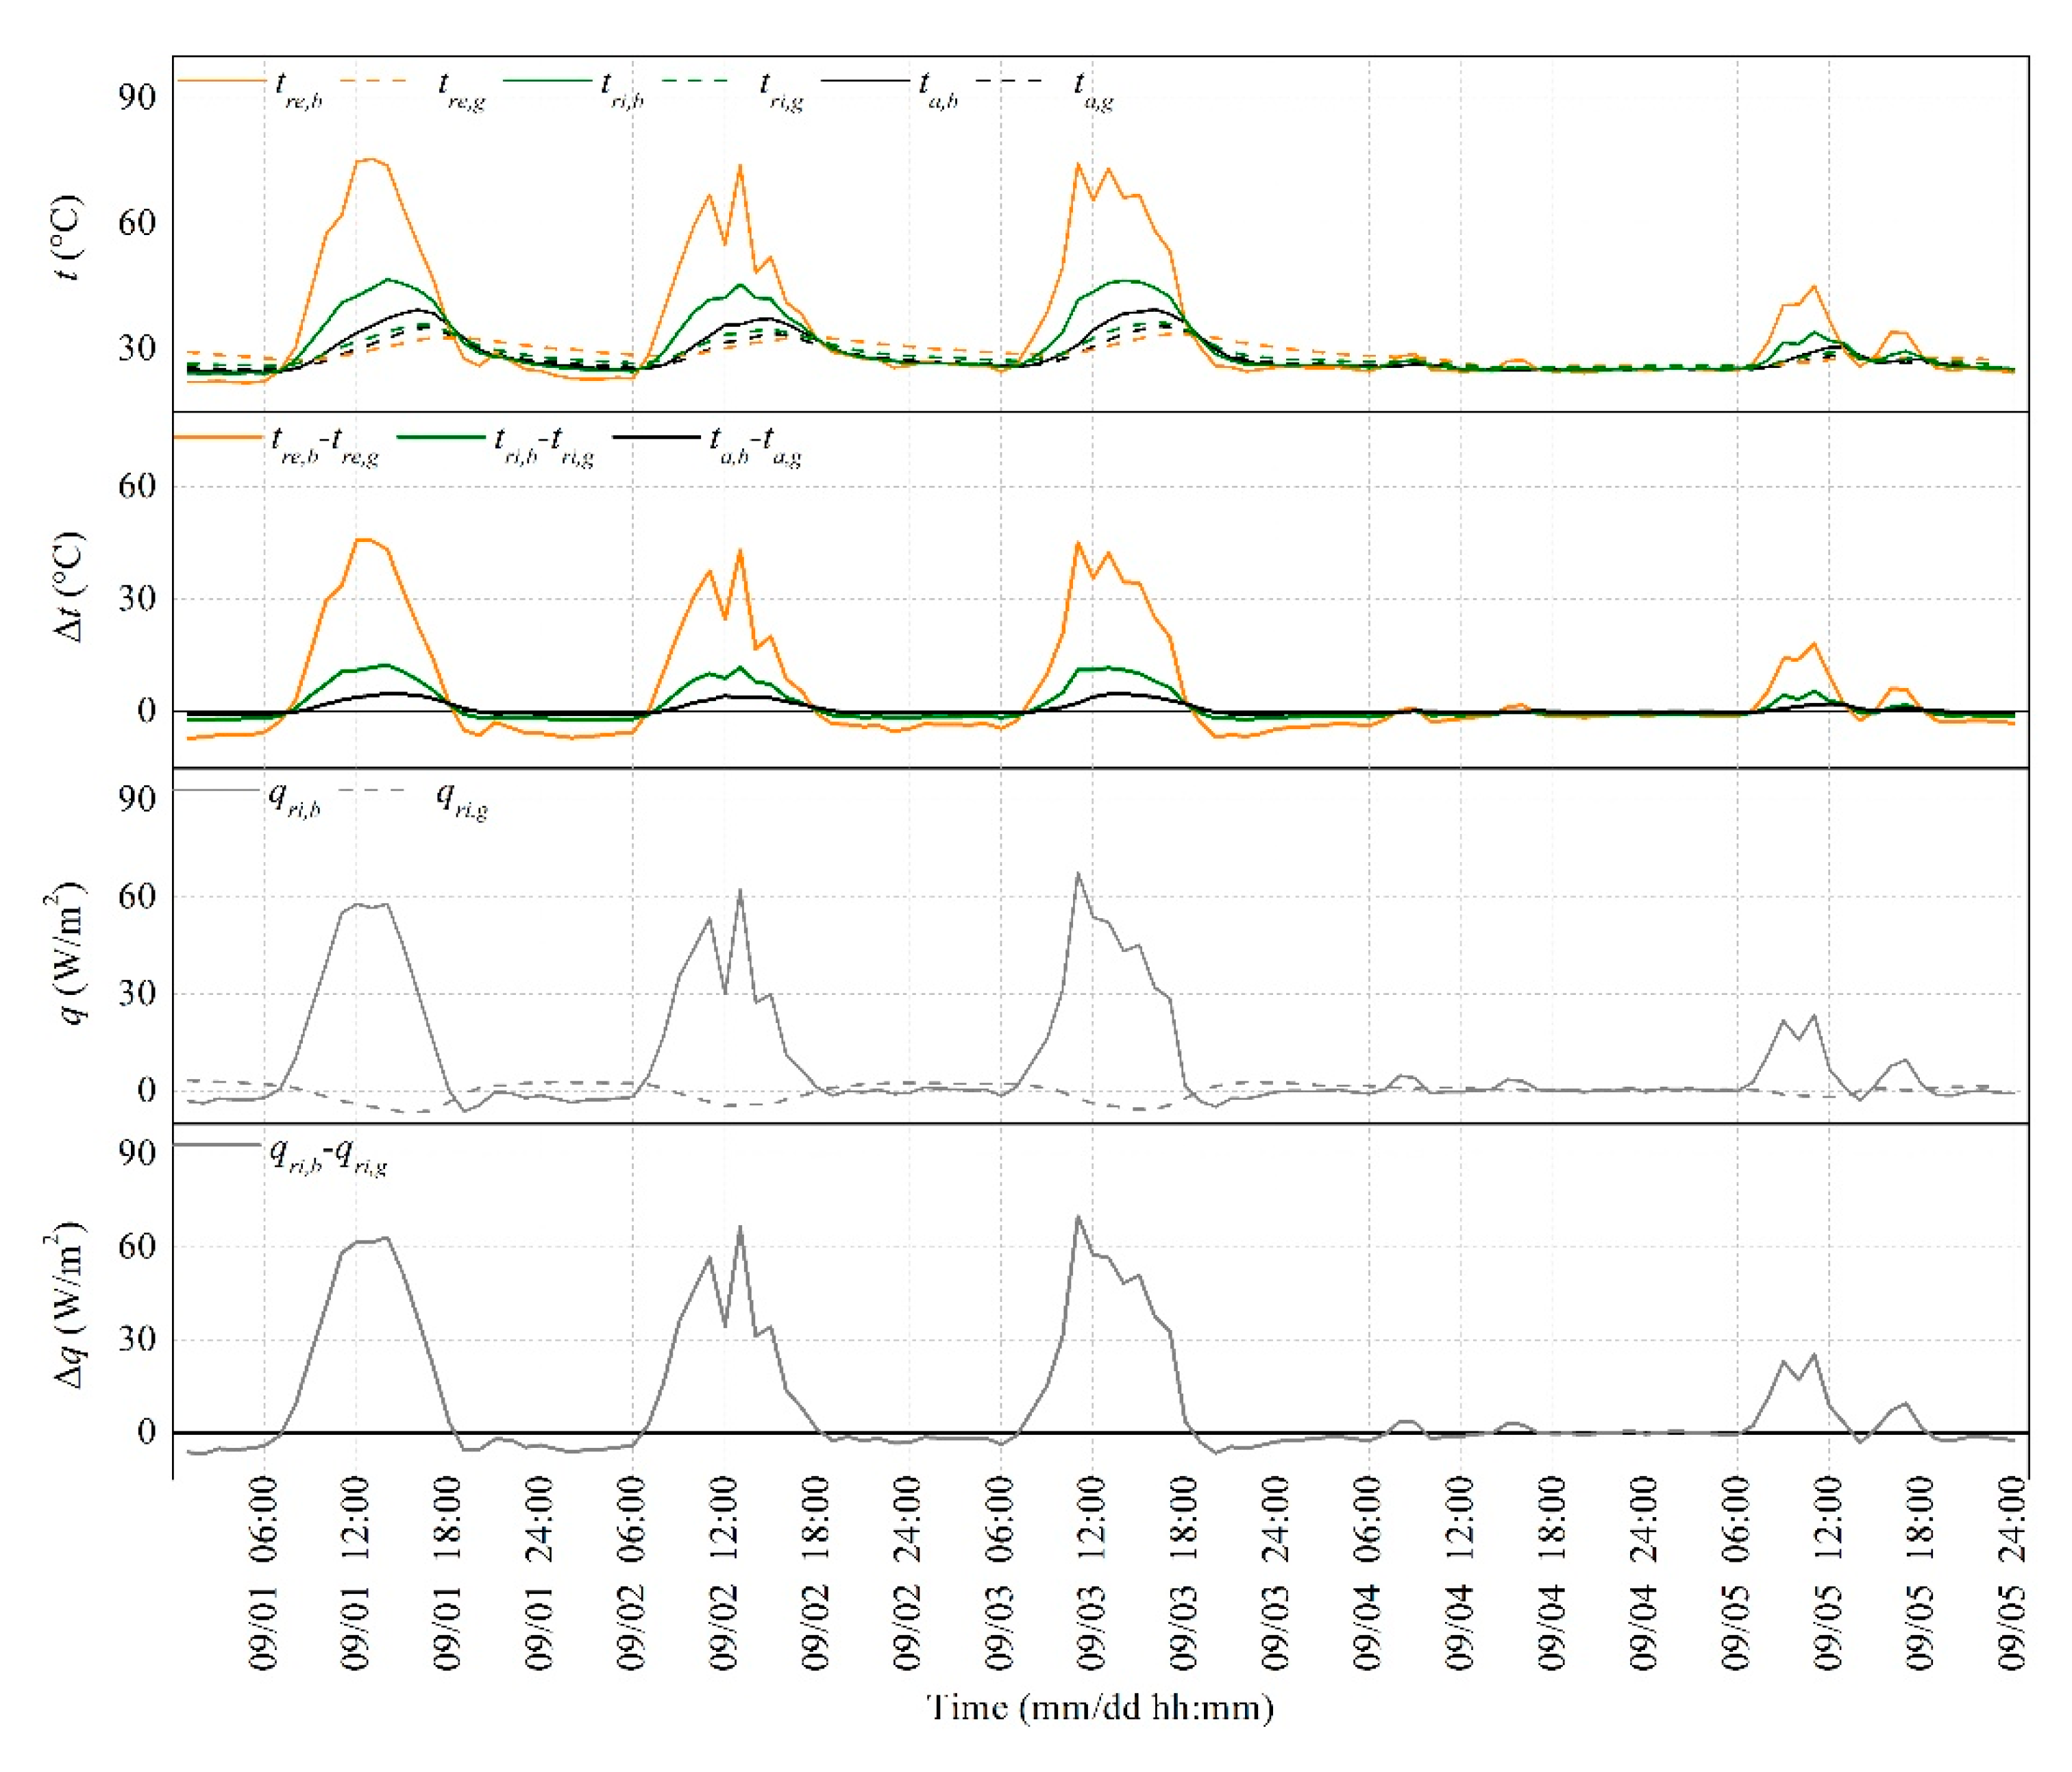
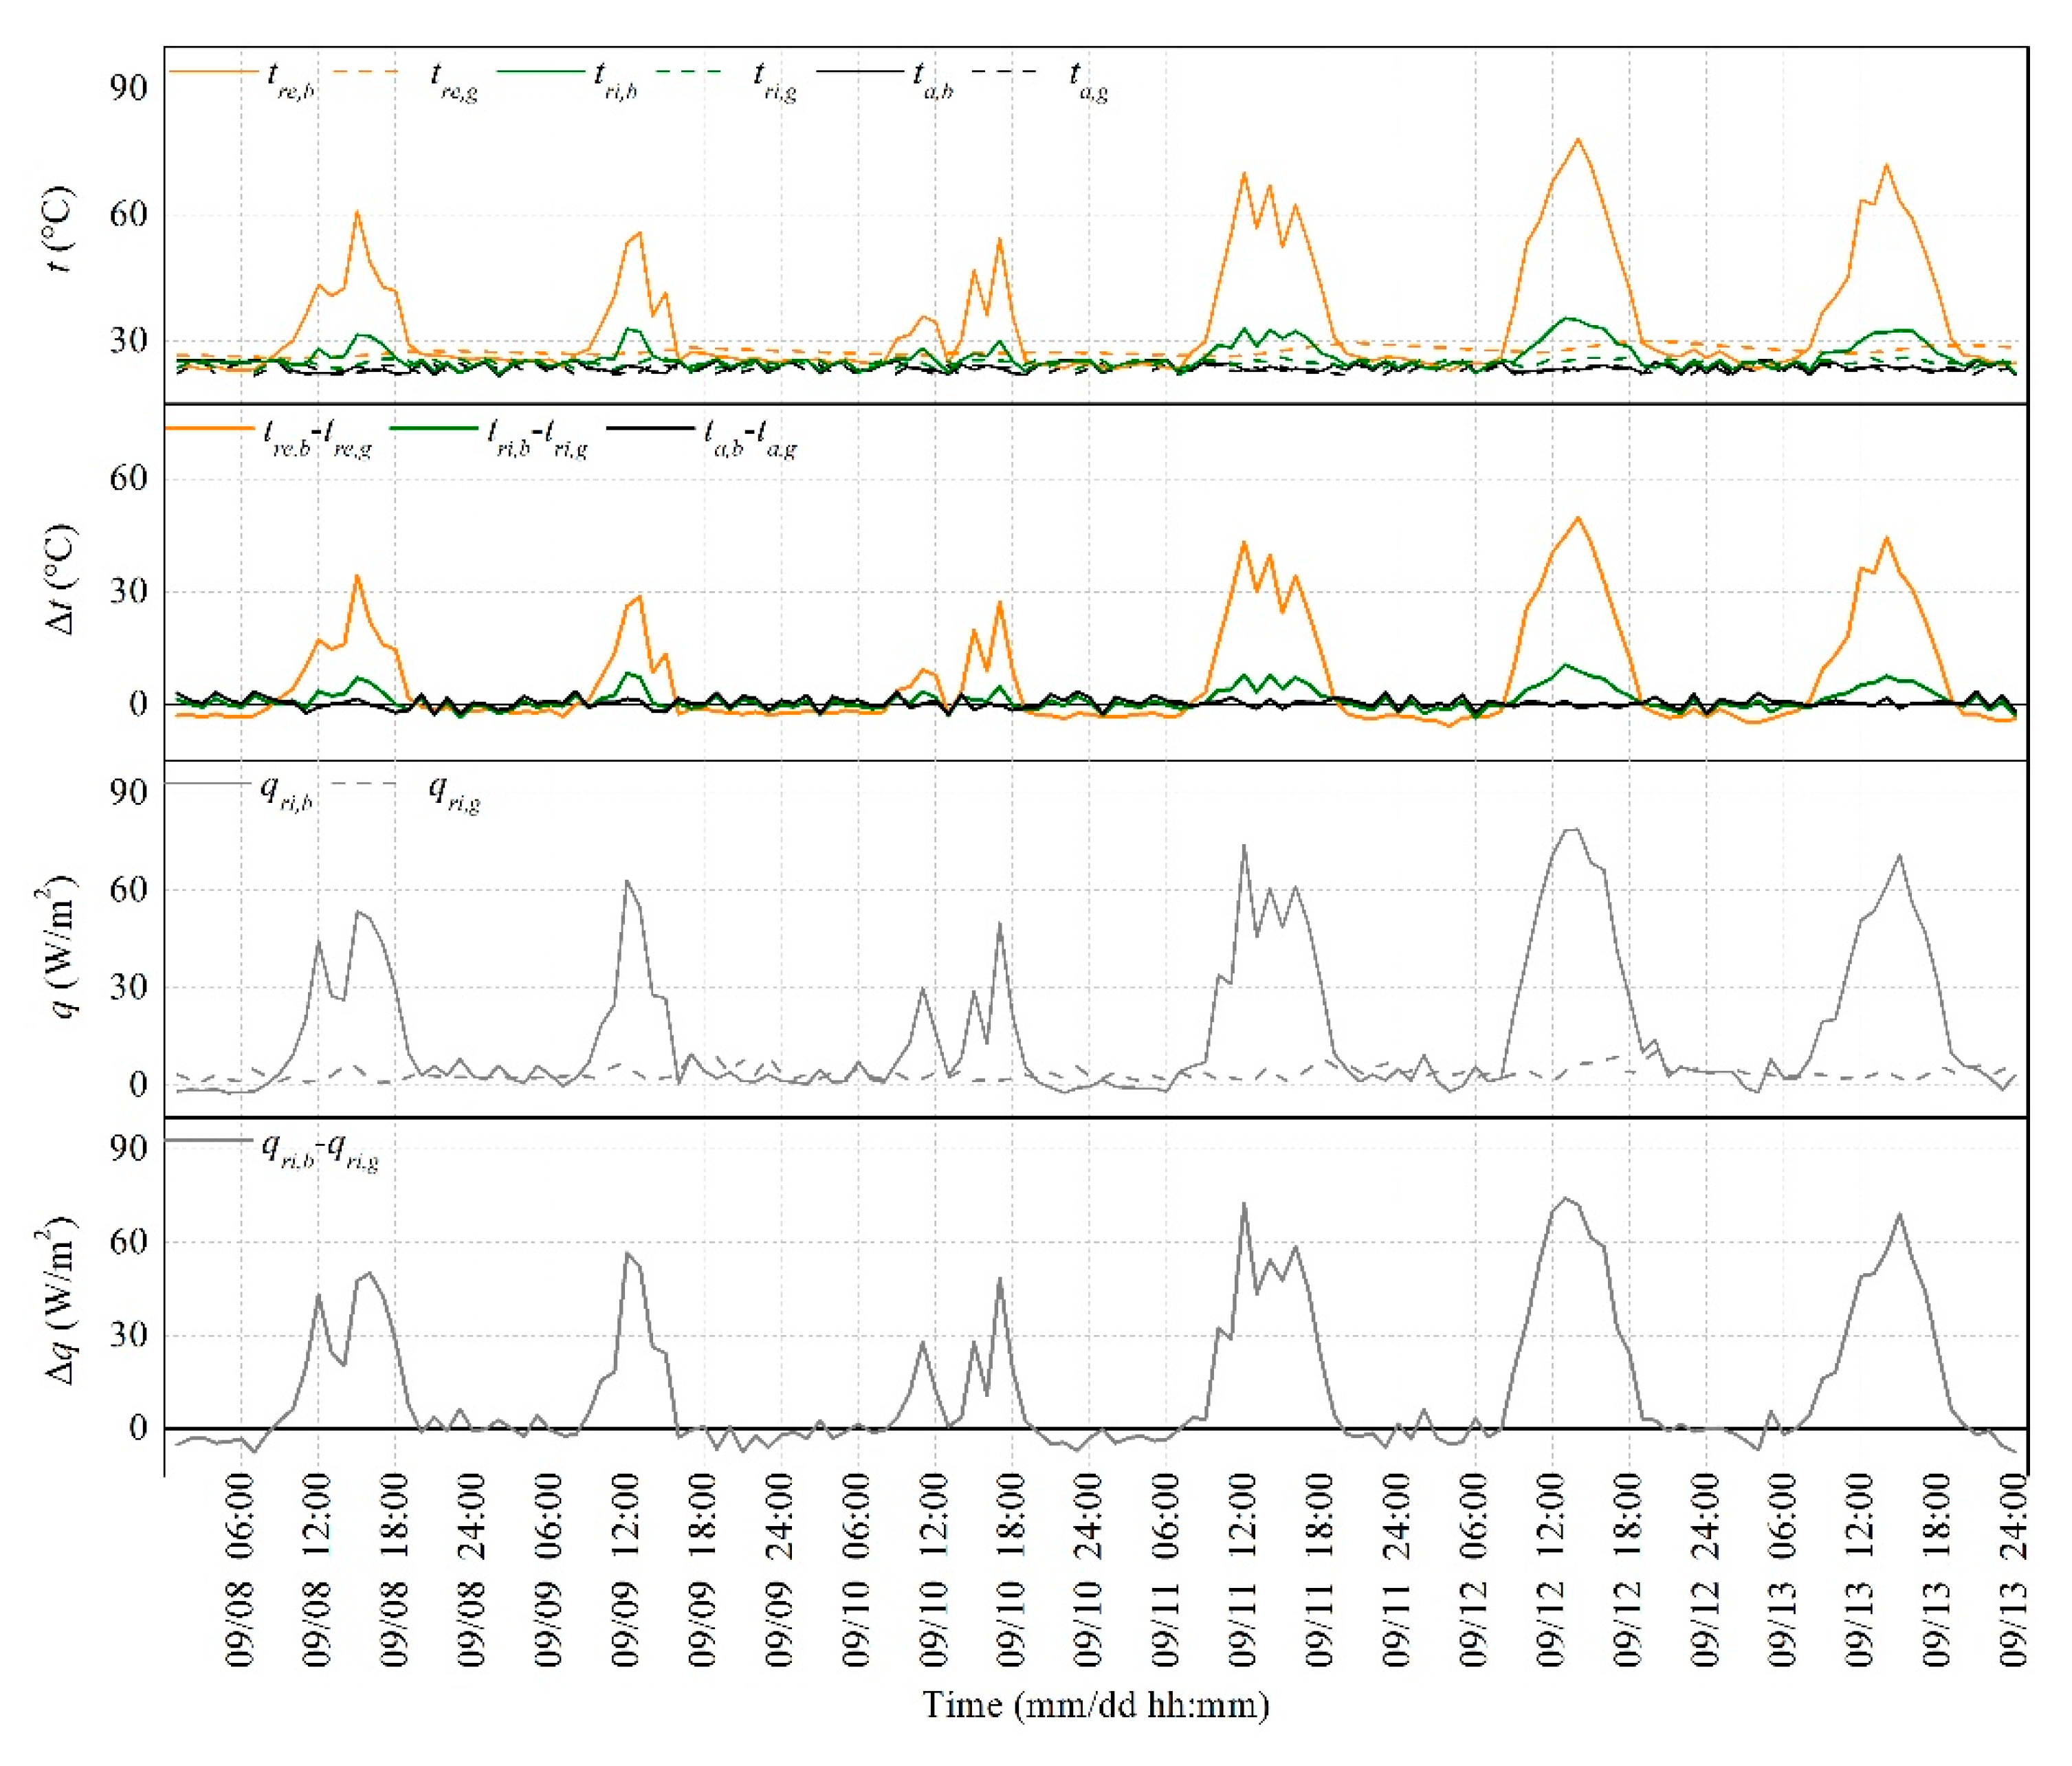
As shown in Figure 6, the cooling benefits of the green roof during the first measurement stage were very obvious on the sunny days. The external surface temperature of the bare roof was as high as 75.5 °C at 13:00 on 1 September because of the intense solar radiation and the low surface albedo. The internal surface temperature of the bare roof reached a peak value of 46.7 °C 1 h later because of the small thermal storage capacity of the insulation material. The highest air temperature recorded in the chamber under the bare roof was 39.5 °C at 16:00.
Benefitting from the shading and transpiration of the vegetation, as well as the evaporation and insulation of the substrate, the peak values of the external surface, internal surface, and chamber air temperature of the green roof were 42.7 °C, 10.9 °C, and 4.0 °C, respectively, lower than the corresponding values of the bare roof. Moreover, compared to the corresponding values of the bare roof, the average external surface, internal surface, and chamber air temperature of the green roof during the daytime (7:00–19:00) decreased by 19.6 °C, 5.8 °C, and 2.4 °C, respectively.
However, the average external surface, internal surface, and chamber air temperature of the green roof during the nighttime (1:00–6:00 and 20:00–24:00) were 5.3 °C, 1.7 °C, and 0.5 °C, respectively, higher than the corresponding values of the bare roof. This result implies that the green roof acted as an insulation layer conducive to decreasing the room heat gain during the daytime, but was averse to heat dissipation during the nighttime. Combining the green roof with night ventilation can help solve this problem [20], but this topic is beyond the scope of the present study.
As for the results of the latter two days in the first measurement stage, the cooling benefits from the green roof were not as significant as those observed during the sunny days because of the rainy and cloudy weather. The peak values of the external surface, internal surface, and chamber air temperature were 15.1 °C, 4.8 °C, and 1.9 °C, respectively, lower than the corresponding values of the bare roof.
The internal surface heat flux values were also used to analyze the cooling benefits of the green roof. The internal surface heat flux was positive when the heat flow moved from the external surface to the internal surface of the roof construction; otherwise, the internal surface heat flux was negative. The internal surface heat fluxes of the bare roof from 1 to 3 September were positive during the daytime and negative during the nighttime, in contrast to the bare roof. The accumulated internal surface heat fluxes of the bare roof and the green roof within these three days were 1037.1 W/m2 and −11.2 W/m2, respectively, indicating that the green roof reduced the chamber heat gains and the corresponding room cooling demand
For the results from 4 to 5 September, the accumulated internal surface heat fluxes of the bare roof and the green roof were 117.6 W/m2 and 29.3 W/m2, respectively. The difference in the heat fluxes was not as obvious as that found from 1 to 3 September, which can be explained by considering the heat flux decreases of the bare roof that resulted from the rainy weather.
The results of the second measurement stage are plotted in Figure 7. The air conditioning in both test chambers was turned on and set to 24 °C. The average measured air temperatures in both chambers were 23.8 °C and 23.3 °C, respectively.
Similarly to the results in the first measurement stage, the differences between the temperatures of the bare roof and the green roof were related to the weather conditions. The average external surface temperature of the green roof during sunny and rainy days was 10.0 °C and 3.5 °C lower, respectively, compared to that of the bare roof. As for the average internal surface temperature of the roof construction, the differences between the bare roof and the green roof during the sunny days and rainy days were 1.9 °C and 0.8 °C, respectively.
For the bare roof, the maximum values of the differences between the external and internal surface temperatures during the rainy and sunny days were 29.6 °C and 43.2 °C, respectively, which resulted in internal surface heat fluxes of 53.6 W/m2 and 78.8 W/m2, respectively.
For the green roof, the maximum values of the differences between the external surface and internal surface temperatures of the roof construction during the rainy and sunny days were 4.8 °C and 6.2 °C, respectively, which resulted in internal surface heat fluxes of 8.7 W/m2 and 11.2 W/m2, respectively.
Table 8 shows the electricity consumption of the air conditioning in the test chambers under the bare roof (ECb) and the green roof (ECg). The electricity saving potential of the green roof was more obvious on sunny days because the cooling effect from the shading and transpiration of vegetation and the evaporation and insulation of the substrate were more significant on sunny days than on rainy days. Compared to the corresponding values of the bare roof, the air-conditioning electricity consumption in the chamber under the green roof during the sunny days (11–13 September) was decreased by 15.0%, which was more than thrice the electricity savings rate (4.6%) of the green roof on rainy days (8–10 September).

3.2. Accuracy of the GRM

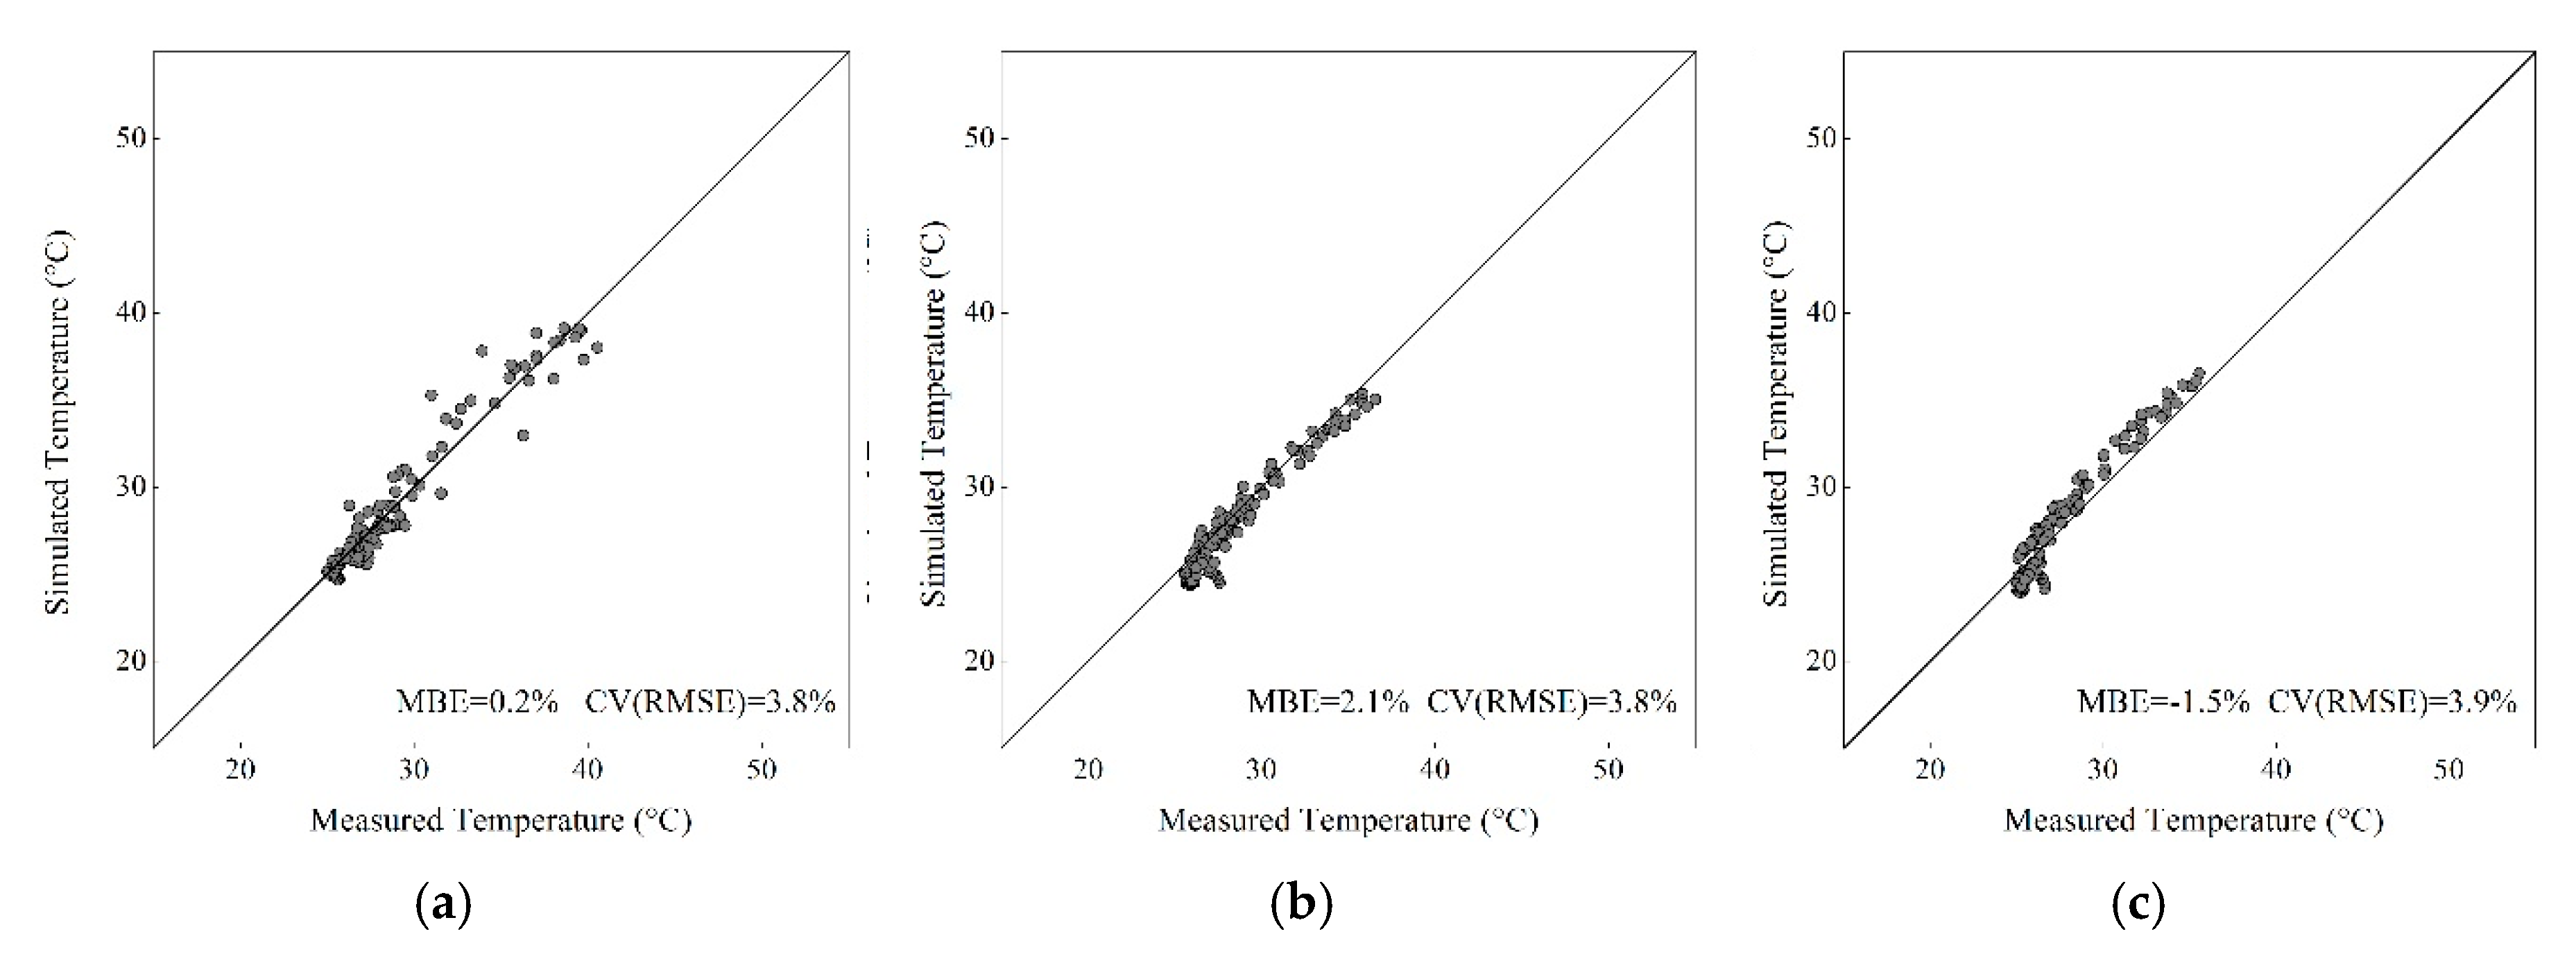
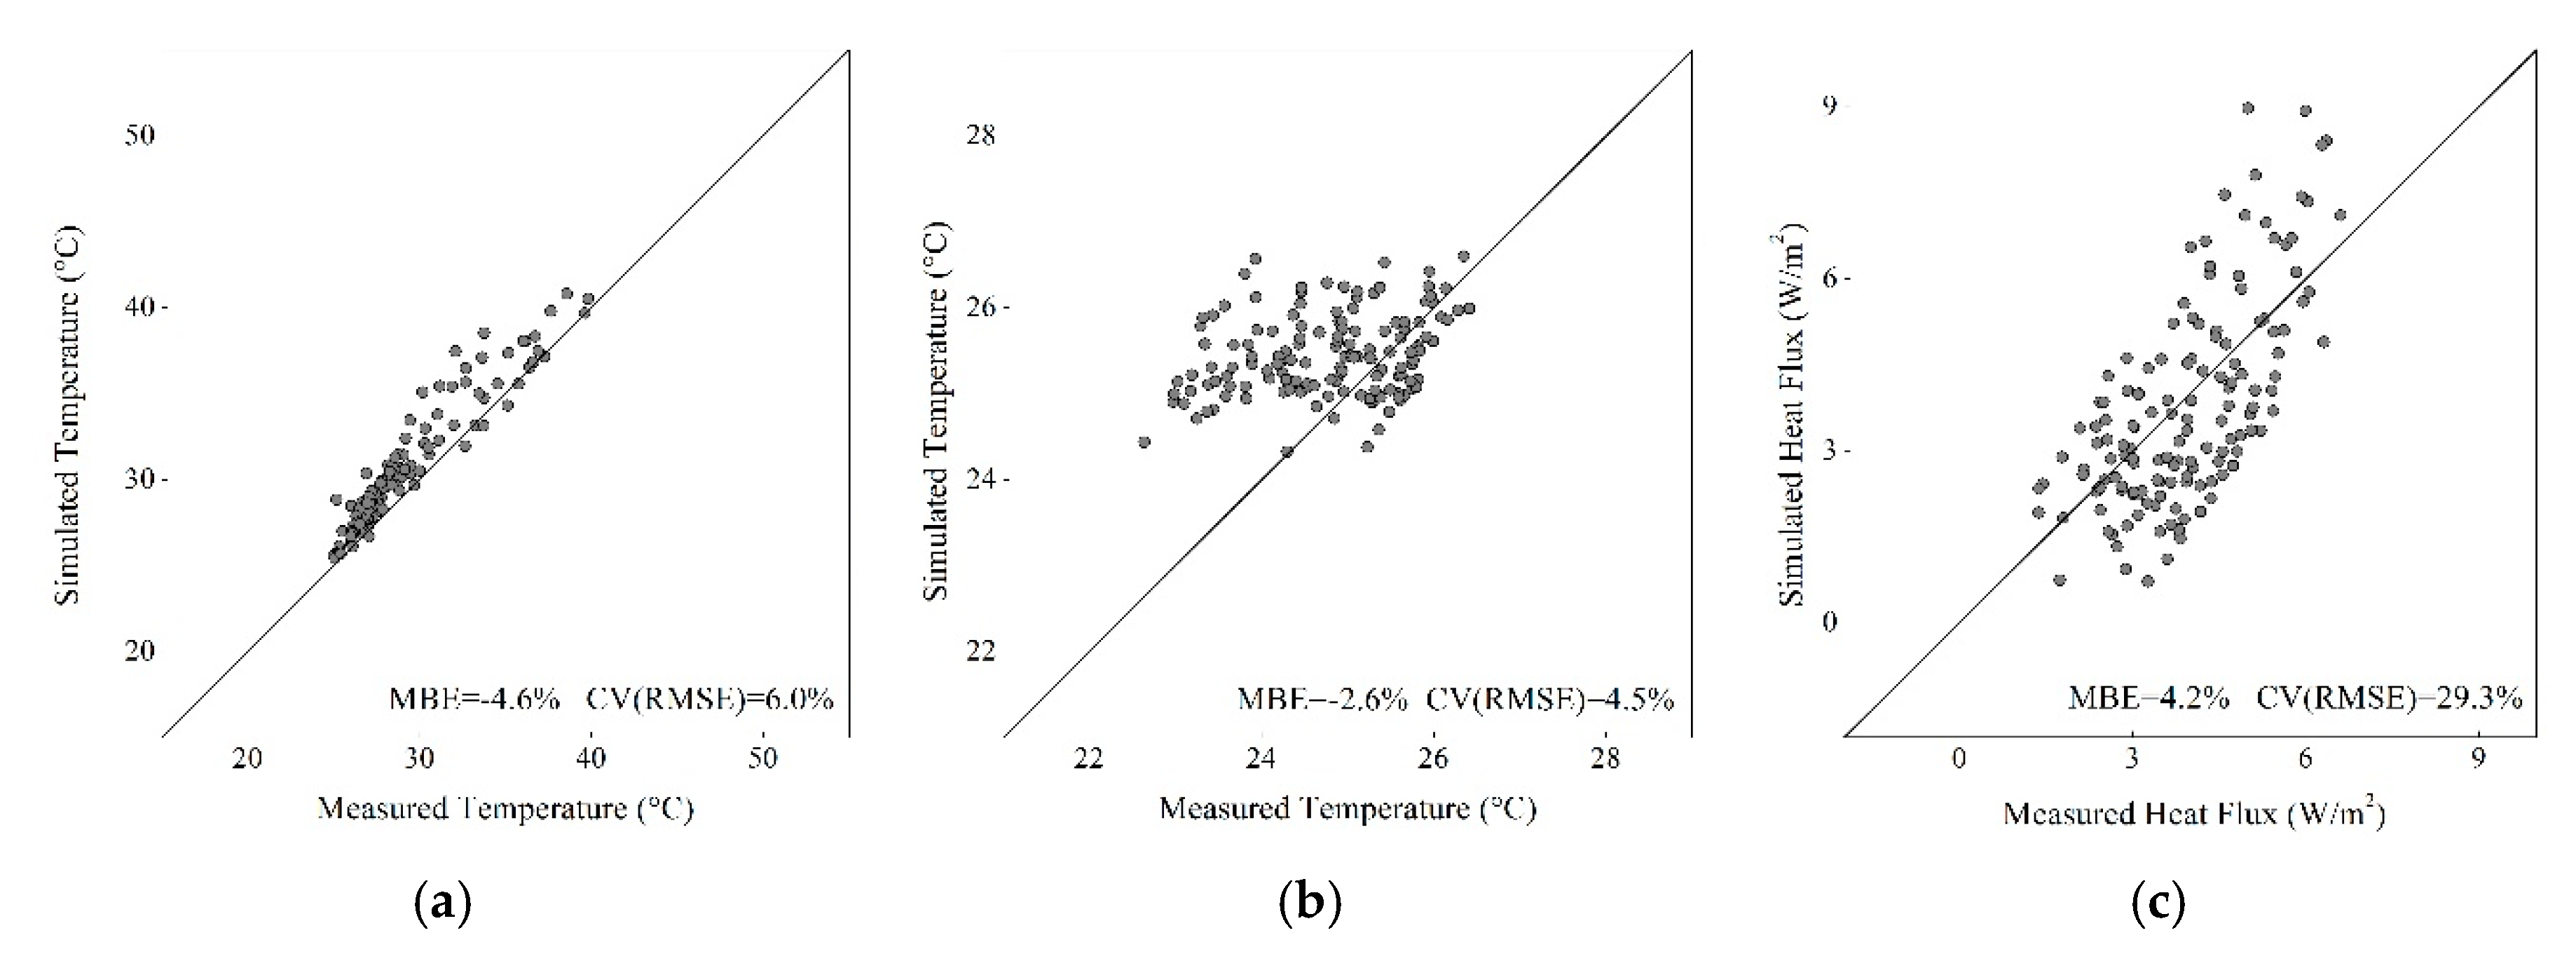
We compared the simulated values to the measured results from the experimental system to validate the accuracy of the EnergyPlus GRM under southern China’s climate conditions. As for the first measurement stage (1–5 September), the air conditioning in the chamber with the green roof was not operated. The simulated values of the external surface temperatures of the green roof substrate, internal surface temperatures of the roof construction, and chamber air temperatures were compared to the results measured during this period. For the second measurement stage (8 to 13 September), the air conditioning in the chamber with the green roof was turned on and set to 24 °C. The simulated values of the chamber air temperatures were constant at 24 °C. Therefore, besides the external surface temperatures of the green roof substrate and internal surface temperatures of the green roof, the internal surface heat flux of the green roof was employed as one of the comparison indices.
Figure 8 and Figure 9 show comparisons of the simulated and measured values. We observed that the MBEs and the CV(RMSE)s of the comparison indices were lower than ±10% and 30%, respectively. The discrepancy may have been caused by measurement error and the difference between the adopted and actual values of material properties. However, the accuracy at this level was sufficient to characterize the temperature and heat flux variations resulting from the green roof. The validated GRM was then used to investigate the significance level of the influence of the green roof design factors on the building cooling load.

3.3. Significance Order of Factors

Table 9 shows the range analysis results. DP expresses the significance level of the influence from the factors. Factors with larger DP values had a greater influence on the cooling benefits of the green roof. The maximum DP of the blank rows was 0.079, lower than the DP values of the former six factors (i.e., the RRC, ST, TCDS, LAI, LE, and SAS), which implies that the former six factors were the main factors influencing the cooling benefits of the green roof. The DP values of each factor indicate the order of the factors’ impact: RRC (0.311) > ST (0.29) > TCDS (0.245) > LAI (0.132) > LE (0.116) > SAS (0.099) > blank rows (0.079). The DP of the RRC was the largest among all the factors, implying that the RRC was the most significant factor affecting the cooling benefits of the green roof. The second, third, and sixth most impactful factors were the thermal characteristics of the substrate, while the fourth and fifth most impactful factors were the thermal characteristics of the vegetation, which indicated that the impact of the thermal characteristics of the substrate on the cooling benefit of the green roof was more significant than that of the vegetation.
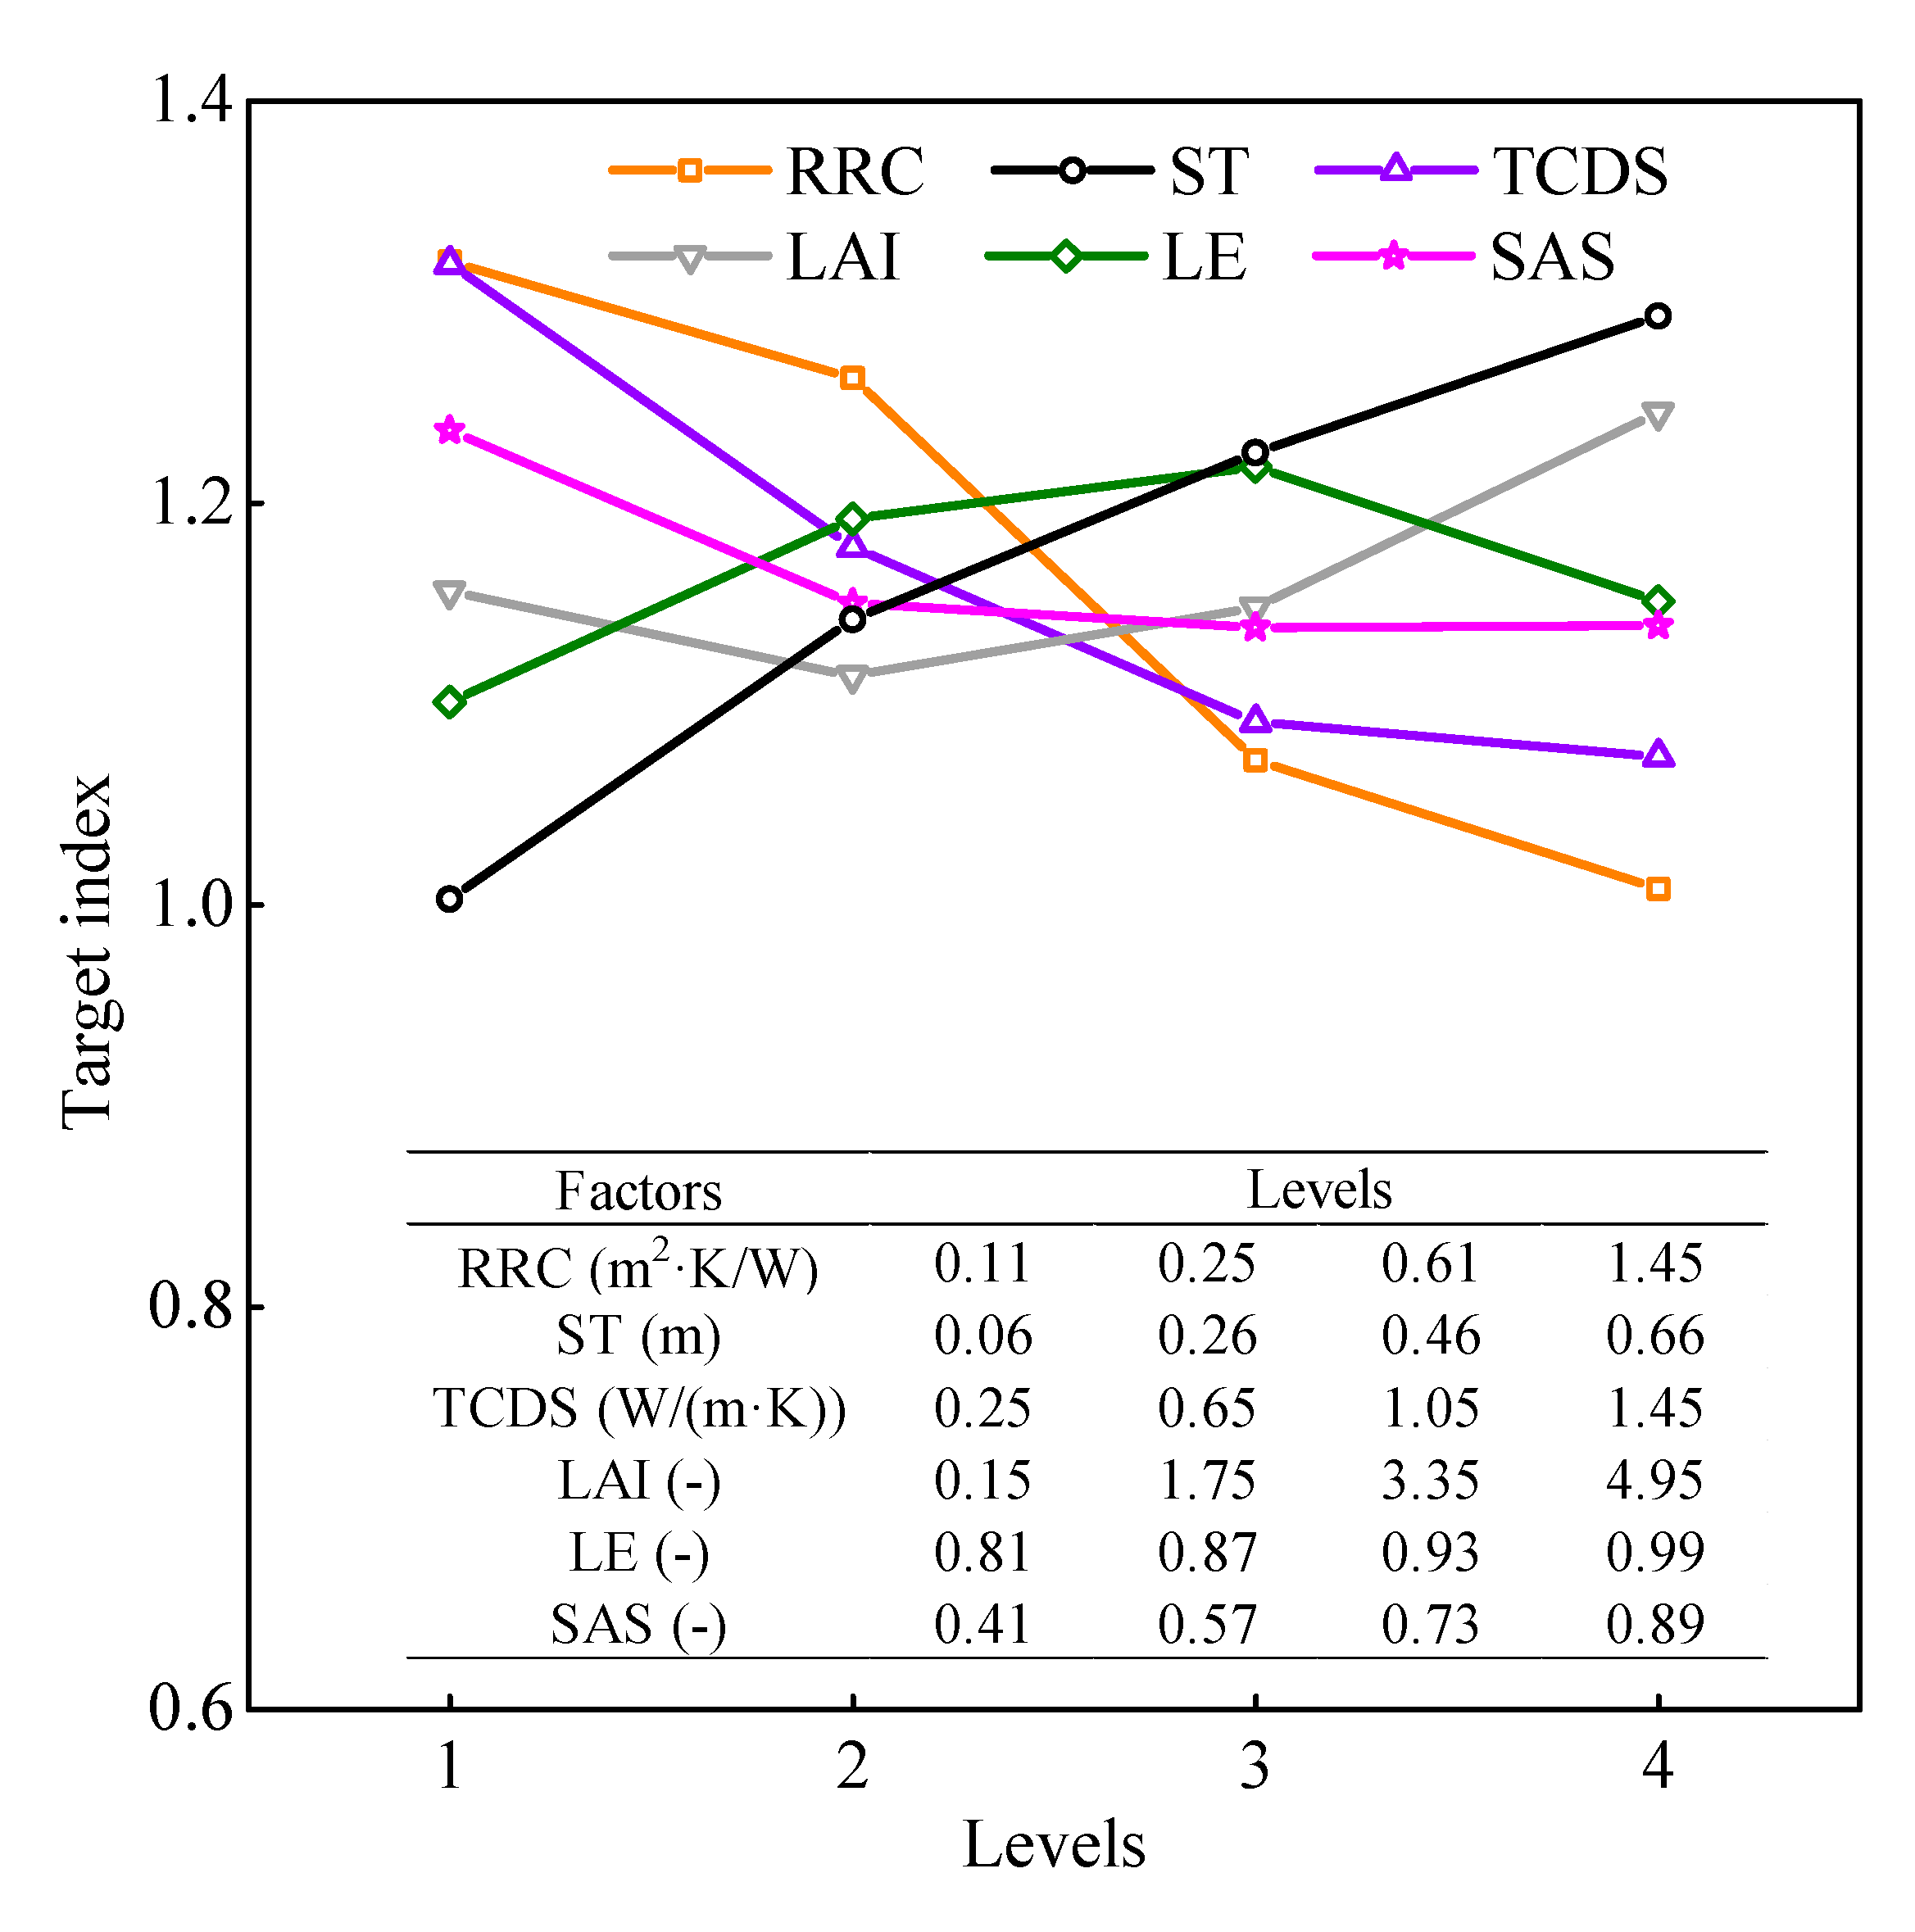
The main effect plots of the six prominent factors are illustrated in Figure 10. A line connects the points for each factor. No main effect is present when the line is horizontal. A main effect is present when the line is not horizontal. The greater the slope of the line is, the greater the main effect is.
We observed that the slope of the RRC profile was the largest one among the six plotted factors. This result implies that the cooling load savings potential from the green roof is highly related to the thermal characteristics of the roof construction. This result is consistent with the results of the range analysis in Table 9. The vegetation and the substrate layers with lower R-values could yield a higher cooling savings rate compared to those with higher R-values because of the magnitude of the ingoing heat fluxes. The target index in the present study was 1.32 when the RRC was equal to 0.11 m2·K/W, implying that the cooling load savings rate of the green roof exceeded 30%. The target index was 1.008 as the RRC increased to 1.45 m2·K/W, indicating that the cooling load savings rate of the green roof was less than 1.0%.
ST, TCDS, and SAS were 3 of the 11 factors related to the substrate layer. The deviations of the ST and TCDS profiles were larger than those of the SAS profile, which demonstrates that ST and TCDS produced more impact on the target index. Moreover, ST and TCDS had opposite impact trends on the target index. The target index increased by 28.9% as ST increased from 0.06 m to 0.66 m and decreased by 18.6% as TCDS increased from 0.25 W/m·K to 1.45 W/m·K. The target index also exhibited a negative correlation variation with the SAS. However, the variation was slight because of the small range value (0.099) of the SAS. The target index only decreased by 7.8% as the SAS increased from 0.41 to 0.89.
LAI and LE were two of the five factors related to the vegetation layers. The four levels of the LAI were 0.15, 1.75, 3.35, and 4.95. The higher the LAI was, the more significant the shading effect from the vegetation layers and the lower the evaporative cooling effect from the substrate layers. In the present study, the amount of solar radiation transmitted from the vegetation layer decreased when the LAI increased from 0.15 to 1.75, which reduced the cooling load. However, the evaporative cooling from the substrate layer was also reduced because of the lower received solar radiation on the substrate layer, which increased the cooling load. As part of the comprehensive effect of the increased shading and the reduced evaporative cooling, the cooling load savings rate decreased when the LAI increased from 0.15 to 1.75 and increased when the LAI increased from 1.75 to 4.95.
In the case of the LE, the target index increased from 1.101 to 1.218 with an increase in the LE from 0.81 to 0.93. This result indicates that the enhancement of the thermal radiation exchange between the surrounding environment and the vegetation layer was conducive to the heat dissipation of the green roof, resulting in an increase in the cooling load savings rate. The situation was opposite to that described earlier when the LE increased from 0.93 to 0.99 and resulted in a decrease in the cooling load savings rate.
Table 10 shows the ANOVA results. It can be observed that the RRC, ST, TCDS, LAI, LE, and SAS were the prominent factors impacting the cooling load savings rate because the F-values of these factors were higher than the critical value of F0.05(3,15) (i.e., 3.287). According to the ANOVA, the RRC was still the most significant factor, with a percentage contribution of 34.6%. The ST, TCDS, LAI, LE, and SAS were also important factors because they contributed 56.2% to the target index. The contribution percentage of the blank rows was only 3.7%, reinforcing the reliability of the simulation results.

4. Conclusions

This study investigated the thermal performance of an EGR under the climate conditions of subtropical China by first using onsite measurements. Next, the measurement values were employed to validate the GRM in EnergyPlus. Finally, a sensitivity analysis was performed to determine which green roof parameters are the most important and have the most significant impact on the performance index. On the basis of the results of this study, the following conclusions may be drawn:
(1)
The cooling effects of the green roof were related to the local climate conditions. For Guangzhou’s subtropical climate, the green roof had significant cooling and energy savings effects. Specifically, compared to the corresponding values for a bare roof, the experimental green roof decreased the roof internal surface temperature, chamber air temperature, and daily air-conditioning electricity consumption by up to 12.5 °C, 4.9 °C, and 16.7%, respectively;
(2)
The good agreement between the simulations and the measurements clearly showed that the EnergyPlus GRM could capture the diurnal cycle of a green roof on both sunny and rainy days in the subtropical areas of southern China; and
(3)
The sensitivity analysis showed that the RRC had the most significant impact on the cooling load savings potential of the green roof. In addition, the cooling load savings rate of the green roof increased with the degradation of the insulation performance because of the rise in the inward heat flux. This result implies that a green roof is an effective energy-efficient retrofitted technology for existing buildings with poor roof thermal insulation performance.
Additionally, the thermal characteristics of the substrate and the vegetation also exhibited significant impacts on the cooling load savings potential of the green roof. Among them, the ST, TCDS, LAI, LE, and SAS were important parameters that should be accurately measured and input into simulation platforms for building energy consumption to improve the reliability of numerical simulations. Further work is necessary to investigate these parameters for newly developed substrate materials and vegetation types.
From the view of optimizing the cooling load savings potential of a green roof, thick substrate layers with low thermal conductivity and solar absorptance and vegetation layers with high leaf area indexes and a leaf emissivity of 0.93 were the preferred green roof options.
Although the present study was performed in subtropical China, the methodology of this study shows potential for utilization in other climatic areas to derive the significance order of green roof factors.

Author Contributions

Conceptualization, Y.Z. and L.Z.; methodology, L.Z.; software, L.Z.; validation, L.M., Y.Z. and P.R.; formal analysis, L.Z.; investigation, L.M.; resources, Q.M.; data curation, L.Z.; writing—original draft preparation, Y.Z.; writing—review and editing, L.Z.; visualization, Y.Z.; supervision, L.Z.; project administration, L.Z.; funding acquisition, Y.Z.

Funding

This research was funded by the National Natural Science Foundation of China (grant number 51678243); the National Key R&D Program of China (grant number 2017YFC0702200); the Science and Technology Projects of the Ministry of Housing and Urban–Rural Development (grant numbers 2018K1020 and 2018K1013); the Guangdong Natural Science Foundation (grant numbers 2016A030313506 and 2018A0303130094); and the Project of the State Key Lab of Subtropical Building Science (grant number 2018ZA01).

Conflicts of Interest

The authors declare no conflicts of interest.

Abbreviations

The following abbreviations are used in this manuscript:
DDSdensity of dry substrate
HPheight of plants
IVMCSinitial volumetric moisture content of the substrate
LAIleaf area index
LEleaf emissivity
LRleaf reflectivity
MSRminimum stomatal resistance
RRCR-value of roof construction
RVMCSresidual volumetric moisture content of the substrate
SASsolar absorptance of the substrate
SHDSspecific heat of dry substrate
SRsubstrate roughness
STsubstrate thickness
SVMCSsaturation volumetric moisture content of the substrate
TASthermal absorptance of the substrate
TCDSthermal conductivity of dry substrate
VASvisible absorptance of the substrate

References

  1. Cascone, S. Green Roof Design: State of the Art on Technology and Materials. Sustainability 2019, 11, 3020. [Google Scholar] [CrossRef]
  2. Ulubeyli, S.; Arslan, V. Economic viability of extensive green roofs through scenario and sensitivity analyses: Clients’ perspective. Energy Build. 2017, 139, 314–325. [Google Scholar] [CrossRef]
  3. Akbari, H. Measured energy savings from the application of reflective roofs in two small non-residential buildings. Energy 2003, 28, 953–967. [Google Scholar] [CrossRef] [Green Version]
  4. Santamouris, M. Cooling the cities–A review of reflective and green roof mitigation technologies to fight heat island and improve comfort in urban environments. Sol. Energy 2014, 103, 682–703. [Google Scholar] [CrossRef]
  5. Nahar, N.M.; Sharma, P.; Purohit, M.M. Studies on solar passive cooling techniques for arid areas. Energy Convers. Manag. 1999, 40, 89–95. [Google Scholar] [CrossRef]
  6. Karamanis, D. Solar cooling with hydrophilic porous materials for reducing building cooling needs. In Eco-Efficient Materials for Mitigating Building Cooling Needs: Design, Properties and Applications; Pacheco-Torgal, F., Labrincha, J., Cabeza, L., Granqvist, C.G., Eds.; Woodhead Publishing: Cambridge, UK, 2015; pp. 269–305. [Google Scholar]
  7. Santamouris, M.; Synnefa, A.; Karlessi, T. Using advanced cool materials in the urban built environment to mitigate heat islands and improve thermal comfort conditions. Sol. Energy 2011, 85, 3085–3102. [Google Scholar] [CrossRef]
  8. Raman, A.P.; Anoma, M.A.; Zhu, L.; Rephaeli, E.; Fan, S. Passive radiative cooling below ambient air temperature under direct sunlight. Nature 2014, 515, 540–544. [Google Scholar] [CrossRef] [PubMed]
  9. Zhai, Y.; Ma, Y.; David, S.N.; Zhao, D.; Lou, R.; Tan, G.; Yang, R.; Yin, X. Scalable-manufactured randomized glass-polymer hybrid metamaterial for daytime radiative cooling. Science 2017, 355, 1062–1066. [Google Scholar] [CrossRef] [PubMed] [Green Version]
  10. Zhang, L.; Zhang, R.; Zhang, Y.; Hong, T.; Meng, Q.; Feng, Y. The impact of evaporation from porous tile on roof thermal performance: A case study of Guangzhou’s climatic conditions. Energy Build. 2017, 136, 161–172. [Google Scholar] [CrossRef]
  11. Sailor, D.J. A green roof model for building energy simulation programs. Energy Build. 2008, 40, 1466–1478. [Google Scholar] [CrossRef]
  12. Gagliano, A.; Detommaso, M.; Nocera, F. Assessment of the green roofs thermal dynamic behavior for increasing the building energy efficiencies. In Smart Energy Control Systems for Sustainable Buildings; Littlewood, J., Spataru, C., Howlett, R.J., Jain, L.C., Eds.; Springer: Cham, Switzerland, 2017; pp. 37–59. [Google Scholar]
  13. Wolf, D.; Lundholm, J.T. Water uptake in green roof microcosms: Effects of plant species and water availability. Ecol. Eng. 2008, 33, 179–186. [Google Scholar] [CrossRef]
  14. Lin, B.S.; Yu, C.C.; Su, A.T.; Lin, Y.J. Impact of climatic conditions on the thermal effectiveness of an extensive green roof. Build. Environ. 2013, 67, 26–33. [Google Scholar] [CrossRef] [Green Version]
  15. Huang, Y.Y.; Chen, C.T.; Tsai, Y.C. Reduction of temperatures and temperature fluctuations by hydroponic green roofs in a subtropical urban climate. Energy Build. 2016, 129, 174–185. [Google Scholar] [CrossRef]
  16. Huang, Y.Y.; Chen, C.T.; Liu, W.T. Thermal performance of extensive green roofs in a subtropical metropolitan area. Energy Build. 2018, 159, 39–53. [Google Scholar] [CrossRef]
  17. Jim, C.Y. Air-conditioning energy consumption due to green roofs with different building thermal insulation. Appl. Energy 2014, 128, 49–59. [Google Scholar] [CrossRef]
  18. Jim, C.Y. Passive warming of indoor space induced by tropical green roof in winter. Energy 2014, 68, 272–282. [Google Scholar] [CrossRef]
  19. Jim, C.Y. Diurnal and partitioned heat-flux patterns of coupled green-building roof systems. Renew. Energy 2015, 81, 262–274. [Google Scholar] [CrossRef]
  20. Jiang, L.; Tang, M. Thermal analysis of extensive green roofs combined with night ventilation for space cooling. Energy Build. 2017, 156, 238–249. [Google Scholar] [CrossRef]
  21. Yang, W.; Wang, Z.; Cui, J.; Zhu, Z.; Zhao, X. Comparative study of the thermal performance of the novel green (planting) roofs against other existing roofs. Sustain. Cities Soc. 2015, 16, 1–12. [Google Scholar] [CrossRef]
  22. Feng, C.; Meng, Q.; Zhang, Y. Theoretical and experimental analysis of the energy balance of extensive green roofs. Energy Build. 2010, 42, 959–965. [Google Scholar] [CrossRef]
  23. Peng, L.; Jim, C. Green-roof effects on neighborhood microclimate and human thermal sensation. Energies 2013, 6, 598–618. [Google Scholar] [CrossRef]
  24. Costanzo, V.; Evola, G.; Marletta, L. Energy savings in buildings or UHI mitigation? Comparison between green roofs and cool roofs. Energy Build. 2016, 114, 247–255. [Google Scholar] [CrossRef]
  25. Lawrence Berkeley National Laboratory. EnergyPlus Documentation Engineering Reference. Available online: https://energyplus.net/sites/all/modules/custom/nrel_custom/pdfs/pdfs_v8.4.0/EngineeringReference.pdf (accessed on 18 September 2019).
  26. Zeng, C.; Bai, X.; Sun, L.; Zhang, Y.; Yuan, Y. Optimal parameters of green roofs in representative cities of four climate zones in China: A simulation study. Energy Build. 2017, 150, 118–131. [Google Scholar] [CrossRef]
  27. Rakotondramiarana, H.; Ranaivoarisoa, T.; Morau, D. Dynamic simulation of the green roofs impact on building energy performance, case study of Antananarivo, Madagascar. Buildings 2015, 5, 497–520. [Google Scholar] [CrossRef]
  28. Beck, H.E.; Zimmermann, N.E.; McVicar, T.R.; Vergopolan, N.; Berg, A.; Wood, E.F. Present and future Köppen-Geiger climate classification maps at 1-km resolution. Sci. Data 2018, 5, 180214. [Google Scholar] [CrossRef] [PubMed]
  29. Frankenstein, S.; Koenig, G. FASST Vegetation Models; US Army Corps of Engineers: Washington, DC, USA, 2004. [Google Scholar]
  30. Frankenstein, S.; Koenig, G. Fast All-Season Soil Strength (FASST); US Army Corps of Engineers: Washington, DC, USA, 2004. [Google Scholar]
  31. Giunta, A.A.; McFarland, J.M.; Swiler, L.P.; Eldred, M.S. The promise and peril of uncertainty quantification using response surface approximations. Struct. Infrastruct. Eng. 2006, 2, 175–189. [Google Scholar] [CrossRef]
  32. Ministry of Construction of the People’s Republic of China. Design Standard for Energy Efficiency of Residential Buildings in Hot Summer and Warm Winter Zone; China Building Industry Press: Beijing, China, 2012.
  33. Zhao, P.; Ge, S.; Yoshikawa, K. An orthogonal experimental study on solid fuel production from sewage sludge by employing steam explosion. Appl. Energy 2013, 112, 1213–1221. [Google Scholar] [CrossRef]
Figure 1. Schematics of the experimental system and measuring points (unit: mm). (a) Plan drawing; (b) A–A cross-section drawing. Here, ta,b: air temperature of the chamber under a bare roof; ta,g: air temperature of the chamber under the green roof; tbr,e and tbr,i: external and internal surface temperatures of the bare roof; ts,e, tgr,e, and tgr,i: external surface temperature of the substrate, external surface temperature of the green roof, and internal surface temperature of the green roof; qbr,i: internal surface heat flux of the bare roof; qgr,i: internal surface heat flux of the green roof.
Energies 12 04278 g001
Figure 2. Schematics of the building model for the validation (and measuring points): (a) plan drawing; (b) axonometric drawing.
Energies 12 04278 g002
Figure 3. The building model for the orthogonal simulation: (a) plan of a top-floor dwelling; (b) the EnergyPlus model.
Energies 12 04278 g003
Figure 4. Meteorological data in the non-air-conditioning experimental conditions. Rg: global horizontal solar radiation; Ri: horizontal infrared radiation intensity from the sky; Rn: direct normal solar radiation; Rd: diffuse horizontal solar radiation; rh: relative humidity; ta: air temperature; and pr: precipitation.
Energies 12 04278 g004
Figure 5. Meteorological data in the air-conditioning experimental conditions. Rg: global horizontal solar radiation; Ri: horizontal infrared radiation intensity from the sky; Rn: direct normal solar radiation; Rd: diffuse horizontal solar radiation; rh: relative humidity; ta: air temperature; and pr: precipitation.
Energies 12 04278 g005
Figure 6. Cooling benefits of the green roof in the non-air-conditioning experimental conditions. tre,b, tri,b, and ta,b: external surface, internal surface, and chamber air temperature of the bare roof, respectively; tre,g, tri,g, and ta,g: external surface, internal surface, and chamber air temperature of the green roof, respectively; qri,b: internal surface heat flux of the bare roof; and qri,g: internal surface heat flux of the green roof.
Energies 12 04278 g006
Figure 7. Cooling benefits of the green roof in the air-conditioning experimental conditions. tre,b, tri,b, and ta,b: external surface, internal surface, and chamber air temperature of the bare roof, respectively; tre,g, tri,g, and ta,g: external surface, internal surface, and chamber air temperature of the green roof, respectively; qri,b: internal surface heat flux of the bare roof; and qri,g: internal surface heat flux of the green roof.
Energies 12 04278 g007
Figure 8. Comparisons of the simulated and measured values during the first measurement stage. (a) External surface temperatures of the green roof substrate; (b) internal surface temperatures of the green roof; (c) indoor air temperatures under the green roof.
Energies 12 04278 g008
Figure 9. Comparisons of the simulated and measured values during the second measurement stage. (a) External surface temperatures of the green roof substrate; (b) internal surface temperatures of the green roof; (c) internal surface heat fluxes of the green roof.
Energies 12 04278 g009
Figure 10. Main effect plots of the six factors.
Energies 12 04278 g010
Table 1. Measurement devices and parameters.
Measurement PointsSensor TypeMeasurement Range and Accuracy
Direct normal radiationCHP1 pyrheliometer with SOLYS2 sun tracker0–4000 W/m2, ±0.5%
Global horizontal radiationCMP3 pyranometer0–2000 W/m2, ±5.0%
Diffuse horizontal radiationCMP3 pyranometer0–2000 W/m2, ±5.0%
Outdoor wind speed81000 three-dimensional ultrasonic anemometer0–40 m/s, ±1%
Outdoor wind direction0.0–359.9°, ±2°
Outdoor dry-bulb temperatureCS215 temperature and relative humidity probe−40–70 °C, ±0.4 °C
Outdoor relative humidity0–100%, ±2%
Surface temperatureΦ0.2-mm T-type thermocouple−200–150 °C, ±0.1 °C
Substrate temperatureHOBO temperature sensor−40–70 °C, ±0.18 °C
Chamber air temperatureHOBO temperature sensor−40–70 °C, ±0.18 °C
Heat fluxHeat flow sensor−2–2 kW/m2, ±3%
Table 2. Building materials and their thermophysical parameters.
Building ComponentsMaterial (from Outside to Inside)Thickness (mm)Thermal Conductivity (W/m∙K)Density (kg/m3)Specific Heat (J/kg·K)
WallExpanded polystyrene board0.10.0624301260
RoofExtruded polystyrene board0.0250.046301210
FloorExpanded polystyrene board0.10.0624301260
Table 3. Green roof parameters for the simulation.
Green Roof Parameters Values
Height of plants (m)0.1
Leaf area index (–)4.6
Leaf reflectivity (–)0.17
Leaf emissivity (–)0.99
Minimum stomatal resistance (s/m)180
Substrate roughness (–)Medium rough
Substrate thickness (m)0.1
Thermal conductivity of dry substrate (W/m·K)0.1
Density of dry substrate (kg/m3)550
Specific heat of dry substrate (J/kg·K)600
Thermal absorptance of the substrate (–)0.95
Solar absorptance of the substrate (–)0.7
Visible absorptance of the substrate (–)0.7
Saturation volumetric moisture content of the substrate (–)0.5
Residual volumetric moisture content of the substrate (–)0.01
Initial volumetric moisture content of the substrate (–)0.3
Table 4. EnergyPlus simulation settings.
ObjectDescription
EnergyPlus version8.4
Inside surface convection algorithmThermal Analysis Research Program
Outside surface convection algorithmDOE-2
Heat balance algorithmConduction transfer function
Zone air heat balance algorithm Third-order backward difference
Number of timesteps per hour60
Run periodIdentical to that of the experimental system
Internal gainsNone
Zone air-conditioning systemIdeal load air system
Cooling setpoint temperatureIdentical to that of the experimental system
Table 5. Green roof parameters and their levels.
Green Roof Parameters 1Parameter Levels
L1L2L3L4
HP (m)0.0500.3500.6500.950
LAI (–)0.151.753.354.95
LR (–)0.1500.2500.3500.450
LE (–)0.8100.8700.9300.990
MSR (s/m)60130200270
SR (–)Very roughMedium roughMedium smoothVery smooth
ST (m)0.0600.2600.4600.660
TCDS (W/m·K)0.2500.6501.0501.450
DDS (kg/m3)40090014001900
SHDS (J/kg·K)520101015001990
TAS (–)0.8100.8700.9300.990
SAS (–)0.4100.5700.7300.890
VAS (–)0.5100.6700.8300.990
SVMCS (–)0.1500.2500.3500.450
RVMCS (–)0.0150.0400.0650.090
RRC (m2·K/W)0.110.250.611.45
1 HP: height of plants; LAI: leaf area index; LR: leaf reflectivity; LE: leaf emissivity; MSR: minimum stomatal resistance; SR: substrate roughness; ST: substrate thickness; TCDS: thermal conductivity of dry substrate; DDS: density of dry substrate; SHDS: specific heat of dry substrate; TAS: thermal absorptance of the substrate; SAS: solar absorptance of the substrate; VAS: visible absorptance of the substrate; SVMCS: saturation volumetric moisture content of the substrate; RVMCS: residual volumetric moisture content of the substrate; RRC: R-value of roof construction.
Table 6. Building materials and their thermophysical parameters.
Building ComponentsLevelMaterial (from Outside to Inside)Thickness (mm)Thermal Conductivity (W/m∙K)Density (kg/m3)Specific Heat (J/kg·K)
Roof constructionsL1Cement mortar0.020.9318001050
Reinforced concrete0.121.742500920
Cement mortar0.020.9318001050
R-value
(m2∙K/W)
0.11
U-value
(W/m2∙K)
3.70
L2Cement mortar0.020.9318001050
Aerated concrete0.030.227001050
Reinforced concrete0.121.742500920
Cement mortar0.020.9318001050
R-value
(m2∙K/W)
0.25
U-value
(W/m2∙K)
2.44
L3Cement mortar0.020.9318001050
EPS0.0150.0328.51647
Reinforced concrete0.121.742500920
Cement mortar0.020.9318001050
R-value
(m2∙K/W)
0.61
U-value
(W/m2∙K)
1.30
L4Cement mortar0.020.9318001050
EPS0.040.0328.51647
Reinforced concrete0.121.742500920
Cement mortar0.020.9318001050
R-value
(m2∙K/W)
1.45
U-value
(W/m2∙K)
0.62
WallCement mortar0.020.9318001050
Aerated concrete brick0.190.227001050
Cement mortar0.020.9318001050
R-value
(m2∙K/W)
0.91
U-value
(W/m2∙K)
0.93
FloorAdiabatic floor----
Table 7. EnergyPlus simulation settings.
ObjectDescription
EnergyPlus version8.4
Inside surface convection algorithmThermal Analysis Research Program
Outside surface convection algorithmDOE-2
Heat balance algorithmConduction transfer function
Zone air heat balance algorithm Third-order backward difference
Number of timesteps per hour60
Run period1 May to 31 October
WindowU-factor = 2.45 W/m2∙K
Solar heat gain coefficient = 0.42
Internal GainsNone
Zone air-conditioning systemIdeal load air system
Cooling setpoint temperatureAlways 26 °C
Table 8. Electricity consumption of the air conditioning.
DateECbECg(ECb − ECg)/ECbDateECbECg(ECb − ECg)/ECb
kWhkWh%kWhkWh%
9/839.136.56.79/1168.359.413
9/941.740.13.89/1285.571.216.7
9/1033.932.83.29/1374.863.814.6
Total114.7109.44.6Total228.6194.415.0
Table 9. Range analysis data and results.
FactorsLevelsDPRank
1234
RRC1.321.2621.0721.0080.3111
ST1.0031.1421.2251.2930.292
TCDS1.3191.1781.0911.0740.2453
LAI1.1561.1141.1481.2450.1324
LE1.1011.1921.2181.1510.1165
SAS1.2361.151.1381.1390.0996
Blank column1.1991.121.1591.1840.0797
LR1.1321.1471.1791.2050.0738
Blank column1.1371.1971.1721.1570.0619
SVMCS1.1861.1341.1681.1760.05210
VAS1.1391.1891.1861.1490.0511
RVMCS1.1791.1521.1461.1860.0412
HP1.1521.1681.1521.190.03813
Blank column1.1521.1681.191.1530.03814
SR1.1431.181.171.1690.03815
Blank column1.1511.1591.1711.1820.03116
DDS1.1511.1761.1741.1620.02617
TAS1.1561.1551.1781.1740.02418
Blank column1.1611.1651.1621.1740.01319
SHDS1.1681.1591.1691.1670.0120
MSR1.1661.1631.1661.1680.00621
Table 10. ANOVA of the green roof factors and the cooling load savings rates.
SourcedfPDRPVPFP
RRC31.066640.35554846.66
ST30.749390.24979832.78
TCDS30.602310.2007726.35
LAI30.151790.0505966.64
LE30.123750.0412515.41
SAS30.10840.0361334.74
LR30.051590.0171962.26
VAS30.031330.0104441.37
SVMCS30.024770.0082561.08
RVMCS30.019080.006360.83
HP30.01580.0052680.69
SR30.012560.0041880.55
TAS30.007090.0023650.31
DDS30.006750.0022510.3
SHDS30.000940.0003130.04
MSR30.000260.0000850.01
Blank rows150.11430.00762
Total633.08676