Article

Noise Reduction of an Extinguishing Nozzle Using the Response Surface Method

1
Graduate School of Mechanical Engineering, Sungkyunkwan University, Suwon 16419, Korea
2
Senior Research Fellow, Department of Future Technology and Convergence Research, Korea Institute of Civil Engineering and Building Technology, Goyang 10223, Korea
3
School of Mechanical Engineering, Sungkyunkwan University, Suwon 16419, Korea
*
Author to whom correspondence should be addressed.
Energies 2019, 12(22), 4346; https://doi.org/10.3390/en12224346
Submission received: 29 October 2019 / Revised: 11 November 2019 / Accepted: 11 November 2019 / Published: 15 November 2019

Abstract

:
An inert gas such as nitrogen is used as an extinguishing agent to suppress unexpected fire in places such as computer rooms and server rooms. The gas released with high pressure causes noise above 130 dB. According to recent studies, loud noise above 120 dB has a strong vibrational energy that leads to a negative influence on electronic equipment with a high degree of integration. In this study, a basic fire-extinguishing nozzle with absorbent was selected as the reference model, and numerical analysis was conducted using the commercial software, ANSYS FLUENT ver. 18.1. A total of 45 experiment points was selected using the design of experiment (DOE) method. An optimum point was derived using the response surface method (RSM). Results show that the vibrational energy of the noise was reduced by minimizing the turbulence kinetic energy. Pressure and velocity distributions were calculated and graphically depicted with various absorbent configurations.

1. Introduction

Gaseous fire suppression is one of the fire-extinguishing systems used to protect equipment that is easily damaged by water, such as electronic equipment, film, and computers in data storage facilities, by using inert gases or chemical agents as extinguishing agents. These agents are clean, non-conductive, and free from chemicals and residues, unlike water or powder fire-extinguishing agents.
The most popular fire-extinguishing agents in the past were those extinguishing agents that included halon because they are the most efficient material for the mechanism that is used in gaseous fire suppression. They choke a fire by blocking oxygen and their low temperature suppresses the flame. However, halon is considered the main factor in ozone depletion; hence, it was banned by the Montreal protocol. As a result, many studies have been conducted to replace halogen agents, and inert gases such as argon, nitrogen, and carbon dioxide are now used [1,2,3,4].
Figure 1 shows the schematic diagram of the gaseous fire-suppression system, which consists largely of storage, operator, controller, valves, pipe, and nozzle. The storage cylinders are typically designed to compress the extinguishing agents at more than 20 MPa, for minimizing space occupied in the room and maximizing the mass of the extinguishing agent. The pipes and nozzle are designed to endure this high pressure. Although these systems are enough to suppress fires and are not dangerous to residents, new problems have recently begun to arise. Due to the development of technology, semiconductors, computers, and medical devices are becoming smaller and more sophisticated. Because of this, equipment is easily damaged by physical impact. The typical example is the strong noise from gaseous fire-suppression systems stopping computerized equipment [5]. Mann and Coll [6] issued a warning with the results of a study indicating that the strong noise caused by gaseous fire-suppression systems causes failure of the hard disk drive function. Many other studies have shown that a typical gaseous fire-suppression system causes more than 130 dB of noise, which can adversely affect the functioning of most electronic data devices [7,8].
In general, design problems in engineering are addressed by conducting parameter studies to find the best design points within an acceptable range. However, the interactions between design variables and their causality are non-linear because the relationship between factors and outcomes is complex; hence, it is difficult to quantify their relationship. In the past, it was possible to observe by physical experiments only, with lots of time and money. However, due to the development of computers in modern times, computational fluid dynamics (CFD) is used in many areas to replace these experiments, and it helps to reduce these problems. Thus, the design of experiment (DOE) method, which is one of the experimental planning methods, is used to design efficient parameters of experiments and to analyze meaningful results [9]. Moreover, recent studies have been drawing attention to finding the optimum design, using the statistical approximation method of the response surface method (RSM) and the results of several cases calculated with CFD [10,11].
Palacz (et al. [12]) studied ejector mixing section optimization by using a genetic and evolutionary algorithm with CFD, based on the homogeneous equilibrium model. Kurimoto (et al. [13]) used RSM to optimize the mixing performance of a diesel spray nozzle, and Cheng (et al. [14]) used CFD with the Kriging algorithm, one of the RSM methods, to minimize the loss of fluid dynamics in the pintle nozzle.
Although the demand for low-noise gaseous fire suppression is expected to increase gradually, not much research has been done yet. Furthermore, nobody has conducted a study on the noise of the fire-extinguishing nozzle using CFD and RSM techniques. In this study, a new silent fire-extinguishing nozzle model was presented, and optimization was carried out through those techniques. The purpose of this paper is to suppress the noise generated by the gas flow of the fire-extinguishing nozzle.
The strong noise problems of gas flow are easily found in areas of engineering applications other than fire-suppression systems, where many studies have been conducted to reduce the noise [15,16,17,18]. Hence, this study may be useful in solving those problems and can help many researchers.

2. Experiment

The experimental station was configured for the discharging test of the extinguishing agent of the gaseous fire-suppression system. This was constructed according to the schematic diagram, as shown in Figure 2. The results of the discharging test were used for the evaluation of the performance of the developed silent nozzle and the validation of the numerical analysis results.
The experimental station consists of a storage container, operator, controller, valves, pipe, nozzle, and measuring instruments for pressure and temperature. It was constructed by considering the technical standard of the gaseous fire-suppression system design program [19] and the standard for acoustic power level measurements from air terminal units, dampers, and valves [20].
The extinguishing agent is IG-100 and two bottles of the storage cylinder, which weigh 23 kg, have 28 MPa of charge pressure, and 80 L of volume per bottle, were used. The storage cylinders were opened and closed by the control valve (see Figure 3).
The extinguishing agent was released while the control valve was operating, and transported to the ceiling of the experimental station through the pipe. The pressure and temperature data were obtained by each measuring instrument before discharging the extinguishing agent in the experimental room. The noise from the fire-extinguishing nozzle was measured using CESVA SC160 and recorded by a computer.

3. Numerical Analysis

Automated programs were developed to perform the fire-extinguishing nozzle optimization. ANSYS Workbench was used and a 3D model of the fire-extinguishing nozzle was used, as shown in Figure 4. Design variables included a total of 6 parameters (see Figure 4). The parameters were selected by considering whether they have structural stability and are easy to modify. They are as follows: X1 is inlet hole diameter; X2 and X3 consist of flow direction changer; X4 is diameter of downside nozzle; X5 is diameter of absorbent; X6 is outlet hole diameter.
The grid system for numerical analysis was created using ANSYS Meshing, as shown in Figure 5. Because making a fine and sophisticated grid system is important in numerical analysis, the domain was divided into several sections, and multi-block grids were created to obtain the highest mesh quality in each section. In addition, the grid system was validated by performing the grid dependency test (see Figure 6). The meshes for a quarter domain with approximately 6.14 million elements were selected.
Numerical analysis was performed using the commercial code ANSYS FLUENT ver. 18.1. Pressure and temperature values similar to experimental conditions were used as boundary conditions, and the clean extinguishing agent, IG-100, was applied as working fluid.
Computational aeroacoustics (CAA) were used to predict the discharge noise of extinguishing agents. Since sound generation and propagation are included in the compressive Navier–Stokes equation, high-resolution transient CFD simulation is required before performing CAA. In this study, the unsteady flow of turbulence was treated using large eddy simulation (LES), which is commonly used in the preceding computational aeroacoustics analysis [21,22,23]. In addition, a coupled solver was used to combine density-based solver and pressure-based solver. In particular, the pressure staggering option (PRESTO) scheme was applied as an interpolation method of pressure gradient. It is known to be suitable for natural convection treatment. Calculated CFD results were used to predict air acoustic nature using Ffowcs Williams and Hawkings’ (FW–H) acoustic theory, which is based on the expanded Lighthill’s acoustic analogy [24,25,26,27]. The sound pressure level (SPL) is defined as follows:
SPL = 20 log (Prms/P0),
where Prms is the root mean square of the pressure pulsation, and P0 is the reference acoustic pressure.
The frequency of interest was selected from 0 to 16 kHz. The external atmospheric conditions and additional boundary conditions are described in Table 1.

4. Design of Experiments

Sensitivity analysis is a statistical method that has been commonly used in the field of economics, where the uncertainty of various inputs is related [27]. Causal relationships in engineering are generally not linear and very complex, making them difficult to define mathematically. Therefore, finding the optimum points requires a sensitivity analysis of each factor, and this requires a sufficient amount of experimentation that can investigate causality. However, as the number of experiments increases, it takes a lot of time and money, so the DOE method is needed to design the most efficient experiment points [9].
The feature of the optimization study using CFD marks the difference between classical DOE technology and modern DOE technology. The modern techniques were created by developing the classical DOE technique on the assumption that no random errors would occur in experiments performed in the laboratory. Therefore, reliable trends can be extracted more efficiently than the traditional DOE techniques, such as the central composite design (CCD), Box–Behnken design, and full– and fractional–factorial design techniques [28].
In this study, the Latin hypercube sampling (LHS) method, which is one of the modern DOE techniques, was used for efficient design point selection. The LHS method was created by McKay (et al. [29]) as an alternative to the pseudo-Monte Carlo sampling method. It has a feature that the average value of a function can be predicted more accurately than the conventional sampling method. The most attractive feature of the LHS technique is that one can select a sample type among the classical DOE techniques to determine the number of DOE points that the algorithm needs to generate. In this study, the LHS technique, which has the CCD sampling type that was used, resulted in the same number of design points as when the classical CCD technique was used. Table 2 shows the design points obtained with the classical CCD sampling technique alone, and Table 3 shows the design points calculated with the LHS technique.
As described above, the two design point groups have the same number of design points. As shown in Table 2, however, it can be seen that in the case of CCD, all six design variables are not changed; only one or a few variables are changed, and other design variables are kept constant. On the other hand, the LHS method can see each design point spread evenly across all regions, unlike the CCD method.

5. Genetic Algorithm

A typical response surface method (RSM) is a method that approximates and models the relationship of sampled design points in the form of polynomials, enabling quick and easy fitting for sampled design points, and finding the steepest rise point (optimum point) of the response surface created within the solution space [30]. The RSM can curve, fitting quickly to find the optimal point, but it is the simplest method. Therefore, additional methods are needed to solve complex engineering problems. Genetic algorithm (GA) is a method based on natural selection to solve optimization problems. Recently, many researchers have conducted optimal design studies combining the RSM with GA, and proved its effect [11,31,32,33,34].
In this study, we also used the RSM and GA to predict the optimal point for the optimization of the gas fire-extinguishing nozzle with six variables.

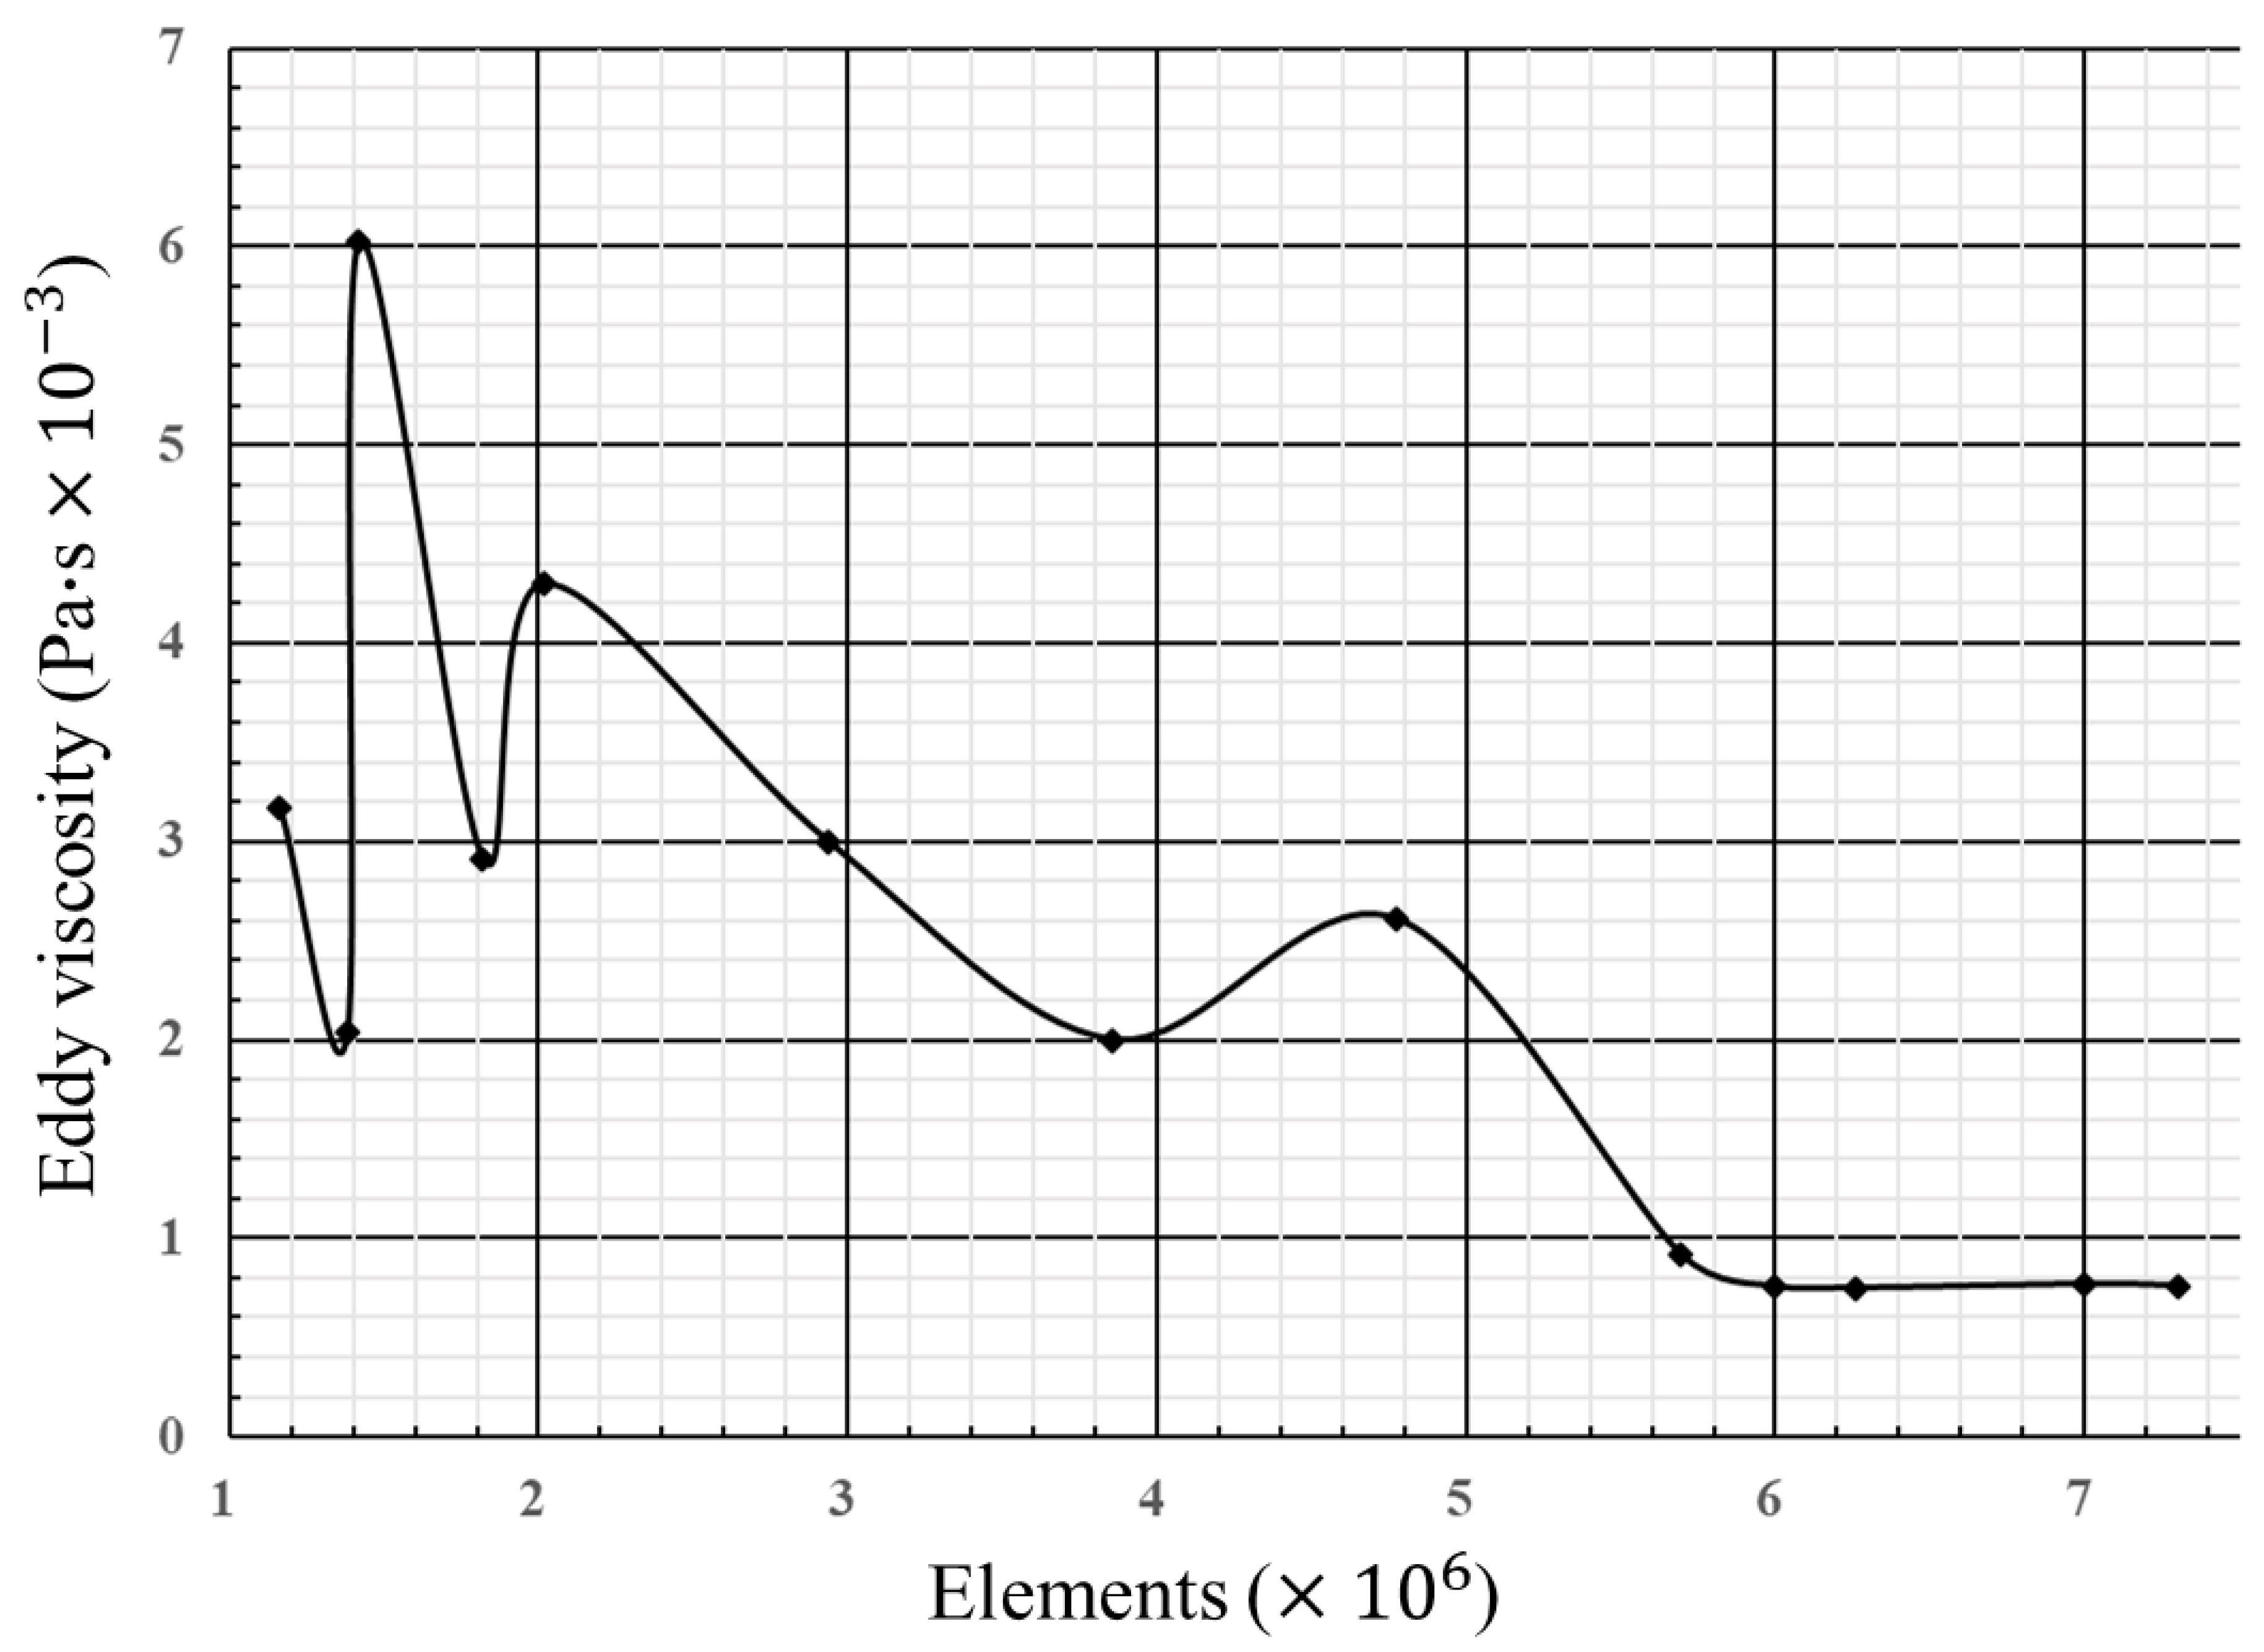
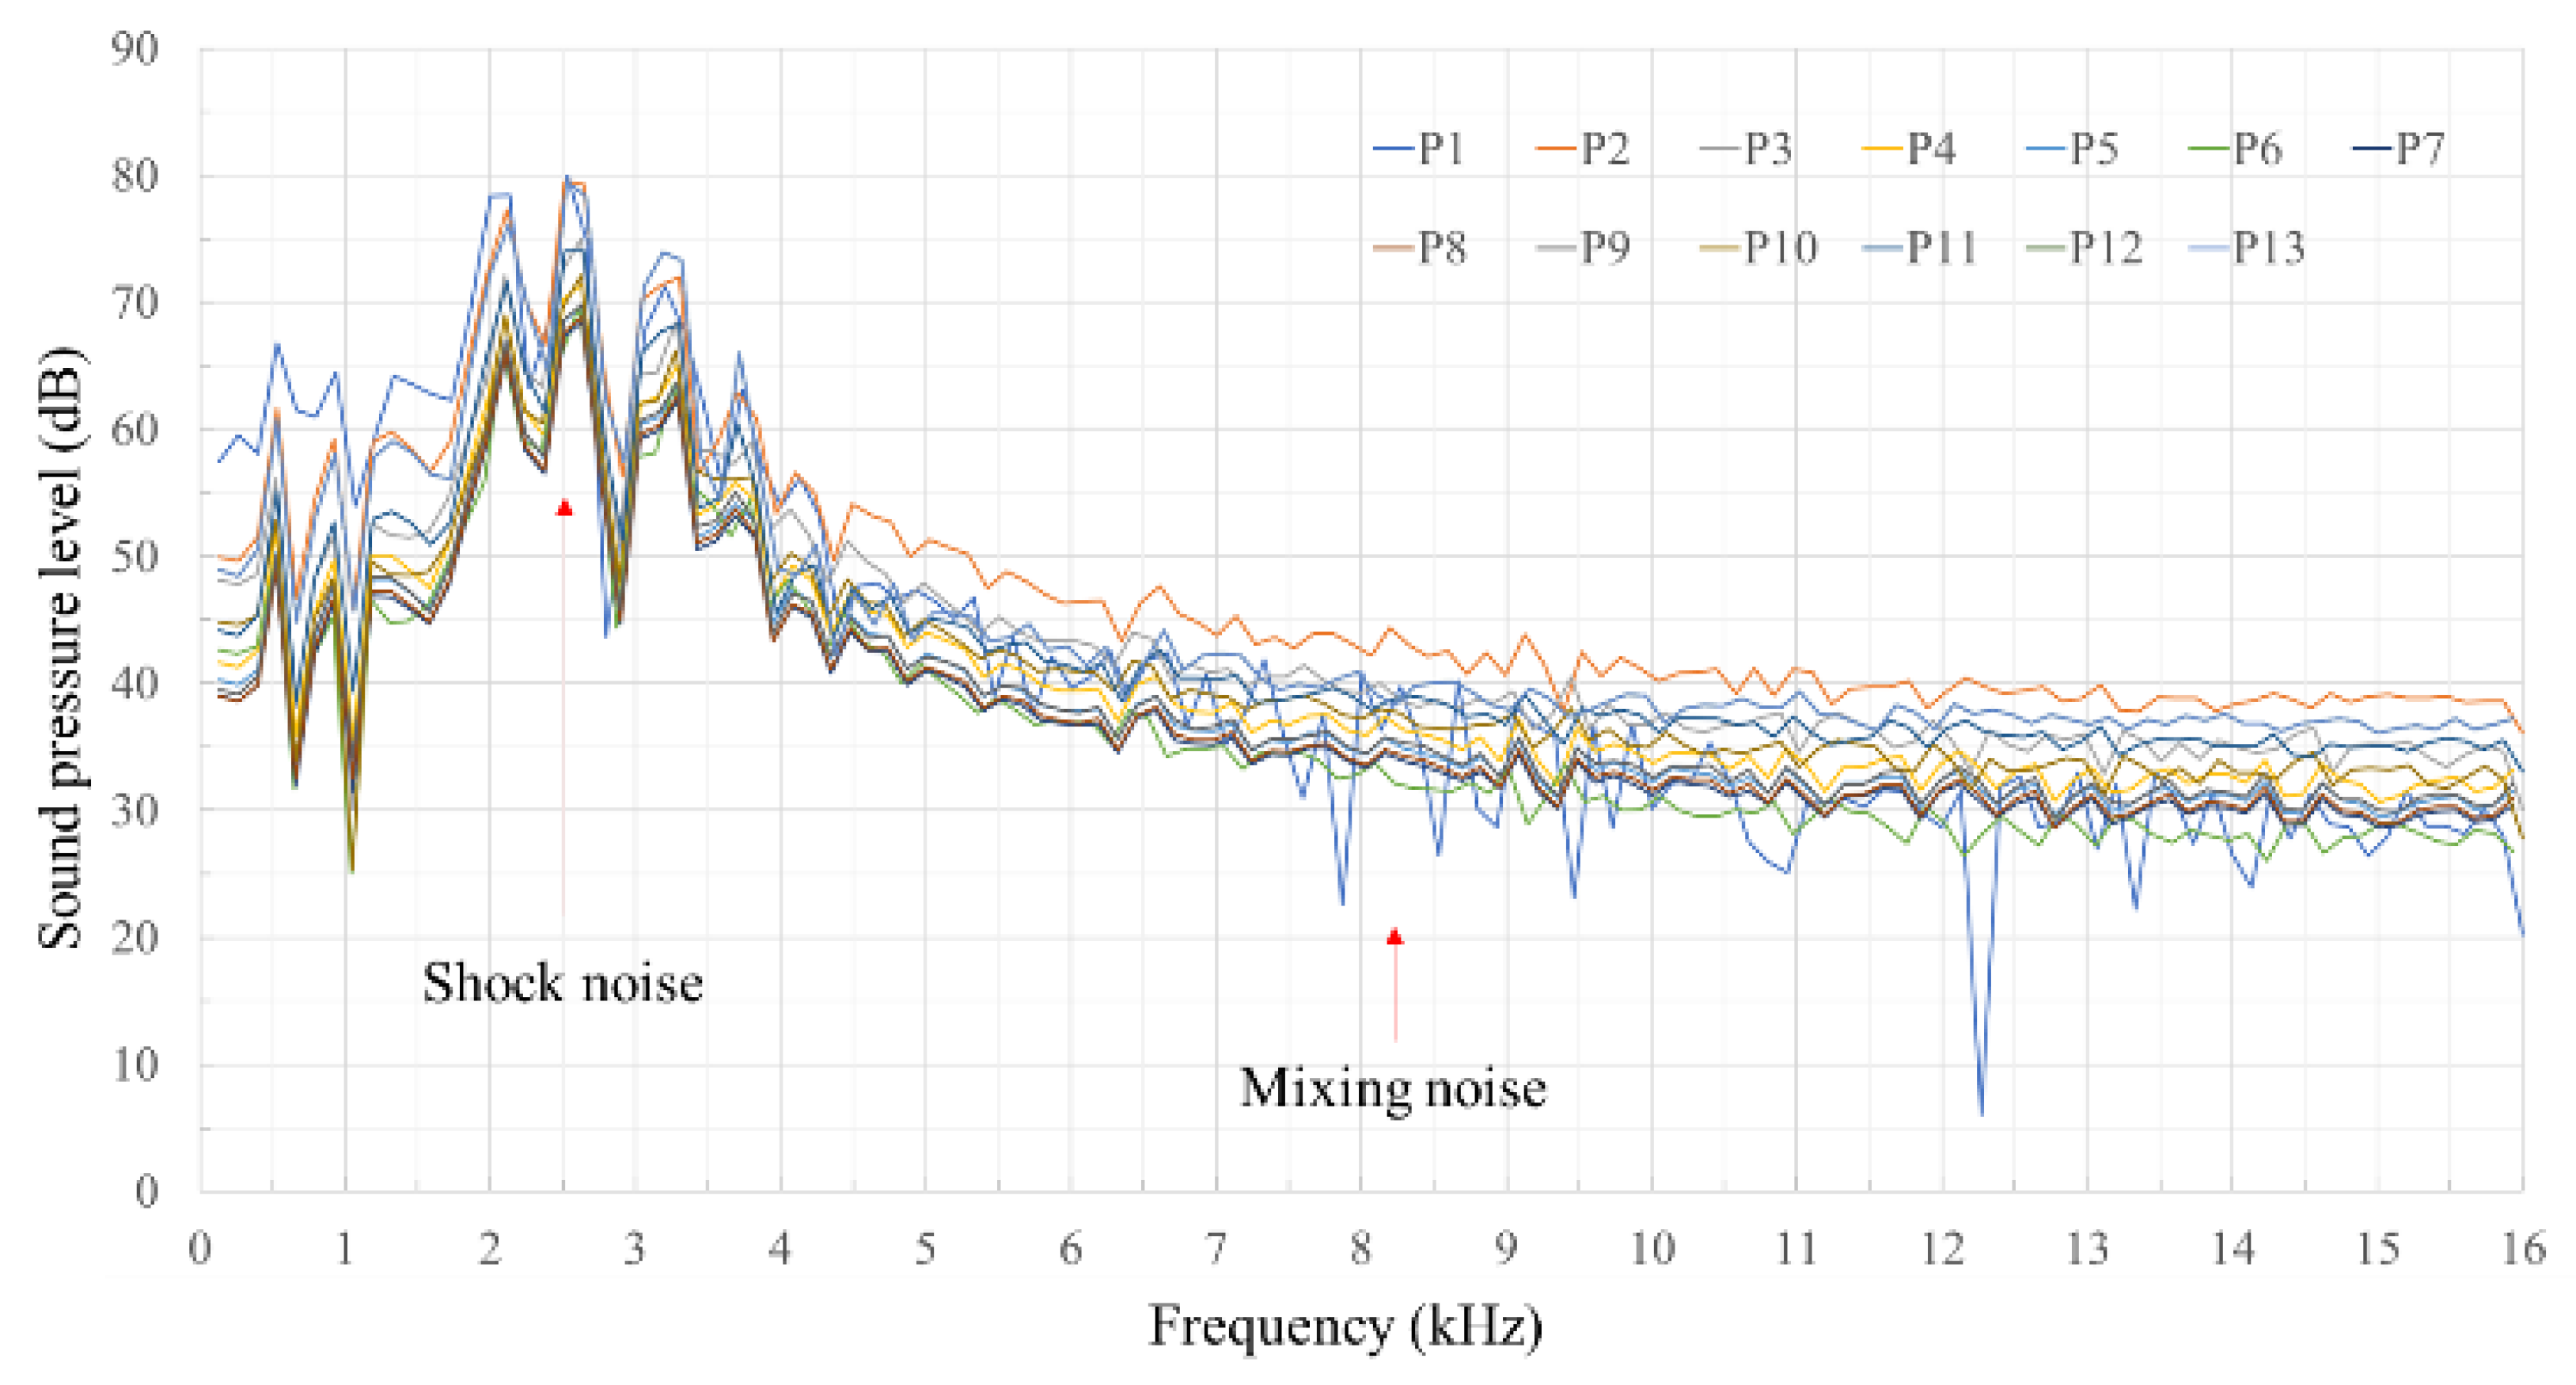
6. Validation of CFD Results

6.1. Validaition

The experimental data were used to validate the CFD results. Table 4 shows the comparison of the results; the relative error rate was calculated using the following formula:
| (Exp.data − CFD data)/(Exp.data) | × 100 (%),
Since the relative error rate is approximately within 1%, the CFD results can be considered to predict the noise that is emitted from the actual fire-extinguishing nozzle relatively accurately.

6.2. Reference Model

Prior to the optimal design study, the noise emitted from the reference model was calculated as the sound pressure level from a total of 13 monitoring points that changed by 15 degrees in the spherical coordinate system. Then, the noise characteristics were investigated by plotting the sound pressure levels for each frequency, as shown in Figure 7.
It was confirmed that the noise generated by the fire-extinguishing nozzle consisted of shock wave and turbulence mixed noise. These types of noise are caused by the eddy viscosity and vorticity of fluid [35,36]. Therefore, they were selected as the objective function for the optimization study, and the silent fire-extinguishing nozzle was expected to be designed by minimizing them.

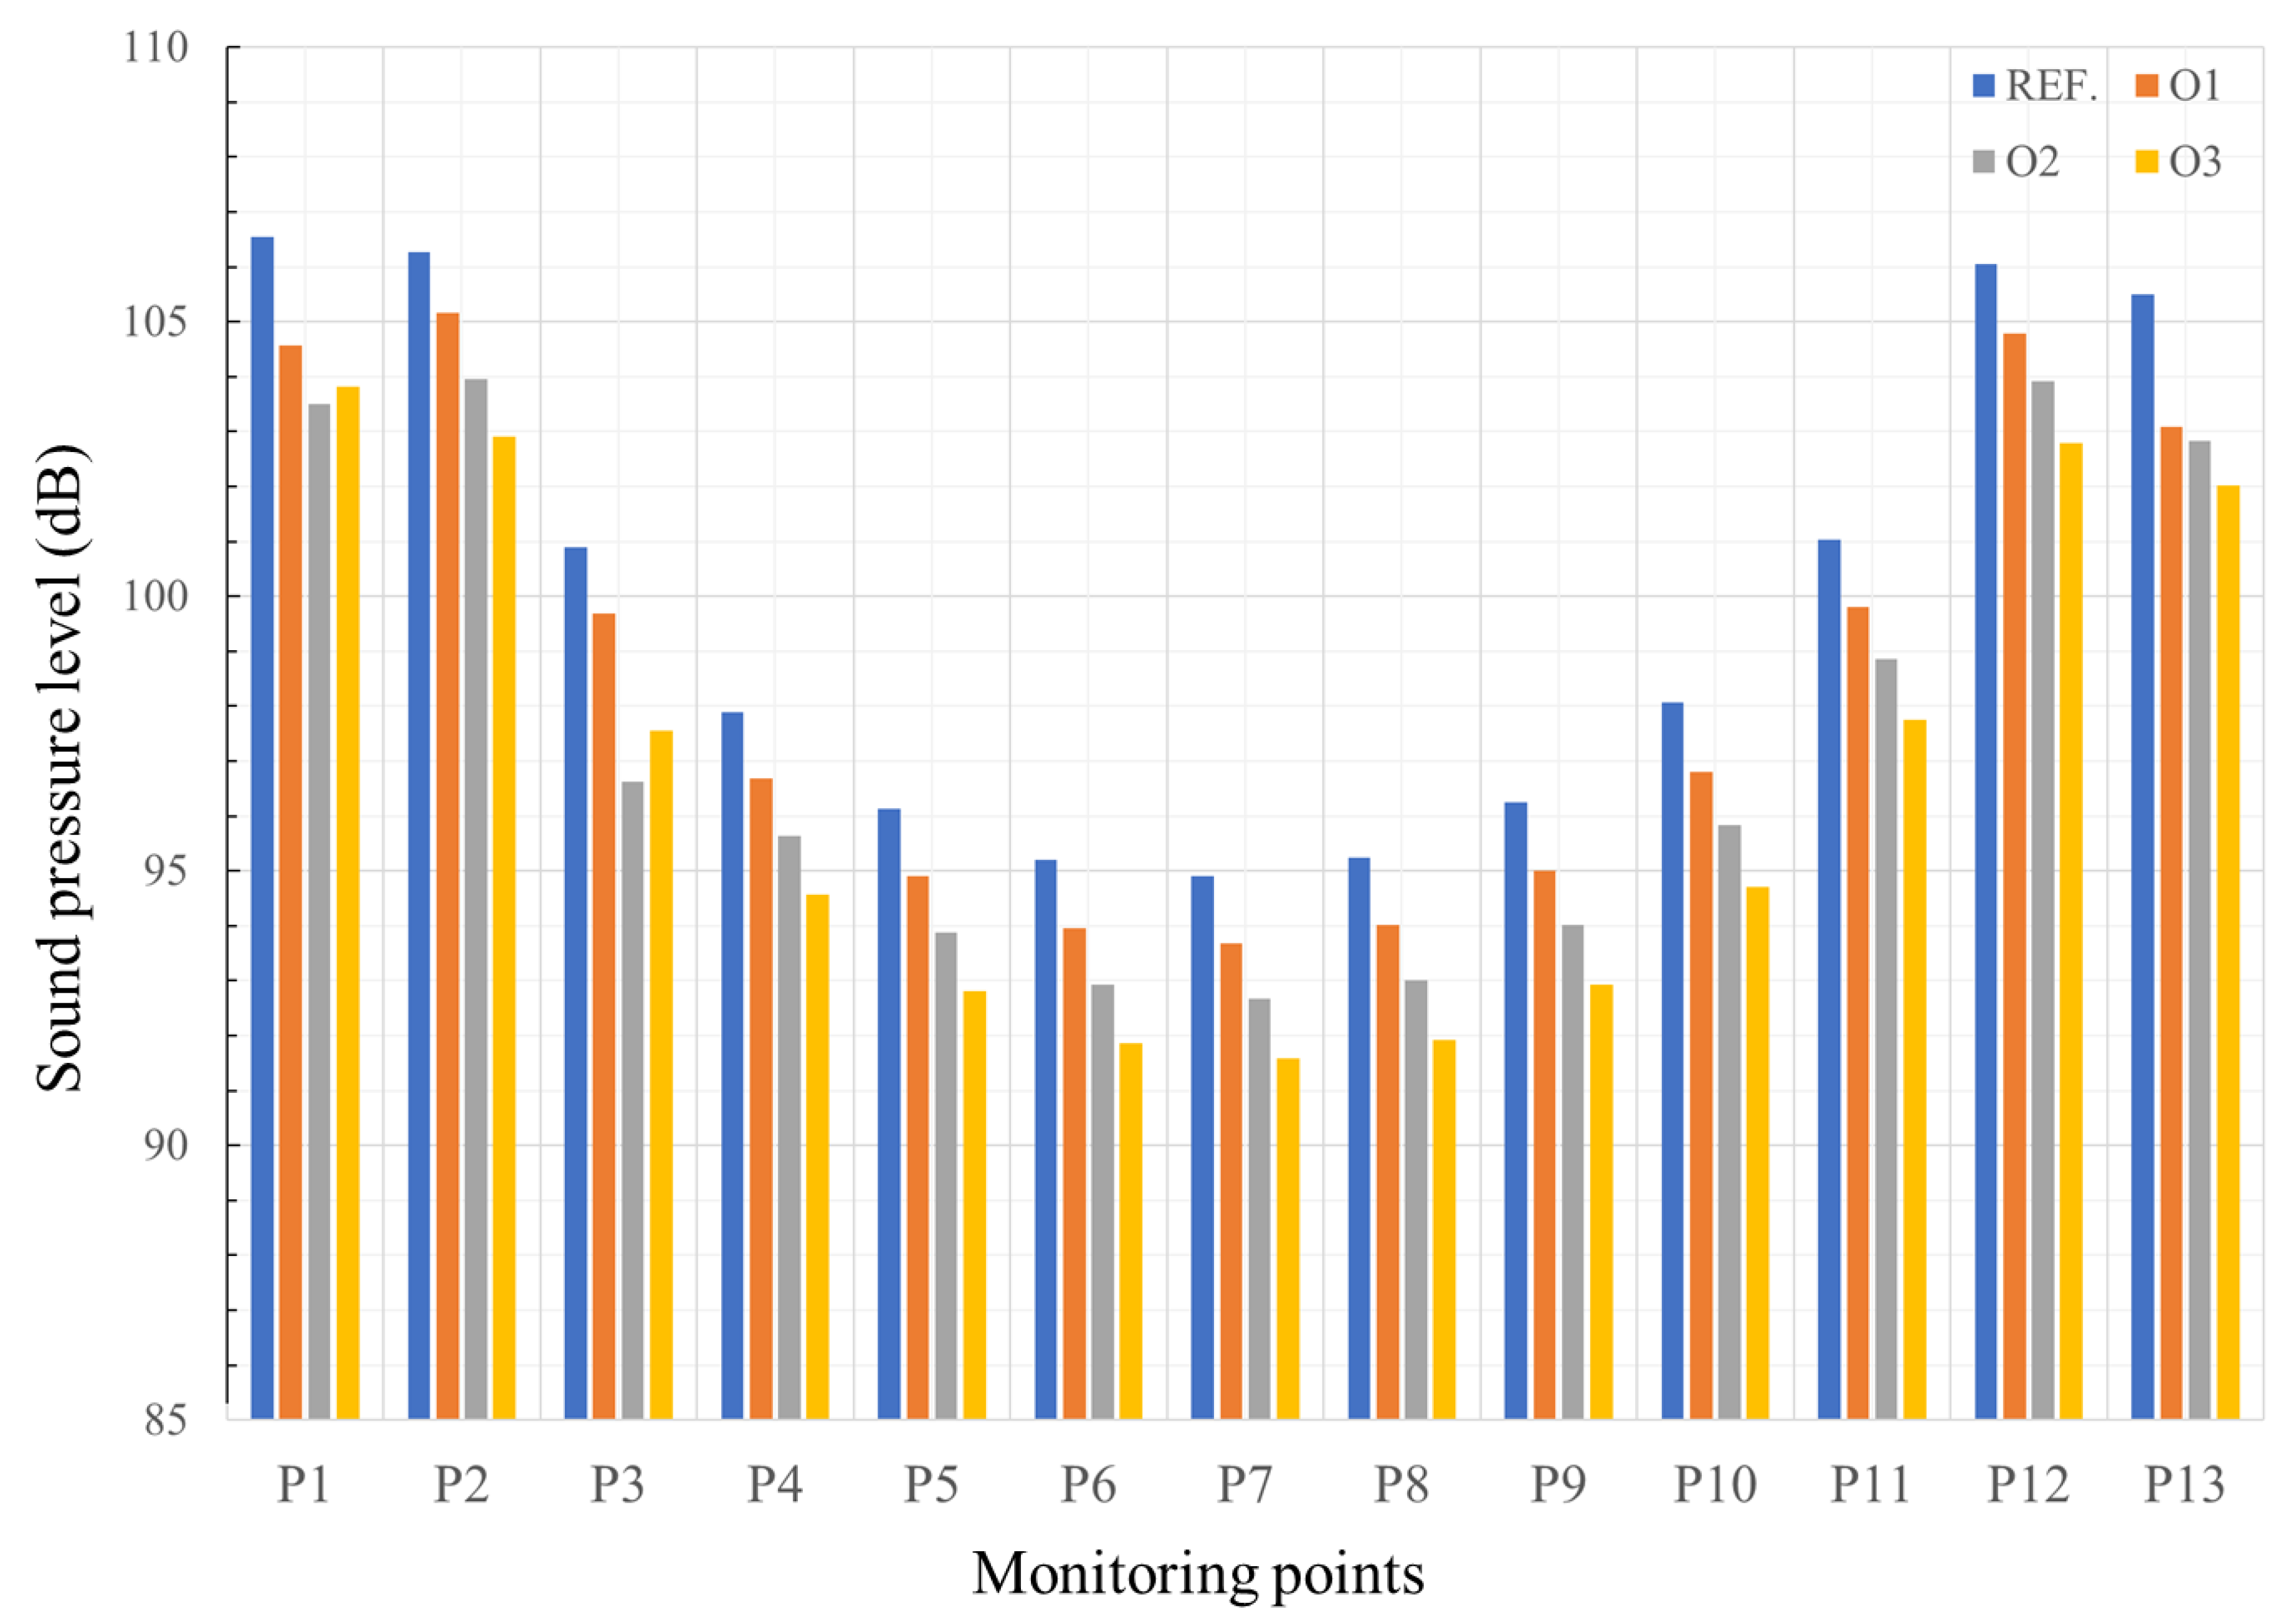
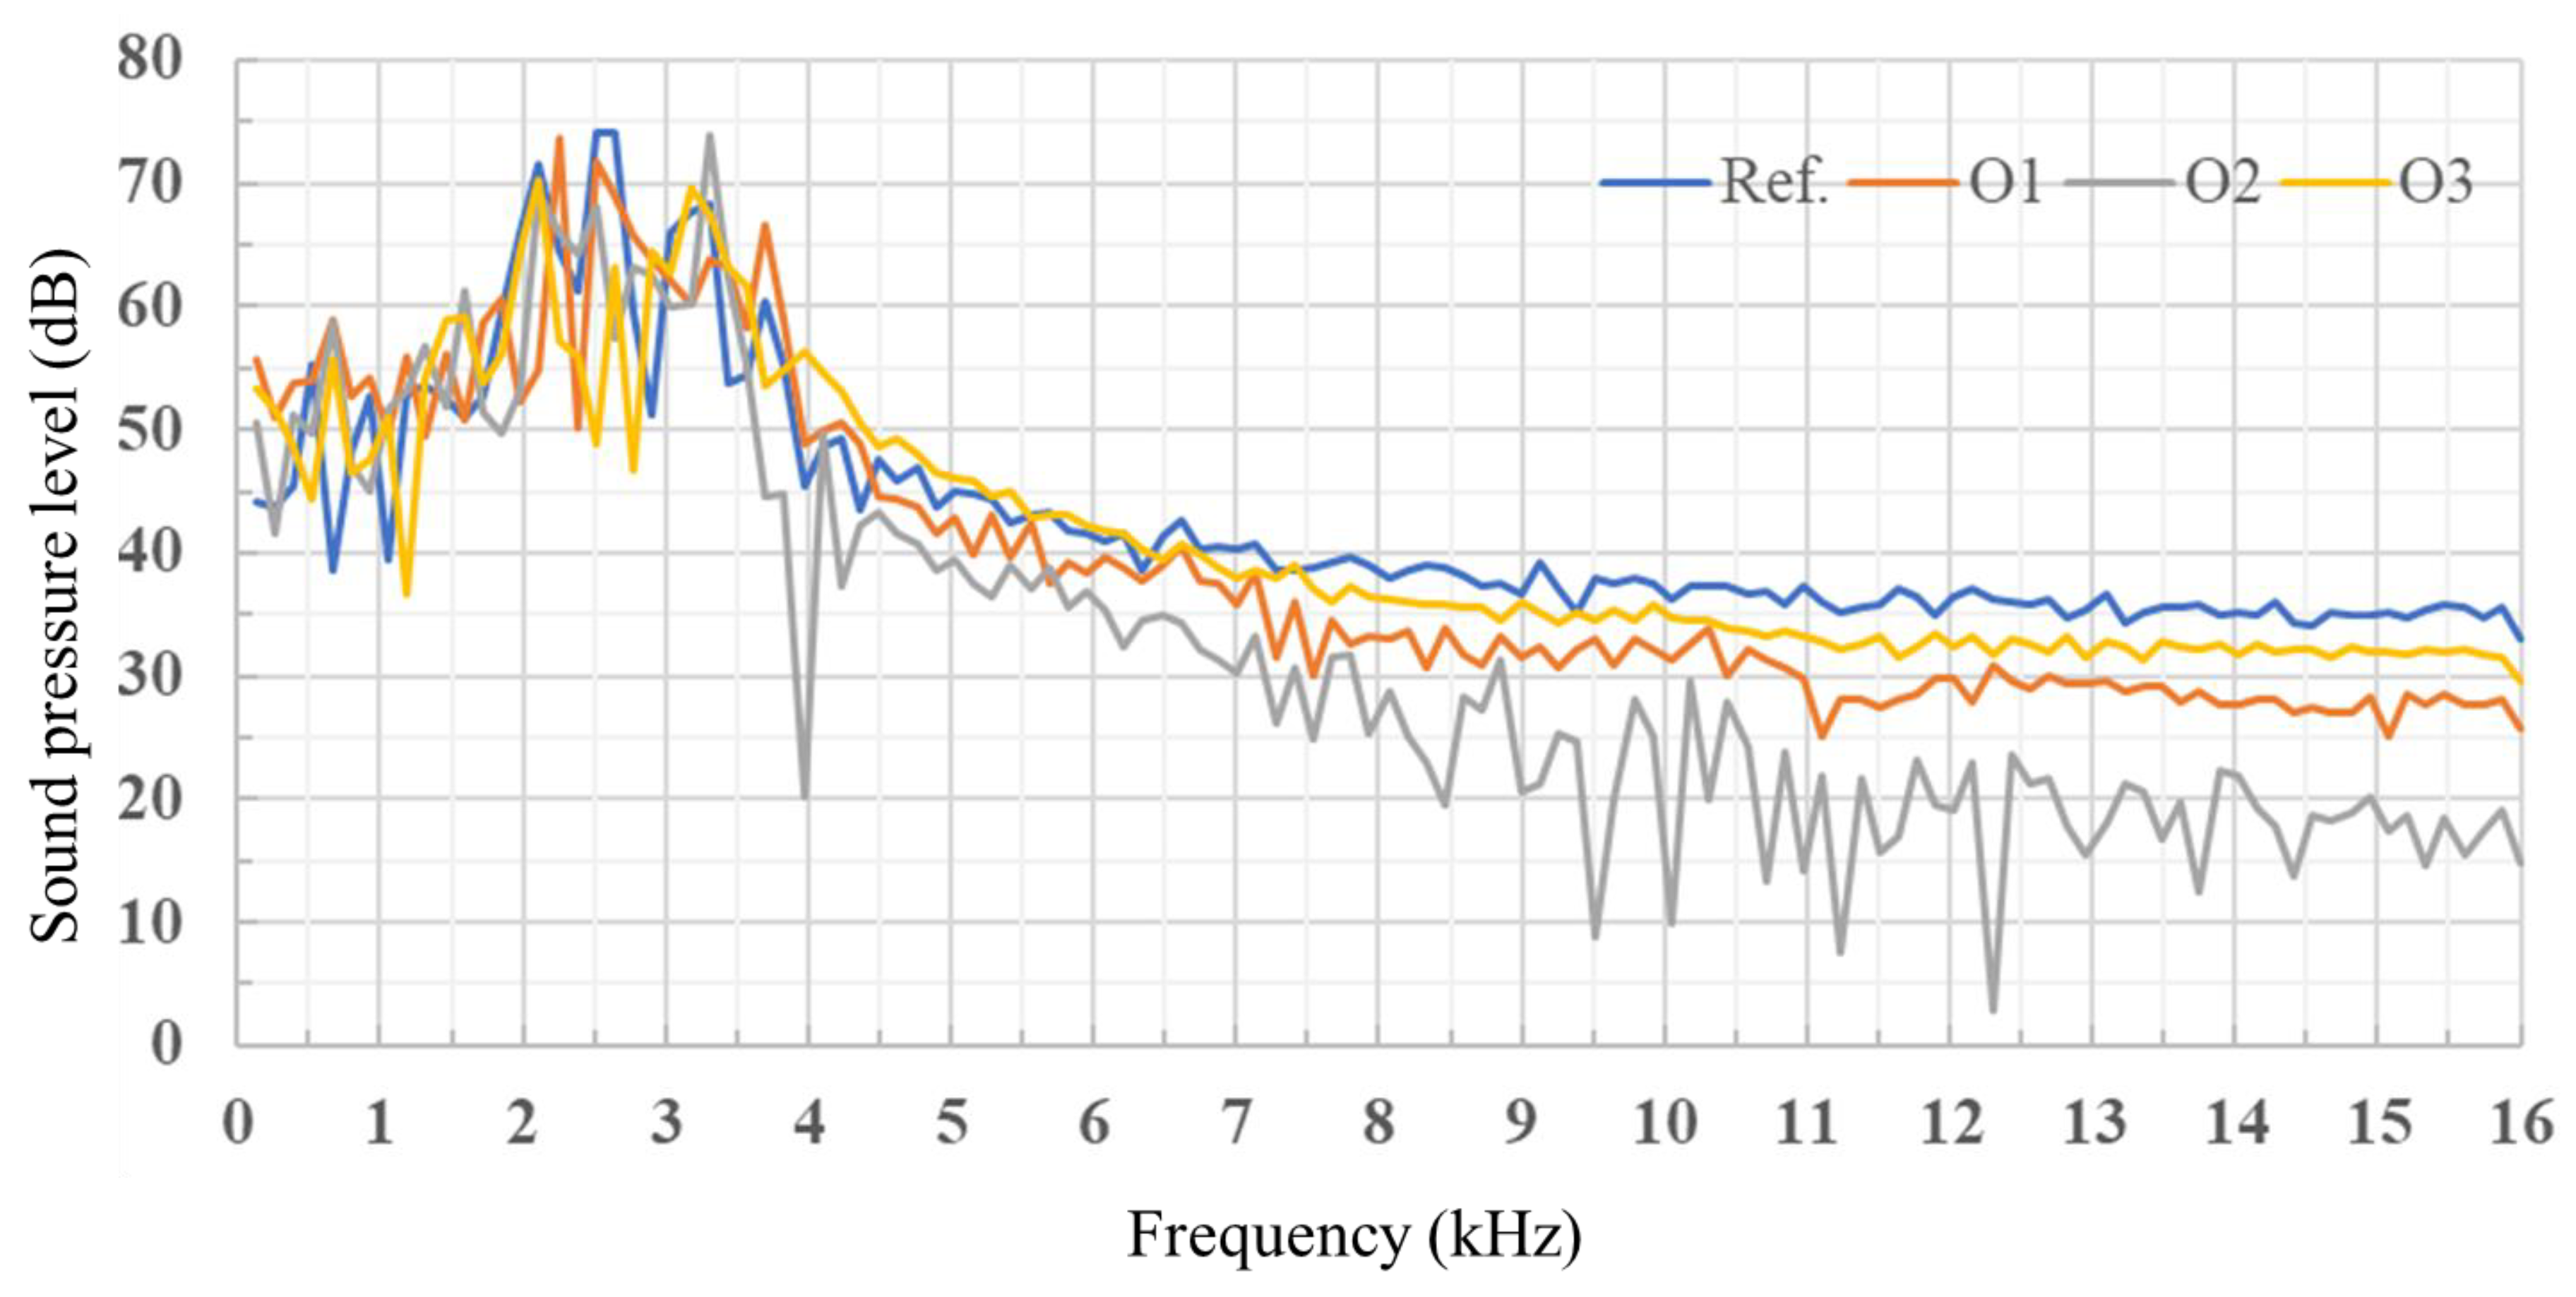
7. Optimal Design Results

The results of the reference model calculated with CFD were used as initial data to make design points. A total of 45 design points was created using the CCD-based LHS method, and a total of three optimal designs (O1, O2, and O3) were derived through the RSM and GA processes (see Table 5).
The derived optimum design points and reference model were evaluated using the sound pressure levels from a total of 13 monitoring points; the results of the overall sound pressure level (OSPL) in each monitoring point are illustrated in Figure 8. For the OSPL, the third optimal design (O3) among the majority of monitoring points showed low sound pressure levels.
A comparison of sound pressure levels with frequencies at the 11th monitoring point is shown in Figure 9. The mixing noise of the second optimal design (O2) was shown to be significantly lower than that of the other models. However, for the case of shock wave noise, the lowest value was shown in the third optimal design (O3). The reference model has a peak noise of 74.05 dB, while the O3 has a peak noise of 70.29 dB. This value is greatly lower than 73.72 dB in the first optimal design (O1) and 73.85 dB in the second optimal design (O2). This is why O3 has the lowest OSPL value. The third optimal design (O3), which has the least noise, was selected as the final optimal design. The selected design showed that the sound pressure level was calculated to average 3.3% lower than the reference model.

8. Conclusions

As a result of this study, the following conclusions were obtained:
(1) The CFD results were verified by comparison with experimental data, and it was confirmed that the extinguishing agent discharged from the gaseous fire-extinguishing nozzle caused the flow noise composed of shock wave noise and turbulence mixed noise.
(2) Six design variables were selected for the development of the silent gaseous fire-extinguishing nozzle and a total of 45 design points were derived using the modern DOE technique.
(3) The GA and RSM were used to predict the total of three optimum designs and the final optimal design was derived by comparing these SPL values.
(4) The most influential variable was the diameter of the absorbent, followed by the inlet diameter of the lower body. The optimum design point was found to have a 3.3% lower overall sound pressure level compared to the reference model.

Author Contributions

Supervision, Y.-J.K.; writing original draft, Y.-H.K. writing review and editing, Y.-H.K., M.L. and I.-J.H. All authors contributed to the manuscript. All authors read and approved the final manuscript.

Funding

This research was supported by a grant (19TBIP-C127229-03) from Ministry of Land Transportation Technology Business Support Program funded by Ministry of Land, Infrastructure and Transport of Korean government.

Acknowledgments

This research was supported by a grant (19TBIP-C127226-03) from commercialization of national transportation technology funded by the Ministry of Land, Infrastructure and Transport of the Korean Government.

Conflicts of Interest

The authors declare no conflicts of interest.

References

  1. Moore, T.A.; Yamada, N. Nitrogen Gas as a Halon Replacement. In Proceedings of the Halon Options Technical Working Conference, Albuquerque, NM, USA, 12–14 May 1998; pp. 330–338. [Google Scholar]
  2. Saito, N.; Saso, Y.; Ogawa, Y.; Otsu, Y.; Kikui, H. Fire Extinguishing Effect of Mixed Agents of Halon 1301 and Inert Gases. Fire Saf. Sci. 1997, 5, 901–910. [Google Scholar] [CrossRef]
  3. Saito, N.; Ogawa, Y.; Saso, Y.; Liao, C.; Sakei, R. Flame-Extinguishing Concentrations and Peak Concentrations of N2, Ar, CO2 and Their Mixtures for Hydrocarbon Fuels. Fire Saf. Sci. 1996, 27, 185–200. [Google Scholar] [CrossRef]
  4. Su, J.Z.; Kim, A.K.; Crampton, G.P.; Liu, Z. Fire Suppression with Inert Gas Agents. Fire Prot. Eng. 2001, 11, 72–87. [Google Scholar] [CrossRef]
  5. Fire Drill Knocks ING Bank’s Data Centre Offline, BBC NEWS Homepage. Available online: https://www.bbc.com/news/technology-37337868 (accessed on 12 September 2016).
  6. Mann, M.T.; Coll, M. Potential Problems with Computer Hard Disks When Fire Extinguishing Systems are Released; A White Paper issued by Siemens; Siemens Switzerland Press: Zug, Switzerland, 2011. [Google Scholar]
  7. Dutta, T.; Barnard, A.R. Performance of Hard Disk Drives in High Noise Environments. Noise Control Eng. J. 2017, 65, 386–395. [Google Scholar] [CrossRef]
  8. Nickerson, M.L.; Green, K.; Pai, N. Tonal Noise Sensitivity in Hard Drives. Proc. Mtgs. Acoust. 2013, 20, 040006. [Google Scholar] [CrossRef]
  9. Fisher, R.A. The Design of Experiments, 5th ed.; Hafner Publishing Company Press: New York, NY, USA, 1949. [Google Scholar]
  10. Pei, Z.; Yu, C. Prediction of the Vortex Yarn Tenacity from Some Process and Nozzle Parameters Based on Numerical Simulation and Artificial Neural Network. Text. Res. J. 2011, 81, 1796–1807. [Google Scholar]
  11. Corriveau, G.; Guilbault, R.; Tahan, A. Genetic Algorithms and Finite Element Coupling for Mechanical Optimization. Adv. Eng. Softw. 2010, 41, 422–426. [Google Scholar] [CrossRef]
  12. Palacz, M.; Smolka, J.; Kus, W.; Fic, A.; Bulinski, Z.; Nowak, A.J.; Banasiak, K.; Hafner, A. CFD-Based Shape Optimisation of a CO2 Two-Phase Ejector Mixing Section. Appl. Therm. Eng. 2016, 95, 62–69. [Google Scholar] [CrossRef]
  13. Kurimoto, N.; Suzuki, M.; Yoshino, M.; Nishijima, Y. Response Surface Modeling of Diesel Spray Parameterized by Geometries Inside of Nozzle. SAE Tech. Pap. 2011. No. 2011-01-0390. [Google Scholar] [CrossRef]
  14. Cheng, C.; Bao, F.T.; Xu, H. Optimization Design for Contour of Pintle Nozzle in Solid Rocket Motor Based on Response Surface Method. Adv. Mater. Res. 2014, 1016, 640–645. [Google Scholar] [CrossRef]
  15. Viswanathan, K. Nozzle Shaping for Reduction of Jet Noise from Single Jets. AIAA J. 2005, 43, 1008–1022. [Google Scholar] [CrossRef]
  16. Crouch, R.W.; Coughlin, C.L.; Paynter, G.C. Nozzle Exit Flow Profile Shaping for Jet Noise Reduction. J. Aircr. 1977, 14, 860–867. [Google Scholar] [CrossRef]
  17. Park, I.S.; Sohn, C.H.; Lee, S.; Song, H.; Oh, J. Flow-Induced Noise in a Suction Nozzle with a Centrifugal Fan of a Vacuum Cleaner and Its Reduction. Appl. Acoust. 2010, 71, 460–469. [Google Scholar] [CrossRef]
  18. Ostergaard, P.B. Determination of Sound-power Level of Air-conditioning Units. Noise Control 1957, 3, 35–56. [Google Scholar] [CrossRef]
  19. National Fire Agency (NFA). Act on Installation, Maintenance and Safety Management of Fire Fighting Facilities, NFSC 107A. Available online: http://law.go.kr/admRulLsInfoP.do?admRulSeq=2000000079343 (accessed on 20 August 2012).
  20. Korea Standards Association (KSA). Acoustic Power Level Measurement for Noise in Air Terminal Units, Air Terminal Units, Dampers and Valves in the Reverberation Room, KS I ISO 5135. Available online: https://www.standard.go.kr/KSCI/standardIntro/getStandardSearchView.do?menuId=919&topMenuId=502&upperMenuId=503&ksNo=KSIISO5135&tmprKsNo=KSIISO5135&reformNo=02 (accessed on 31 December 2014).
  21. Magagnato, F.; Sorgüven, E.; Gabi, M. Far Field Noise Prediction by Large Eddy Simulation and Ffowcs Williams Hawkings Analogy. In Proceedings of the 9th AIAA/CEAS Aeroacoustics Conference and Exhibit, Hilton Head, SC, USA, 12–14 May 2003; p. 3206. [Google Scholar]
  22. Ihme, M.; Bodony, D.; Pitsch, H. Prediction of Combustion-Generated Noise in Non-Premixed Turbulent Jet Flames Using LES. In Proceedings of the 12th AIAA/CEAS Aeroacoustics Conference (27th AIAA Aeroacoustics Conference), Cambridge, MA, USA, 8 May 2006; p. 2614. [Google Scholar]
  23. Kaltenbacher, M.; Escobar, M.; Becker, S.; Ali, I. Numerical Simulation of Flow-induced Noise Using LES/SAS and Lighthill’s Acoustic Analogy. Int. J. Numer. Methods Fluids 2010, 63, 1103–1122. [Google Scholar] [CrossRef]
  24. Lighthill, M.J. On Sound Generated Aerodynamically I. General Theory. Proc. R. Soc. Lond. Ser. A Math. Phys. Sci. 1952, 211, 564–587. [Google Scholar]
  25. Ffowcs Williams, J.E.; Hawkings, D.L. Sound Generation by Turbulence and Surfaces in Arbitrary Motion. Philos. Trans. R. Soc. Lond. Ser. A Math. Phys. Sci. 1969, 264, 321–342. [Google Scholar] [CrossRef]
  26. Lighthill, M.J. On Sound Generated Aerodynamically II. Turbulence as a Source of Sound. Proc. R. Soc. Lond. Ser. A Math. Phys. Sci. 1954, 222, 1–32. [Google Scholar]
  27. Gourieroux, C.; Laurent, J.P.; Scaillet, O. Sensitivity Analysis of Values at Risk. J. Empir. Financ. 2000, 7, 225–245. [Google Scholar] [CrossRef]
  28. Giunta, A.; Wojtkiewicz, S.; Eldred, M. Overview of Modern Design of Experiments Methods for Computational Simulations. In Proceedings of the 41st Aerospace Sciences Meeting and Exhibit, Reno, NV, USA, 6–9 January 2003; p. 649. [Google Scholar]
  29. McKay, M.D.; Beckman, R.J.; Conover, W.J. A Comparison of Three Methods for Selecting Values of Input Variables in the Analysis of Output from a Computer Code. Technometrics 2000, 42, 55–61. [Google Scholar] [CrossRef]
  30. Carroll, C.W. The Created Response Surface Technique for Optimizing Nonlinear, Restrained Systems. Oper. Res. 1961, 9, 169–184. [Google Scholar] [CrossRef]
  31. Holland, J.H. Genetic Algorithms. Sci. Am. 1992, 267, 66–73. [Google Scholar] [CrossRef]
  32. Goldberg, D.E.; Holland, J.H. Genetic Algorithms and Machine Learning. Mach. Learn. 1988, 3, 95–99. [Google Scholar] [CrossRef]
  33. Renner, G.; Ekárt, A. Genetic Algorithms in Computer Aided Design. Comput.-Aided Des. 2003, 35, 709–726. [Google Scholar] [CrossRef]
  34. Srivastava, A.; Singh, V.; Haque, S.; Pandey, S.; Mishra, M.; Jawed, A.; Tripathi, C.K.M. Response Surface Methodology-Genetic Algorithm Based Medium Optimization, Purification, and Characterization of Cholesterol Oxidase from Streptomyces Rimosus. Sci. Rep. 2018, 8, 10913. [Google Scholar] [CrossRef]
  35. Powell, A. On the Noise Emanating from a Two-Dimensional Jet Above the Critical Pressure. Aeronaut. Q. 1953, 4, 103–122. [Google Scholar] [CrossRef]
  36. Norum, T.D.; Seiner, J.M. Broadband Shock Noise from Supersonic Jets. AIAA J. 1982, 20, 68–73. [Google Scholar] [CrossRef]
Figure 1. Schematic diagram of the gaseous fire-suppression system.
Energies 12 04346 g001
Figure 2. Schematic of the test station.
Energies 12 04346 g002
Figure 3. Configuration of the experimental station. 1. Storage cylinder; 2. Control valve; 3. Discharge pipe; 4. Pressure-measuring instrument; 5. Temperature-measuring instrument; 6. Fire-extinguishing nozzle; 8. CESVA SC160.
Energies 12 04346 g003
Figure 4. Configuration of the fire-extinguishing nozzle.
Energies 12 04346 g004
Figure 5. Structure of the grid system for a quarter domain.
Energies 12 04346 g005
Figure 6. Grid dependency test.
Energies 12 04346 g006
Figure 7. The sound pressure level (SPL) distributions for frequencies in the reference model.
Energies 12 04346 g007
Figure 8. Comparison of the OSPL distributions at each monitoring point.
Energies 12 04346 g008
Figure 9. Comparison of sound pressure levels for frequencies at the 11th monitoring point.
Energies 12 04346 g009
Table 1. Boundary conditions.
DescriptionValue
Turbulence modelLarge eddy simulation
Acoustic modelFW-H
Far-field density [kg/m3]1.225
Far-field sound speed [m/s]340
reference acoustic pressure [Pa]2 × 10⁻⁵
Frequency range [kHz]0–16
Inlet pressure [MPa]5.95
Inlet temperature [K]103.25
Table 2. Design points of central composite design (CCD).
NameX1X2X3X4X5X6
125172417674.5
222.5
327.5
42515.3
518.7
61721.6
726.4
82415.3
918.7
101760.3
1173.7
12674.05
134.95
1423.5549516.0173622.6127516.0173663.127264.23989
1526.4450516.017364.76011
1623.5549517.982644.76011
1726.4450517.982644.23989
1823.5549516.0173625.387254.76011
1926.4450516.017364.23989
2023.5549517.982644.23989
2126.4450517.982644.76011
2223.5549516.0173622.6127517.982644.76011
2326.4450516.017364.23989
2423.5549517.982644.23989
2526.4450517.982644.76011
2623.5549516.0173625.387254.23989
2726.4450516.017364.76011
2823.5549517.982644.76011
2926.4450517.982644.23989
3023.5549516.0173622.6127516.0173670.872744.76011
3126.4450516.017364.23989
3223.5549517.982644.23989
3326.4450517.982644.76011
3423.5549516.0173625.387254.23989
3526.4450516.017364.76011
3623.5549517.982644.76011
3726.4450517.982644.23989
3823.5549516.0173622.6127517.982644.23989
3926.4450516.017364.76011
4023.5549517.982644.76011
4126.4450517.982644.23989
4223.5549516.0173625.387254.76011
4326.4450516.017364.23989
4423.5549517.982644.23989
4526.4450517.982644.76011
Table 3. Design points of Latin hypercube sampling (LHS).
NameX1X2X3X4X5X6
124.3333317.2266723.7866715.4133372.364.58
225.3333317.9822226.1333316.3955661.644.64
322.5555617.0755623.1466717.0755666.702224.86
424.7777815.7155622.9333316.4711161.044444.36
522.7777815.3377823.3617.6044472.657784.3
627.1111115.5644424.6416.2444465.808894.94
724.6666717.5288922.416.6222264.915564.24
82718.057782416.1688972.062224.62
923.4444417.3022225.4933317.3022272.955564.78
1023.1111116.0933324.9618.2088970.275564.6
1123.7777816.3226.2417.98222674.66
122317.6044424.4266715.7911164.022224.52
1324.2222217.4533321.9733315.4888967.595564.76
1425.5555616.2444426.0266718.0577865.511114.16
1523.6666718.6622222.6133317.2266770.871114.06
1626.4444415.4133324.1066715.3377871.466674.18
1726.2222216.8488925.8133315.6466.404444.8
1825.2222216.7733321.6533317.8311173.551114.14
1922.8888918.3623.6818.3666.106674.34
2022.6666716.0177823.0417.1511168.488894.88
2124.1111118.1333322.0815.7155663.426674.72
2226.5555616.9244423.2533317.3777860.746674.22
2327.2222218.5111122.8266718.2844468.191114.44
2423.2222216.5466724.3216.8488962.831114.28
2525.7777818.5866726.3466716.7733369.684.4
2625.1111117.3777825.9215.8666771.168894.08
2726.1111115.9422222.1866716.0177868.786674.56
2825.4444418.2844425.7066716.0933362.533334.1
2927.3333315.7911123.4666718.4355665.213334.46
3023.888891725.2817.6871.764444.2
3125.8888916.6222223.8933316.6977863.128894.26
3226.3333316.3955625.1733315.5644469.382224.5
3324.4444415.8666725.3866717.4533370.573334.9
3426.6666716.4711122.7216.3267.893334.38
352417.7555622.5066718.1333362.235564.74
3623.5555618.2088924.8533317.9066764.617784.82
3726.8888917.8311124.7466718.5866769.977784.42
3826.7777816.6977822.2933318.5111173.253334.54
392517.6821.7616.5466761.937784.32
4027.4444417.9066724.2133318.6622263.724444.92
4124.8888915.6423.573331764.324.68
4224.5555617.1511121.8666716.9244467.297784.7
4325.6666716.1688924.5333317.7555660.448894.48
4423.3333315.4888925.617.5288961.342224.12
452618.4355625.0666715.9422269.084444.84
Table 4. Comparison results between the experiment and computational fluid dynamics (CFD).
Exp. ResultsCFD ResultsRelative Error [%]
Inlet pressure [MPa]5.9545.950.0689
Inlet temp. [K]291.667294.00.7999
OSPL [dB]102.4103.2490.8291
Table 5. Comparison results of design points between the reference model and optimized model.
NameX1X2X3X4X5X6
Reference Design25172417674.5
Optimum Design 124.43918.20721.616.07173.74.6391
Optimum Design 222.63818.1721.66216.68972.6134.4744
Optimum Design 326.97818.68523.77715.85872.2334.4122

