Article

Sensitivity of Numerical Predictions to the Permeability Coefficient in Simulations of Melting and Solidification Using the Enthalpy-Porosity Method †

1
Department of Materials Science and Engineering, Delft University of Technology, Mekelweg 2, 2628 CD Delft, The Netherlands
2
Department of Chemical Engineering, Delft University of Technology, van der Maasweg 9, 2629 HZ Delft, The Netherlands
*
Author to whom correspondence should be addressed.
This paper is an extended version of our paper published in XII International Conference on Computational Heat, Mass and Momentum Transfer (ICCHMT2019), Rome, Italy, 3–6 September 2019.
Energies 2019, 12(22), 4360; https://doi.org/10.3390/en12224360
Submission received: 25 October 2019 / Revised: 11 November 2019 / Accepted: 13 November 2019 / Published: 15 November 2019

Abstract

:
The high degree of uncertainty and conflicting literature data on the value of the permeability coefficient (also known as the mushy zone constant), which aims to dampen fluid velocities in the mushy zone and suppress them in solid regions, is a critical drawback when using the fixed-grid enthalpy-porosity technique for modelling non-isothermal phase-change processes. In the present study, the sensitivity of numerical predictions to the value of this coefficient was scrutinised. Using finite-volume based numerical simulations of isothermal and non-isothermal melting and solidification problems, the causes of increased sensitivity were identified. It was found that depending on the mushy-zone thickness and the velocity field, the solid–liquid interface morphology and the rate of phase-change are sensitive to the permeability coefficient. It is demonstrated that numerical predictions of an isothermal phase-change problem are independent of the permeability coefficient for sufficiently fine meshes. It is also shown that sensitivity to the choice of permeability coefficient can be assessed by means of an appropriately defined Péclet number.

1. Introduction

Numerical simulations of melting and solidification processes are critical to develop our understanding of phase transformations that occur in various technologies such as additive manufacturing, thermal energy storage, anti-icing and materials processing. It is however challenging due to the involvement of the moving boundary problem [1] and the wide range of length and time scales in transport phenomena during solid–liquid phase transformations [2]. Different numerical techniques have been developed to resolve the transport phenomena and the solid–liquid phase transition at different scales, which have been reviewed in [3,4,5,6].
Techniques for numerically modelling solid–liquid phase transitions at the continuum level have generally been divided into transformed-grid and fixed-grid approaches [4]. Detailed information on the derivation and implementation of these approaches can be found in the literature [7,8,9]. The focus of the present work is on the fixed-grid approach in which latent heat effects and fluid flow near the liquid–solid interface are taken into account through the inclusion of thermal energy and momentum source terms in that region [3]. One of the advantages of the fixed-grid approach over the transformed-grid approach is its robustness in treating changes in the interface topology. However, interface smearing is an inherent disadvantage, which may be diminished by applying local grid refinement near the solid–liquid interface [10,11,12].
Flow velocities in the liquid phase, particularly in the so-called mushy zone close to the solid interface, where phase-change takes place over a melting temperature range [13], can have a significant influence on the local heat transfer [14]; it is therefore crucial to predict fluid flow in the mushy zone with a sufficient level of accuracy. Of the various approaches that have been employed for this purpose [15,16,17], the porosity approach is the most common. In this approach, it is assumed that the fluid flow in the mushy zone is analogous to that in a porous medium. Consequently, Darcy’s law is assumed to govern the flow and a corresponding sink term ( S d ) is added to the momentum equation,
S d = μ K V ,
where V is the fluid velocity vector and μ dynamic viscosity. Assuming isotropy for the solid–liquid morphology and using the Blake–Kozeny equation [18], the permeability (K) can be defined as a function of the liquid fraction ( f L ) as follows:
K = μ C f L 3 1 f L 2 ,
with C the so-called permeability coefficient (or the mushy zone constant). The Blake–Kozeny equation is valid for liquid fractions lower than 0.7 [19,20]; however, it is typically used for the entire range of liquid fractions. The value of the permeability coefficient C and its influence on numerical simulations of melting and solidification is generally uncertain.
The values reported for the permeability coefficient C in the literature generally range between 10 3 and 10 15 k g   s 1 m 3 [21,22]; however, values between 10 4 and 10 8 k g   s 1 m 3 are often applied. The proposed values for C do not seem to have a one-to-one relation to the type of material being studied. For instance, values between O ( 10 4 ) [23] and O ( 10 8 ) [24] have been proposed for stainless steel, and values between O ( 10 4 ) [25] and O ( 10 15 ) [26] have been proposed for gallium. Thus, the values proposed for C in the literature seem to depend markedly on the process parameters and the associated boundary conditions, and thus lack generality. In other words, tuning the value of C is essential for every set of boundary conditions and material properties, which requires considerable trial and error evaluation. Previous studies on the influence of the permeability coefficient in simulations of melting and solidification have mainly concentrated on finding a value for C to diminish discrepancies between numerical and experimental data for a specific problem (see, for instance, [27,28,29,30,31,32,33]). Additionally, they have often focused on the phase-change materials for thermal energy storage applications for which material properties and operating conditions differ from those for materials processing applications (e.g., casting, welding and additive manufacturing). It is necessary to know under which circumstance and to what extent the numerical predictions of melting and solidification are sensitive to the value of the permeability coefficient to avoid the need for excessive computation. However, there is as yet no general guideline for assessing the appropriate value of C.
The degree of sensitivity of the numerical predictions to the value of the permeability coefficient C appears to be diverse. Several studies reported that the chosen value of C affect the numerical results predicted by the enthalpy-porosity method for isothermal phase-change problems [34,35,36], in which phase transformation occurs at the melting temperature of the material. This effect is not physically realistic for isothermal phase transformations and should be considered as a numerical artefact [37]. Pan et al. [28] studied the melting of calcium chloride hexahydrate ( CaC l 2 H 12 O 6 ) in a vertical cylinder and stated that the value of C depends on the temperature difference that drives melting and should be tuned to obtain a reasonable agreement with experimental data. Fadl and Eames [21] reported that the numerical predictions are less sensitive to the value of C in regions where heat transfer is dominated by conduction. Assessing the degree of sensitivity of the numerical prediction to the value of C for different materials and boundary conditions is an open question, despite its significance has been emphasised in the literature [21,22,30,38].
Realising the degree of sensitivity of the numerical predictions to the value of the permeability coefficient in phase-change simulations with a particular interest in melting and solidification during welding and additive manufacturing was the motivation for the present study. Our aim was to quantitatively assess the influence of the permeability coefficient (C) on the results of the enthalpy-porosity method in predicting heat and fluid flow and the position of the solid–liquid interface during solid–liquid phase transformations. The sensitivity of the results to the permeability coefficient was analysed for both isothermal and non-isothermal melting and solidification problems, and possible roots of errors in the simulation of solidification and melting processes were highlighted. Our study quantified the influence of the permeability coefficient on the numerical predictions as a function of numerical simulation parameters and physical process parameters and elucidated the limitations of the enthalpy-porosity method.

2. Problem Description

Isothermal and non-isothermal phase transformations in the two-dimensional rectangular enclosure shown in Figure 1 were studied. The length of the enclosure (W) is twice its height ( D = 0.1 m ). The enclosure is initially filled with solid material at a temperature ( T i ) below the melting temperature T m (for isothermal phase-change) or solidus temperature T s (for non-isothermal phase-change). The left and the right solid walls are isothermal walls and the upper and the lower walls are adiabatic. At the starting time of the simulation, the left wall temperature is suddenly raised from the initial temperature ( T i ) to the hot wall temperature ( T h ), whereas the cold wall is kept at a temperature T c = T i . The thermophysical properties of our artificial materials are presented in Table 1, which represent a wide range of metallic and non-metallic phase-change materials. The liquid phase is assumed to be incompressible and Newtonian, with constant dynamic viscosity μ . All other thermophysical material properties are assumed to be the same for both the solid and liquid phases and temperature independent.

3. Mathematical Formulation

Since the Rayleigh number for the problems considered here is less than 10 6 , the fluid flow is assumed to be laminar. Thermal buoyancy effects are taken into account using the Boussinesq assumption [39]. Utilising the dimensionless variables Fo = t α / D 2 , V * = V D / α , T * = T / T h T melt , H * = T * + f L / Ste , p * = p D 2 / ρ α 2 and K * = K / D 2 [10], the unsteady momentum and energy equations are cast in conservative dimensionless form, respectively, as follows:
1 Pr V * Fo + V * · V * + p * = 2 V * + Ra T * y ^ V * K * ,
H * Fo + V * · H * = 2 T * + 1 Ste f L Fo + V * ,
where the Prandtl number (Pr) represents the ratio of momentum diffusivity to thermal diffusivity α = k   ρ c p in molten materials and is defined as
Pr = μ ρ α .
To evaluate the relative importance of buoyancy to viscous forces acting on the molten materials, the Grashof number (Gr) and Rayleigh number (Ra) can be defined as
Gr = g β ρ 2 D 3 T h T melt μ 2 ,
Ra = Gr · Pr = g β ρ D 3 T h T melt μ α .
The Stefan number (Ste) is the ratio of sensible to latent heat and is defined as
Ste = c p T h T melt L m .
In the above, ρ is density, μ dynamic viscosity, p the static pressure, k thermal conductivity, c p specific heat capacity at constant pressure, f L the local liquid fraction, L m the latent heat of melting or solidification, β the thermal expansion coefficient, g the gravitational acceleration, t time and V the fluid velocity vector. y ^ is the unit vector in the y-axis direction. T melt is the melting-temperature (for isothermal phase-change) or solidus temperature (for non-isothermal phase-change).
For the sake of simplicity, the local liquid fraction was considered to be a function of temperature only, which is a reasonable assumption for the cases where under-cooling is not significant [40]. Different relationships have been proposed for temperature-dependence of the liquid fraction, depending on the materials and the nature of the micro-segregation [41,42]. Based on the method suggested by Voller and Swaminathan [41], the relationship between the local liquid fraction and the temperature is defined to be linear as follows:
f L T = T T s T l T s ; T s T T l ,
where T l and T s are liquidus and solidus temperatures, respectively. In the case of isothermal phase-transformation, a step change in the liquid fraction occurs at the melting-temperature according to the method given by Voller and Prakash [16]. Additionally, the convective part of the enthalpy source term in the energy equation (i.e., V * ) takes the value zero for the isothermal phase transformation due to the step change in the latent heat and a zero velocity at the solid–liquid interface [16].
To deal with the fluid velocity in the mushy zone, a sink term based on the Blake–Kozeny equation (i.e., Equations (1) and (2)) was introduced into the momentum equation [16].
V * K * = D 2 V * K = C μ 1 f L 2 f L 3 + ϵ D 2 V * ,
where C is the permeability coefficient and ϵ is a small constant, here chosen to be equal to 10 3 , to avoid division by zero. The sink term is zero in the liquid region f L = 1 while its limiting value for f L = 0 should be large enough to dominate the other terms in the momentum equation to suppress the fluid velocities in the solid region. The value of the permeability coefficient C can be expected to depend on the morphology of the mushy zone. No consensus was found on the value of the permeability coefficient in the literature [24,43,44,45,46,47]. The effects of this parameter on numerical results are therefore reported here.
The following dimensionless parameters are utilised to construct a framework for analysing our results. The ratio θ of melting-temperature range Δ T m = T l T s to the temperature difference between the hot and cold wall Δ T w = T h T c is defined as
θ = T l T s T h T c = Δ T m Δ T w .
The volumetric fraction of liquid inside the computational domain at a time instant t is evaluated as
ϕ ( t ) = 1 W · D domain f L ( t ) d A .
We use the relative difference Δ ϕ ( t ) = ϕ 2 ( t ) ϕ 1 ( t )   ϕ 1 ( t ) between two solutions obtained using different permeability coefficients C 2 and C 1 to quantify the sensitivity of a solution to the chosen value of the permeability coefficient C. In addition, a dimensionless parameter ( Γ ) is employed to quantify the difference between the solid–liquid interface morphology predicted using different permeability coefficients C 1 and C 2 as follows:
Γ = 1 W · D y = 0 y = D x f , C 1 x f , C 2 2 d y ,
where x f is the position of the liquidus line.

4. Numerical Procedure

Numerical predictions obtained from an open-source (OpenFOAM) and a commercial (ANSYS Fluent) solver were compared for melting and solidification simulations, and the results were found to be rather identical (see Figure 2). ANSYS Fluent (Release 18.1) was selected to carry out the calculations, and simulations were performed in parallel on eight cores of an Intel Xeon E5-2630 processor (2.20 GHz). The computational domain was discretised on a uniform mesh with quadrilateral grid cells. After performing a grid independence test (results presented in Section 5.2 and Section 5.3.1), a base grid with a cell size Δ x i / D = Δ y i / D = 4 × 10 3 was chosen. To capture a sharp solid–liquid interface and to reduce errors associated with high-gradient regions, especially when the thickness of the mushy zone is smaller than the base grid size (i.e., Δ T m / Δ T w W Δ x i ), a dynamic solution-adaptive mesh refinement was applied using the “gradient approach” [48] based on the liquid fraction gradients. Four levels of mesh refinement Δ x N = Δ x i / 2 N , N = 1 , , 4 were applied every ten time-steps. A fixed time-step size of Δ Fo = k Δ t / ρ c p Δ x i 2 = 10 4 was selected, corresponding to a Courant number Co = | V | Δ t / Δ x less than 0.25.
The conservation equations were discretised using the finite-volume method. The central-differencing scheme was utilised for the discretisation of the convection and diffusion terms both with second-order accuracy. The Pressure-Implicit with Splitting of Operators (PISO) scheme [49] was used for pressure–velocity coupling. Additionally, the PRESTO (PREssure STaggering Option) scheme [50] was used for the pressure interpolation. The time derivative was discretised with a second-order implicit scheme. Convergence requires that scaled residuals of the continuity, momentum and the energy equations fall below 10 10 , 10 12 and 10 14 , respectively, and that the relative change in the volumetric fraction of liquid ϕ from one iteration to the next is less than 10 10 .

5. Results

5.1. Model Verification

The reliability of the present numerical model was verified against available experimental, theoretical and numerical data for various phase-change benchmark problems. The transient solidification of a semi-infinite slab of Al–4.5%Cu alloy was considered as a one-dimensional problem. The slab is initially in the liquid phase with a uniform temperature of 969 K above the liquidus temperature T l = 919 K . The phase-change process starts at t = 0 s by suddenly changing the temperature of one side of the slab to 573 K , below the solidus T s = 821 K . The results of the present model on a uniform mesh with cell size Δ x = 0 . 01 m are compared with semi-analytical [51] and numerical results [41] in Figure 2a. Our present results are in better agreement with the semi-analytical solution from [51] than the numerical results presented in [41], with the maximum absolute difference between present results and the semi-analytical solution being 0.5%.
Melting with convection of pure tin in a square enclosure was considered as a two-dimensional benchmark problem. Details of the problem can be found in [11]. The results obtained from the present model on a uniform mesh with quadrilateral grid cells, Δ x i / W = 4 × 10 4 for isothermal phase-change including convection are compared with numerical results presented by Hannoun et al. [11] in Figure 2b. The maximum difference between the results predicted by the present model and the reference case [11] is within 1%.
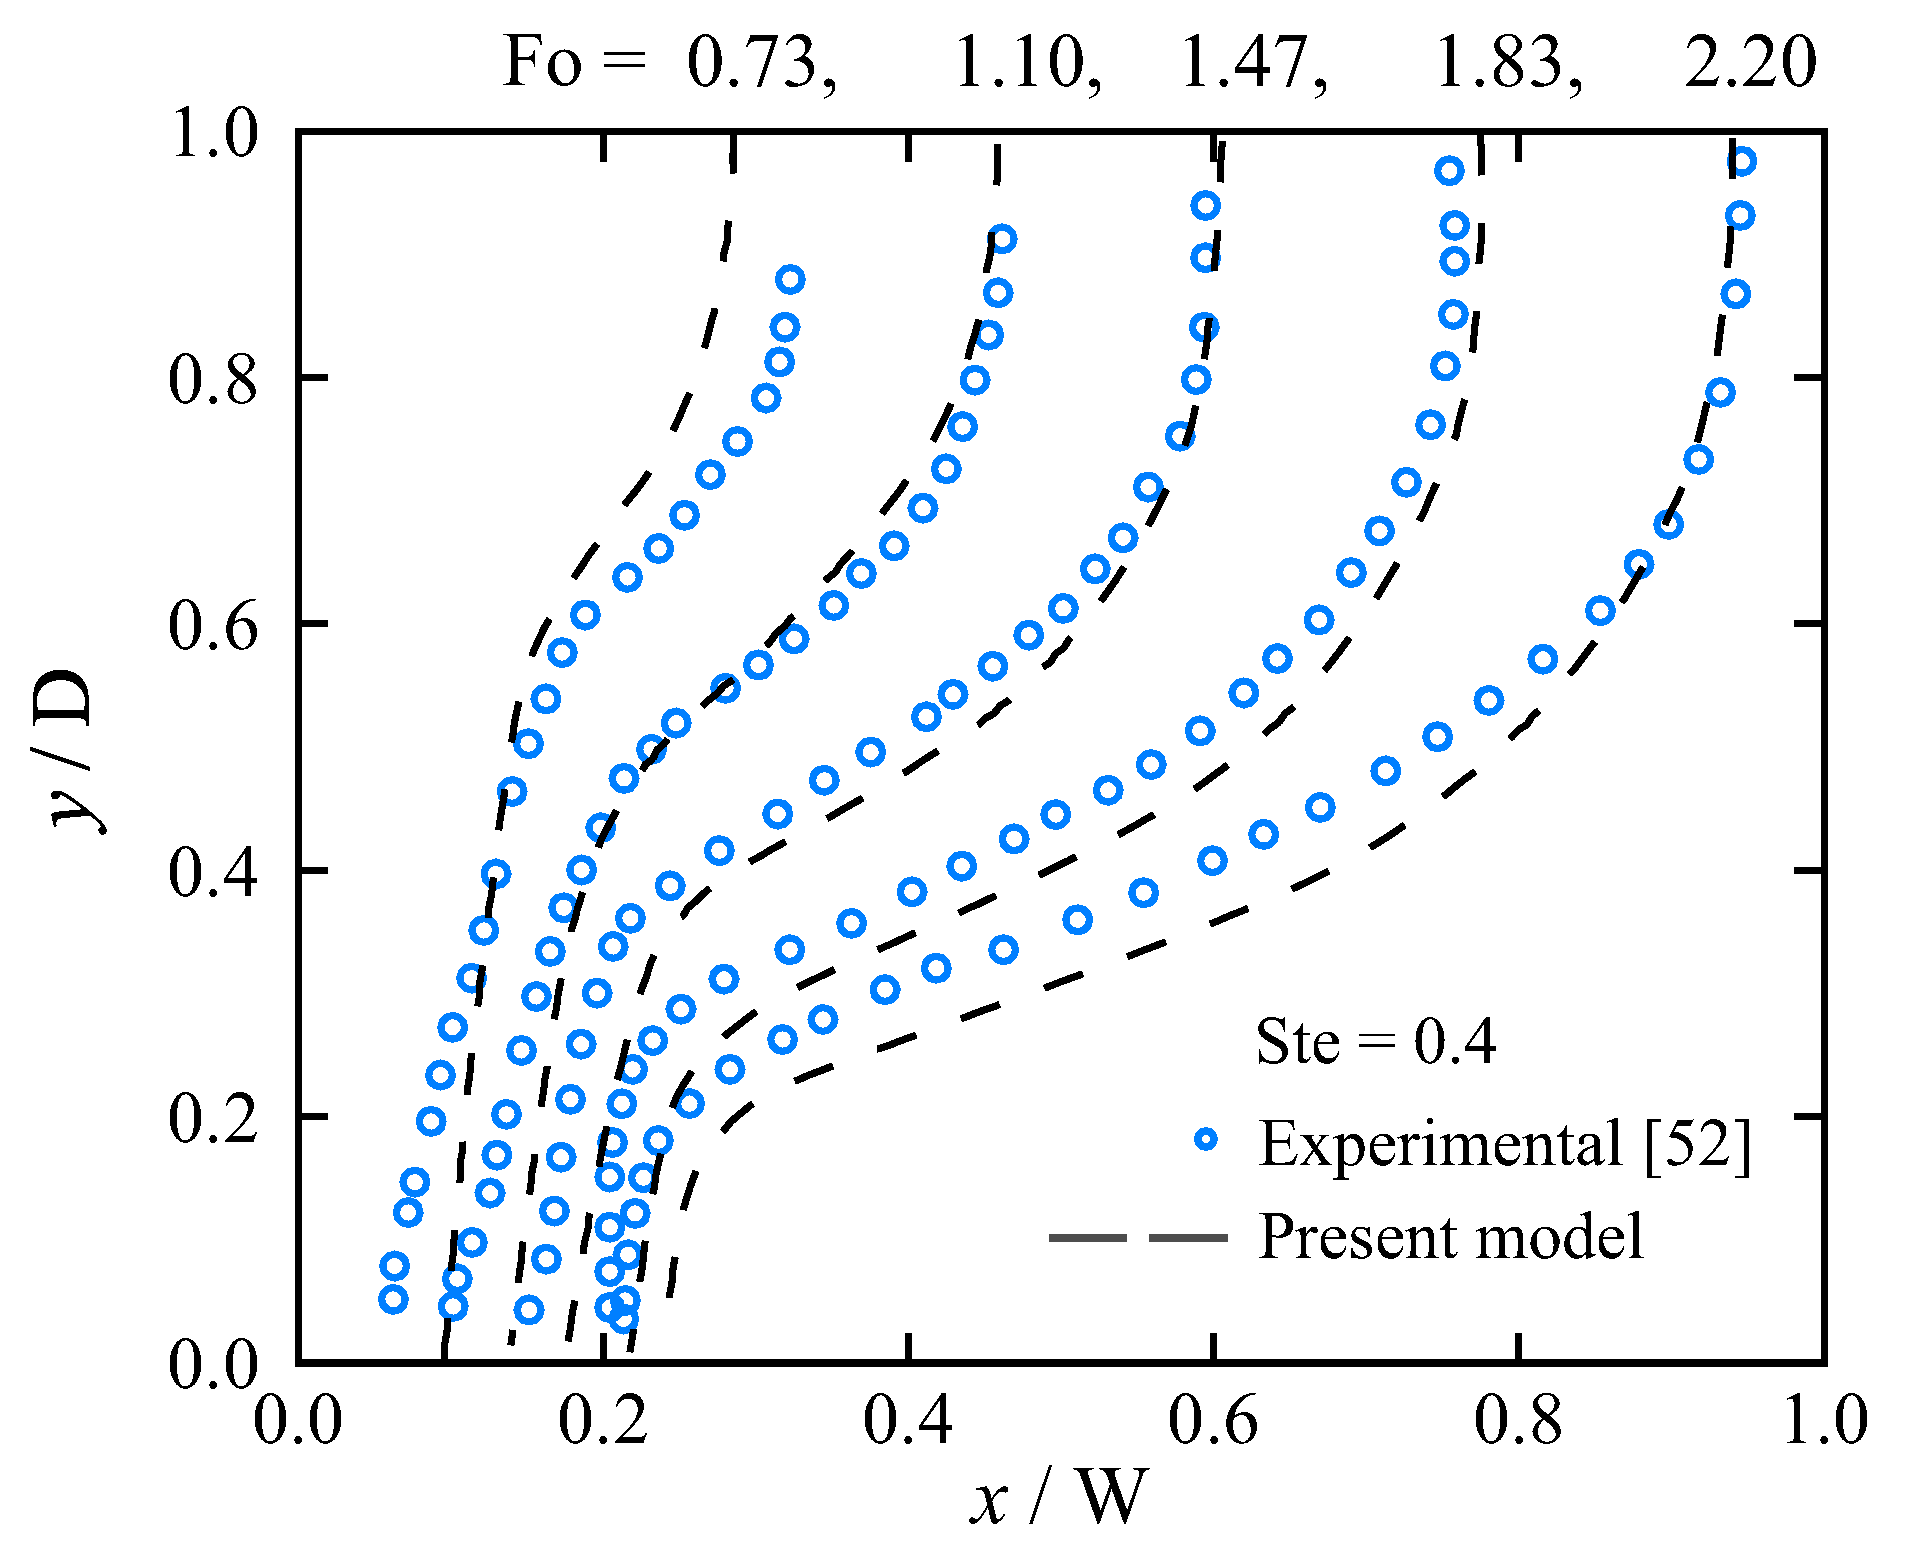
Numerical predictions of solid–liquid interface morphologies in a rectangular enclosure subject to natural convection was compared with the experimental observations of Kumar et al. [52] for isothermal melting of lead. Figure 3 indicates a reasonable agreement between the results obtained from the present numerical simulations and the reference data. The deviations between the numerical and experimental data are attributed to both the simplifying assumptions made in the numerical model and the uncertainties associated with the experiments such as the uncertainty in determining the position of solid–liquid interface, which in this case is reported to be about 8.7% [52]. The results obtained from the present model are also validated with experimental observations in Section 6 for a laser spot melting process (see Figure 14).

5.2. Grid Size and Sensitivity to the Permeability Coefficient for Isothermal Phase Change

Sensitivity of the solution to the grid size and the value of the permeability coefficient was studied for isothermal phase-change of gallium melting at T m = 302 . 78 K , in a side-heated rectangular enclosure with T i = T c = 301 . 30 K , and T h = 311 . 0 K , which was experimentally investigated by Gau and Viskanta [53]. This benchmark case has often been considered for validation of phase-change simulations in the literature [4]. Detailed information regarding the benchmark case is available in [53,54].
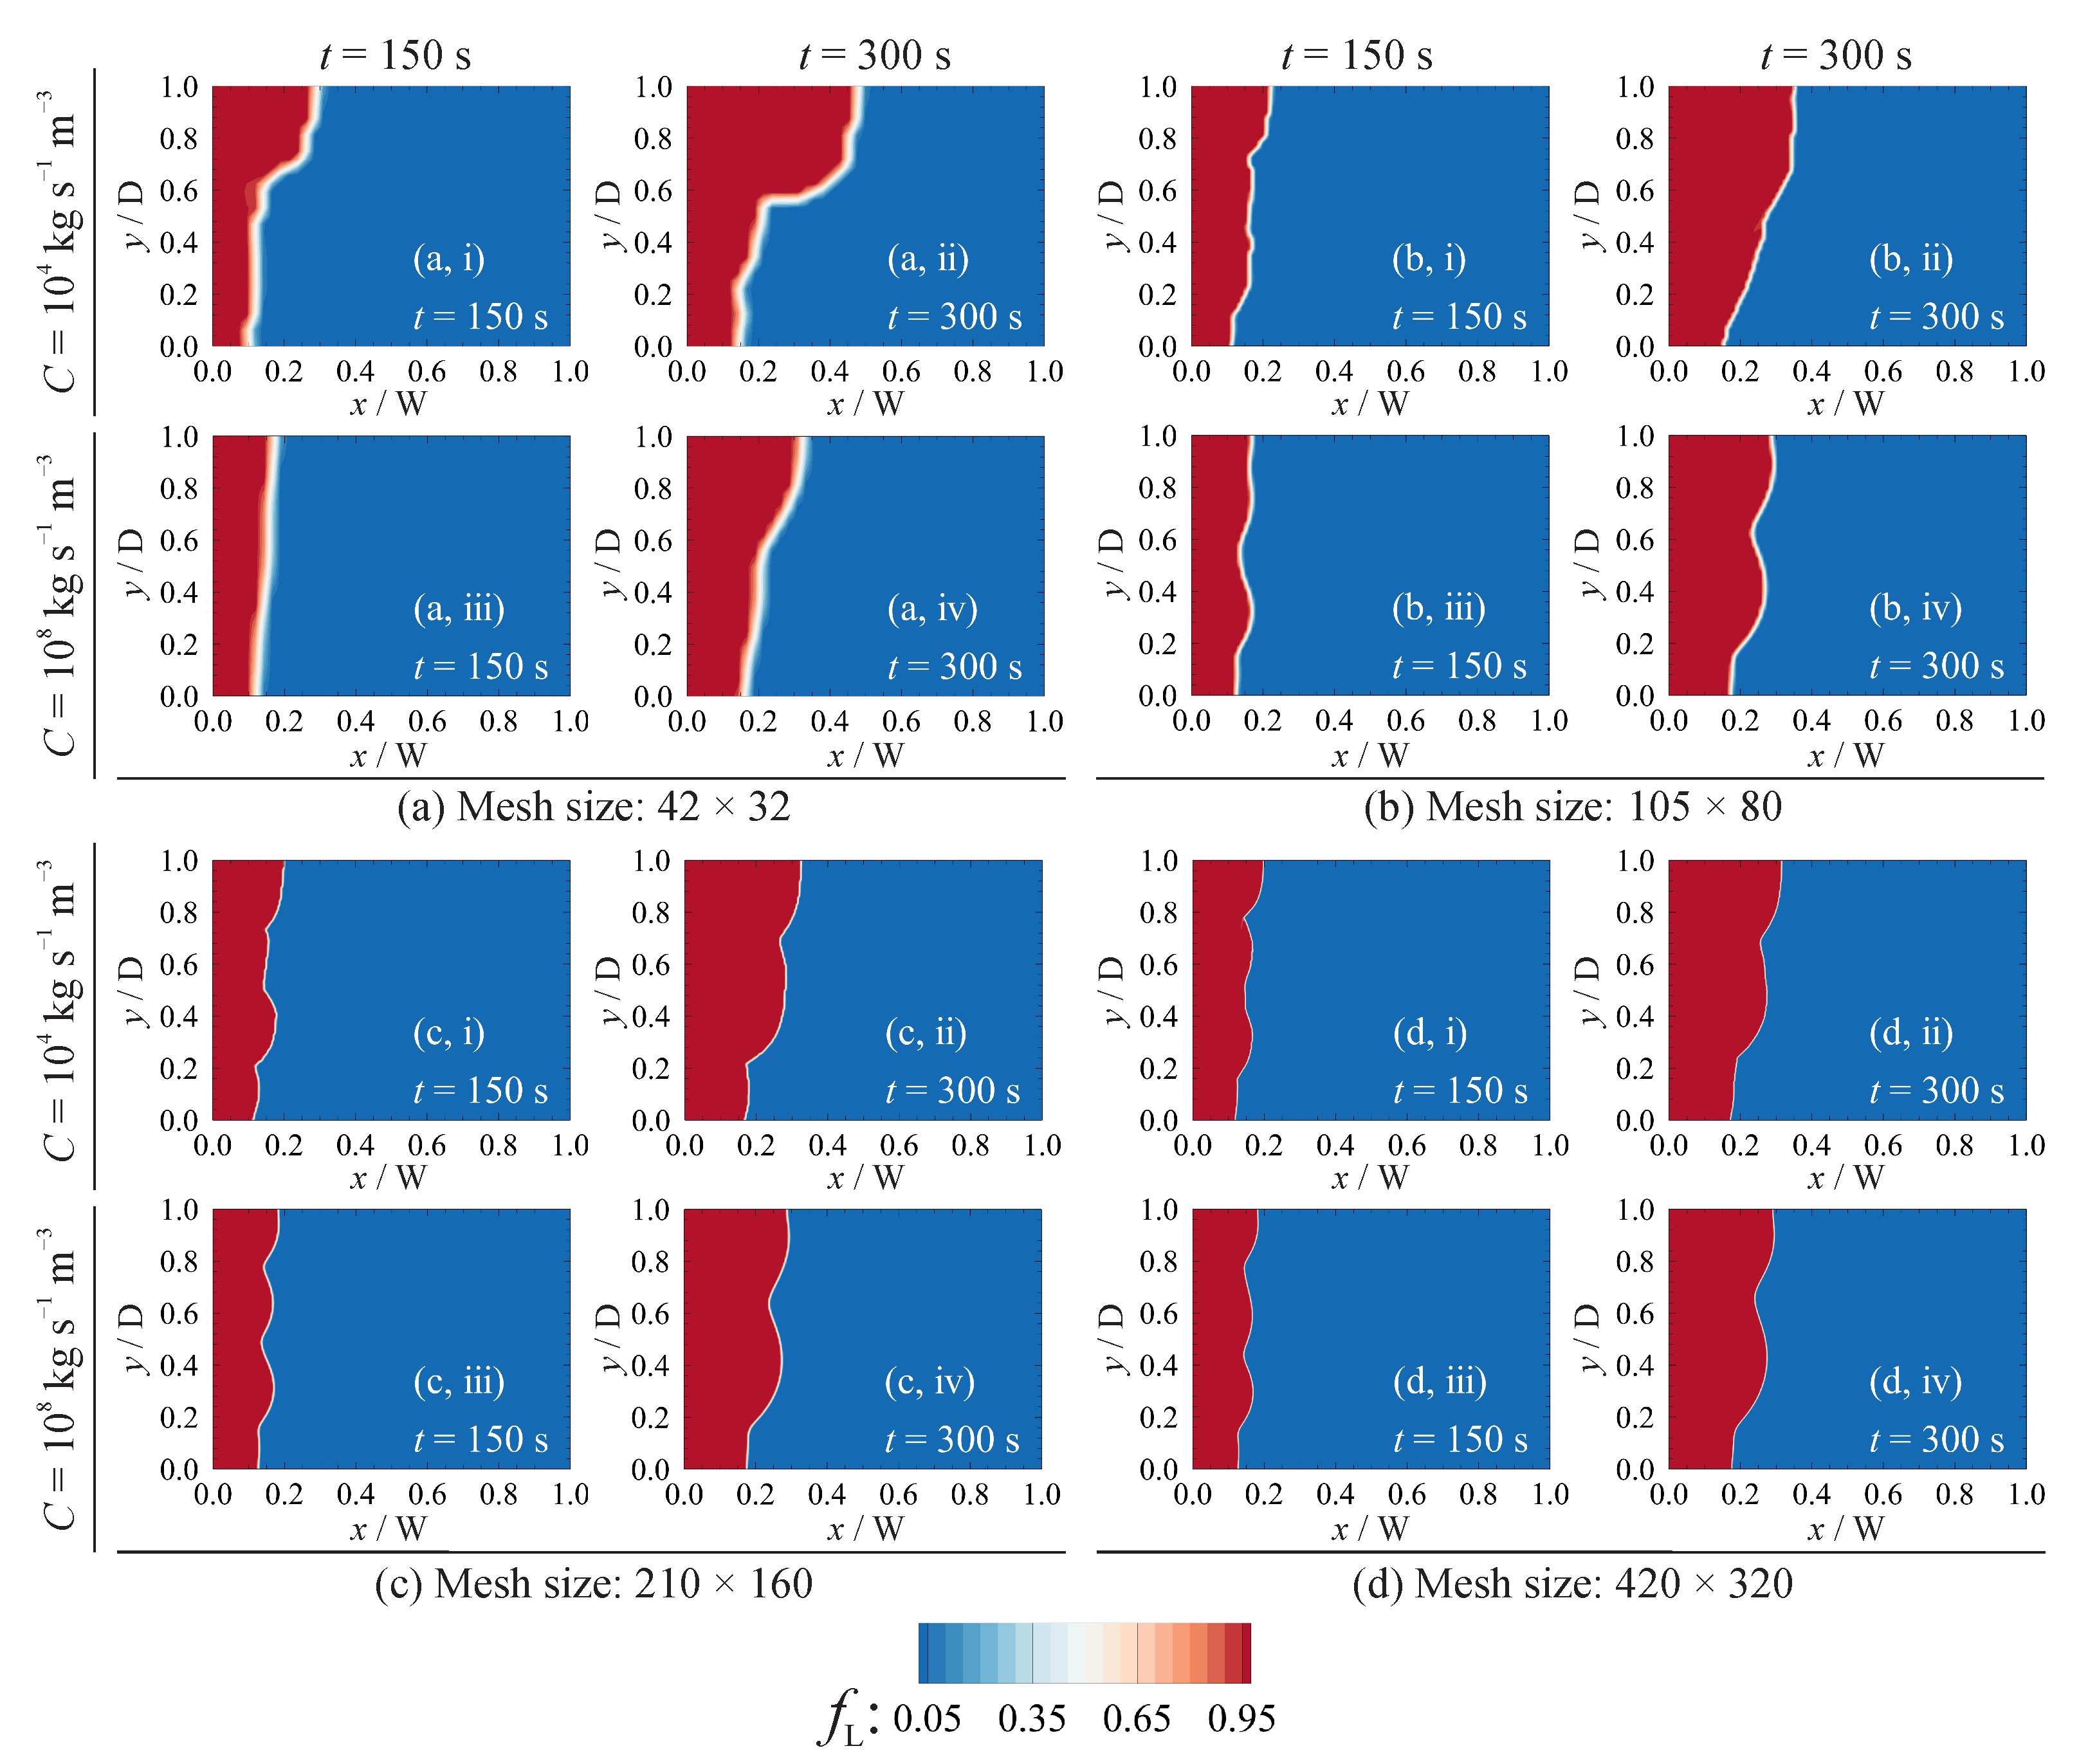
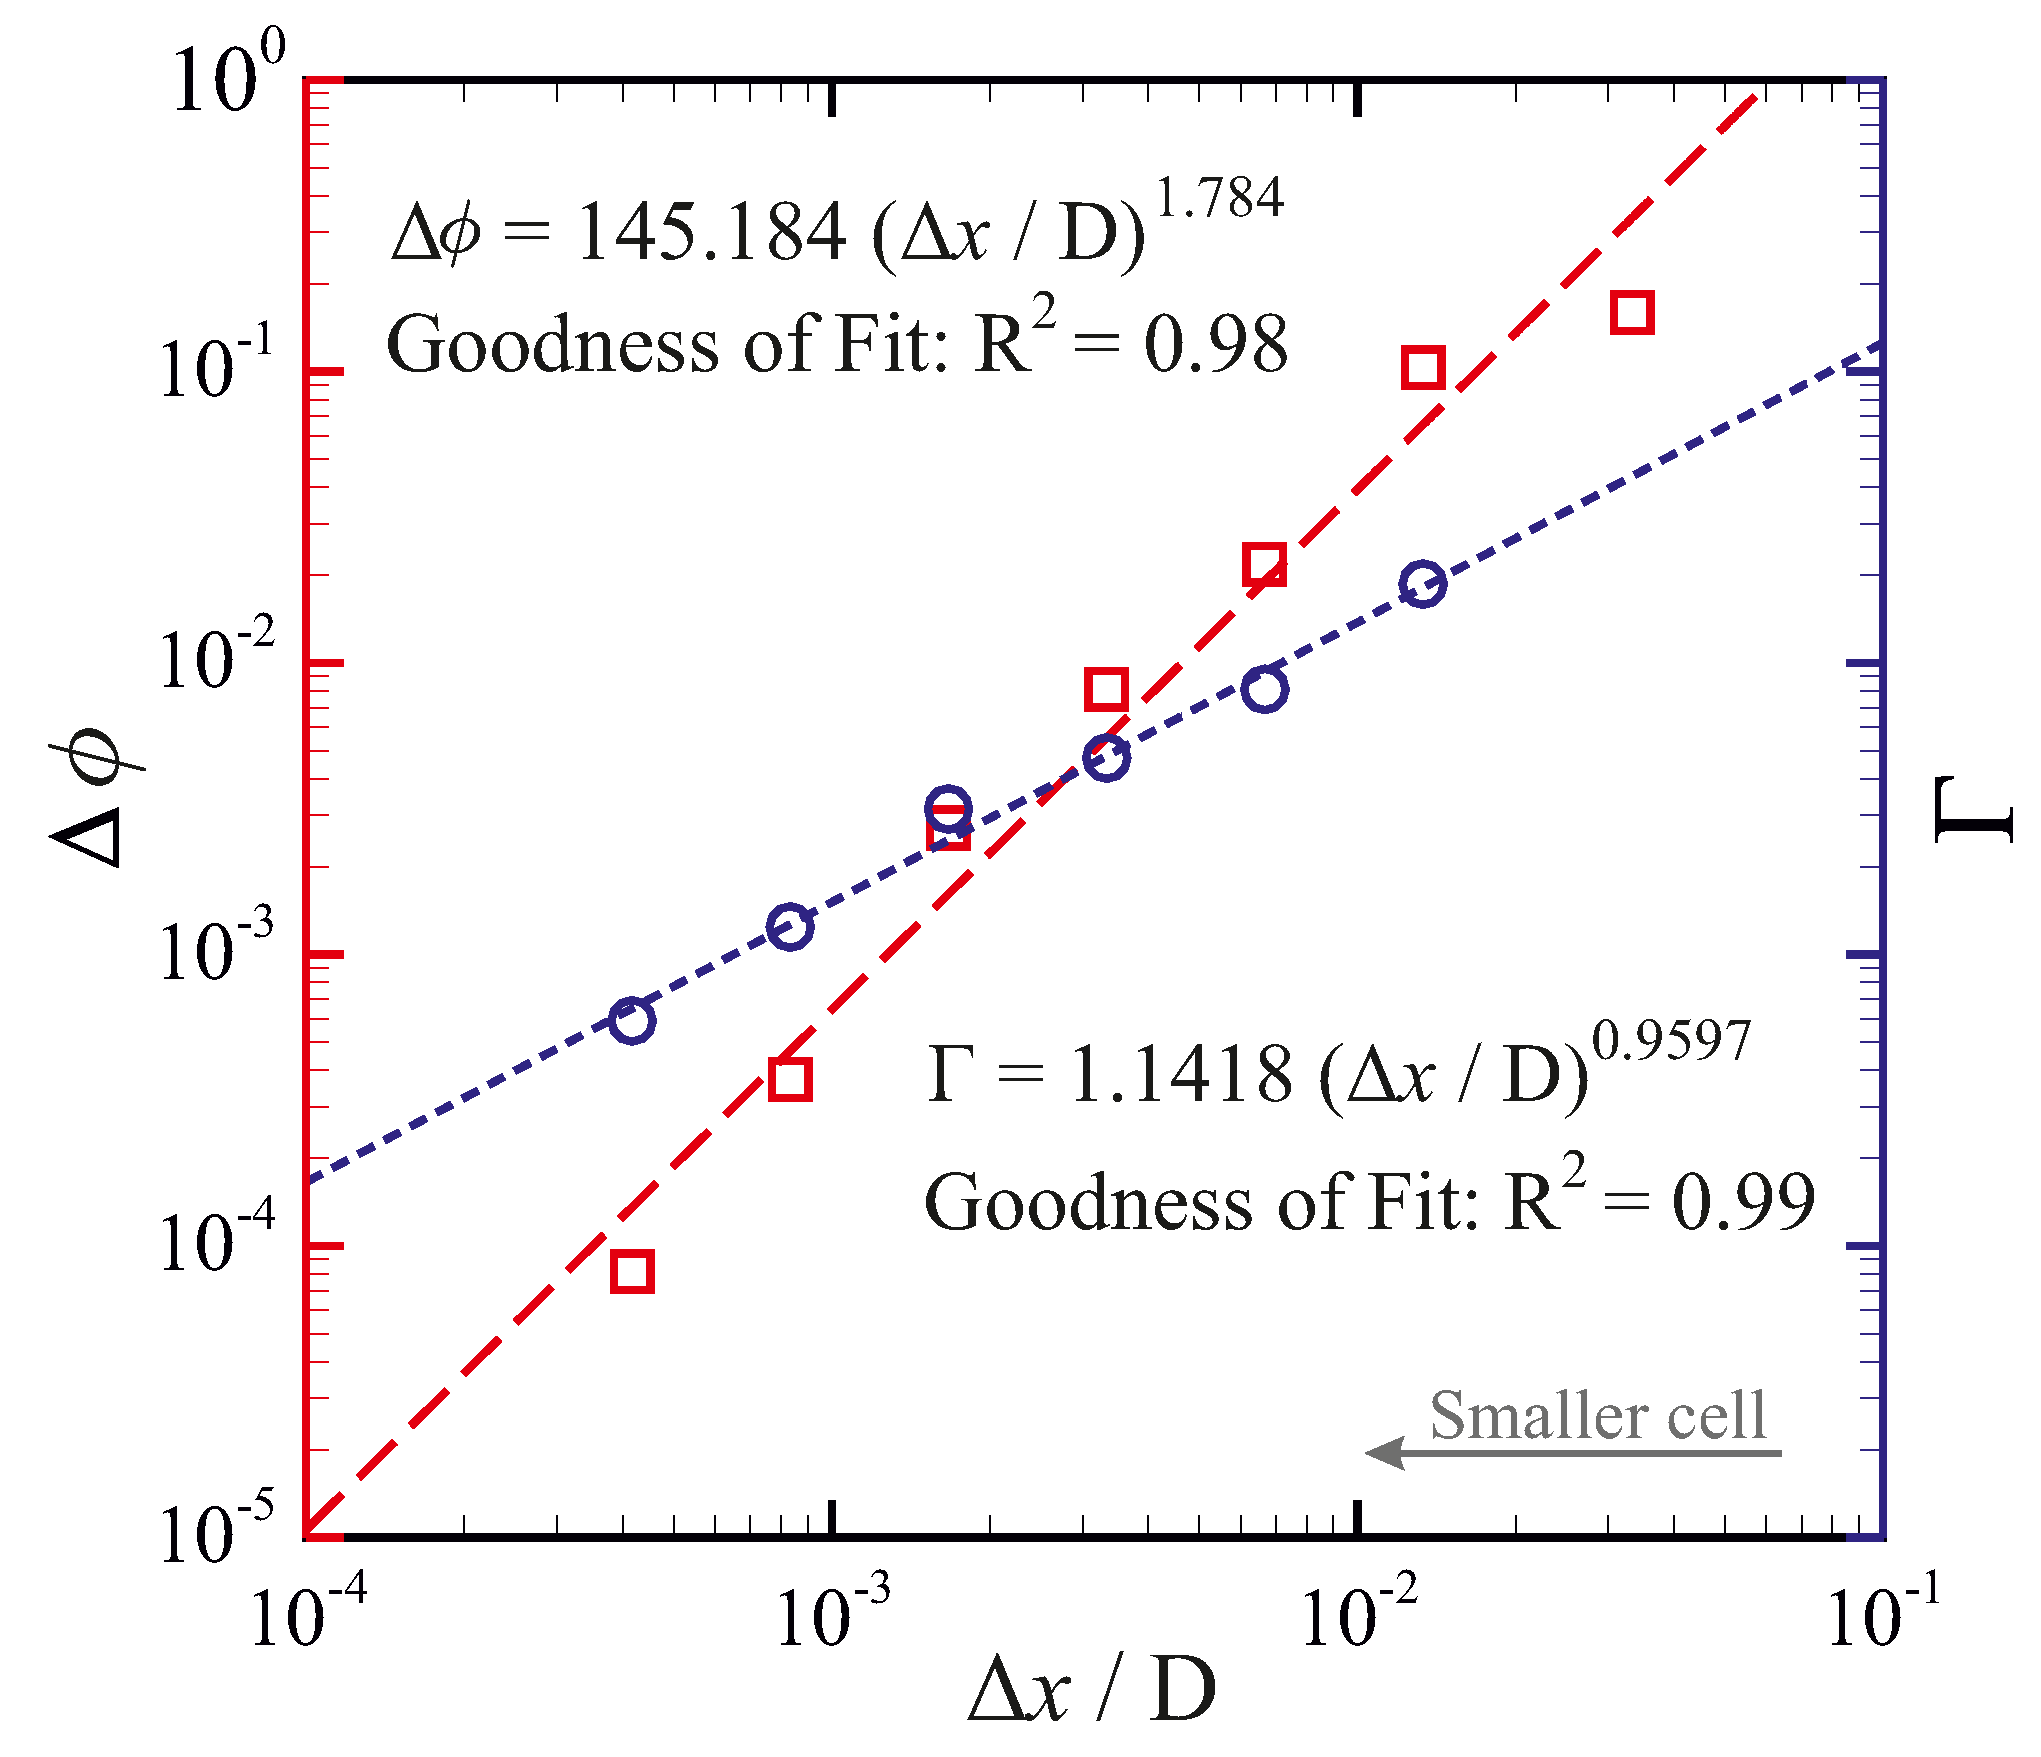
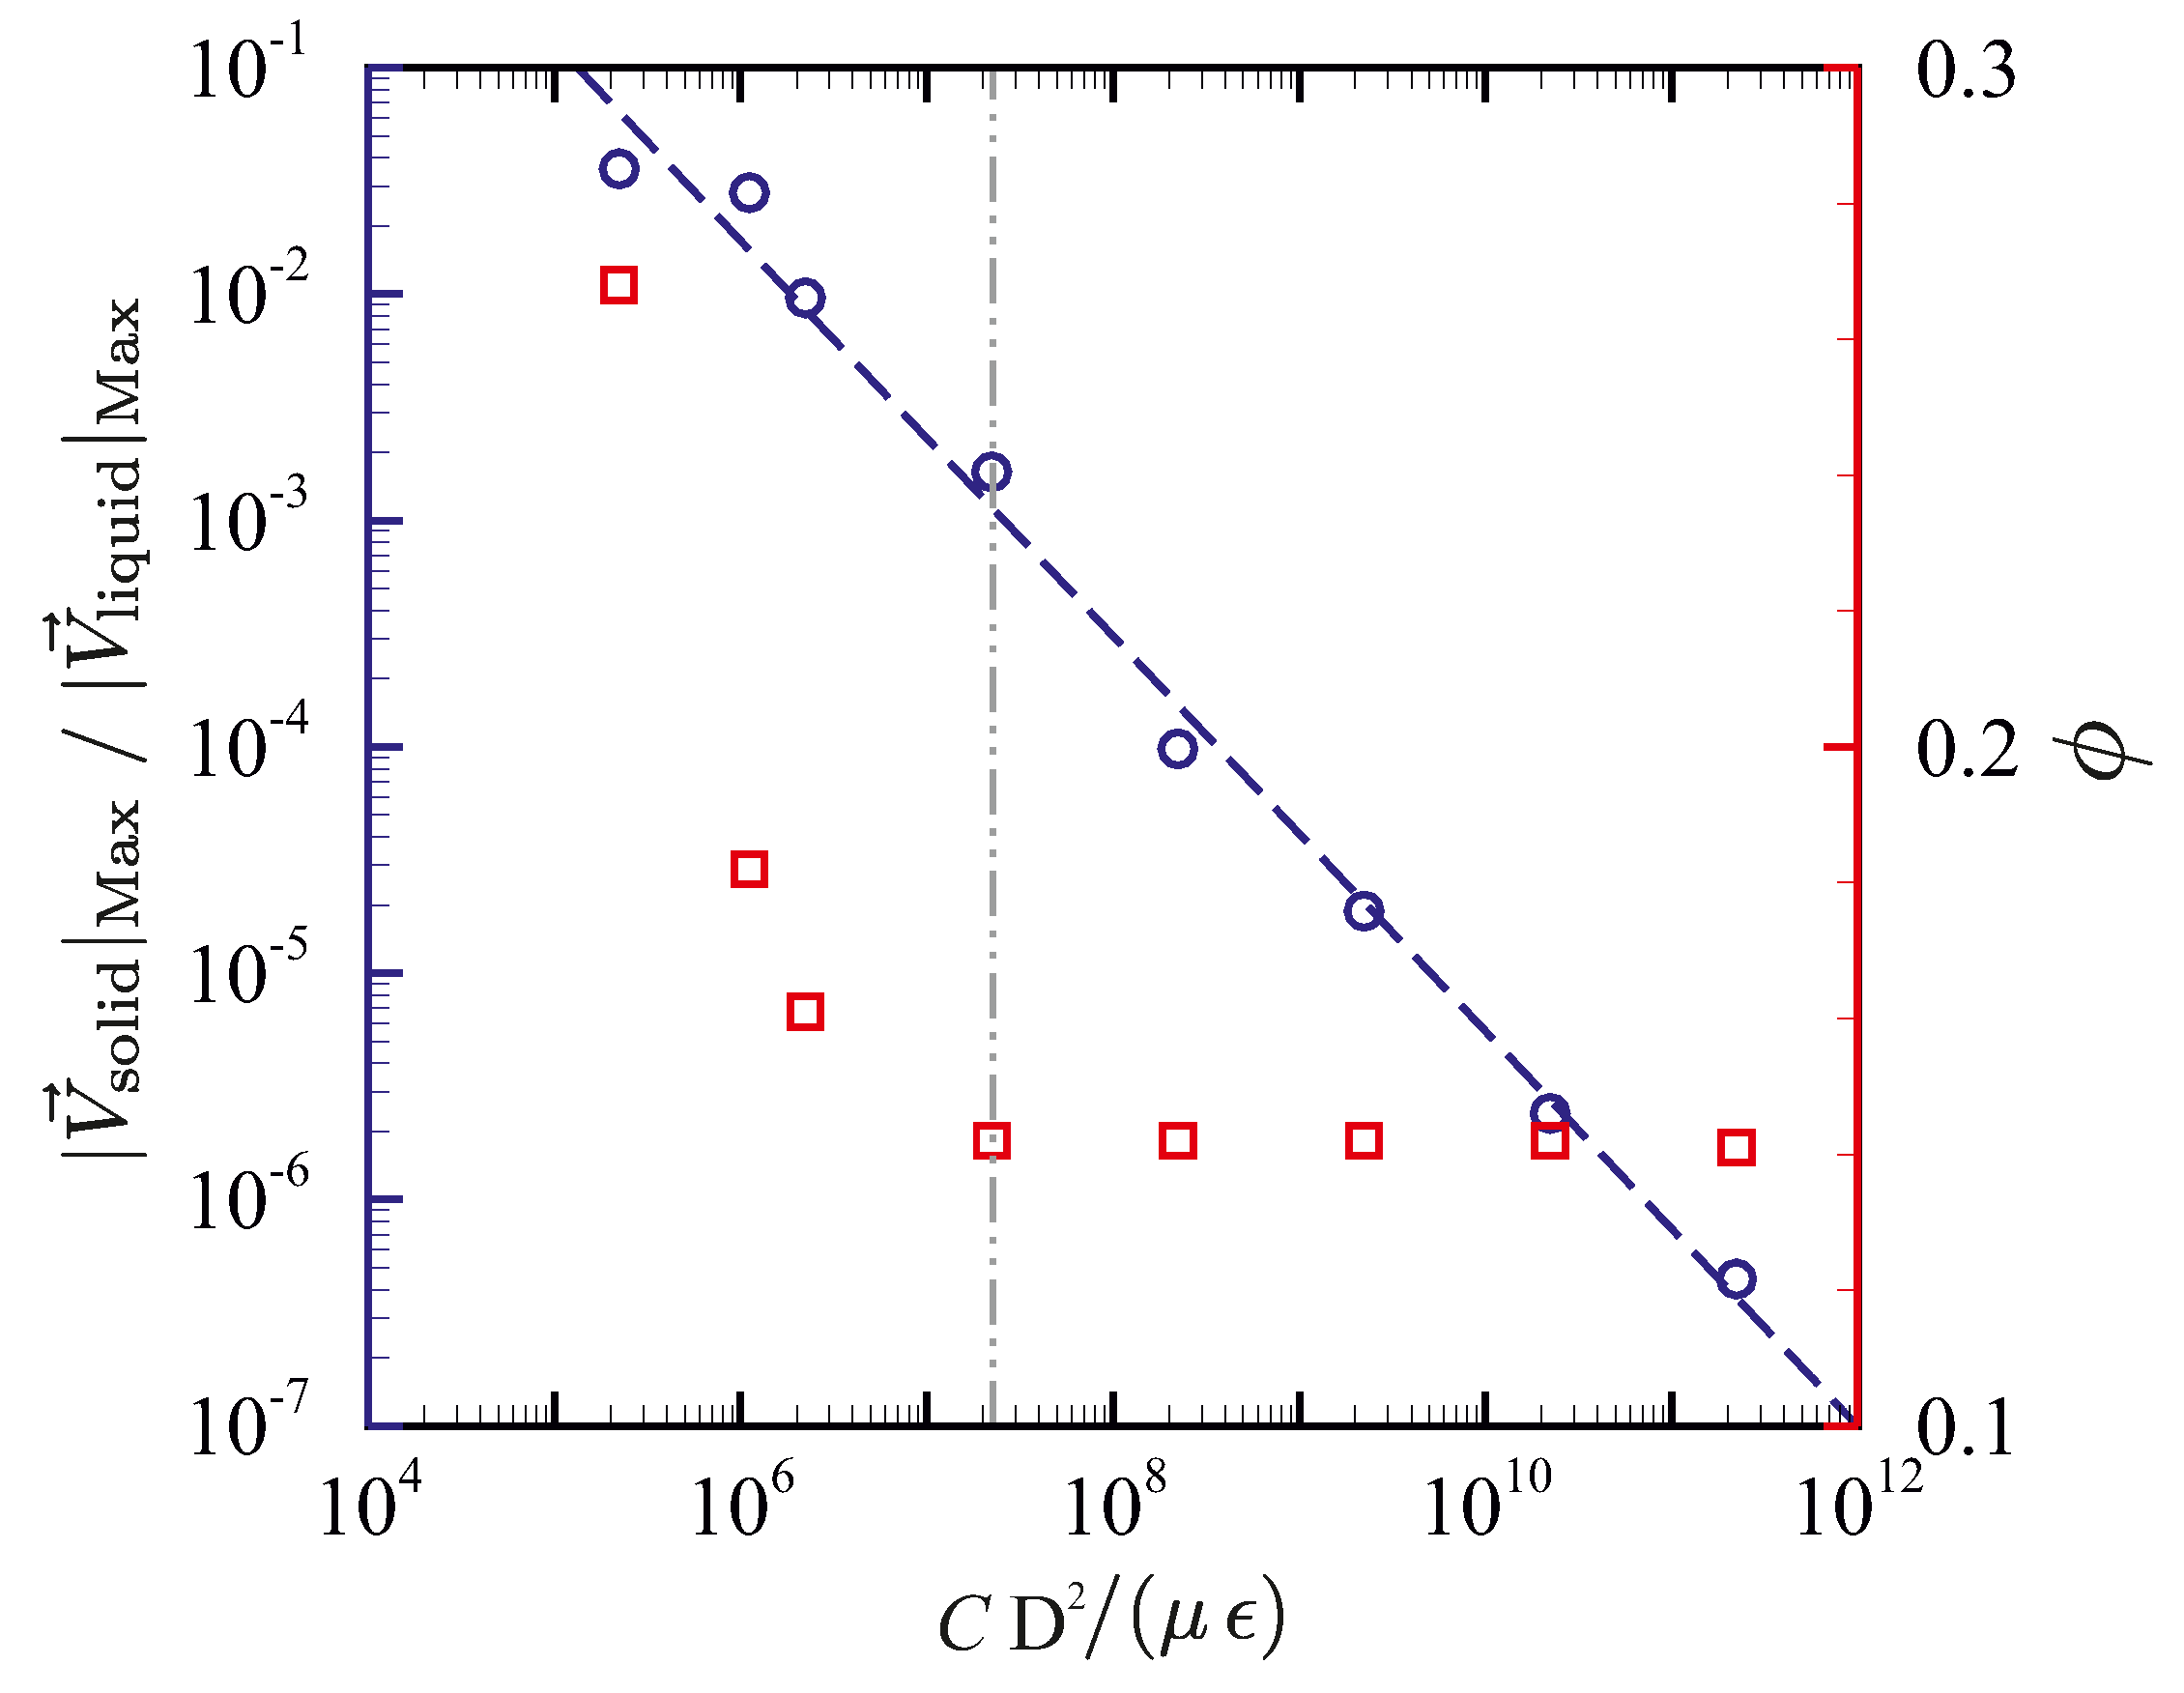
Figure 4 shows the influence of the permeability coefficient on the predicted liquid fraction, using uniform fixed meshes with 42 × 32, 105 × 80, 210 × 160 and 420 × 320 computational grid cells and C = 10 4 and 10 8   k g   s 1   m 3 . When a coarse mesh is utilised, resulting in a non-physical mushy zone of significant thickness, the solution appears to be very sensitive to the value of the permeability coefficient. This sensitivity is attributed to the enhanced heat transfer from the hot fluid to the solid–liquid interface due to higher fluid velocities in the mushy zone predicted with a smaller permeability coefficient. Reducing the grid cell size, and thus reducing the thickness of the non-physical mushy zone, decreases the total volume of the grid cell in which the permeability coefficient affects the numerical predictions. Consequently, the sensitivity of the solution to the value of the permeability coefficient decreases with grid refinement. A finite amount of time is required for the mass in a computational cell to absorb heat and melt. A change in the value of C therefore affects the convective heat transfer to the cells located at the solid–liquid interface that can lead to a change in the predicted interface morphology and the rate of melting during the transient phase. This effect reduces by refining the grid size adjacent to the solid–liquid interface [10]. In Figure 5, the sensitivity to the value of C is quantified as a function of grid cell size by looking at the parameters Δ ϕ and Γ (defined below Equations (12) and (13), representing the relative difference in the predicted liquid fractions, and the relative difference between the solid–liquid interface morphologies) for C 1 = 1 × 10 8     k g   s 1   m 3 and C 2 = 1 × 10 4     k g   s 1   m 3 at t = 150   s . Reducing the cell size decreases the influence of the permeability coefficient on the results, with Γ scaling approximately linearly with cell size, and Δ ϕ scaling approximately quadratically with cell size. Thus, although in principle the chosen value of C should be irrelevant for isothermal phase change, sufficient grid refinement is needed to obtain solutions which are indeed insensitive to the value of C. In addition, sufficient grid resolution in the liquid zone was found to be required to predict the multicellular convection [14,55,56,57] early in the phase-change process, which leads to the formation of a wavy solid–liquid interface. According to Equation (10), the magnitude of the sink-term in solid regions ( f L = 0 . 0 ) should be large compared to the viscous term ( 2 V * ) to suppress fluid velocities (i.e., C D 2 / μ ϵ 1 ). The influence of the sink-term magnitude on predicted liquid fraction ϕ and the ratio of the maximum velocity magnitude in solid regions to that in liquid regions (i.e., | V solid | Max / | V liquid | Max ) is shown in Figure 6. Here, D is chosen to be the size of the heated wall. For magnitudes of C D 2 / μ ϵ roughly larger than 2.5 × 10 7 , the predicted liquid fraction is independent of the sink-term. For smaller values of the sink-term, even though the velocity magnitude in the solid region is orders of magnitude smaller than that in the liquid region, the energy transfer to the solid material is affected, which leads to a change in the predicted liquid fraction.
The fine-grid results presented in Figure 4 represent a mathematically converged solution of the governing equations for the given set of boundary conditions. However, the grid independent results of this particular case do not closely match with the experimental results reported in [53]. Obtaining a better agreement between numerical predictions and experimental observations by using a coarser grid (i.e., grid-dependent results), or by tuning the mathematical model has been reported in the literature [34] that is coincidental, but such ad hoc tuning lacks generality [11,54,58].

5.3. Non-Isothermal Phase-Change

5.3.1. Grid Sensitivity

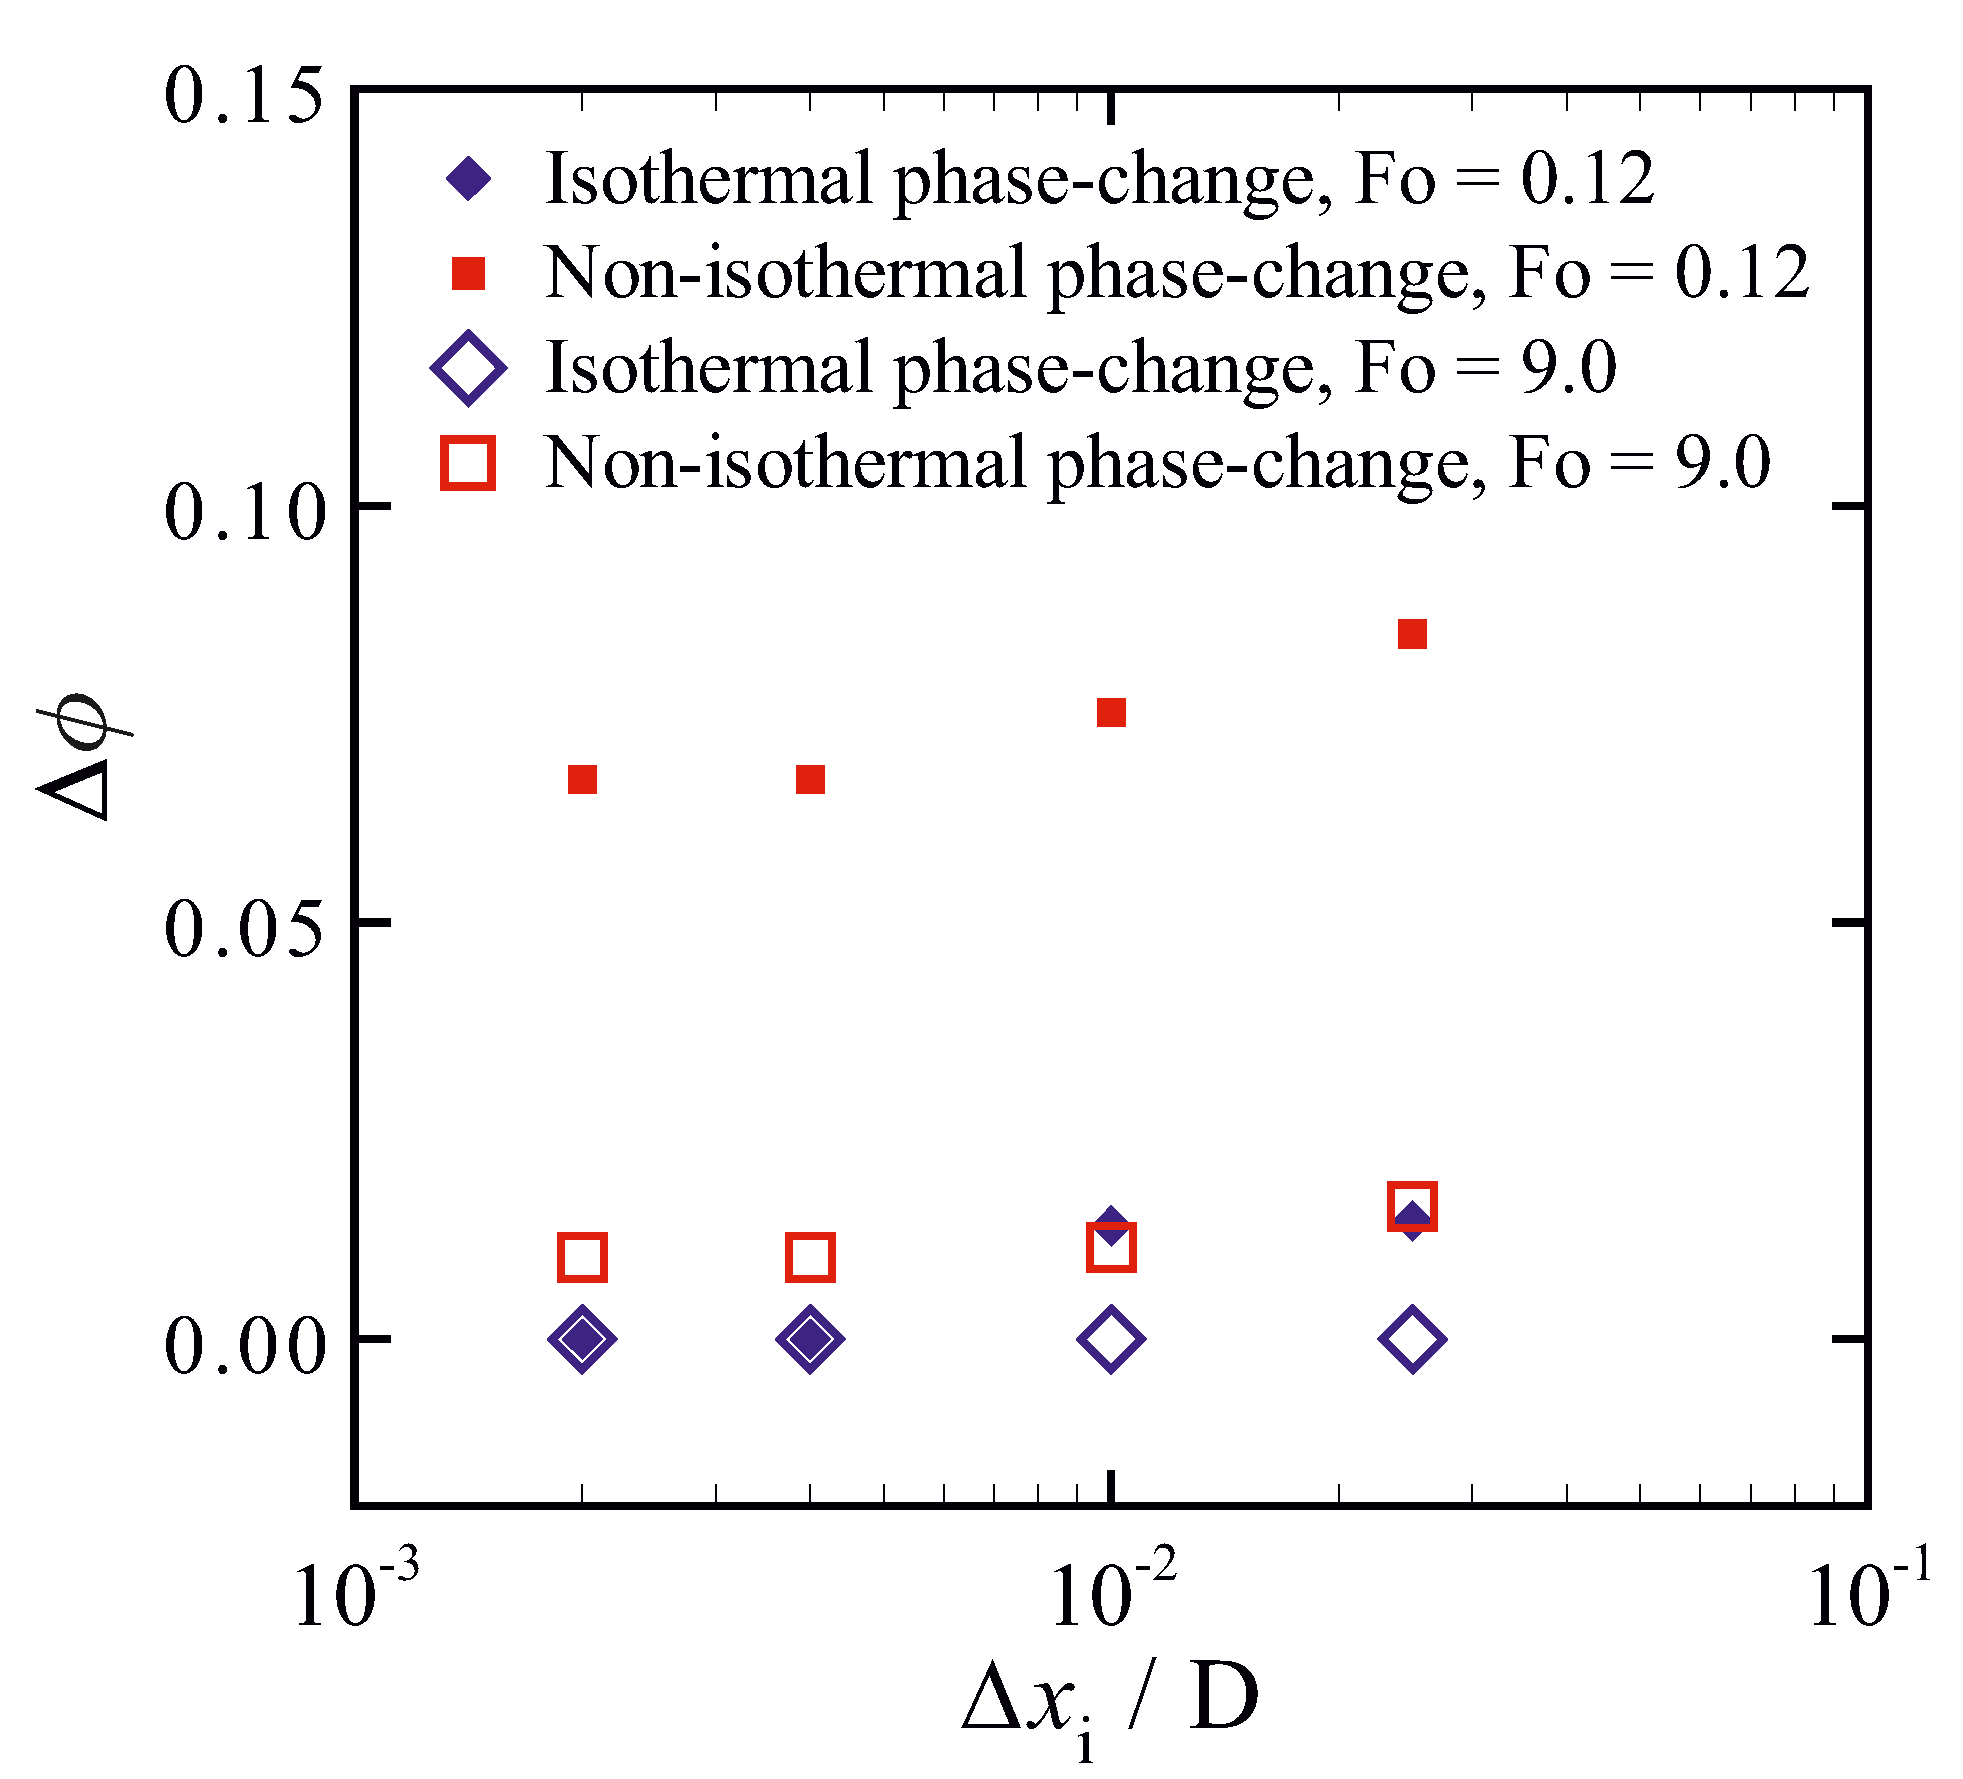
Having seen the importance of sufficient grid resolution for isothermal phase-change, we considered the non-isothermal phase-change problem defined in Section 2, examining the impact of grid refinement on the sensitivity to the permeability coefficient C. For Δ T m = 50   K , Figure 7 shows the sensitivity parameter Δ ϕ , for short time (Fo = 0.12) and steady-state (Fo = 9.0) obtained with C 1 = 1 × 10 8   k g   s 1   m 3 and C 2 = 1 × 10 4   k g   s 1   m 3 . For comparison, the same problem was also solved assuming isothermal phase change ( Δ T m = 0   K ). For isothermal phase change, the results are insensitive to the chosen value of C in the steady-state, and exhibit a small sensitivity to the chosen value of C during the transient phase before reaching the steady-state that becomes negligible with reducing grid size. For non-isothermal phase change, the sensitivity to the chosen value of C is much stronger and does not vanish with decreasing grid size, even in the steady-state, as is to be expected from the fact that a physically realistic mushy zone is now present, in which flow and convective heat transfer are sensitive to the value of C. However, the sensitivity to C becomes grid independent for base grid sizes below Δ x i / D = 4 × 10 3 . Consequently, this base grid size is used in the next sections. In addition, a four-level dynamic solution-adaptive mesh refinement (i.e., Δ x N = Δ x i / 2 N , N = 1 , , 4 ) is applied to further enhance the accuracy with which we capture the solid–liquid interface.

5.3.2. Influence of the Permeability Coefficient on Predicted Results

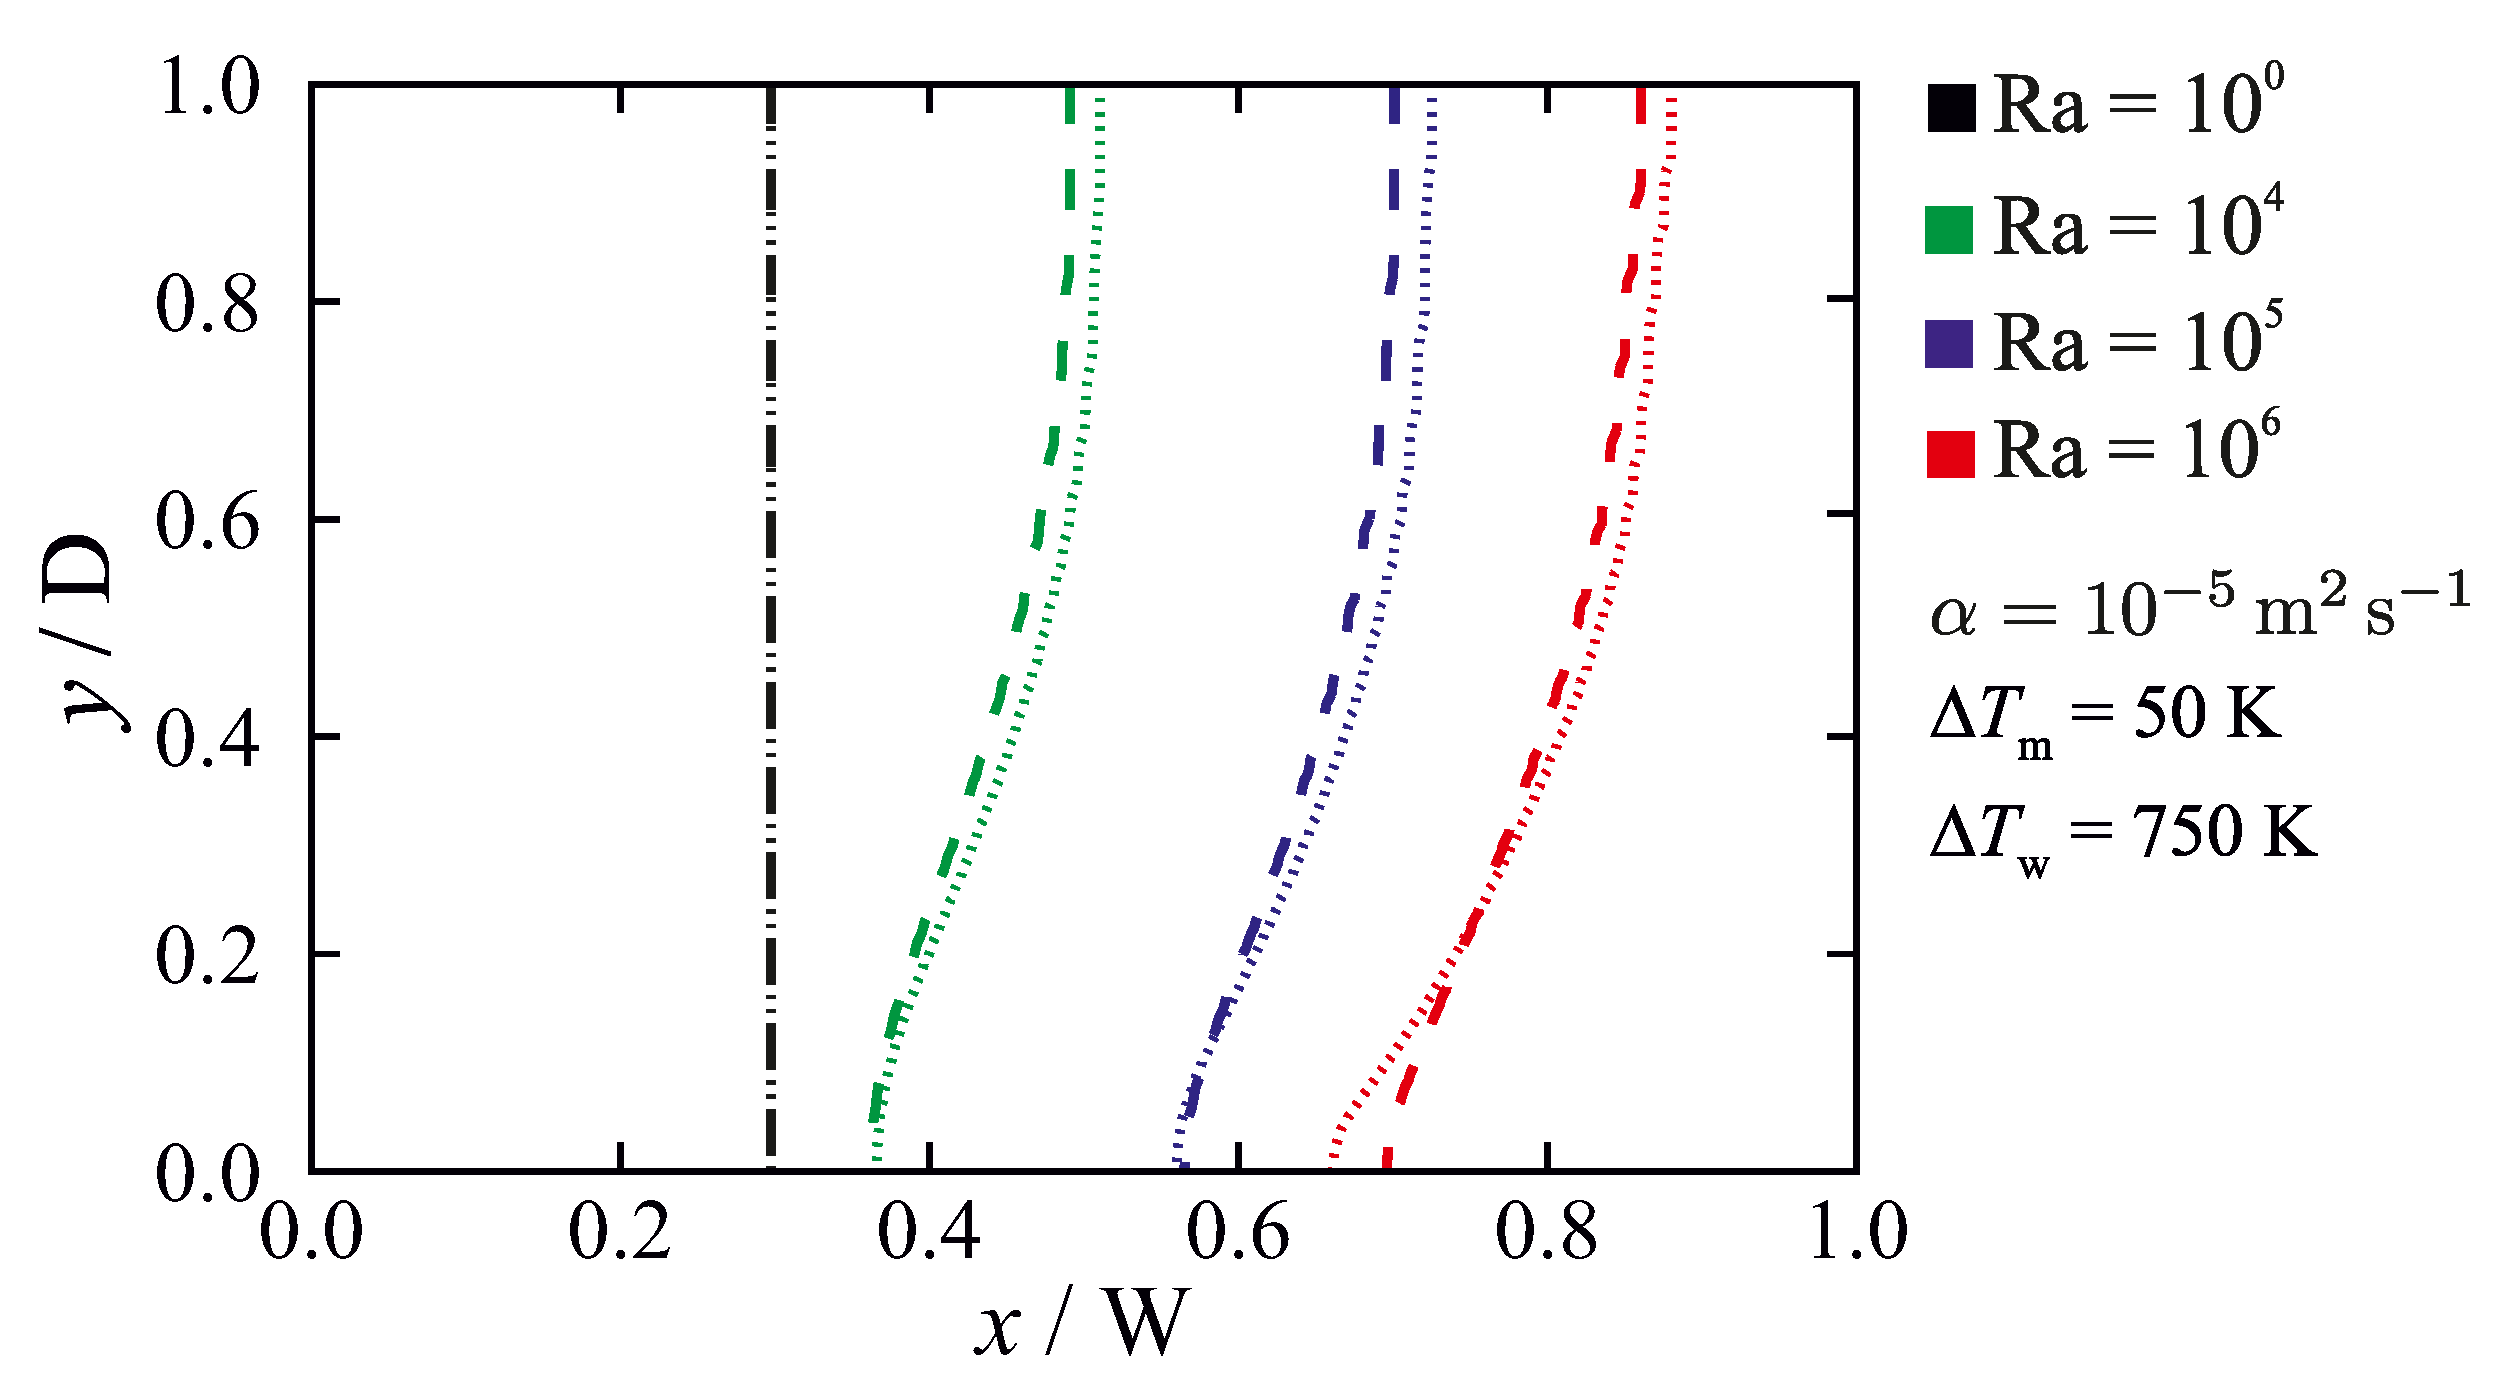
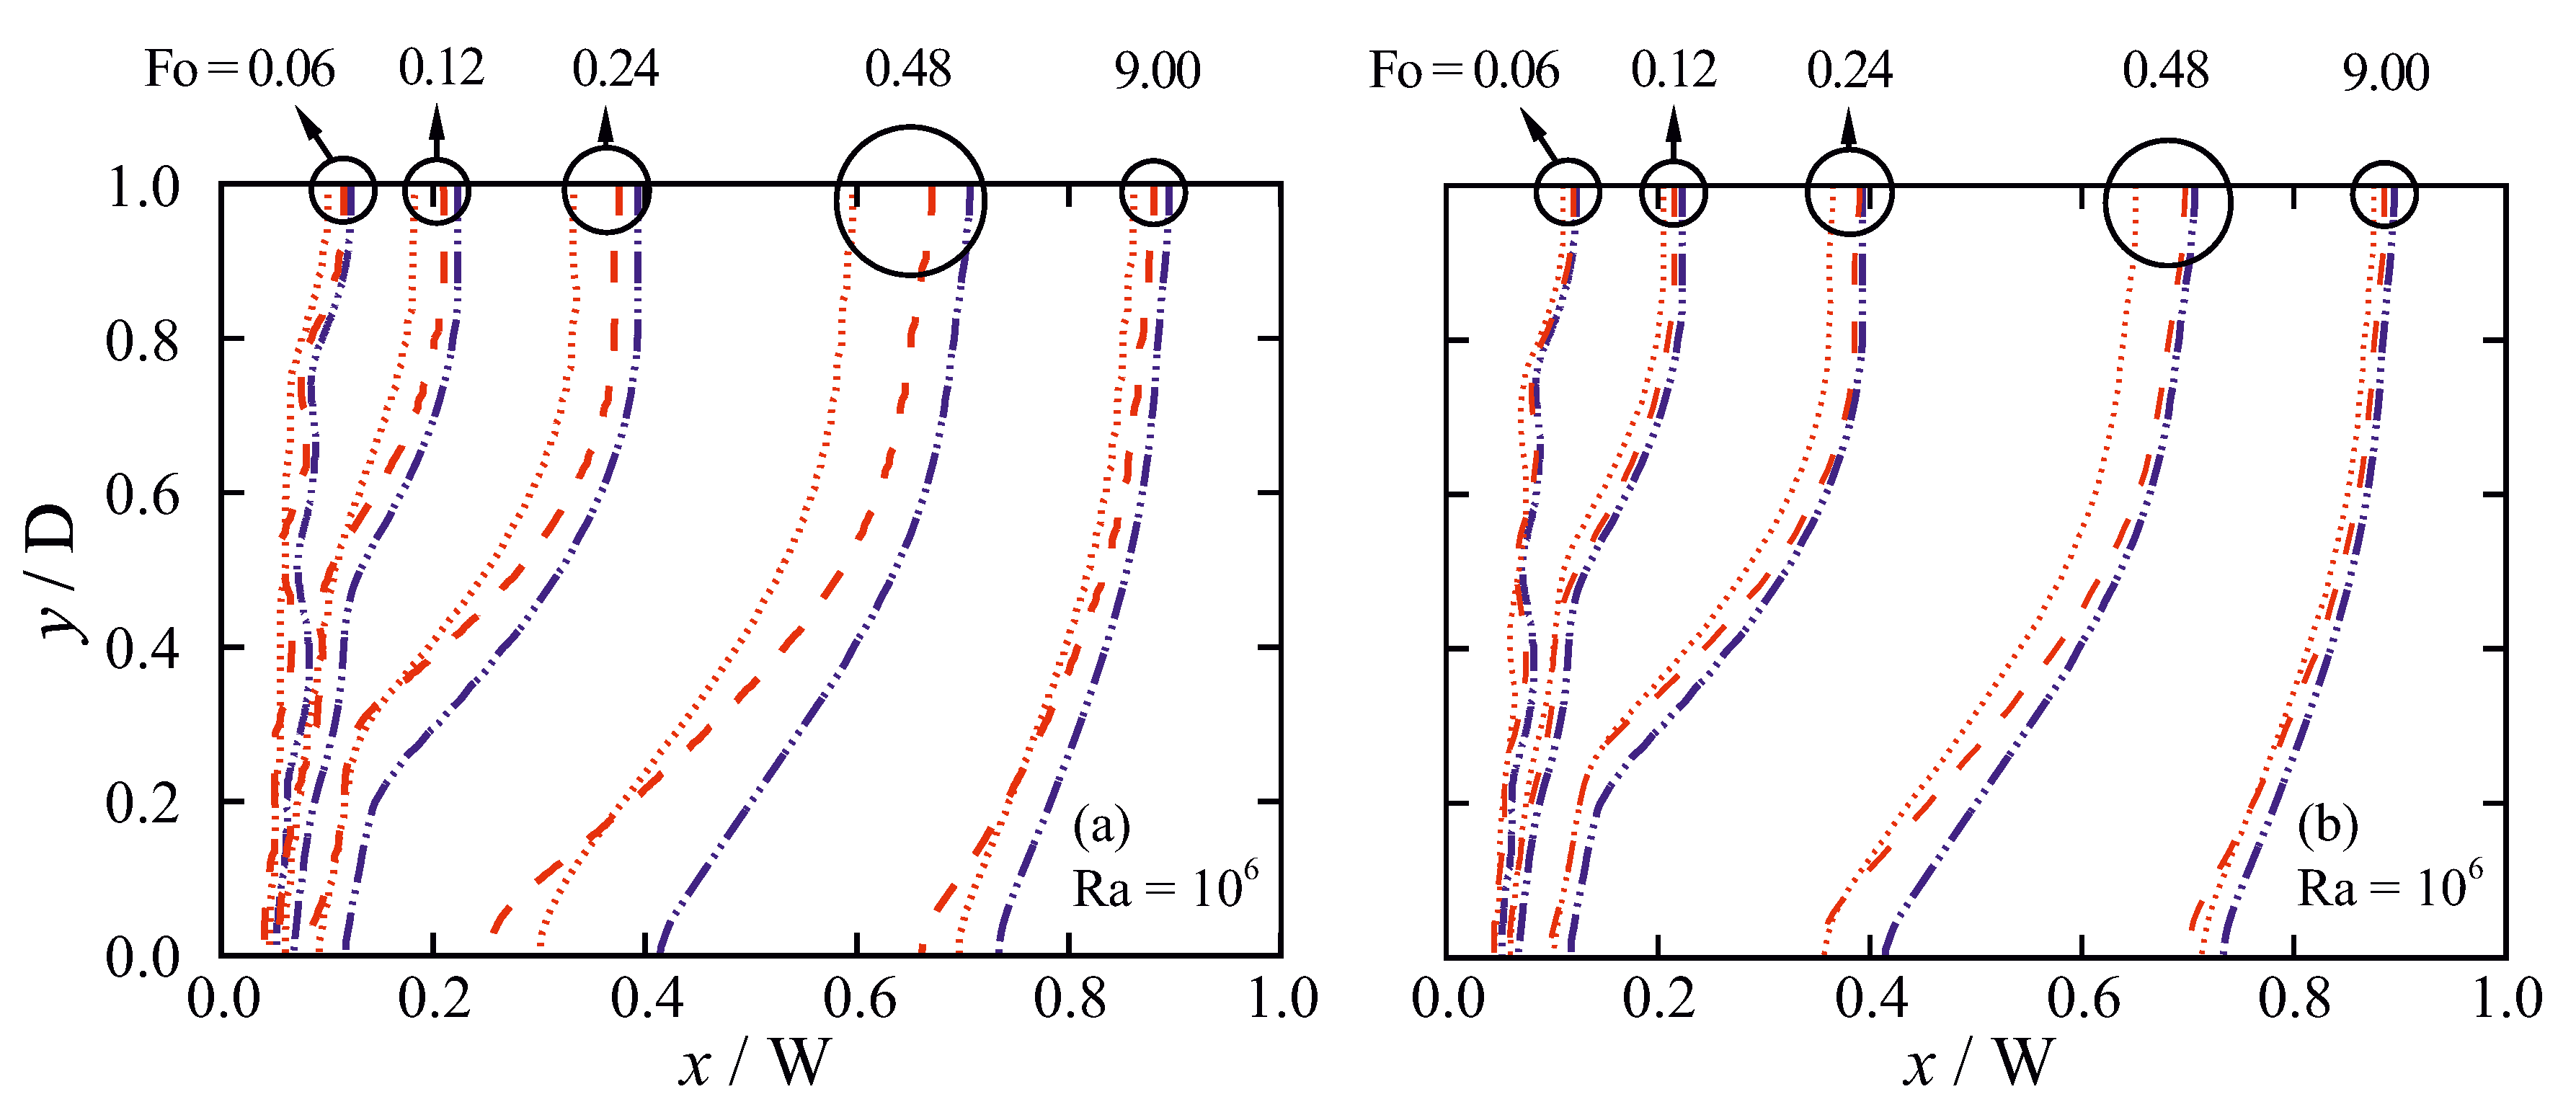
For the non-isothermal phase change problem defined in Section 2, the influence of the permeability coefficient on the predicted steady-state liquidus-line position ( f L = 1 ) is shown in Figure 8 for a fixed wall temperature difference ( Δ T w ), a fixed melting temperature range ( Δ T m ) and varying Rayleigh number (i.e., varying fluid velocities). In the virtual absence of flow, for Ra = 1, the results are insensitive to the value of the permeability coefficient. In this case, heat conduction dominates the total energy transfer around and in the mushy zone. By increasing the value of Ra, i.e. increasing fluid flow velocities and increasing convective heat transfer, the results become more sensitive to the chosen value of C. This can be understood from the fact that the value of C, through the momentum sink term, only influences the convective terms and therefore the results become more sensitive to C when convection plays an important role in total heat transfer in the mushy zone.
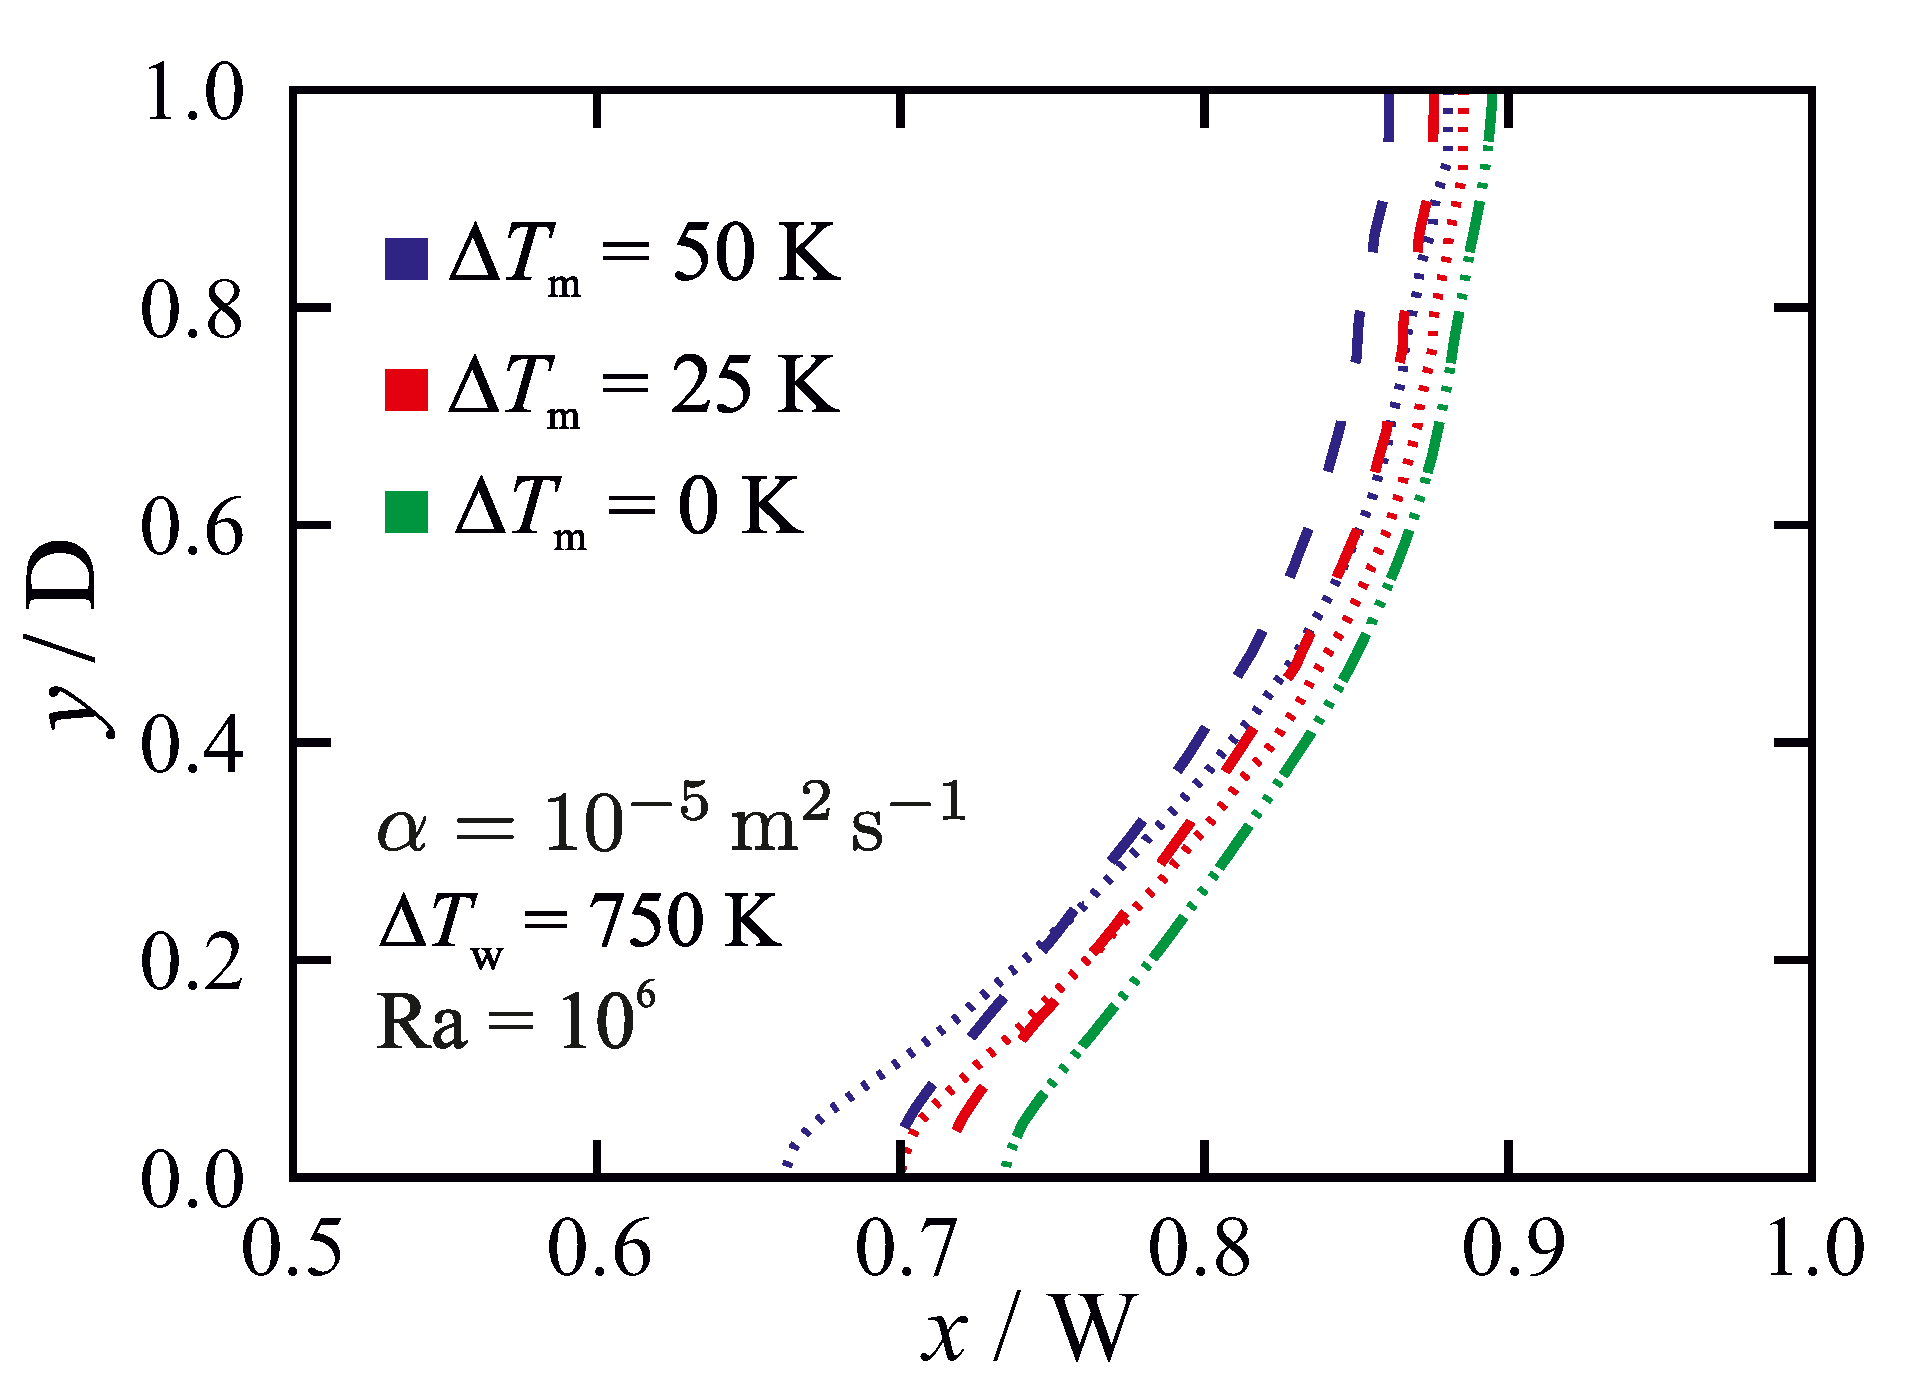
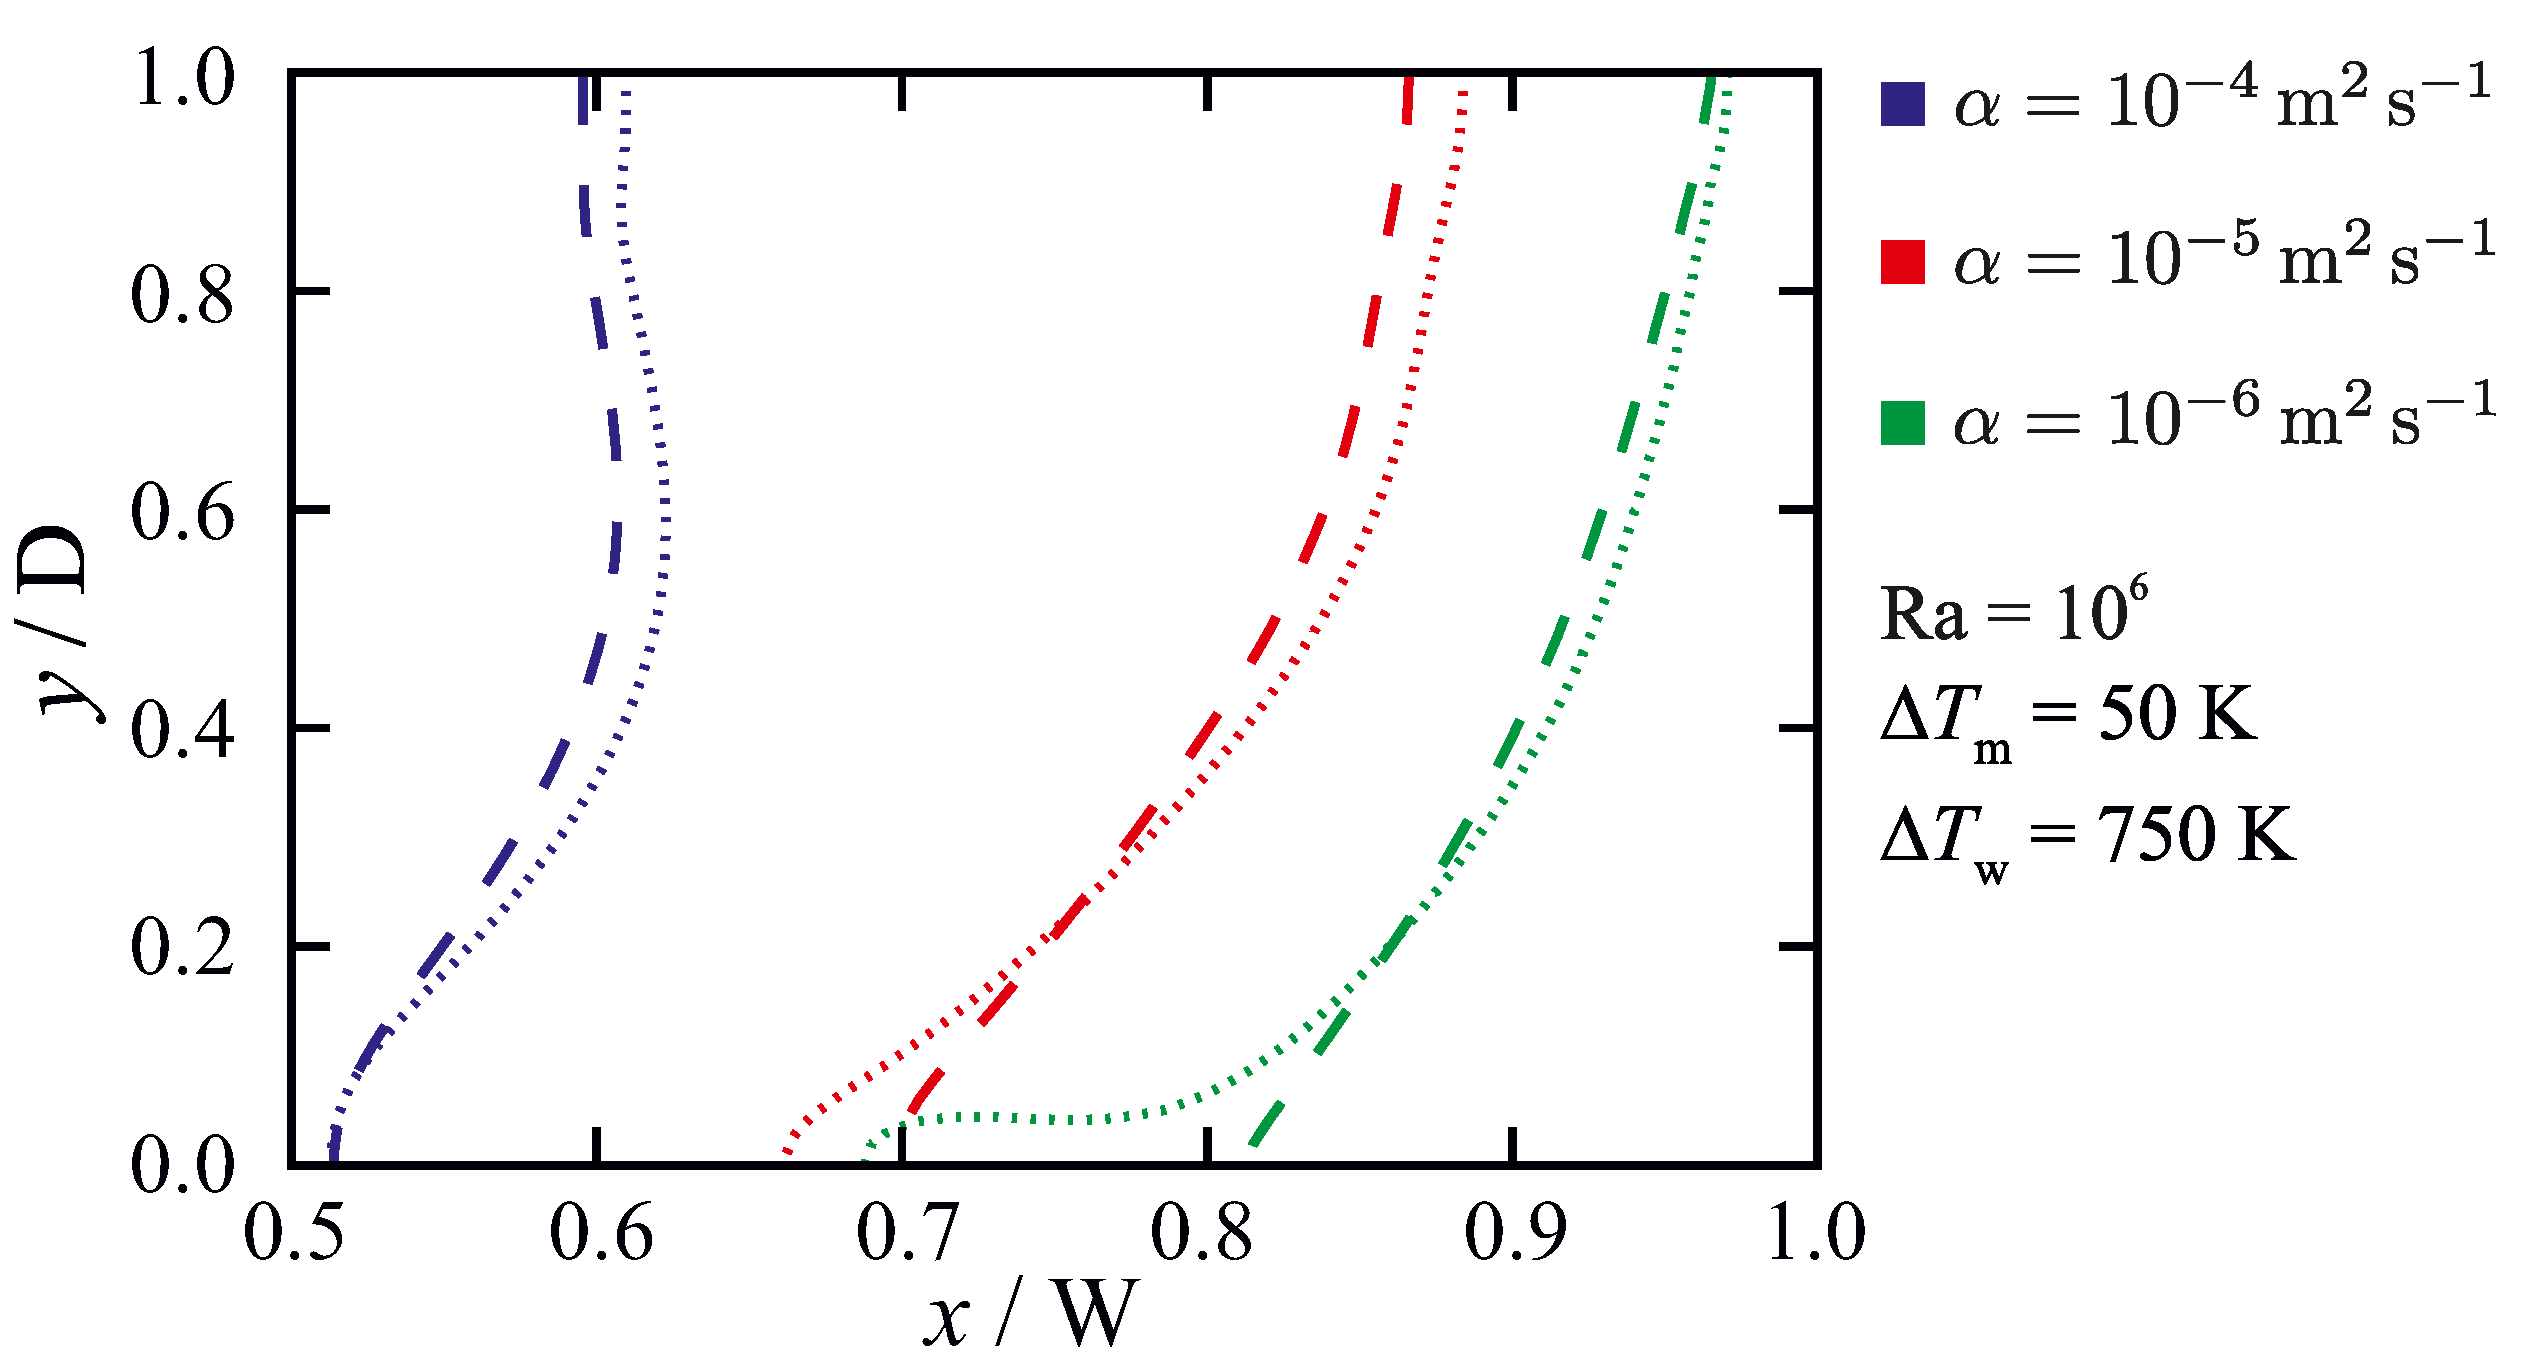
Figure 9 shows the effect of the permeability coefficient for a fixed melting temperature range ( Δ T m ) with different wall-temperature differences ( Δ T w ). Here, a higher value of Δ T w (i.e., smaller θ ) leads to a smaller mushy zone thickness, and consequently a reduced sensitivity to the permeability coefficient. Similarly, for a fixed ( Δ T w ), reducing ( Δ T m ) decreases the mushy zone thickness and as a result lower the sensitivity to the permeability coefficient C, as shown in Figure 10. In summary, the results show that non-isothermal phase-change simulations are less affected by the chosen value of the permeability coefficient C when the mushy zone has a smaller thickness (i.e., smaller θ ), as this leads to the conductive heat transfer through the mushy zone being large compared to the convective heat transfer. A change in the thermal diffusivity of the material can therefore affect the sensitivity of the numerical predictions to the value of the permeability coefficient. Figure 11 indicates the sensitivity of the results to the chosen value of the permeability coefficient as a function of thermal diffusivity of the material for a fixed melting temperature range ( Δ T m ) and wall-temperature difference ( Δ T w ). It is seen that sensitivity to the permeability coefficient decreases with increasing thermal diffusivity of the material, which can be attributed to the enhancement of heat conduction contribution to the total heat transfer.
The influence of the permeability coefficient on the time evolution of the melt pool shape is presented in Figure 12. The results are indeed independent of the permeability coefficient for an isothermal phase-change. A similar conclusion has also been drawn after monitoring the time variations of the liquid fraction obtained from numerical simulations [52,59]. However, for non-isothermal phase change with a thick mushy zone ( θ = 1/15) and strong flow (Ra = 10 6 ), the results are very sensitive to the chosen value of the permeability coefficient, resulting is different pool shapes and rates of phase-change. Less sensitivity to the value of C is found for a thin mushy zone ( θ = 1 / 30 ). The numerical predictions are also less sensitive to the permeability coefficient at early time instances, when the fluid flow is characterised by low velocities.

6. Discussion

The results reveal that, depending on the temperature gradient, velocity field and thermophysical properties of the phase-change material, which in turn determine the mushy zone thickness, numerical predictions of phase-change problems can show sensitivity to the value of the permeability coefficient. A general guideline is presented here that allows prediction and evaluation of the influence of the permeability coefficient in phase-change simulations. This concept involves both the heat transfer mechanism and the mushy zone thickness.
For phase-change problems without fluid flow, the mushy zone thickness ( m t ) can be estimated as
m t = Δ T m T = Δ T m · L T h T c ,
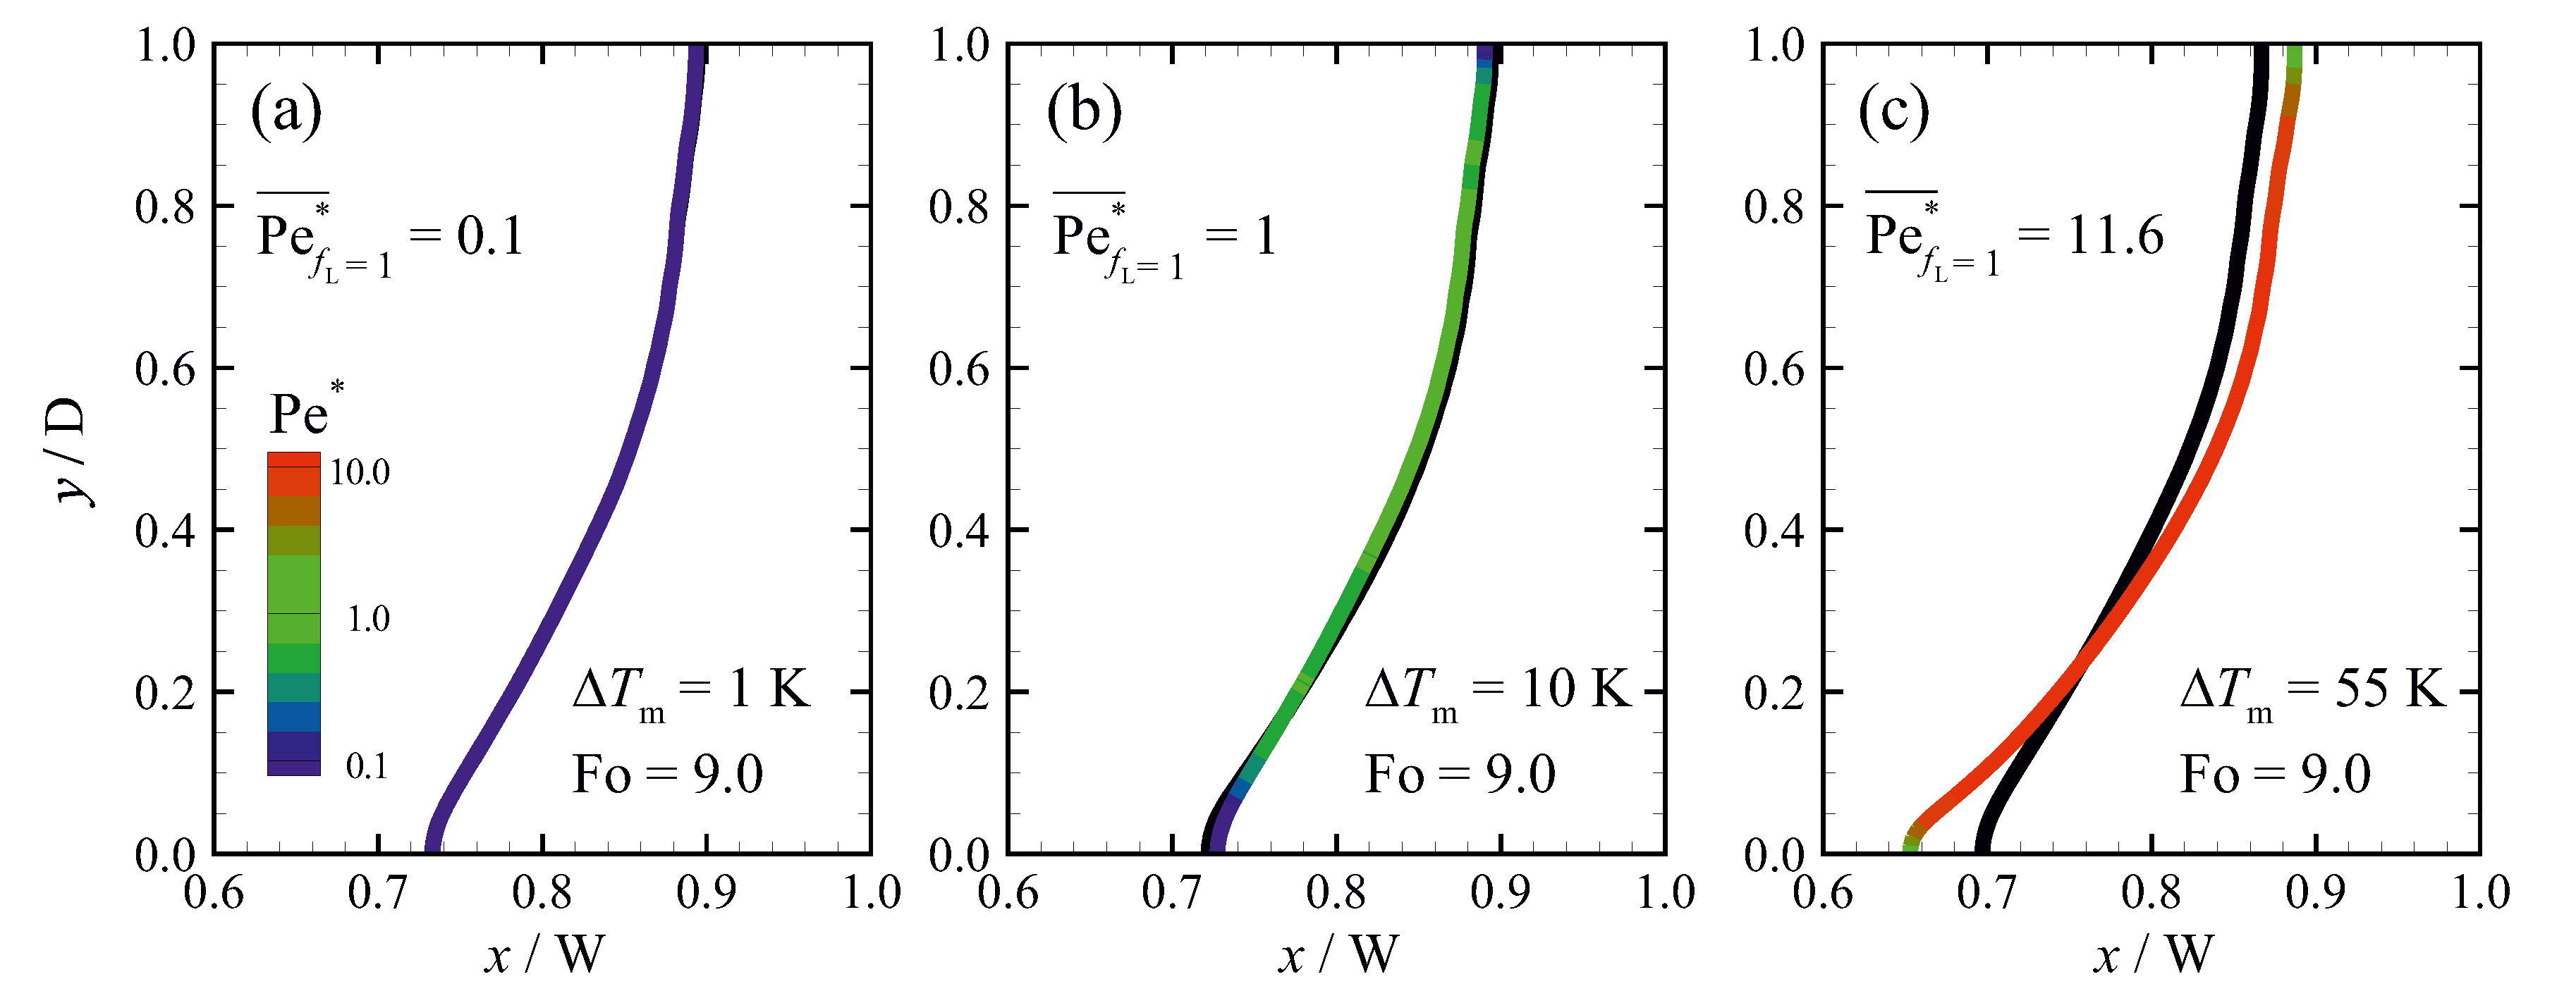
where L is a characteristic length scale. The fluid flow can alter the mushy zone thickness when convective heat transfer in the mushy zone is of significance. This can be expressed through a Péclet number, which expresses the ratio between the rate of heat advection and heat diffusion. To identify the regions where there is a significant heat transfer enhancement or reduction due to convection, and consequently where the results are sensitive to the permeability coefficient, Pe * is defined as follows:
Pe * = | V | · m t α = | V | · Δ T m · L α T h T c .
Non-zero values of Pe * adjacent to the solid–liquid interface indicate increased sensitivity to the permeability coefficient. For isothermal phase-change, Pe * is zero and predictions are independent of the permeability coefficient.
Sensitivity of the numerical predictions to the value of permeability coefficient C has been appraised for the problem defined in Section 2, using three different melting temperature ranges Δ T m and a fixed Δ T w = 750   K , and the results are shown in Figure 13. Higher values of Pe * ( O ( 10 ) ) along the melting front for the case with Δ T m = 55   K (Figure 13c) compared to the case with Δ T m = 10   K (Figure 13b) indicate that the numerical predictions are more sensitive to the permeability coefficient, which is consistent with the results presented in Figure 10 and Figure 12. When the values of Pe * along the interface are small (i.e., Pe * 1 ), the results appear to be insensitive to the permeability coefficient, while, for Pe * 1 , the results are sensitive to C.
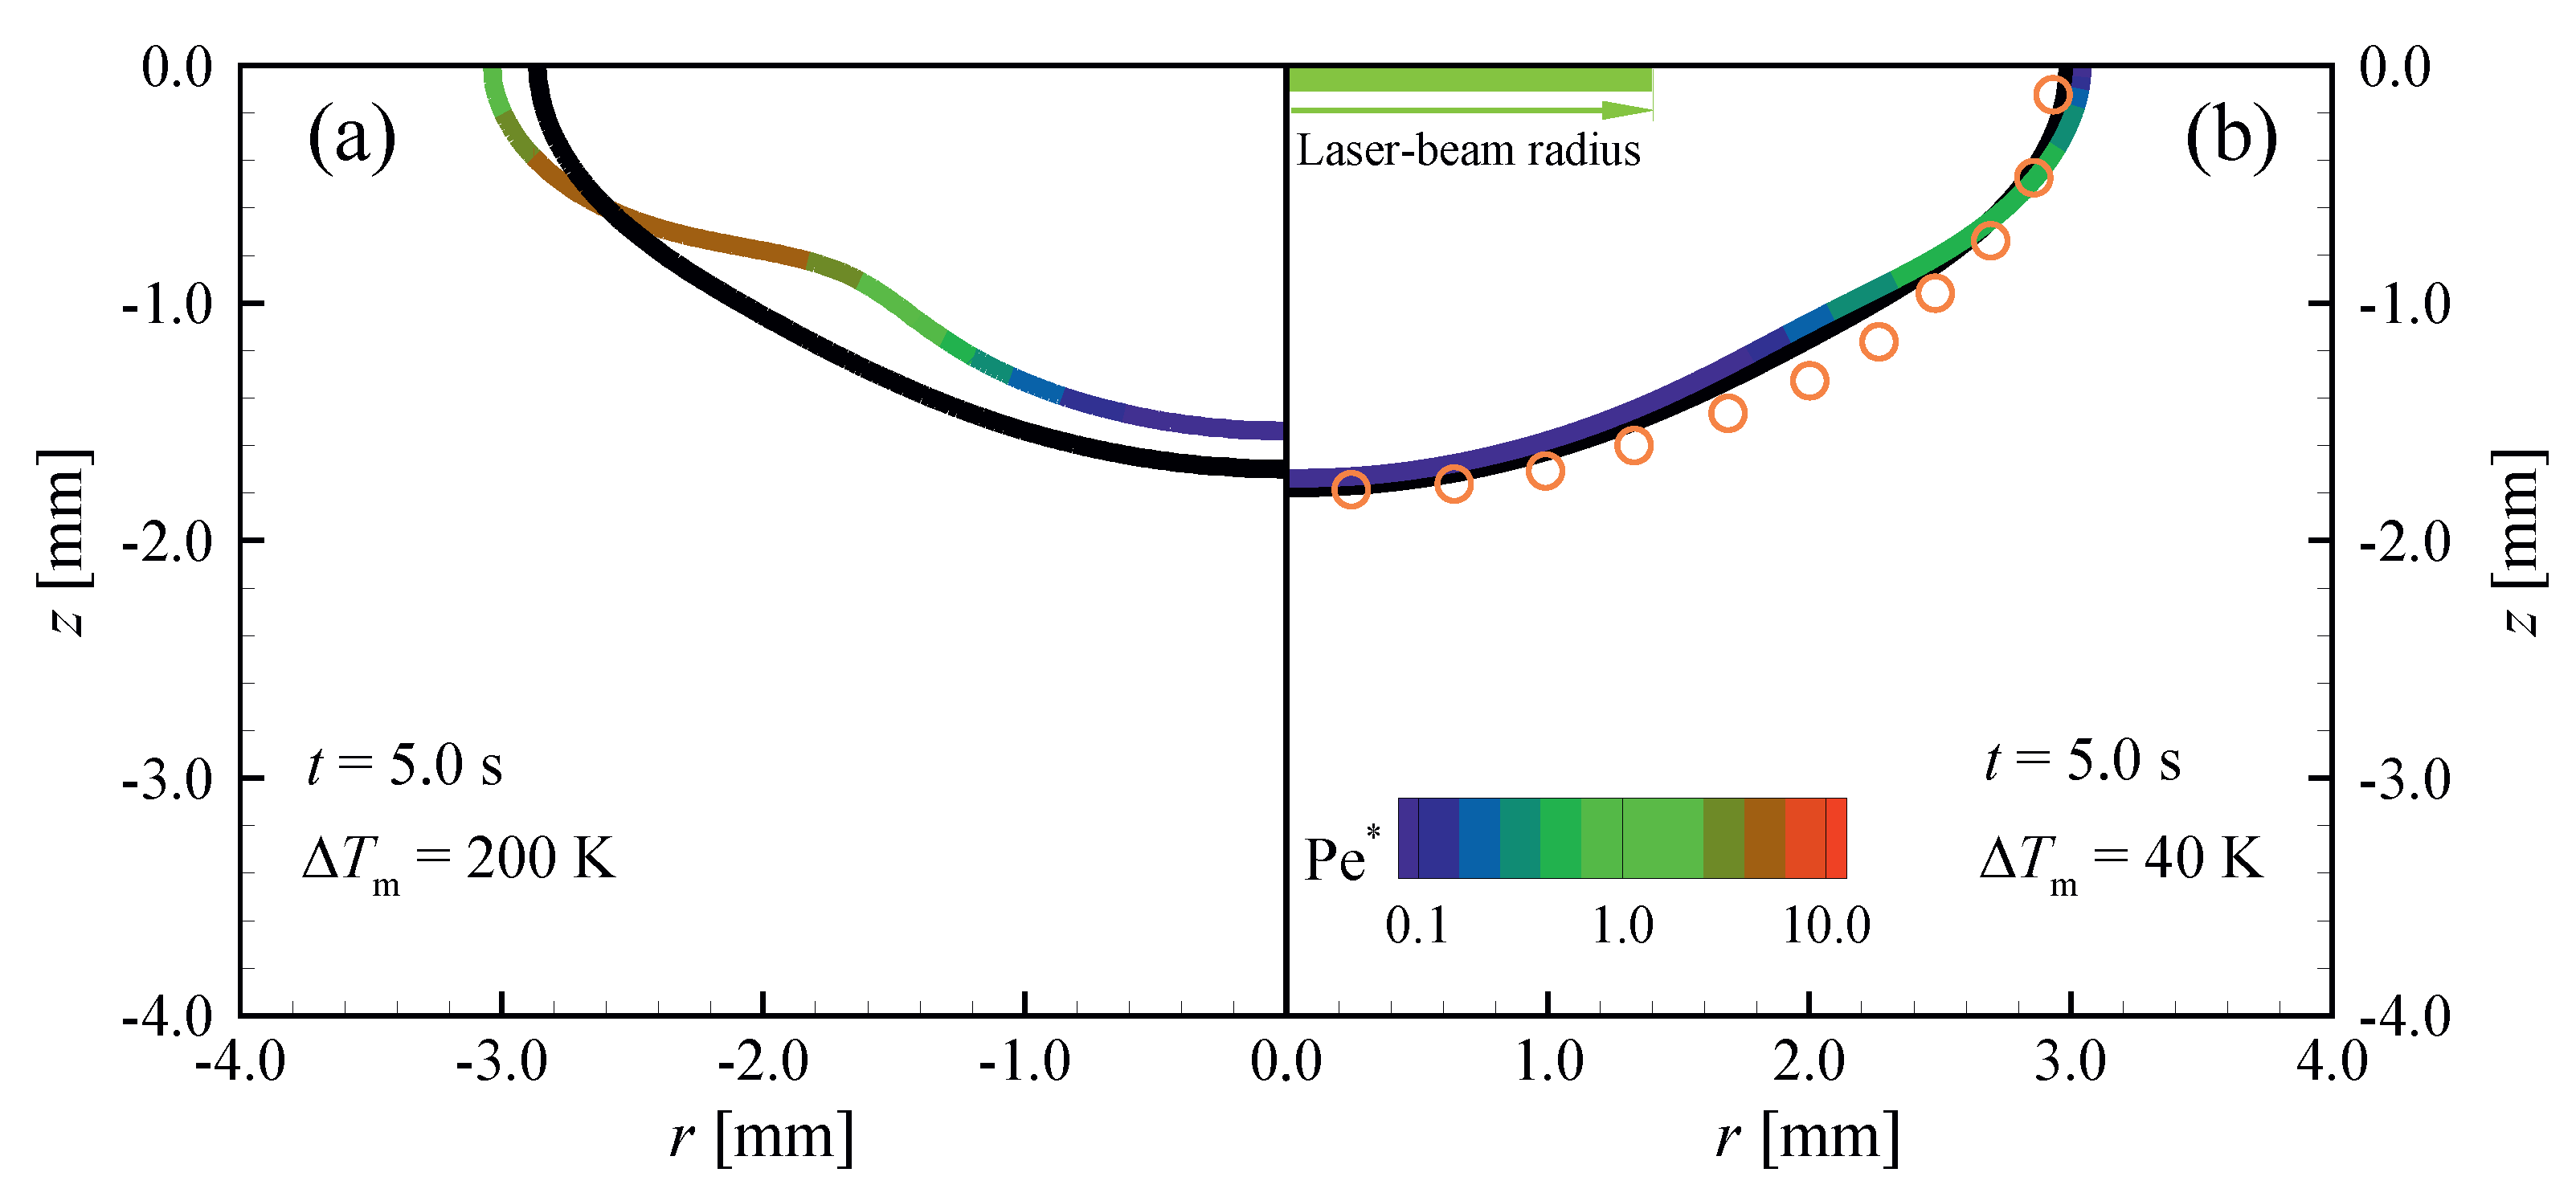
The general applicability of the proposed Pe * criterion is also examined for a simulation of a laser spot melting process, which was carried out experimentally by Pitscheneder et al. [60]. A steel plate containing 20 ppm of sulphur was heated using a stationary laser beam with a power of 5200   W and a top-hat radius of 1.4   m m . The surface absorptivity is set to 0.13 [60]. Material properties of the steel plate are assumed to be constant and temperature independent, except for the surface tension of the molten material, and can be found in [60,61,62]. Variations of surface tension with temperature are modelled using the expression proposed by Sahoo et al. [63]. Melting of the material and associated heat and fluid flow are numerically predicted using permeability coefficients of C = 10 6 , 10 8 and 10 10   k g   s 1   m 3 . To study the influence of the mushy-zone thickness on the sensitivity to C through Pe * , the melting-temperature range ( Δ T m ) of the material is changed artificially to 40   K and 200   K .
Figure 14 shows the position of melting front ( f L = 1) at t = 5   s , as well as the value of Pe * along it when using different permeability coefficients and melting temperature ranges. The laser-beam diameter is chosen here as the characteristic length scale L to calculate Pe * . Higher values of Pe * are found for larger Δ T m , predicting more sensitivity to the permeability coefficient as is indeed observed when comparing Figure 14a and Figure 14b. Due to a steep increase in the momentum sink term with liquid fraction for large permeability coefficients, all predictions are found to converge to an identical solution for very large C. However, a very large value of the permeability can lead to numerical instabilities.

7. Conclusions

A systematic study was performed to scrutinise the influence of the permeability coefficient on the numerical predictions of isothermal and non-isothermal phase-change simulations using the enthalpy-porosity method.
For isothermal phase-change problems, reducing the cell size diminishes the influence of the permeability coefficient on the results, which become independent of the permeability coefficient for fine enough meshes. A grid independent solution of an isothermal phase-change problem is independent of the permeability coefficient. However, not every numerical result that is independent of the permeability coefficient is grid independent.
Numerical predictions of non-isothermal phase-change problems are inherently dependent on the permeability coefficient. The sensitivity of the numerical predictions to the permeability coefficient increases with increased mushy zone thickness and increased fluid flow velocities perpendicular to the solid–liquid interface. A method is proposed to predict and evaluate the influence of the permeability coefficient on numerical predictions, and verified for two-dimensional phase-change problems including laser spot melting. Large values of Pe * 1 adjacent to the solid–liquid interface indicate a strong sensitivity and Pe * 1 indicates insensitivity to the permeability coefficient C.

Author Contributions

Conceptualisation, A.E., C.R.K. and I.M.R.; methodology, A.E.; software, A.E.; validation, A.E.; formal analysis, A.E.; investigation, A.E.; resources, A.E., C.R.K, and I.M.R.; data curation, A.E.; writing—original draft preparation, A.E.; writing—review and editing, A.E., C.R.K., and I.M.R; visualisation, A.E.; supervision, C.R.K. and I.M.R.; project administration, A.E. and I.M.R.; and funding acquisition, I.M.R.

Funding

This work was supported by Nederlandse Organisatie voor Wetenschappelijk Onderzoek [Grant Number 13HTM10] and Stichting voor Fundamenteel Onderzoek der Materie [Grant Number 13HTM10].

Acknowledgments

This research was carried out under project number F31.7.13504 in the framework of the Partnership Program of the Materials innovation institute M2i (www.m2i.nl) and the Foundation for Fundamental Research on Matter (FOM) (www.fom.nl), which is part of the Netherlands Organisation for Scientific Research (www.nwo.nl). The authors would like to thank the industrial partner in this project “Allseas Engineering B.V.” for the financial support.

Conflicts of Interest

The authors declare no conflict of interest. The funders had no role in the design of the study; in the collection, analyses, or interpretation of data; in the writing of the manuscript, or in the decision to publish the results.

References

  1. Crank, J. Free and Moving Boundary Problems; Clarendon Press: Oxford, UK, 1984. [Google Scholar]
  2. Shyy, W. Multi-scale computational heat transfer with moving solidification boundaries. Int. J. Heat Fluid Flow 2002, 23, 278–287. [Google Scholar] [CrossRef]
  3. Rappaz, M. Modelling of microstructure formation in solidification processes. Int. Mater. Rev. 1989, 34, 93–124. [Google Scholar] [CrossRef]
  4. Dutil, Y.; Rousse, D.R.; Salah, N.B.; Lassue, S.; Zalewski, L. A review on phase-change materials: Mathematical modeling and simulations. Renew. Sustain. Energy Rev. 2011, 15, 112–130. [Google Scholar] [CrossRef]
  5. Verma, S.; Dewan, A. Solidification Modeling: Evolution, Benchmarks, Trends in Handling Turbulence, and Future Directions. Metall. Mater. Trans. B 2014, 45, 1456–1471. [Google Scholar] [CrossRef]
  6. Jaafar, M.A.; Rousse, D.R.; Gibout, S.; Bédécarrats, J.P. A review of dendritic growth during solidification: Mathematical modeling and numerical simulations. Renew. Sustain. Energy Rev. 2017, 74, 1064–1079. [Google Scholar] [CrossRef]
  7. Basu, B.; Date, A.W. Numerical modelling of melting and solidification problems—A review. Sadhana 1988, 13, 169–213. [Google Scholar] [CrossRef]
  8. Lacroix, M.; Voller, V.R. Finite difference solutions of solidification phase change problems: transformed versus fixed grids. Numer. Heat Transf. Part B Fundam. 1990, 17, 25–41. [Google Scholar] [CrossRef]
  9. Voller, V.R. Numerical Methods for Phase-Change Problems. In Handbook of Numerical Heat Transfer; Wiley-Blackwell: Hoboken, NJ, USA, 2009; Chapter 19; pp. 593–622. [Google Scholar] [CrossRef]
  10. Mencinger, J. Numerical simulation of melting in two-dimensional cavity using adaptive grid. J. Comput. Phys. 2004, 198, 243–264. [Google Scholar] [CrossRef]
  11. Hannoun, N.; Alexiades, V.; Mai, T.Z. A reference solution for phase change with convection. Int. J. Numer. Methods Fluids 2005, 48, 1283–1308. [Google Scholar] [CrossRef]
  12. Lan, C.; Liu, C.; Hsu, C. An Adaptive Finite Volume Method for Incompressible Heat Flow Problems in Solidification. J. Comput. Phys. 2002, 178, 464–497. [Google Scholar] [CrossRef]
  13. Worster, M.G. Convection in mushy layers. Annu. Rev. Fluid Mech. 1997, 29, 91–122. [Google Scholar] [CrossRef]
  14. Quéré, P.L.; Gobin, D. A note on possible flow instabilities in melting from the side. Int. J. Therm. Sci. 1999, 38, 595–600. [Google Scholar] [CrossRef]
  15. Morgan, K. A numerical analysis of freezing and melting with convection. Comput. Methods Appl. Mech. Eng. 1981, 28, 275–284. [Google Scholar] [CrossRef]
  16. Voller, V.; Prakash, C. A fixed grid numerical modelling methodology for convection-diffusion mushy region phase-change problems. Int. J. Heat Mass Transf. 1987, 30, 1709–1719. [Google Scholar] [CrossRef]
  17. Voller, V.R.; Cross, M.; Markatos, N.C. An enthalpy method for convection/diffusion phase change. Int. J. Numer. Methods Eng. 1987, 24, 271–284. [Google Scholar] [CrossRef]
  18. Brinkman, H.C. A calculation of the viscous force exerted by a flowing fluid on a dense swarm of particles. Flow Turbul. Combust. 1949, 1. [Google Scholar] [CrossRef]
  19. Poirier, D.R. Permeability for flow of interdendritic liquid in columnar-dendritic alloys. Metall. Trans. B 1987, 18, 245–255. [Google Scholar] [CrossRef]
  20. Singh, A.K.; Pardeshi, R.; Basu, B. Modelling of convection during solidification of metal and alloys. Sadhana 2001, 26, 139–162. [Google Scholar] [CrossRef]
  21. Fadl, M.; Eames, P.C. Numerical investigation of the influence of mushy zone parameter Amush on heat transfer characteristics in vertically and horizontally oriented thermal energy storage systems. Appl. Therm. Eng. 2019, 151, 90–99. [Google Scholar] [CrossRef]
  22. Hong, Y.; Ye, W.B.; Du, J.; Huang, S.M. Solid-liquid phase-change thermal storage and release behaviors in a rectangular cavity under the impacts of mushy region and low gravity. Int. J. Heat Mass Transf. 2019, 130, 1120–1132. [Google Scholar] [CrossRef]
  23. Rai, R.; Roy, G.G.; DebRoy, T. A computationally efficient model of convective heat transfer and solidification characteristics during keyhole mode laser welding. J. Appl. Phys. 2007, 101, 054909. [Google Scholar] [CrossRef]
  24. Zheng, Y.; Li, Q.; Zheng, Z.; Zhu, J.; Cao, P. Modeling the impact, flattening and solidification of a molten droplet on a solid substrate during plasma spraying. Appl. Surf. Sci. 2014, 317, 526–533. [Google Scholar] [CrossRef]
  25. Yang, X.H.; Tan, S.C.; Liu, J. Numerical investigation of the phase change process of low melting point metal. Int. J. Heat Mass Transf. 2016, 100, 899–907. [Google Scholar] [CrossRef]
  26. Kousksou, T.; Mahdaoui, M.; Ahmed, A.; Msaad, A.A. Melting over a wavy surface in a rectangular cavity heated from below. Energy 2014, 64, 212–219. [Google Scholar] [CrossRef]
  27. Karami, R.; Kamkari, B. Investigation of the effect of inclination angle on the melting enhancement of phase change material in finned latent heat thermal storage units. Appl. Therm. Eng. 2019, 146, 45–60. [Google Scholar] [CrossRef]
  28. Pan, C.; Charles, J.; Vermaak, N.; Romero, C.; Neti, S.; Zheng, Y.; Chen, C.H.; Bonner, R. Experimental, numerical and analytic study of unconstrained melting in a vertical cylinder with a focus on mushy region effects. Int. J. Heat Mass Transf. 2018, 124, 1015–1024. [Google Scholar] [CrossRef]
  29. Prieto, M.; González, B. Fluid flow and heat transfer in PCM panels arranged vertically and horizontally for application in heating systems. Renew. Energy 2016, 97, 331–343. [Google Scholar] [CrossRef]
  30. Kheirabadi, A.C.; Groulx, D. Simulating phase change heat transfer using COMSOL and Fluent: Effect of the mushy-zone constant. Comput. Therm. Sci. Int. J. 2015, 7, 427–440. [Google Scholar] [CrossRef]
  31. Hosseinizadeh, S.; Darzi, A.R.; Tan, F.; Khodadadi, J. Unconstrained melting inside a sphere. Int. J. Therm. Sci. 2013, 63, 55–64. [Google Scholar] [CrossRef]
  32. Shmueli, H.; Ziskind, G.; Letan, R. Melting in a vertical cylindrical tube: Numerical investigation and comparison with experiments. Int. J. Heat Mass Transf. 2010, 53, 4082–4091. [Google Scholar] [CrossRef]
  33. Arena, S.; Casti, E.; Gasia, J.; Cabeza, L.F.; Cau, G. Numerical simulation of a finned-tube LHTES system: Influence of the mushy zone constant on the phase change behaviour. Energy Procedia 2017, 126, 517–524. [Google Scholar] [CrossRef]
  34. Kumar, M.; Krishna, D.J. Influence of Mushy Zone Constant on Thermohydraulics of a PCM. Energy Procedia 2017, 109, 314–321. [Google Scholar] [CrossRef]
  35. Sattari, H.; Mohebbi, A.; Afsahi, M.; Yancheshme, A.A. CFD simulation of melting process of phase change materials (PCMs) in a spherical capsule. Int. J. Refrig. 2017, 73, 209–218. [Google Scholar] [CrossRef]
  36. Hu, Z.; Li, A.; Gao, R.; Yin, H. Effect of the length ratio on thermal energy storage in wedge-shaped enclosures. J. Therm. Anal. Calorim. 2014, 117, 807–816. [Google Scholar] [CrossRef]
  37. Vogel, J.; Felbinger, J.; Johnson, M. Natural convection in high temperature flat plate latent heat thermal energy storage systems. Appl. Energy 2016, 184, 184–196. [Google Scholar] [CrossRef] [Green Version]
  38. Hameter, M.; Walter, H. Influence of the Mushy Zone Constant on the Numerical Simulation of the Melting and Solidification Process of Phase Change Materials. In Computer Aided Chemical Engineering; Elsevier: Amsterdam, The Netherlands, 2016; pp. 439–444. [Google Scholar] [CrossRef]
  39. Tritton, D.J. Physical Fluid Dynamics, 1st ed.; Springer: Dordrecht, The Netherlands, 1977. [Google Scholar] [CrossRef]
  40. Voller, V.R.; Swaminathan, C.R.; Thomas, B.G. Fixed grid techniques for phase change problems: A review. Int. J. Numer. Methods Eng. 1990, 30, 875–898. [Google Scholar] [CrossRef]
  41. Voller, V.R.; Swaminathan, C.R. General source-based method for solidification phase change. Numer. Heat Transf. Part B Fundam. 1991, 19, 175–189. [Google Scholar] [CrossRef]
  42. Swaminathan, C.R.; Voller, V.R. A general enthalpy method for modeling solidification processes. Metall. Trans. B 1992, 23, 651–664. [Google Scholar] [CrossRef]
  43. Ferreira, I.L.; Voller, V.R.; Nestler, B.; Garcia, A. Two-dimensional numerical model for the analysis of macrosegregation during solidification. Comput. Mater. Sci. 2009, 46, 358–366. [Google Scholar] [CrossRef]
  44. Faraji, M.; Qarnia, H.E. Numerical study of melting in an enclosure with discrete protruding heat sources. Appl. Math. Model. 2010, 34, 1258–1275. [Google Scholar] [CrossRef]
  45. Bouabdallah, S.; Bessaih, R. Effect of magnetic field on 3D flow and heat transfer during solidification from a melt. Int. J. Heat Fluid Flow 2012, 37, 154–166. [Google Scholar] [CrossRef]
  46. Mahdaoui, M.; Kousksou, T.; Blancher, S.; Msaad, A.A.; Rhafiki, T.E.; Mouqallid, M. A numerical analysis of solid–liquid phase change heat transfer around a horizontal cylinder. Appl. Math. Model. 2014, 38, 1101–1110. [Google Scholar] [CrossRef]
  47. Farsani, R.Y.; Raisi, A.; Nadooshan, A.A.; Vanapalli, S. Does nanoparticles dispersed in a phase change material improve melting characteristics? Int. Commun. Heat Mass Transf. 2017, 89, 219–229. [Google Scholar] [CrossRef]
  48. Dannenhoffer, J., III; Baron, J. Grid adaptation for the 2-D Euler equations. In Proceedings of the 23rd Aerospace Sciences Meeting. American Institute of Aeronautics and Astronautics, Reno, NV, USA, 14–17 January 1985. [Google Scholar] [CrossRef]
  49. Issa, R. Solution of the implicitly discretised fluid flow equations by operator-splitting. J. Comput. Phys. 1986, 62, 40–65. [Google Scholar] [CrossRef]
  50. Patankar, S.V. Numerical Heat Transfer and Fluid Flow, 1st ed.; Taylor & Francis Inc.: Leiden, The Netherlands, 1980. [Google Scholar]
  51. Voller, V. Development and application of a heat balance integral method for analysis of metallurgical solidification. Appl. Math. Model. 1989, 13, 3–11. [Google Scholar] [CrossRef]
  52. Kumar, L.; Manjunath, B.; Patel, R.; Markandeya, S.; Agrawal, R.; Agrawal, A.; Kashyap, Y.; Sarkar, P.; Sinha, A.; Iyer, K.; et al. Experimental investigations on melting of lead in a cuboid with constant heat flux boundary condition using thermal neutron radiography. Int. J. Therm. Sci. 2012, 61, 15–27. [Google Scholar] [CrossRef]
  53. Gau, C.; Viskanta, R. Melting and Solidification of a Pure Metal on a Vertical Wall. J. Heat Transf. 1986, 108, 174. [Google Scholar] [CrossRef]
  54. Hannoun, N.; Alexiades, V.; Mai, T.Z. Resolving the controversy over tin and gallium melting in a rectangular cavity heated from the side. Numer. Heat Transf. Part B Fundam. 2003, 44, 253–276. [Google Scholar] [CrossRef] [Green Version]
  55. Lee, Y.; Korpela, S.A. Multicellular natural convection in a vertical slot. J. Fluid Mech. 1983, 126, 91. [Google Scholar] [CrossRef]
  56. Dantzig, J.A. Modelling liquid-solid phase changes with melt convection. Int. J. Numer. Methods Eng. 1989, 28, 1769–1785. [Google Scholar] [CrossRef]
  57. Cerimele, M.; Mansutti, D.; Pistella, F. Numerical modelling of liquid/solid phase transitions: Analysis of a gallium melting test. Comput. Fluids 2002, 31, 437–451. [Google Scholar] [CrossRef]
  58. Schroeder, P.W.; Lube, G. Stabilised dG-FEM for incompressible natural convection flows with boundary and moving interior layers on non-adapted meshes. J. Comput. Phys. 2017, 335, 760–779. [Google Scholar] [CrossRef] [Green Version]
  59. Vogel, J.; Thess, A. Validation of a numerical model with a benchmark experiment for melting governed by natural convection in latent thermal energy storage. Appl. Therm. Eng. 2019, 148, 147–159. [Google Scholar] [CrossRef]
  60. Pitscheneder, W.; Debroy, T.; Mundra, K.; Ebner, R. Role of sulfur and processing variables on the temporal evolution of weld pool geometry during multikilowatt laser beam welding of steels. Weld. J. 1996, 75, 71–80. [Google Scholar]
  61. Yan, J.; Yan, W.; Lin, S.; Wagner, G. A fully coupled finite element formulation for liquid–solid–gas thermo-fluid flow with melting and solidification. Comput. Methods Appl. Mech. Eng. 2018, 336, 444–470. [Google Scholar] [CrossRef]
  62. Saldi, Z.; Kidess, A.; Kenjereš, S.; Zhao, C.; Richardson, I.; Kleijn, C. Effect of enhanced heat and mass transport and flow reversal during cool down on weld pool shapes in laser spot welding of steel. Int. J. Heat Mass Transf. 2013, 66, 879–888. [Google Scholar] [CrossRef]
  63. Sahoo, P.; Debroy, T.; McNallan, M.J. Surface tension of binary metal—Surface active solute systems under conditions relevant to welding metallurgy. Metall. Trans. B 1988, 19, 483–491. [Google Scholar] [CrossRef]
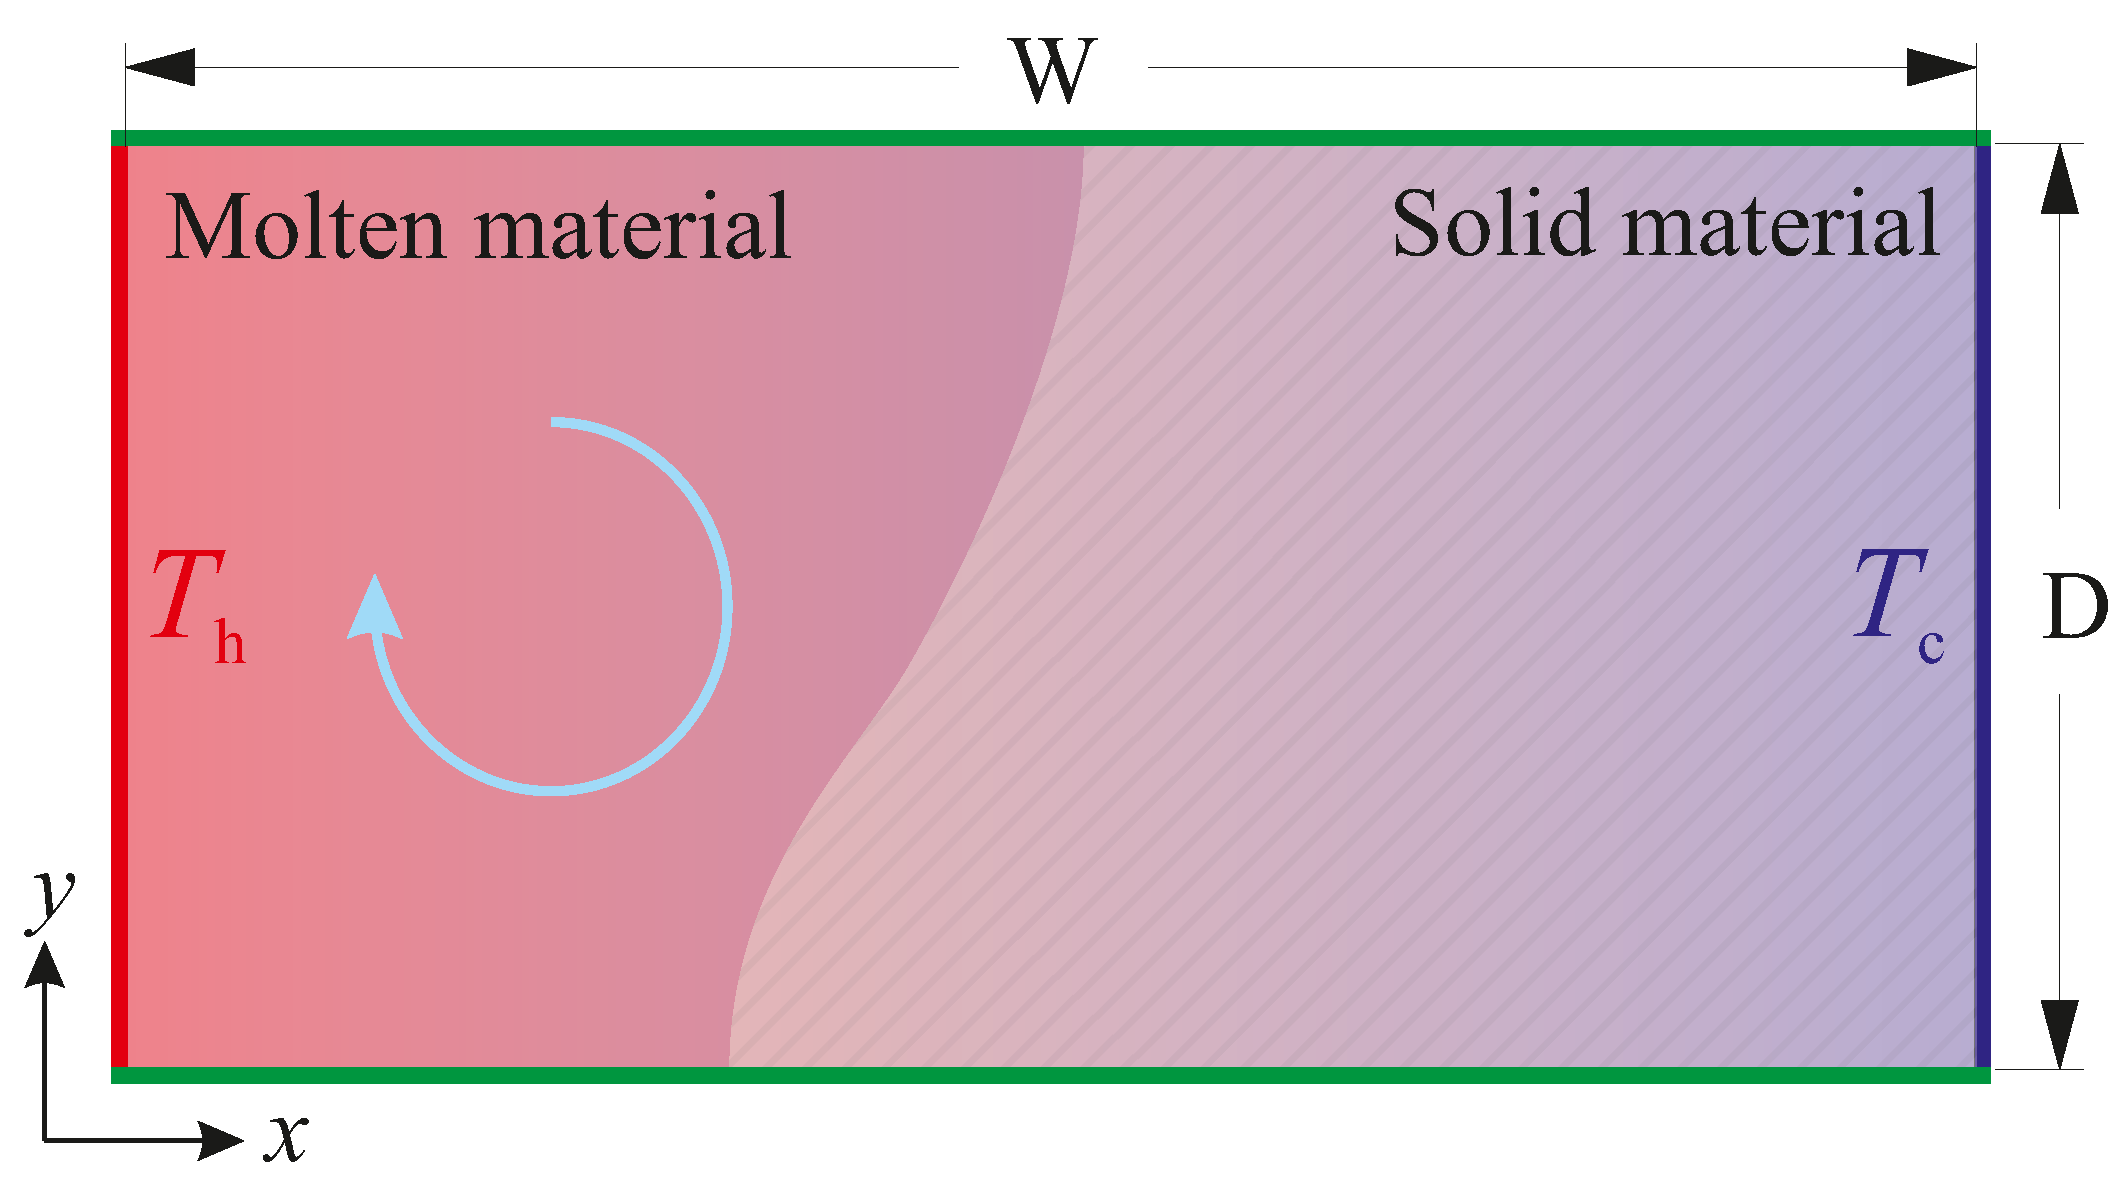
Figure 1. The schematic of the system under consideration. From t = 0 , the left vertical wall is kept at an isothermal temperature T h , and the right vertical wall is kept at an isothermal temperature T c , whereas the horizontal walls are adiabatic.
Energies 12 04360 g001
Figure 2. Code validation and solver verification. (a) One-dimensional benchmark problem; time evolution of the mushy-zone thickness (blue: solidus; red: liquidus) predicted by the present model implemented in Fluent and OpenFOAM compared with available semi-analytical [51] and numerical [41] results. (b) Two-dimensional benchmark problem; time evolution of solid–liquid interface during isothermal phase-change with convection predicted by the present model implemented in Fluent and OpenFOAM compared with numerical results of Hannoun et al. [11].
Energies 12 04360 g002
Figure 3. Comparisons of numerically determined melting-front positions in a rectangular enclosure subject to natural convection using the present model implemented in Fluent with experimental observations of isothermal melting of lead using thermal neutron radiography [52].
Energies 12 04360 g003
Figure 4. The influence of the computational cell size and the permeability coefficient on predicted melting front position for the gallium melting problem. Grid cell size: (a) Δ x / D 3.33 × 10 2 ; (b) Δ x / D 3.33 × 10 2 ; (c) Δ x / D 6.67 × 10 3 ; and (d) Δ x / D 3.33 × 10 3 .
Energies 12 04360 g004
Figure 5. The relative difference between the solid–liquid interface morphologies ( Γ (defined in Equation (13)), circles in blue), and the relative difference between the liquid fractions ( Δ ϕ (defined below Equation (12)), squares in red) at t = 150   s when using permeability coefficients C 1 = 1 × 10 8     k g   s 1   m 3 and C 2 = 1 × 10 4     k g   s 1   m 3 as a function of grid size ( Δ x ). Larger values of Δ ϕ and Γ indicate more sensitivity to the value of the permeability coefficient C. Symbols: results obtained from numerical simulations; dashed lines: curve-fit.
Energies 12 04360 g005
Figure 6. The ratio of the maximum velocity magnitude in solid regions to that in liquid regions ( | V solid | Max / | V liquid | Max , blue circles) and the predicted liquid fractions ϕ (red squares) for various values of the sink term C D 2 / μ ϵ .
Energies 12 04360 g006
Figure 7. The relative difference between liquid fractions predicted with different permeability coefficients (i.e., C 1 = 1 × 10 8   k g   s 1   m 3 and C 2 = 1 × 10 4   k g   s 1   m 3 ) on different grid densities. Diamonds (in blue): isothermal phase-change; squares (in red): non-isothermal phase-change; unfilled symbols: Fo = 9.0 (steady-state condition); filled symbols: Fo = 0.12.
Energies 12 04360 g007
Figure 8. The influence of the permeability coefficient on predicted liquidus-line ( f L = 1) position for different Rayleigh numbers ( Δ T m = 50   K ; Δ T w = 750   K ; dashed lines: C = 1 × 10 8   k g   s 1   m 3 ; dotted lines: C = 1 × 10 4   k g   s 1   m 3 ). The results are given for Fo = 9, in which steady-state solutions are achieved.
Energies 12 04360 g008
Figure 9. The influence of the permeability coefficient on predicted liquidus-line ( f L = 1) position for different wall-temperature differences Δ T w , at Δ T m = 50   K , and Ra = 10 6 . Dashed lines: C = 1 × 10 8   k g   s 1   m 3 ; dotted lines: C = 1 × 10 4   k g   s 1   m 3 . The results are given for Fo = 9, in which steady-state solutions are achieved.
Energies 12 04360 g009
Figure 10. The influence of the permeability coefficient on predicted liquidus-line ( f L = 1) position for different melting-temperature ranges Δ T m , at Δ T w = 750   K , and Ra = 10 6 . Dashed lines: C = 1 × 10 8   k g   s 1   m 3 ; dotted lines: C = 1 × 10 4   k g   s 1   m 3 . The results are given for Fo = 9, in which steady-state solutions are achieved.
Energies 12 04360 g010
Figure 11. The influence of the permeability coefficient on predicted liquidus-line ( f L = 1) position for different values of thermal diffusivity α , at Δ T m = 50   K , Δ T w = 750   K and Ra = 10 6 . Dashed lines: C = 1 × 10 8   k g   s 1   m 3 ; dotted lines: C = 1 × 10 4   k g   s 1   m 3 . The results are given for Fo = 9, in which steady-state solutions are achieved.
Energies 12 04360 g011
Figure 12. Time evolution of melting front positions ( f L = 1) for isothermal phase-change (blue lines, θ = 0) and non-isothermal phase-change (red lines: (a) Δ T m = 50   K , Δ T w = 750   K , θ = 1/15; and (b) Δ T m = 25   K , Δ T w = 750   K , θ = 1/30) problems. Dashed lines: C = 1 × 10 4   k g   s 1   m 3 ; dotted lines: C = 1 × 10 8   k g   s 1   m 3 (Ra = 10 6 ).
Energies 12 04360 g012
Figure 13. Melting front positions ( f L = 1) for the problem described in Section 2 ( Δ T w = 750   K and Ra = 10 6 ) at the steady-state condition (Fo = 9) and values of Pe * along the melting fronts for: (a) Δ T m = 1   K ; (b) Δ T m = 10   K ; and (c) Δ T m = 55   K predicted using different permeability coefficients of C = 10 4   k g   s 1   m 3 (coloured lines), and C = 10 8   k g   s 1   m 3 (black lines). Values of Pe * along the melting front are O ( 0.1 ) , O ( 1 ) and O ( 10 ) for Δ T m = 1   K , 10   K and 55   K , respectively. The results are more sensitive to the permeability coefficient for large Pe * . For the case with Δ T m = 1   K (a), predictions with different permeability coefficient are identical and therefore the coloured line covers the black line.
Energies 12 04360 g013
Figure 14. Laser spot melting of Fe-S binary alloys with 20 ppm sulphur content. Melting front positions ( f L = 1) at t = 5 s and values of Pe * along the melting fronts, predicted using different permeability coefficients of C = 10 6   k g   s 1   m 3 (coloured lines), and 10 10   k g   s 1   m 3 (black lines): (a) Δ T m = 200   K ; and (b) Δ T m = 40   K . Orange symbols show the experimental observation of the melting front position reported in [60].
Energies 12 04360 g014
Table 1. Thermophysical properties of the artificial materials used in the simulations.
PropertyValueUnit
Density ρ 10 3 k g   m 3
Specific heat capacity c p 10 3 J   k g 1   K 1
Thermal conductivity k1, 10 and 100 W   m 1 K
Dynamic viscosity μ 10 3 k g   m 1   s 1
Latent heat of fusion L m 10 5 J   k g 1
Thermal expansion coefficient β 10 6 K 1
Melting temperature T m = T l + T s 2 1.5 × 10 3 K
Melting-temperature range Δ T m 0, 5, 10, 25 and 50 K