Article

Thermal Performance Analysis of a Direct-Heated Recompression Supercritical Carbon Dioxide Brayton Cycle Using Solar Concentrators

1
School of Energy and Power Engineering, Nanjing Institute of Technology, Nanjing 211167, Jiangsu, China
2
Department of Applied Physics, School of Science, Aalto University, P.O. Box 15100, FI-00076 Aalto, Espoo, Finland
3
Jiangsu Key Laboratory of Solar Energy Technology, Southeast University, Nanjing 211167, Jiangsu, China
*
Author to whom correspondence should be addressed.
Energies 2019, 12(22), 4358; https://doi.org/10.3390/en12224358
Submission received: 22 October 2019 / Revised: 12 November 2019 / Accepted: 13 November 2019 / Published: 15 November 2019

Abstract

:
In this study, a direct recompression supercritical CO2 Brayton cycle, using parabolic trough solar concentrators (PTC), is developed and analyzed employing a new simulation model. The effects of variations in operating conditions and parameters on the performance of the s-CO2 Brayton cycle are investigated, also under varying weather conditions. The results indicate that the efficiency of the s-CO2 Brayton cycle is mainly affected by the compressor outlet pressure, turbine inlet temperature and cooling temperature: Increasing the turbine inlet pressure reduces the efficiency of the cycle and also requires changing the split fraction, where increasing the turbine inlet temperature increases the efficiency, but has a very small effect on the split fraction. At the critical cooling temperature point (31.25 °C), the cycle efficiency reaches a maximum value of 0.4, but drops after this point. In optimal conditions, a cycle efficiency well above 0.4 is possible. The maximum system efficiency with the PTCs remains slightly below this value as the performance of the whole system is also affected by the solar tracking method used, the season and the incidence angle of the solar beam radiation which directly affects the efficiency of the concentrator. The choice of the tracking mode causes major temporal variations in the output of the cycle, which emphasis the role of an integrated TES with the s-CO2 Brayton cycle to provide dispatchable power.

1. Introduction

The growing energy demand and the need for reducing global greenhouse gas emissions from fossil fuels have led to vigorous development of renewable energy [1,2,3]. Recent studies indicate that renewable energy, including concentrating solar power (CSP) technologies, could play a significant role in the forthcoming development [4,5,6]. CSP technologies use solar concentrators to produce high-temperature heat to drive a turbine power cycle that generates electrical power [7,8]. Parabolic trough concentrator (PTC) technology can be considered as the most advanced and commercially proven technology for CSP plants [9,10,11]. Moreover, the PTC plants equipped with thermal storage could also match the power demand during night-time [12].
However, the parabolic trough CSP has a lower solar-to-electric efficiency than the other CSP technologies, such as the solar tower and dish-Stirling [7], mainly because of a lower concentration ratio, but also due to the maximum operating temperature of synthetic oils used as the heat transfer fluid (HTF) in the PTC (synthetic oils experience thermal degradation above 395 °C) [13,14]. Salts as a heat transfer fluid would allow temperatures up to 450–500 °C [9,15,16], but are more challenging due to higher solidification temperature [16]. Direct steam generation (DSG) is a promising alternative, with higher cycle temperatures up to 500 °C [17,18], but also encompasses challenges with the two-phase flow [19]. Nanofluids have also been proposed for HTF [20,21,22,23]. Some studies [24,25] report on models on an integrated supercritical regenerative organic Rankine cycle and parabolic trough solar collectors, showing that the net power output of the integrated ORC and PTC system is higher than that of a stand-alone ORC system. Some studies have proposed an innovative solar thermal power system based on the Rankine cycle, which employs screw expanders and direct steam generations with water as heat transfer and working fluid [26,27]. Compared to a traditional steam turbine, the screw expander-based DSGs have many advantages, such as a lower operating temperature and pressure, avoiding overheating [26].
Due to the present limitations with temperature and heat transfer fluids, developing alternative routes for increasing the efficiency and reducing the costs of parabolic trough CSP is highly motivated. A promising alternative strategy is to select more efficient HTFs and power cycles, which is also the subject of this paper. For example, carbon dioxide (CO2) could be a good candidate for the working fluid, because it is chemically stable, reliable, low-cost, non-toxic, non-flammable and readily available [28]. CO2 can be used in advanced cycles, such the supercritical CO2 (s-CO2) Brayton cycle, which has recently gained a lot of attention for next generation nuclear reactors and CSP [29]. It has several advantages, such as a single phase throughout the process beyond the critical point, and no requirement for additional energy vaporization or condensing [30]. Above the supercritical point, CO2 has high enthalpy and physical densities higher than steam which minimizes the volume of the working fluid and the system size, thus reducing the capital costs [31]. The s-CO2 cycle in the range of 550–650 °C outperforms both the supercritical steam and the superheated steam Rankine cycles [32]. The performance of the s-CO2 Brayton cycle has been shown to benefit from direct compression without heat rejection, and from high and low temperature recuperators [33]. Actually, the most efficient layout of the s-CO2 cycle employs a recompressing layout [32,33,34,35], also utilized in this paper. For this cycle, the minimum operating temperature is more important to the cycle efficiency than the maximum one, which is an important feature in solar thermal applications [36].
The s-CO2 cycle could be integrated into CSP systems in different ways, e.g., using parabolic troughs and synthetic oils as HTF, which could yield an energy efficiency of 33% [37], or molten salts with a solar power tower (SPT), having an optimum/maximum hot salt temperature at 565 °C [38]. Different cycle architectures can be used, e.g., the recompression Brayton cycle [39], direct-heated simple s-CO2 Brayton cycle [40] and the fully supercritical operation, in particular during low insolation [40]. Though the s-CO2 Brayton has received attention for CSP applications, the literature with parabolic trough concentrators is limited. The direct-heated PTC refers to heat collection in the solar field through the cycle work fluid, which eliminates the need of an intermediate HTF, such as oil or molten salt. This design may reduce the investment costs and increase the power production due to improved heat transfer. Therefore, we undertake here a comprehensive performance analysis of a CSP with a recompression s-CO2 Brayton cycle and a PTC field to better understand the sensitivity of the performance against key operational parameters. We include all central components in the modeling, providing a fully integrated model, enabling also assessment on how the solar parameters, such as tracking modes and incidence angles, affect performance in addition to the thermophysical parameters. The novel design of this integrated CSP plant employs carbon dioxide both as a heat transfer fluid in the concentrators and as a working fluid in the Brayton cycle to reduce energy losses from intermediate heat exchangers.

2. System Configuration

A schematic of the proposed direct-heated recompression supercritical carbon dioxide Brayton cycle with parabolic trough solar collectors (PTC-sCO2 Brayton cycle) is shown in Figure 1. The system is composed of a solar field, thermal energy storage, and a s-CO2 Brayton cycle. The solar field includes one or more loops of PTC collector assemblies with parameters given in Appendix A.
For the receiver, we selected a SCHOTT PTR® 70 tube (technical parameters are in Appendix A). The heat transfer fluid CO2 circulates in the receiver of the PTC, absorbs solar radiation (from state 1 to 2 in Figure 1), and flows into the s-CO2 Brayton cycle. The main drawback of solar energy is the mismatch between the availability and the demand, for which reason thermal energy storage, e.g., molten salt, is needed to enable the s-CO2 plant to provide dispatchable power [41,42]. The storage is coupled to the s-CO2 Brayton power cycle through a CO2-salt heat exchanger (states 3,4,5,6). The T-s and h-s diagrams of the recompression CO2 Brayton cycle are shown in Figure 2, the technical parameters are in Appendix A. This cycle layout enhances the efficiency by reducing the heat rejection from the cycle through the introduction of another compressor (recompressing compressor, RC) before the pre-cooler (PRC). The CO2 fluid is split into two parts before entering the pre-cooler, one part entering the pre-cooler for cooling (state 12 to 17), and the other part the recompressing compressor (state 14 to 18). The y in the Figure 1 is defined as the split ratio, which can be varied to optimize the operation of the system. The outlet of the recompressing compressor (RC) is connected between high (HTR) and low (LTR) temperature recuperators. The fluid exiting the pre-cooler is compressed to high pressure by the main compressor (MC, states 15–16) and it is preheated by the low temperature recuperator (LTR, state 16–17). Then the two parts merge back into one. The entire CO2-flow is preheated in the high temperature recuperator HTR and fed into the PTC inlet (states 8–9). The fluid is heated up in the PTCs and leaves the PTCs at the highest cycle temperature. Then it enters the turbine, where fluid expansion (states 9–5) generates rotational energy, which is converted into electricity in the generator. The turbine exhaust is cooled in the high temperature recuperator (HTR) and low temperature recuperator (LTR), in which the available heat is transferred in the heat exchanger to the high pressure side. The basic operating mode is to charge the thermal storage when the CO2 flow rate exceeds the design flow rate for power generation. Surplus flow moves through the heat exchanger to the charge molten salt (from CT to HT). During the discharging mode, molten salt leaves the hot tank and releases heat to the CO2 flow, and then enters the cold tank (from HT to CT).

3. System Model

A complete mathematical model for the direct recompression supercritical CO2 Brayton cycle using parabolic trough solar collectors was developed in this study.
The overall efficiency of the PTC-sCO2 Brayton cycle can be determined as:
η o = W ˙ n e t Q ˙ a b s = η t h , P T C · η t h , B r a y t o n
where η t h , P T C is thermal efficiency of PTC solar field; η t h , B r a y t o n is efficiency of the recompression supercritical CO2 Brayton cycle. The model equations are described in detail in the Supplementary Information. Appendix A lists all input parameters used in the simulations. The model was briefly validated with good agreement to a previous study. The nominal mechanical power of the CSP-plant considered here is 100 MW.

4. Results and Discussion

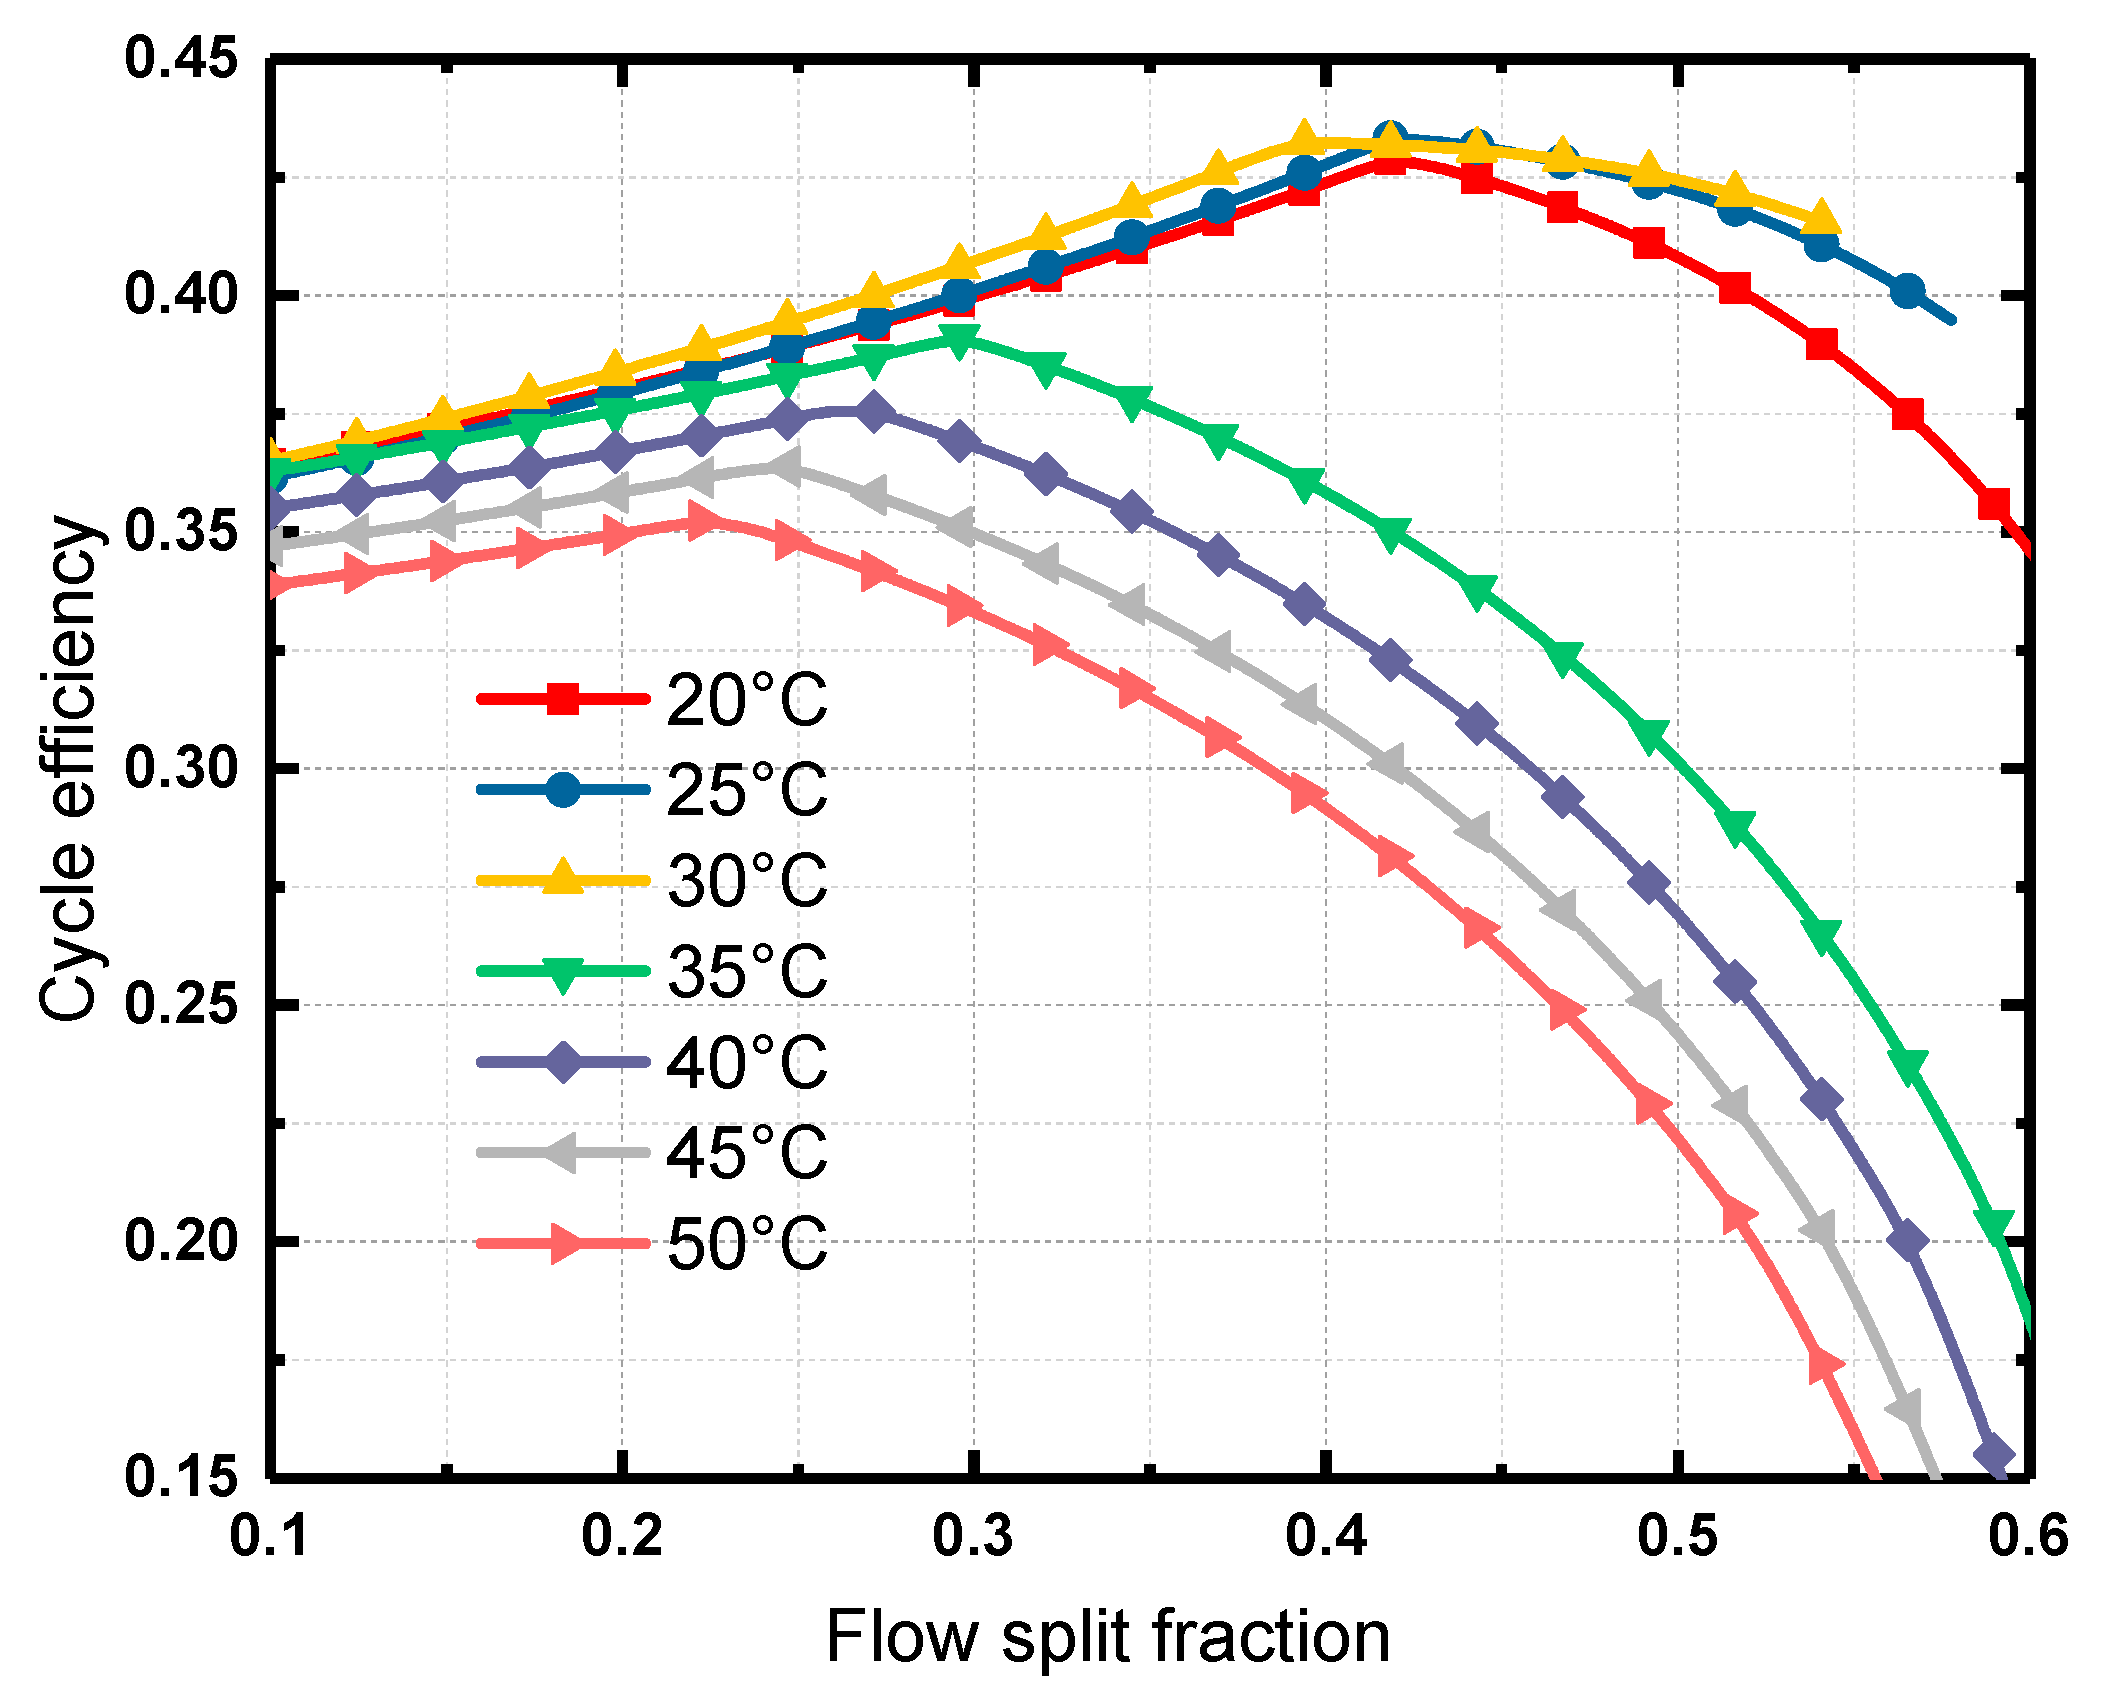
4.1. Thermodynamic Analysis of the Recompression Brayton-Cycle

The performance of the proposed direct recompression supercritical CO2 Brayton cycle with parabolic trough concentrators is influenced by a range of system variables, such as the PTC outlet temperature, cooling temperature and compressor outlet pressure, which will be analyzed in the next section.
Figure 3 shows the cycle efficiency as a function of the flow split fraction at different compressor outlet pressure values. The compressor inlet pressure and inlet temperature, and turbine inlet temperature were set to 7.4 MPa, 31.25 °C and 487 °C, respectively. Raising the maximum cycle pressure above 20 MPa would not provide benefit, as this would also require increasing the thickness of the pipes, pressure-bearing casings and heat exchangers, resulting in higher capital costs. Table 1 summarizes the optimal values of the split fraction at different compressor outlet pressures based on the maximum cycle efficiency obtained. The efficiency decreases with increasing pressure. For example, increasing the pressure from 20 MPa to 22 MPa reduces the efficiency from 0.4059 to 0.4033. Table 1 also shows that as the compressor outlet pressure changes, the split fraction need also to be changed to achieve maximum efficiency.
Figure 4 shows the efficiency versus the split fraction with turbine inlet temperature as the parameter. The figure clearly indicates that increasing the temperature improves the efficiency as expected, but the beneficial effect of increasing the main compressor outlet pressure in this case would saturate, e.g., the efficiency gain would be <1% when increasing the pressure from 20 MPa to 32 MPa. Table 2 gives the optimal value of the split fraction for maximum efficiency at a different turbine inlet temperature. Comparing Table 1 and Table 2, the recompression fraction is much more affected by the turbine outlet pressure than by the turbine inlet temperature.
Figure 5 shows the cycle efficiency and the required pre-cooler power versus compressor inlet temperature (compressor inlet pressure is 7.4 MPa, the temperature 31.25 °C and the turbine inlet temperature is 487 °C). Increasing the cooling temperature below the critical point 31.25 °C also increases the cycle. At T = 31.25 °C the cycle efficiency reaches the maximum value of 0.3997. Beyond the critical point, the cycle efficiency drops to 0.3902 at 36 °C. The pre-cooler power drops abruptly around the critical point, but slowly after it.
The properties of the CO2 need also carefully be considered to operate the system in the optimal range. Figure 6 shows the heat capacity and density of CO2 versus temperature and pressure obtained by the REFPROP program [43]. The pseudocritical temperature increases with pressure and the density increases with pressure for a fixed temperature. The density jumps sharply at 304 K at 7.39 MPa. Above the critical pressure, CO2 density quickly decreases with increasing temperature. Based on this observation, if choosing the pressure at a fixed temperature in such a way that compression occurs close to the pseudocritical conditions, the corresponding high CO2 density would lead to a lower compression work, thus providing a higher cycle efficiency.
Figure 7 shows the cycle efficiency versus the split fraction during the transition from a supercritical to a liquid phase with supercritical pressure conditions at a compressor inlet temperature 20–50 °C. The peak cycle efficiency is achieved at 30 °C. In cases when liquid CO2 enters the main compressor at a temperature slightly lower than the critical temperature, this gives yields close to the peak efficiency. The cycle efficiency clearly benefits if CO2 is cooled below the critical temperature while maintaining a supercritical pressure. From Table 3 we see that the optimized flow split fraction does not much change below the critical temperature, but above the point the change increases. For example, moving from 20 to 30 °C changes the flow split fraction from 0.4184 to 0.4061, and a temperature rise to 50 °C drops the flow split fraction from 0.4061 to 0.2224. The reason for this is the high CO2 density in the liquid phase at the compressor inlet. If the compressor operates far away from the critical point, the optimized flow split fraction and cycle efficiency will not change much and the fluid properties are not much affected. This indicates that if the compressor inlet temperature deviates from the design value, it will result in a significant reduction in cycle efficiency since the cycle will be operating outside its optimized flow split fraction value.

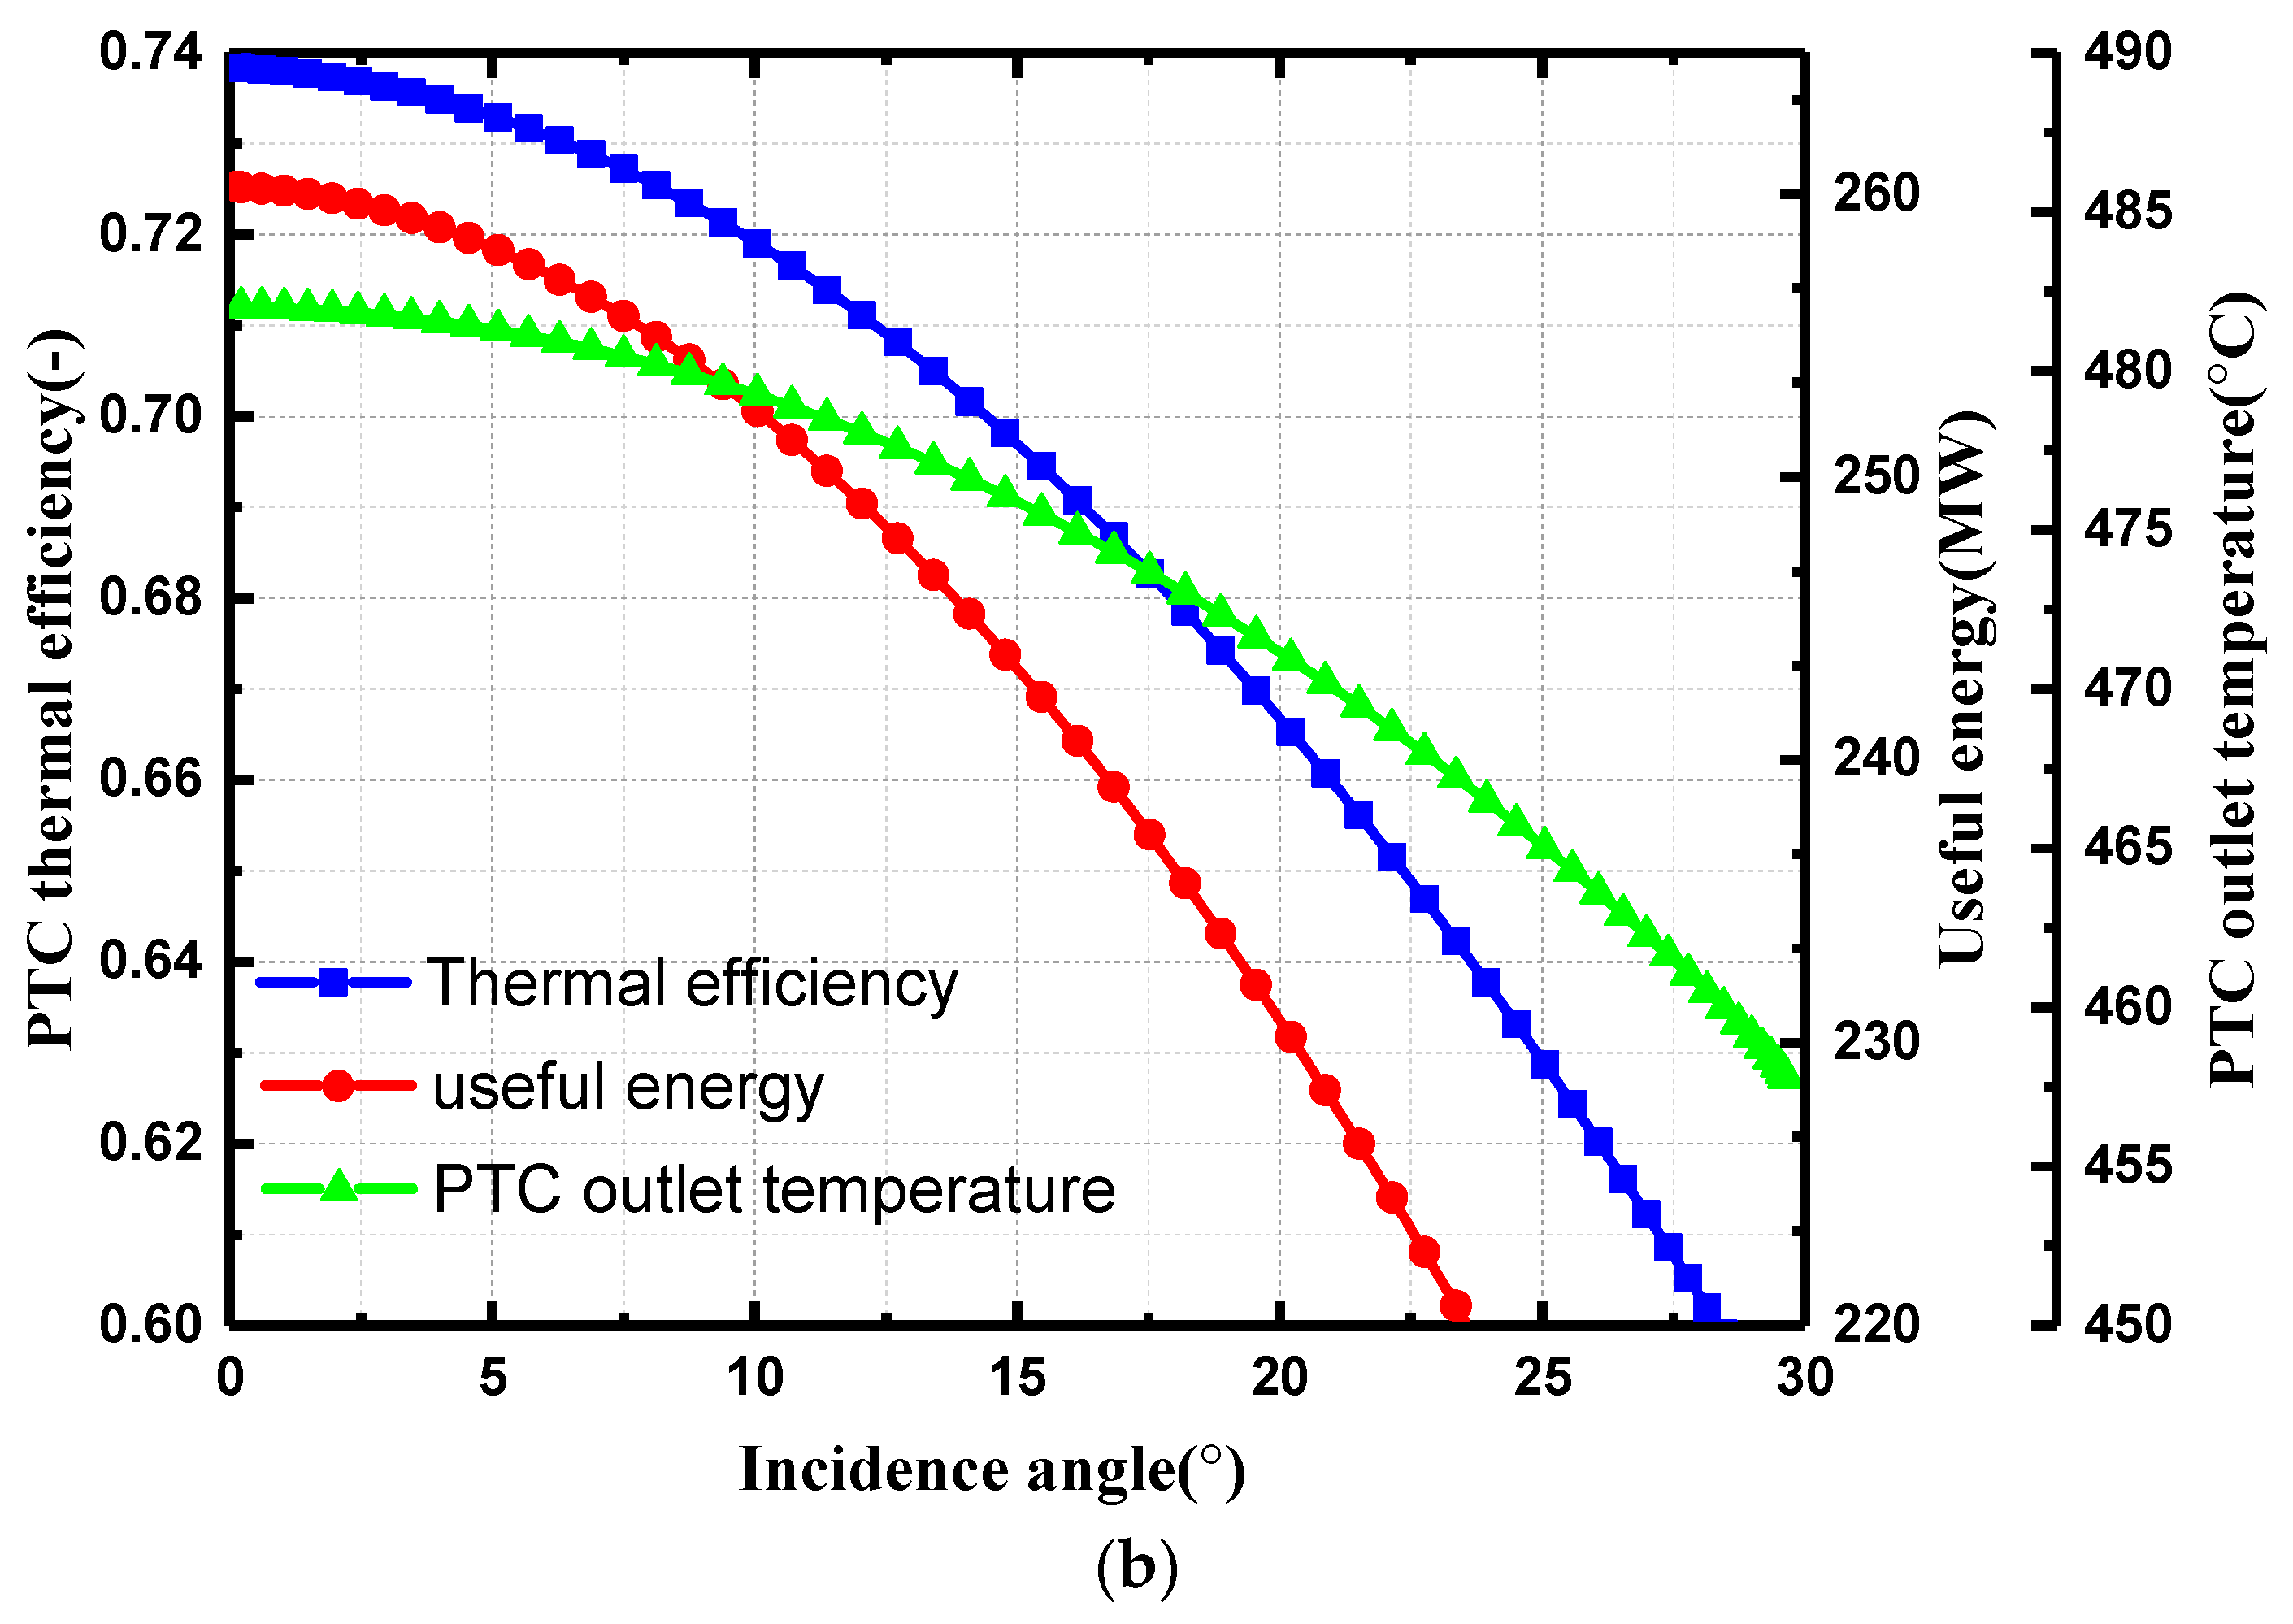
4.2. Operation Analysis of Parabolic Trough Solar Collector

The performance of the PTCs has also a major effect to the overall performance of the CSP. We analyzed the performance of the whole solar field against a range of key parameters, but in particular against the incidence angle of incoming solar radiation. The inlet temperature was set to 483 °C and we used clear-sky conditions typical for Delingha, P.R. of China in the analysis.
Figure 8 shows the optical and thermal performance of the PTC field versus the incidence angle, clearly demonstrating decreasing performance at higher angles, as expected. At 0° angle, i.e., when the collector normal points to the sun, the PTC field has a thermal efficiency of 0.7383, providing 260 MW of thermal power at a 482 °C outlet temperature. Whereas at a 20° angle, the thermal power drops to 230 MW, and the outlet temperature to 470 °C. The site selection, tracking method and structural design of the PTCs need therefore careful consideration to reduce the incidence angle. The wind conditions also affect the performance through convective heat losses, but marginally due to a high concentration ratio (C = 81). For example at 0 m/s the thermal efficiency is 0.7427 and drops to 0.7407 at 20 m/s.

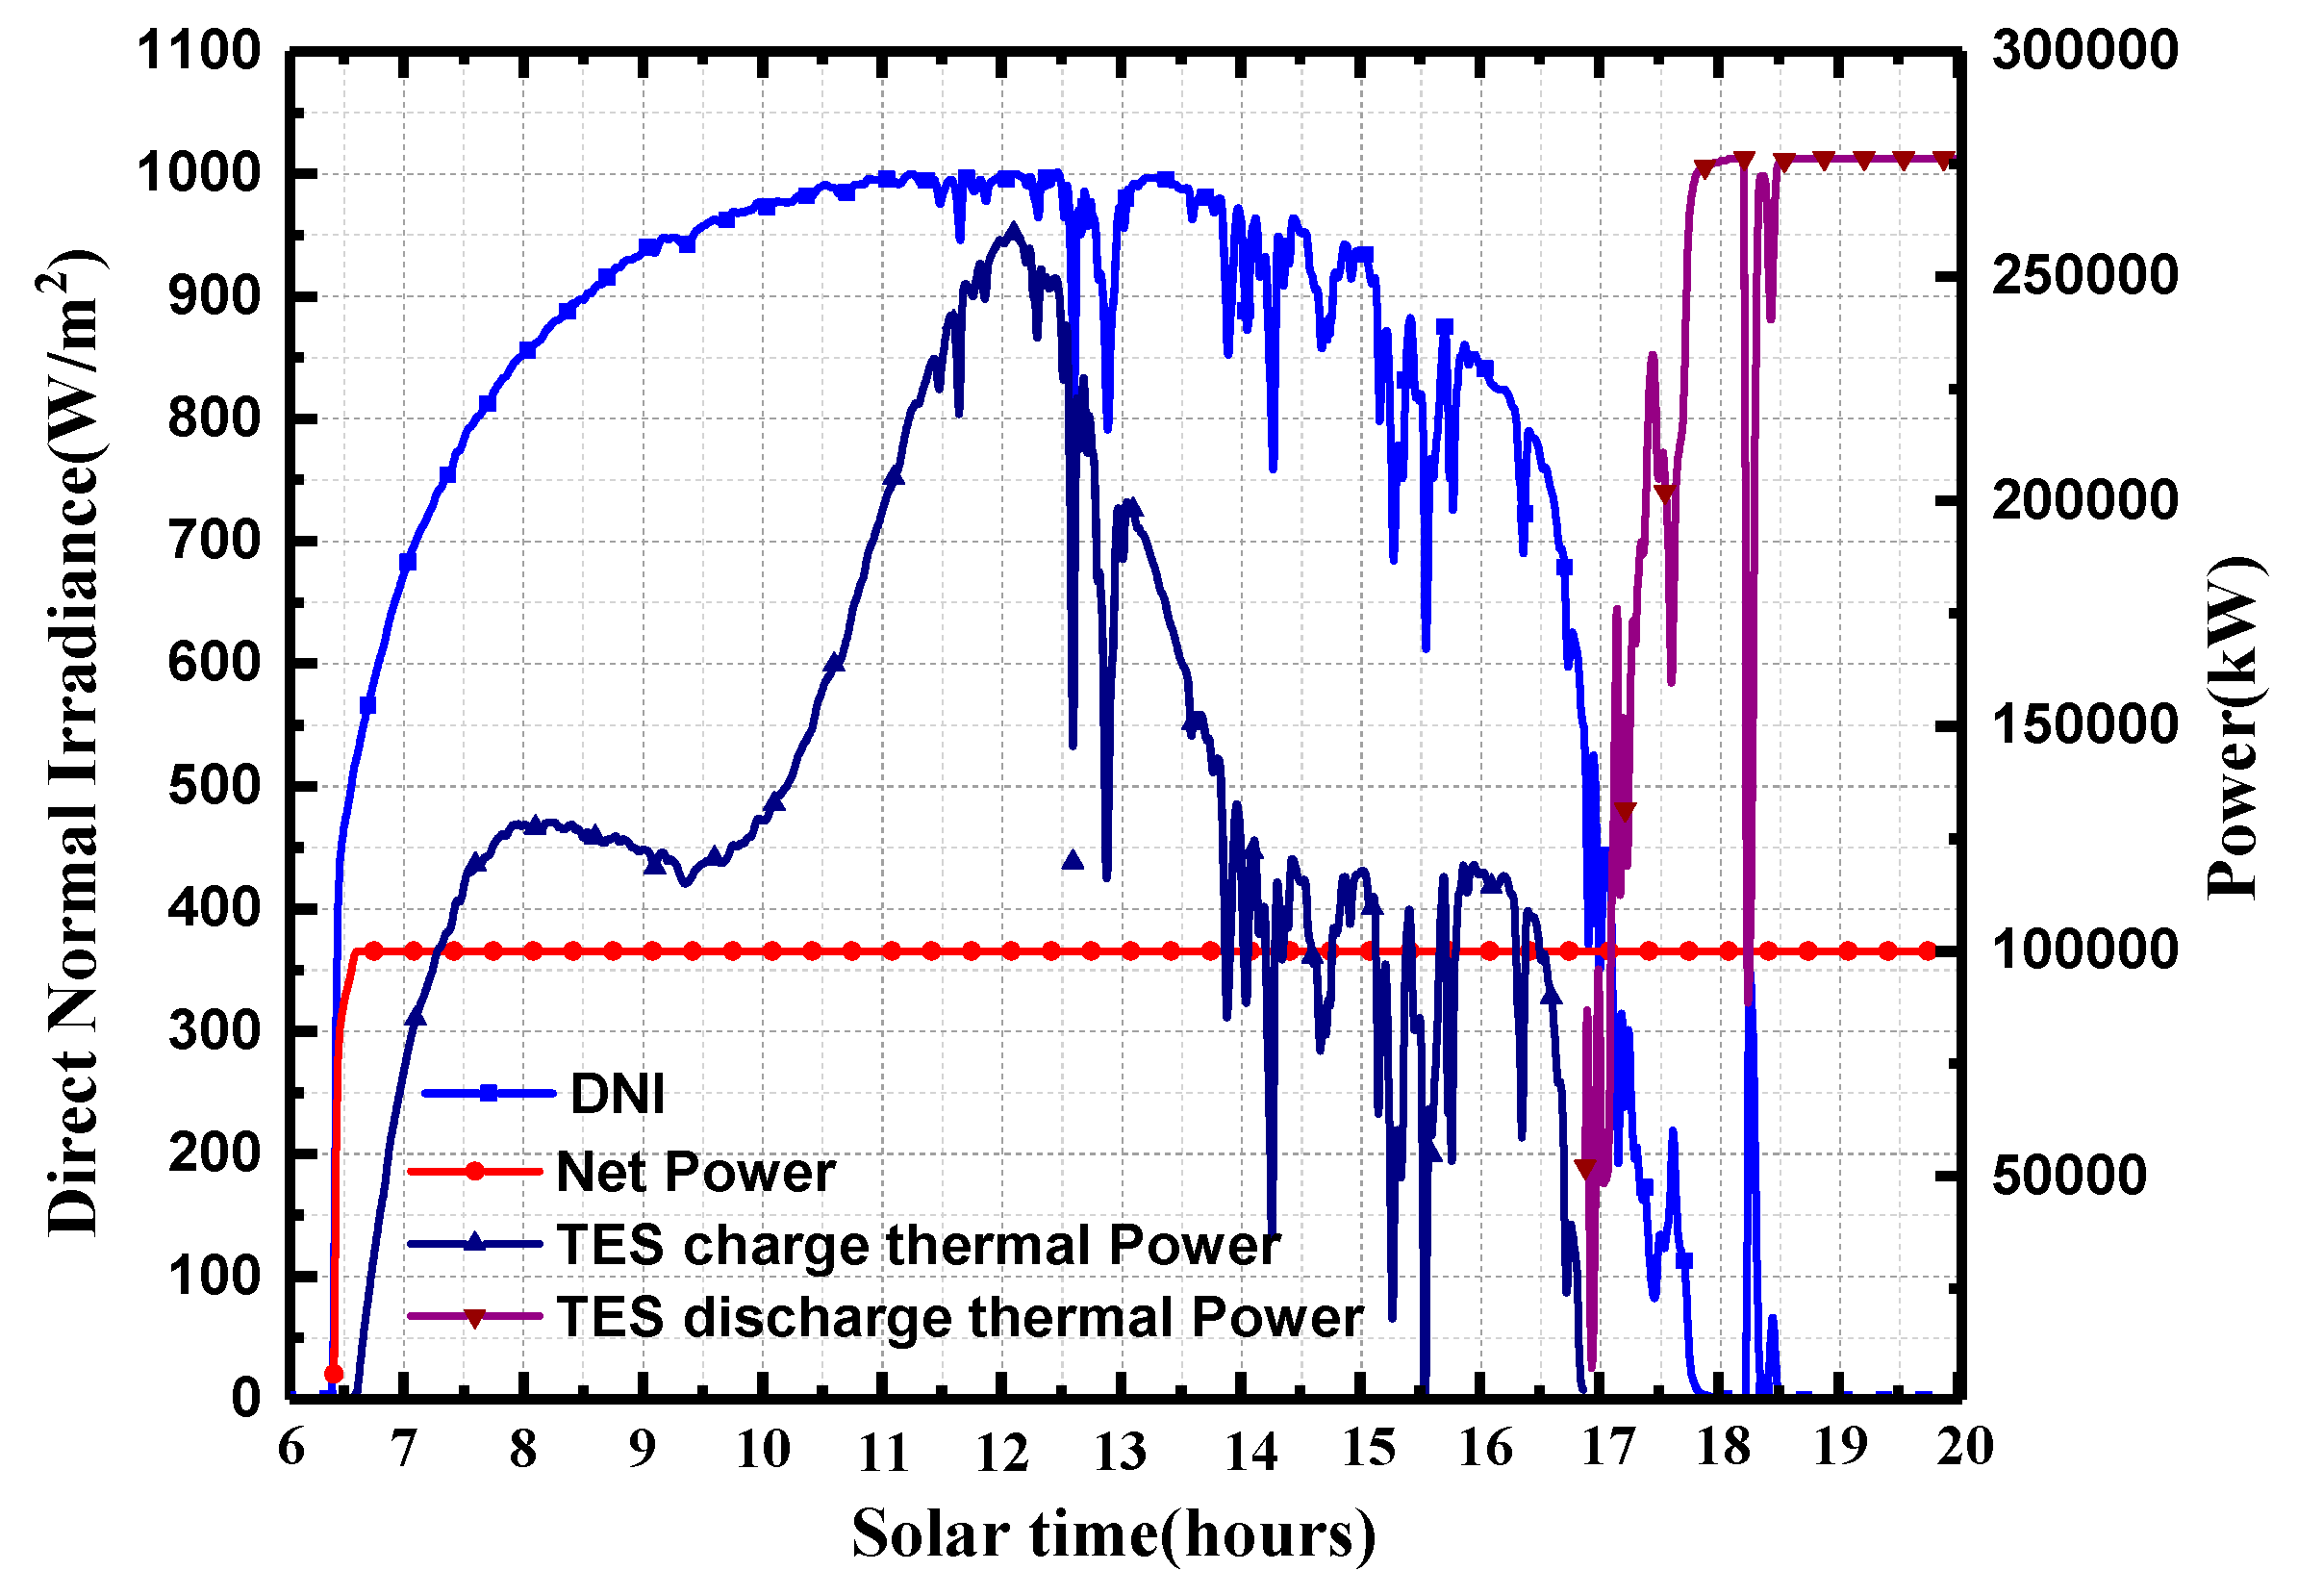
4.3. Combined Performance Analysis of PTC s-CO2 Brayton Cycle

Finally, we make a full simulation of the CSP and evaluate the thermal performance of the cycle. The selected site is in Qinhai province at latitude 37.22° N and longitude 97.23° E, which is a region for CSP development in China. At present, there are two operational CSPs which a 50 MW PTC plant [44] and a 50 MW solar tower plant [45]. The direct normal irradiance data (DNI) has a 1 min resolution. The analysis of the PTC-sCO2 Brayton cycle was performed for three days of the year with different seasonal patterns: 22 March, 21 June and 2 December. These particular days represent the monthly average day of solar radiation in March, June and December [39]. The parameter values shown in Appendix A are used for the calculation for both the s-CO2 Brayton cycle and PTC collector.
The net power output, useful energy, system efficiency and CO2 flow with two tracking modes (E-W and N-S) are depicted in Figure 9. The turbine inlet temperature is fixed to 483 °C, and the N-S and E-W tracking modes yield quite different temporal output patterns: In the N-S mode on March 22 (Figure 9a,b), the output increases from morning to noon, reaching a maximum efficiency at noon (system efficiency 0.318 and CO2 flow 2027 kg/s); in the E-W mode a minimum efficiency is reached at noon and a maximum efficiency at 9 am and 4 pm. The average daily system efficiency of the E-W mode is 0.2637 and for the N-S mode, it is 0.2787.
The goodness of the tracking modes change with season, so that on June 22, which has the longest daytime of the year (in the Northern Hemisphere), the average efficiency of the E-W mode is now 0.2875, and 0.2152 in the N-S mode (Figure 9c,d). The E-W mode has very poor operating performance at noon with a system efficiency of 0.0097 and CO2 flow of 59 kg/s, whereas in the N-S mode, the system efficiency is 0.3240 and the CO2 flow rate 1981 kg/s at noon delivering 136 MW.
Contrary to the previous days, the performance on December 2 shown in Figure 9e,f delivers smoother operation, though a lower output power level. The maximum system efficiency of the N-S mode is 0.3232 and then it is 0.2379 for the E-W mode, but now in the morning and in the afternoon. The daily average efficiency of the E-W mode is 0.2793 and 0.3061 for the N-S mode.
The above CSP system analyzed was not linked in this particular case to a thermal storage which could smooth out some of the variations and also provide power during the off-solar hours. The analysis demonstrated the dynamics of the CSP over the season, which may be important in matching the CSP power output with the local power demand and system.
In Figure 10, we have analyzed a case with thermal storage on a partly cloudy day. The direct normal irradiance (DNI) was measured with a pyrheliometer with a daily uncertainty of 1% and the sun tracker had a pointing accuracy of 0.1°. During clear-sky conditions, the PTCs provide adequate heat to operate the s-CO2 Brayton cycle at full capacity and excess heat is charged into the TES system. When the DNI is below the threshold, the TES starts to discharge heat to the cycle, thus enabling power production during the overcast and off-solar hours.

5. Conclusions

In this study, we analyzed an integrated CSP system in which a direct heated s-CO2 recompression Brayton cycle was coupled to a parabolic trough solar collector (PTC) and thermal storage. An integrated model combining the solar and cycle part was developed. The model was used to analyze the effects of the variations in design parameters and operating conditions on the performance of system. Important variables of interest included the compressor inlet temperature, compressor outlet pressure, turbine inlet temperature and cooling temperature. In case of the PTC solar field, the effects of the incoming solar incidence angle and wind velocity were of particular interest. The operating characteristics of the whole system were also analyzed for three typical days.
We found that when increasing the turbine inlet pressure the efficiency of the cycle is reduced. For example a change from 20 MPa to 22 MPa reduced the maximum efficiency from 0.4059 to 0.4033, but the split fraction needed also to be changed to reach the maximum. Whereas, increasing the turbine inlet temperature increased the efficiency, e.g., moving from 350 °C to 600 °C increased the efficiency from 0.2987 to 0.4693 with very small effect on the split fraction. At the critical cooling temperature point of 31.25 °C, the cycle efficiency reached a maximum value of 0.3997, but after which point it drops, e.g., at 36 °C the cycle efficiency was 0.390.
The optical efficiency of the PTC reduces with increasing incidence angle: At 0° the optical efficiency was 0.85 and dropped at 30° to 0.694, which reduced the PTC thermal output by 30%. The effect of wind speed on the thermal efficiency of the PTC was minor.
Key system performance values, such as the power output, CO2 flow, etc. are affected by the tracking method chosen and the time point of observation. In the N-S mode, the best performance is at noontime, while for the E-W mode the maximum is in the morning and afternoon, and the minimum is found at noon. For example, during the highest solar radiation conditions in the summer (21 June), in the N-S mode the system efficiency at noon is 0.3240 (CO2 flow rate 1981 kg/s), whereas the E-W mode yields a system efficiency of 0.0097 (CO2 flow 59 kg/s) only. The kind of temporal variation emphasizes the role of an integrated TES with the s-CO2 Brayton cycle to provide dispatchable power.
Some studies [46,47] have shown that the system efficiency of a PTC plant using a Rankine cycle is 0.15–0.21, which is lower than that of the s-CO2 Brayton cycle. There are still several challenges to be solved in the engineering solutions of PTC-sCO2, such as the sealing problems of the system under high pressure, and the stable and safe operation of the supercritical carbon dioxide turbine.
Our computational results thus indicate that the s-CO2 Brayton cycle is a promising option for PTCs. The results will help with system optimization of future CSP.

Supplementary Materials

The following are available online at https://www.mdpi.com/1996-1073/12/22/4358/s1.

Author Contributions

J.W. (Jinping Wang) performed all the modeling and prepared the manuscript. J.W. (Jun Wang) collected the field data and discussed the results. P.D.L. revised the manuscript and provide methodology. H.Z. assisted in the computation process. The whole work was supervised by J.W. (Jinping Wang) and P.D.L.

Funding

The study is supported by the National Natural Science Foundation of China (Project No. 51736006, 51706093), the Scientific Research Foundation of Nanjing Institute of Technology (Grant No. ZKJ201703, ZKJ201605, CKJC201502), and the Academy of Finland (Project No. 324093).

Acknowledgments

The authors gratefully acknowledge the support from the Science and Technology Innovation Team of Jiangsu Higher Education Institutions, The key subject of Jiangsu Province.

Conflicts of Interest

The authors declare no conflict of interest.

Nomenclature

Acronyms
CSPconcentrating solar thermal power
HTFheat transfer fluid
PTCparabolic trough solar collector
DSGdirect steam generation
CO2carbon dioxide
s-CO2supercritical carbon-dioxide
ORCorganic Rankine cycle
HThot tank
CTcool tank
PRCpre-cooler
LTRlow temperature recuperator
HTRhigh temperature recuperator
MCmain compressor
RCrecompressing compressor
Tturbine
Ggenerator
FSflow split
FMflow merge
PRpressure ratio
SCAsolar collector assembly
Symbols
Aarea (m2), solar azimuth (°)
cpspecific heat (kJ/kg-K)
L length of collector assembly (m)
ysplit ratio factor
Greek letters
waperture width (m)
ρdensity (kg/m3); reflectance
f focal length (m)
η Efficiency (-)
Subscripts
geogeometry defects
trtracking error
mmirror
dymirror soiling
gengeneral error
rreflective

Appendix A. Technical Parameters

Table A1. Main parameters of the solar concentrator [48].
Geometry defects, η g e o 0.98
Tracking error, η t r 0.99
Mirror reflectance, ρ m 0.935
Mirror soiling, η d y 0.97
General error, η g e n 0.97
Length of collector assembly, L 100 m
Aperture width, w 5.75 m
Focal length, f 2.11 m
Reflective aperture, Ar545 m2
Concentrating ratio (-)82
Number of array assemblies778
Table A2. Main parameters of the solar receiver (2008 PTR 70) [49].
Absorber tube inner diameter0.076 m
Absorber tube outer diameter0.08 m
Glass envelope inner diameter0.115 m
Glass envelope outer diameter0.12 m
Internal surface roughness0.000045
Absorber absorptivity0.995
Absorber thermal emittance0.095 at 400 °C
Glass transmittance0.965
Vacuum≤10−3 mbar
Table A3. Thermal properties of storage salt [50].
Specific heat, c p ( J / kg · ° C ) c p ( T ) = 1443 + 0.172 · T ( ° C )
Thermal conductivity, k ( W / m · K ) k ( T ) = 0.443 + 0.00019 · T ( ° C )
Density, ρ (kg/m3) ρ ( T ) = 2090 0.636 · T ( ° C )
Operational temperature range239 °C–600 °C
Table A4. Basic design and operating parameters used for the s-CO2 Brayton cycles [51,52].
Compressor inlet Temperature31.25 °C
Compressor outlet pressure 20 MPa
Compressor inlet pressure7.4 MPa
Pressure ratio, PR2.7 [-]
Compressor isentropic efficiency0.89 [-]
Re-compressor isentropic efficiency0.89 [-]
Turbine isentropic efficiency0.995 [-]
Net mechanical power output100 MW

References

  1. Al-Nimr, M.A.; Qananba, K.S. A solar hybrid system for power generation and water distillation. Sol. Energy 2018, 171, 92–105. [Google Scholar] [CrossRef]
  2. Lam, M.K.; Tan, K.T.; Lee, K.T.; Mohamed, A.R. Malaysian palm oil: Surviving the food versus fuel dispute for a sustainable future. Renew. Sustain. Energy Rev. 2009, 13, 1456–1464. [Google Scholar] [CrossRef]
  3. Lund, P.D.; Mikkola, J.; Ypyä, J. Smart energy system design for large clean power schemes in urban areas. J. Clean. Prod. 2015, 103, 437–445. [Google Scholar] [CrossRef]
  4. Jamel, M.; Abd Rahman, A.; Shamsuddin, A. Advances in the integration of solar thermal energy with conventional and non-conventional power plants. Renew. Sustain. Energy Rev. 2013, 20, 71–81. [Google Scholar] [CrossRef]
  5. Law, E.W.; Kay, M.; Taylor, R.A. Calculating the financial value of a concentrated solar thermal plant operated using direct normal irradiance forecasts. Sol. Energy 2016, 125, 267–281. [Google Scholar] [CrossRef]
  6. Solangi, K.H.; Islam, M.R.; Saidur, R.; Rahim, N.A.; Fayaz, H. A review on global solar energy policy. Renew. Sustain. Energy Rev. 2011, 15, 2149–2163. [Google Scholar] [CrossRef]
  7. Khan, J.; Arsalan, M.H. Solar power technologies for sustainable electricity generation—A review. Renew. Sustain. Energy Rev. 2016, 55, 414–425. [Google Scholar] [CrossRef]
  8. Fernández, A.G.; Gomez-Vidal, J.; Oró, E.; Kruizenga, A.; Solé, A.; Cabeza, L.F. Mainstreaming commercial CSP systems: A technology review. Renew. Energy 2019, 140, 152–176. [Google Scholar] [CrossRef]
  9. Giostri, A.; Binotti, M.; Astolfi, M.; Silva, P.; Macchi, E.; Manzolini, G. Comparison of different solar plants based on parabolic trough technology. Sol. Energy 2012, 86, 1208–1221. [Google Scholar] [CrossRef]
  10. Wang, Y.; Liu, Q.; Lei, J.; Jin, H. Performance analysis of a parabolic trough solar collector with non-uniform solar flux conditions. Int. J. Heat Mass Transf. 2015, 82, 236–249. [Google Scholar] [CrossRef]
  11. Wang, J.; Wang, J.; Bi, X.; Wang, X. Performance simulation comparison for Parabolic trough solar collectors in China. Int. J. Photoenergy 2016, 2016, 1–16. [Google Scholar] [CrossRef]
  12. Llamas, J.M.; Bullejos, D.; de Adana, M.R. Optimization of 100 MWe Parabolic-Trough Solar-Thermal Power Plants Under Regulated and Deregulated Electricity Market Conditions. Energies 2019, 12, 3973. [Google Scholar] [CrossRef]
  13. Price, H.; Lupfert, E.; Kearney, D.; Zarza, E.; Cohen, G.; Gee, R.; Mahoney, R. Advances in Parabolic Trough Solar Power Technology. J. Sol. Energy Eng. 2002, 124, 109–125. [Google Scholar] [CrossRef]
  14. Yang, Z.; Garimella, S.V. Thermal analysis of solar thermal energy storage in a molten-salt thermocline. Sol. Energy 2010, 84, 974–985. [Google Scholar] [CrossRef]
  15. Montes, M.J.; Abánades, A.; Martinez-Val, J.M. Thermofluidynamic model and comparative analysis of parabolic trough collectors using oil, water/steam, or molten salt as heat transfer fluids. J. Sol. Energy Eng. 2010, 132, 021001. [Google Scholar] [CrossRef]
  16. Kearney, D.; Herrmann, U.; Nava, P.; Kelly, B.; Mahoney, R.; Pacheco, J.; Cable, R.; Potrovitza, N.; Blake, D.; Price, H. Assessment of a molten salt heat transfer fluid in a parabolic trough solar field. J. Solar Energy Eng. 2003, 125, 170–176. [Google Scholar] [CrossRef]
  17. Fraidenraich, N.; Oliveira, C.; da Cunha, A.F.; Gordon, J.M.; Vilela, O.C. Analytical modeling of direct steam generation solar power plants. Sol. Energy 2013, 98, 511–522. [Google Scholar] [CrossRef]
  18. Feldhoff, J.F.; Schmitz, K.; Eck, M.; Schnatbaum-Laumann, L.; Laing, D.; Ortiz-Vives, F.; Schulte-Fischedick, J. Comparative system analysis of direct steam generation and synthetic oil parabolic trough power plants with integrated thermal storage. Sol. Energy 2012, 86, 520–530. [Google Scholar] [CrossRef]
  19. Hirsch, T.; Feldhoff, J.F.; Hennecke, K.; Pitz-Paal, R. Advancements in the Field of Direct Steam Generation in Linear Solar Concentrators—A Review. Heat Transf. Eng. 2014, 35, 258–271. [Google Scholar] [CrossRef]
  20. Marefati, M.; Mehrpooya, M.; Shafii, M.B. Optical and thermal analysis of a parabolic trough solar collector for production of thermal energy in different climates in Iran with comparison between the conventional nanofluids. J. Clean. Prod. 2018, 175, 294–313. [Google Scholar] [CrossRef]
  21. Kasaeian, A.; Daviran, S.; Azarian, R.D.; Rashidi, A. Performance evaluation and nanofluid using capability study of a solar parabolic trough collector. Energy Convers. Manag. 2015, 89, 368–375. [Google Scholar] [CrossRef]
  22. Bellos, E.; Tzivanidis, C.; Antonopoulos, K.A.; Gkinis, G. Thermal enhancement of solar parabolic trough collectors by using nanofluids and converging-diverging absorber tube. Renew. Energy 2016, 94, 213–222. [Google Scholar] [CrossRef]
  23. Al-Nimr, M.A.; Al-Dafaie AM, A. Using nanofluids in enhancing the performance of a novel two-layer solar pond. Energy 2014, 68, 318–326. [Google Scholar] [CrossRef]
  24. Cakici, D.M.; Erdogan, A.; Colpan, C.O. Thermodynamic performance assessment of an integrated geothermal powered supercritical regenerative organic Rankine cycle and parabolic trough solar collectors. Energy 2017, 120, 306–319. [Google Scholar] [CrossRef]
  25. Ashouri, M.; Razi Astaraei, F.; Ghasempour, R.; Ahmadi, M.H.; Feidt, M. Thermodynamic and economic evaluation of a small-scale organic Rankine cycle integrated with a concentrating solar collector. Int. J. Low-Carbon Technol. 2015, 12, 54–65. [Google Scholar] [CrossRef]
  26. Iodice, P.; Langella, G.; Amoresano, A. Modeling and energetic-exergetic evaluation of a novel screw expander-based direct steam generation solar system. Appl. Therm. Eng. 2019, 155, 82–95. [Google Scholar] [CrossRef]
  27. Li, P.; Li, J.; Tan, R.; Wang, Y.; Pei, G.; Jiang, B.; Tang, J. Thermo-economic evaluation of an innovative direct steam generation solar power system using screw expanders in a tandem configuration. Appl. Therm. Eng. 2019, 148, 1007–1017. [Google Scholar] [CrossRef]
  28. Singh, R.; Miller, S.A.; Rowlands, A.S.; Jacobs, P.A. Dynamic characteristics of a direct-heated supercritical carbon-dioxide Brayton cycle in a solar thermal power plant. Energy 2013, 50, 194–204. [Google Scholar] [CrossRef]
  29. Ahn, Y.; Bae, S.J.; Kim, M.; Cho, S.K.; Baik, S.; Lee, J.I.; Cha, J.E. Review of supercritical CO2 power cycle technology and current status of research and development. Nucl. Eng. Technol. 2015, 47, 647–661. [Google Scholar] [CrossRef]
  30. Dawson, L.A.; Rochau, G.E.; Carlson, M.D.; Mendez Cruz, C.M.; Fleming, D.D. Supercritical CO2-Brayton Cycle-Potential Benefits Applications Technology Development Status and Future Plans. (No. SAND2016-8202C); Sandia National Lab, 2016. Available online: https://www.osti.gov/servlets/purl/1378068 (accessed on 1 November 2019).
  31. Dostal, V. A Supercritical Carbon Dioxide Cycle for Next Generation Nuclear Reactors. Ph.D. Thesis, Massachusetts Institute of Technology, Cambridge, MA, USA, 2004. [Google Scholar]
  32. Dostal, V.; Hejzlar, P.; Driscoll, M.J. The supercritical carbon dioxide power cycle: Comparison to other advanced power cycles. Nucl. Technol. 2006, 154, 283–301. [Google Scholar] [CrossRef]
  33. Moisseytsev, A.; Sienicki, J.J. Investigation of alternative layouts for the supercritical carbon dioxide Brayton cycle for a sodium-cooled fast reactor. Nucl. Eng. Des. 2009, 239, 1362–1371. [Google Scholar] [CrossRef]
  34. Feher, E.G. The supercritical thermodynamic power cycle. Energy Convers. 1968, 8, 85–90. [Google Scholar] [CrossRef]
  35. Angelino, G. Carbon dioxide condensation cycles for power production. J. Eng. Power 1968, 90, 287–295. [Google Scholar] [CrossRef]
  36. Sarkar, J. Second law analysis of supercritical CO2 recompression Brayton cycle. Energy 2009, 34, 1172–1178. [Google Scholar] [CrossRef]
  37. Alzahrani, A.A.; Dincer, I. Energy and exergy analyses of a parabolic trough solar power plant using carbon dioxide power cycle. Energy Convers. Manag. 2018, 158, 476–488. [Google Scholar] [CrossRef]
  38. Wang, K.; He, Y.L. Thermodynamic analysis and optimization of a molten salt solar power tower integrated with a recompression supercritical CO2 Brayton cycle based on integrated modeling. Energy Convers. Manag. 2017, 135, 336–350. [Google Scholar] [CrossRef]
  39. Al-Sulaiman, F.A.; Maimoon, A. Performance comparison of different supercritical carbon dioxide Brayton cycles integrated with a solar power tower. Energy 2015, 82, 61–71. [Google Scholar] [CrossRef]
  40. Padilla, R.V.; Too, Y.C.; Benito, R.; Stein, W. Exergetic analysis of supercritical CO2 Brayton cycles integrated with solar central receivers. Appl. Energy 2015, 148, 348–365. [Google Scholar] [CrossRef]
  41. Solé, A.; Miró, L.; Barreneche, C.; Martorell, I.; Cabeza, L.F. Corrosion of metals and salt hydrates used for thermochemical energy storage. Renew. Energy 2015, 75, 519–523. [Google Scholar] [CrossRef]
  42. Lund, P.D.; Lindgren, J.; Mikkola, J.; Salpakari, J. Review of energy system flexibility measures to enable high levels of variable renewable electricity. Renew. Sustain. Energy Rev. 2015, 45, 785–807. [Google Scholar] [CrossRef] [Green Version]
  43. Lemmon, E.; Huber, M.; McLinden, M. NIST thermodynamic and transport properties of refrigerants and refrigerant mixtures (REFPROP) version 8.0. NIST Stand. Ref. Database 2007. [Google Scholar]
  44. Delingha 50 MW Thermal Oil Parabolic Trough Project. Available online: https://solarpaces.nrel.gov/delingha-50mw-thermal-oil-parabolic-trough-project (accessed on 12 November 2019).
  45. SUPCON Delingha 50 MW Tower. Available online: https://solarpaces.nrel.gov/supcon-delingha-50-mw-tower (accessed on 12 November 2019).
  46. Giostri, A.; Binotti, M.; Silva, P.; Macchi, E.; Manzolini, G. Comparison of two linear collectors in solar thermal plants: Parabolic trough versus Fresnel. J. Sol. Energy Eng. 2013, 135, 011001. [Google Scholar] [CrossRef]
  47. Poullikkas, A. Economic analysis of power generation from parabolic trough solar thermal plants for the Mediterranean region—A case study for the island of Cyprus. Renew. Sustain. Energy Rev. 2009, 13, 2474–2484. [Google Scholar] [CrossRef]
  48. Gilman, P.; Dobos, A. System Advisor Model, SAM 2011.12. 2, General Description; National Renewable Energy Lab. (NREL): Golden, CO, USA, 2012. [CrossRef] [Green Version]
  49. Burkholder, F.; Kutscher, C. Heat Loss Testing of Schott’s 2008 PTR70 Parabolic Trough Receiver; National Renewable Energy Lab. (NREL): Golden, CO, USA, 2009. [CrossRef]
  50. Zavoico, A.B. Solar Power Tower Design Basis Document; Sandia National Laboratories: Albuquerque, NM, USA, 2001.
  51. Dyreby, J.; Klein, S.; Nellis, G.; Reindl, D. Design considerations for supercritical carbon dioxide Brayton cycles with recompression. J. Eng. Gas Turbines Power 2014, 136, 101701. [Google Scholar] [CrossRef]
  52. Moisseytsev, A.; Sienicki, J.J. Performance Improvement Options for the Supercritical Carbon Dioxide Brayton Cycle; No. ANL-GENIV-103, Argonne National Lab. (ANL): Argonne, IL, USA, 2008. [Google Scholar] [CrossRef] [Green Version]
Figure 1. Schematic diagram of PTC power plant with a recompression s-CO2 Brayton cycle.
Energies 12 04358 g001
Figure 2. (a) T-S and (b) h-s diagram of the s-CO2 recompression Brayton cycle.
Energies 12 04358 g002
Figure 3. Cycle efficiency versus flow split fraction under different compressor outlet pressure values. Compressor inlet pressure is 7.4 MPa, temperature 31.25 °C and turbine inlet temperature is 487 °C.
Energies 12 04358 g003
Figure 4. Cycle efficiency versus flow split fraction under different turbine inlet temperature values. Compressor inlet pressure is 7.4 MPa, temperature 31.25 °C and turbine inlet temperature is 487 °C.
Energies 12 04358 g004
Figure 5. Cycle efficiency versus minimum temperature.
Energies 12 04358 g005
Figure 6. CO2 density and specific heat capacity dependence on temperature and pressure. (a) Specific heat capacity, (b) density.
Energies 12 04358 g006
Figure 7. Cycle efficiency versus split fraction during the transition from supercritical to liquid phase at supercritical pressure at different compressor inlet temperatures.
Energies 12 04358 g007
Figure 8. Optical (a) and thermal performance (b) of the PTC field versus solar incidence angle.
Energies 12 04358 g008aEnergies 12 04358 g008b
Figure 9. Performance results of the PTC s-CO2 Brayton cycle in clear-sky conditions on (a,b) 22 March, (c,d) 21 June, (e,f) 2 December.
Energies 12 04358 g009
Figure 10. Performance results of the thermal storage on a cloudy day.
Energies 12 04358 g010
Table 1. Flow split versus compressor outlet pressure (compressor inlet pressure is 7.4 MPa, temperature 31.25 °C and turbine inlet temperature is 487 °C).
Turbine Outlet Pressure [MPa]Maximum Cycle Efficiency [-]Optimized Flow Split Fraction [-]
160.40790.3816
180.40850.3571
200.40590.3327
220.40330.3204
240.39960.3082
260.39530.2959
280.39050.2837
300.38620.2837
320.38170.2714
Table 2. Flow split versus turbine inlet temperature (compressor inlet pressure is 7.4 MPa, temperature 31.25 °C and turbine inlet temperature is 487 °C).
Turbine Inlet Temperature [°C]Maximum Cycle Efficiency [-]Optimized Flow Split Fraction [-]
3500.29870.3327
4000.34310.3327
4500.38100.3327
5000.41370.3449
5500.44320.3327
6000.46930.3449
Table 3. Optimized flow split versus compressor inlet temperature (Compressor inlet pressure 7.4 MPa, outlet pressure 20 MPa and turbine inlet temperature 487 °C).
Compressor Inlet Temperature [°C]Maximum Cycle Efficiency [-]Optimized Flow Split Fraction [-]
200.42890.4184
250.43180.4184
300.43230.4061
350.39120.2959
400.37580.2592
450.36380.2469
500.35240.2224

