Article

Investigation of Burn Duration and NO Emission in Lean Mixture with CNG and Gasoline

by
Hüseyin Emre Doğan
1,*,
Osman Akın Kutlar
2,
Majid Javadzadehkalkhoran
1 and
Abdurrahman Demirci
3
1
Graduate School of Science, Engineering and Technology, Istanbul Technical University, Istanbul 34469, Turkey
2
Faculty of Mechanical Engineering, Istanbul Technical University, Istanbul 34437, Turkey
3
Mechanical Engineering Department, Karamanoğlu Mehmetbey University, Karaman 70200, Turkey
*
Author to whom correspondence should be addressed.
Energies 2019, 12(23), 4432; https://doi.org/10.3390/en12234432
Submission received: 11 October 2019 / Revised: 4 November 2019 / Accepted: 14 November 2019 / Published: 21 November 2019
(This article belongs to the Section B: Energy and Environment)

Abstract

:
The results of experiments performed by gasoline and natural gas fuels in a single cylinder research engine were evaluated in this study. The main objective of this study is to compare exhaust gas emissions, efficiency, and burn durations for both fuels in stoichiometric and lean mixture. At the same time, cycle to cycle variation in these operating conditions should not exceed an acceptable value. In the ultra-lean mixture, gasoline fuel exceeded this determined limit before Compressed Natural Gas (CNG). Therefore, the reduction in NO was restricted by cyclic variations. In combustion analysis, although the burn duration of the gasoline in stoichiometric conditions was shorter than CNG, this situation reversed in favor of CNG in the ultra-lean mixtures. Contrary to some studies in the literature, the spark advance and ignition delay for CNG were the same or shorter than gasoline in this study. The primary reasons for this change are the high compression ratio and the different combustion chamber geometry. The increase in turbulence intensity has different effects on CNG and gasoline. As a result, it has been observed that NO emissions can meet the limits without a loss of efficiency for this engine operated with CNG under the ultra-lean mixture.

Graphical Abstract

1. Introduction

Air pollution arising from increasing usage of fossil fuels has caused negative effects on human health in the last 60 years. Therefore, there are different opinions when discussing the future of internal combustion engines. In spite of this, gasoline and diesel fuels are used widely. Especially for diesel engines, it is not possible to provide the required exhaust gas emission limits easily and economically. As a result, it is required to have a lot of after-treatment equipment to convert the exhaust gases. The cost of such equipment, like catalytic converters, Selective Catalitic Reduction (SCR), Diesel Particulate Filter (DPF), etc., may cause problems for both the customer and manufacturer. Therefore, researchers are studying alternative solutions to meet the emission limits and fuel consumption.
Alternative fuels might be used instead of gasoline and diesel engines to solve this problem [1]. With high H/C levels of compressed natural gas (CNG) and existence of distributed infrastructure, it is the most promising alternative fuel considered as renewable energy [2], because biogas produced from organic waste has the same chemical composition as CNG [3]. If the compression ratio (ε) is 15 or 16 without knocking, CNG can be 10% more efficient than gasoline [4]. Although different results have been declared in the literature, CNG has a higher efficiency, especially in lean mixture [5]. Break-specific fuel consumption (g/kWh) for CNG is lower than gasoline by 10–20% due to different lower heating values of fuels [2,6]. In addition, usage of CNG could decrease the CO2 emission by 15–20% due to higher levels of H/C value of CNG [7].
The power of the CNG engine decreases by 15–20%, especially in full load condition [8]. When natural gas is used instead of gasoline fuel, engine power reduces in naturally aspirated engines in the wide open throttle conditions. The volumetric efficiency decreases due to the CNG injected into intake port in the gas phase. CNG engine can be operated without knock by higher compression ratios [9]. Therefore, it is possible to compensate the power decrease by increasing the compression ratio [8].
NOx, total hydrocarbon (THC), and Particulate Matter (PM) emissions are the major problems to be solved today for diesel and Gasoline Direct injection (GDI) engines. A PM problem could be reduced or eliminated in an engine with a homogeneous mixture. In order to reduce NO emissions, it is necessary to reduce in-cylinder temperatures. In dual fuel or spark ignition systems, relative air/fuel ratio (λ) should be higher than 1.5 to reduce NO [2,10]. Working with ultra-lean mixture is a method used to reduce the temperature. CNG has a higher ignition range. Therefore, except for THC, all exhaust emissions can be reduced under the ultra-lean mixture conditions (λ = 1.6–1.7). Some studies lay emphasis on further NOx reduction in stoichiometric mixture in a CNG-fueled engine. The primary reason for high levels of NOx is longer ignition advance in CNG engines compared to gasoline in same conditions [11,12]. Some research has proven the longer combustion time of CNG (CA for 10–90%) working in the same conditions. In addition, some other studies broadly assert the higher spark advance (SA) and longer ignition delay for CNG [6,13]. In Otto cycle, it is necessary to increase turbulence in order to operate in lean conditions [14]. In engines, machining a shape like a bowl on the piston head to increase the turbulence intensity generates an air movement from squish area to inside of the bowl [14,15]. The effect of different shapes of combustion chambers on the turbulence and mean flow speed were investigated by different researchers. However, in a lean mixture, due to low flame propagation speed, flame extinctions start before the end of combustion. The shape of the combustion chamber becomes more significant to accelerate the slow combustion, especially in lean areas [16].
Another important issue in lean condition is cycle to cycle variation. There are different parameters used in the literature to investigate the cyclic variations. The value of the coefficient of variation for indicated mean effective pressure (COV_IMEP), which is used most extensively in literature, should not be higher than 5% to stable operating conditions [6,17,18]. It is determined that with CNG, the first phase of combustion (0–10%) is faster than gasoline, but due to increasing temperature, the combustion duration (10–90%) is longer than gasoline [5].
Engines used in studies which are concerned with CNG in the literature are designed for gasoline and have low compression ratio [7,12,19]. In this study, contrary to some studies that are mentioned above, the spark advance and ignition delay durations were shorter for both fuels. The single cylinder research engine used in this study is originally a diesel engine which is converted to a spark ignition [20]. So, the parameters such as compression ratio, turbulence intensity, combustion chamber, and intake manifold geometries are different from gasoline engines used in the other studies in the literature. The reason for this difference will be investigated in detail later on.
On the other hand, acceptable operating conditions in the lean mixture regime for CNG and gasoline fuels have been investigated. The aim was to reduce NO below 300 ppm or 3 g/kWh in the lean mixture conditions for both fuels. For these operating parameters, which are suitable for NO, the cycle to cycle variation was also examined for compliance with the desired limits. Here, these limits could be provided by taking advantage of stable operating capability of CNG in the lean mixture. As expected, THC emissions increase in ultra-lean conditions. If nitrogen oxide can be reduced to 2–3 g/kWh, THC could be lowered by methane oxidation catalyst.

2. Materials and Methods

An Antor 3LD 450 single cylinder spark ignited engine (Anadolu Motor Company, İstanbul, Turkey), which was converted to CNG fuel system, was used (Figure 1). Technical data of this engine is listed in Table 1. In addition, a mini engine control unit (ECU) and software was developed in the laboratory to control this engine [21]. In the experiments, a 70 kW eddy-current engine brake dynamometer was used and the engine force was measured with a load-cell. Except in-cylinder pressure, at each experiment point, all of the measured physical data was recorded during 120 seconds by the laboratory control system. An AVL GU21D piezoelectric transducer (The Kistler Group, Winterthur, Switzerland) was used to measure the cylinder pressure. In-cylinder pressure was recorded by a Kistler Kibox high speed data acquisition system (Cockpit V2.1, The Kistler Group, Winterthur, Switzerland). The pressure, volume, etc., was recorded during 200 cycles in every 0.1° crank angle (CA) step. To measure fuel consumption for gasoline, an AVL 733S system was used, and for CNG, a precise scale was used. The sensitivity of this device is 1 gram. The software of the scale transfers the data instantaneously to the main computer. The chemical composition of CNG was obtained every month from the supplier. Air consumption was measured by Dresser G65 roots type flow meter (Dresser Meter & Instruments, Houston, US). In all of the experiment points, the spark advance was set to obtain the maximum break torque.
Emission measurements were carried out with Horiba Mexa 7500 (Horiba Group, Kyoto, Japan) and Bosch BEA 350 (Robert Bosch GmbH, Germany) devices. In this paper, emission calculations were made based on the Mexa 7500. In this study, the air/fuel ratio at stoichiometric mixture was 14.6 and 16.8 for gasoline and CNG, respectively (Table 2). The CNG fuel used in this study consists of 94% CH4, 4% C2H6, 0.93% C3H8, 0.5% N2, and 0.47% other gases. The uncertainties of measurement devices are listed in Table 3. The experiments were carried out in different relative air/fuel ratios in two different engine speed and break mean effective pressure (BMEP) conditions. The experiment matrix is listed in Table 4. Cooling water temperature was fixed approximately at 65 °C.
The engine has two valves and a spark plug, which is placed at the center. A cylindrical bowl was created on the piston with 48.5 mm diameter and 18 mm depth, and the compression ratio was set on 12. By this way, the turbulence intensity increased for both fuels. Also, since the cylinder head belongs to diesel engine, the intake port shape creates swirl motion. By means of two effects, it is possible to operate in lean conditions even with gasoline fuel. For both fuels, efficiency, exhaust emissions, cycle to cycle variation (net indicated mean pressure changes), spark advance, heat release rate, and burn duration were compared under the same operating conditions.

3. Discussion

3.1. Efficiency and Emissions

In order to achieve the constant BMEP in different mixtures, the throttle was opened more than at the stoichiometric condition and the amount of fuel was slightly reduced. As the volumetric efficiency increases, the efficiency (effective) improves. In addition to the increase in volumetric efficiency, pumping losses decreased in this process. When λ = 1.7 was selected instead of the stoichiometric mixture at BMEP of 3 bar, pumping losses were reduced by approximately 30–40%. In partial loads, fuels like CNG, which need more air in stoichiometric combustion and can operate with ultra-lean mixtures, have higher efficiency due to improvements in volumetric efficiency and pumping losses. This effect leads to a reduction in CO2 emissions, as well as a reduction in fuel consumption. According to the results obtained for both fuels, CNG has the same efficiency or is more efficient (4–6%) than gasoline at all operating points. In constant BMEP, the net indicated efficiency increased by 15% by using the ultra-lean mixture instead of the stoichiometric mixture. With the CNG, the engine can operate with a full open throttle in BMEP > 4.5 bar. This means that only the amount of fuel, such as in diesel engines, must be changed to achieve higher loads. Also, CO2 emissions decreased by approximately 12% compared to gasoline. Decrease of the CO2 was due to the increase in efficiency and the higher hydrogen/carbon (H/C) ratio of CNG. Theoretically, even if both fuels have the same efficiency in the stoichiometric mixture, when 1 mole of gasoline or CH4 is burned, CH4 produces about 10% less CO2.
Therefore, CO2 emission, which causes greenhouse gas effects, can be reduced by the usage of CNG. In addition, the Mexa 7500 device, which is used for emission measurement, can separately measure the CH4 concentration in THC. Approximately 90% of THC consists of CH4 at all operating points.
The main reason for the desire to operate with the lean mixture is to reduce NO emissions, even if the efficiency remains constant. In the experiment, only NO gas was measured. It was intended to keep the NO level below 300 ppm or 3 g/kWh in the ultra-lean mixture. As it is known, in-cylinder mean temperature decreases in lean mixtures. For this reason, the amount of NO, which exponentially depends on temperature, decreases even though there is excess oxygen in the mixture. Because of the difference in volumetric efficiency, it is more appropriate to use g/kWh instead of the ppm unit in order to compare the two fuels’ emissions. This is also necessary to compare with exhaust emission limits. Conversion of exhaust gases was applied based on the European Commission regulation [22]. In addition, the NO correction coefficient, which is specified in the regulation and depends on the relative humidity, was taken into account according to the relevant directives. NO results at 1500 rpm are given in Figure 2. NO was reduced to the desired values for BMEP of 3–5 bar and λ ≥ 1.6 operating conditions.
NO values at 2000 rpm are shown in Figure 3. In order to keep the same NO values at 1500 rpm, the relative air/fuel ratio of the lean mixture should be increased to 1.7. This condition shows up especially at a BMEP of 5 bar. In stoichiometric mixture, the spark advance is almost the same for both fuels such as 14° CA btdc (before top dead center) for gasoline and 15 btdc for CNG in this condition. Therefore, it is expected to have the same NO values. However, the CNG flame proceeds faster than gasoline during early flame development and first burning locations have higher temperatures [23]. Due to this, despite almost the same lower heating value of mixture for both fuels, the CNG produces higher NO emission at about stoichiometric condition (Figure 3). In addition, an increase of the burn duration in CNG also rose the NO formation at stoichiometric and some lean conditions. But, by increasing the relative air/fuel ratio to ultra-lean mixture, the spark advance was higher for gasoline. So, the gasoline engine produced more NO in (λ = 1.3–1.6). This relation shows similar tendencies in both speeds. NO limit values for both fuels were provided under λ ≥ 1.6 conditions. In order to achieve the NO limits, the engine was operated like that in leaner mixtures as the engine load (BMEP) increased. In the following sections, it was investigated that the cyclic variations are acceptable in the lean mixture where NO values were too low for both fuels.

3.2. Cyclic Variations

The quantity of fuel that intakes in cylinders at each cycle is very effective on cyclic variations. Gasoline was in the liquid phase when it was injected in the intake manifold. Especially at the part load conditions, the gasoline evaporation cannot be uniform for each cycle. However, CNG was injected in the manifold in the gas phase. Hence, cyclic variations of CNG are less sensitive to relative air/fuel ratio than gasoline until the ignition limits are reached. The increase in the BMEP for both fuels has had a positive effect on Coefficient of Variation (COV) due to the reduction in residual gas ratio. The variation of net indicated mean effective pressure was examined for coefficient of variation in 200 cycles. For both fuels, COV was calculated at each experiment point. For COV of indicated mean effective pressure the value of 5%, which is generally accepted in literature, was selected as the limit value [5]. As can be seen in Figure 4, gasoline fuel was not suitable to operate with ultra-lean mixture at a BMEP of 3 bar and 1500 rpm. The cycle to cycle variation of natural gas was less than gasoline in all operating conditions. Essentially, the NO emission in both fuels were approximately 2–2.5 g/kWh (200–250 ppm) at the λ = 1.6. Although the gasoline provided the desired NO limits, it did not meet the criteria (COV < 5%) for the cycle to cycle variations at the ultra-lean mixture. At BMEP of 5 bar condition for gasoline, the COV value (3%) was below the limits for the ultra-lean mixture (Figure 4). However, the natural gas is still better than gasoline, even if it operates with the leaner mixture. In addition, the NO level decreased to around 120 ppm, caused by a decrease in cylinder temperature due to the further leaner CNG mixture. The gasoline engine usually exceeded this COV limit after λ = 1.5 under low engine load. It is possible to operate in the lean mixture in both fuels at a BMEP of 5 bar and 2000 rpm. But, by increasing the speed, the cycle to cycle variation increases in gasoline. Although the COV limit provided for gasoline at 1500 rpm and 5 bar, at 2000 rpm, it reached the cyclic variation limits. One of the reasons for this difference between fuels is the value of ignition limits.
Based on the above remarks, the engine has been operated with CNG fuel by λ = 1.6–1.7 to provide NO limits under the COV < 5% without using any after-treatment equipment for NO. The research engine used is classified as a non-road application example. The THC + NOx limit value for the engine is 8 g/kWh according to stage V in the European union [22]. From the experimental results, it is obvious that stage V limits cannot be achieved without an after-treatment system for both gasoline and CNG. For this reason, a methane oxidation catalyst, or three-way converter, must be used according to the applied operating strategy.

3.3. Combustion Analysis

In the study, the spark advance was selected based on maximum engine torque. Except for stoichiometric mixture, the spark advance in the gasoline engine was higher than CNG. As could be seen from Figure 5, differences between the spark advances increase by moving to the ultra-lean region. This difference is related to ignition limits and laminar flame speeds of fuels. In the experiments, the volumetric efficiency could be different for two fuels due to constant engine speed and BMEP. For this reason, the amount of residual gas, turbulence intensity, and temperature of the mixture at the moment of the ignition time have a direct effect on spark advance. By increasing the engine load, the difference between the spark advance for both fuels decreases. In the case of the stoichiometric mixture, the engine with both fuels was operated at the similar spark advance (14°–15° CA btdc). However, at a BMEP of 3 bar, spark advance in lean mixture increases rapidly for gasoline (Figure 5). Ignition delay was also longer for gasoline due to igniting in colder conditions than CNG.
The spark advances for 2000 rpm condition are given in Figure 6. As the speed rose, all the spark advances increased. The changes of spark advance were similar for both engine speeds. At a BMEP of 3 bar and 2000 rpm, the ignition advance for both fuels were 20° CA in the stoichiometric mixture, whereas in the lean mixture (λ = 1.6) it was 34° and 42° CA for CNG and gasoline, respectively. It is declared in the literature that the gasoline needs a shorter spark advance than CNG in the same operating condition [12,14]. However, the spark advance values obtained in this study do not support these results. The main reasons for this difference arise from the different structure of experimental engines. The research engine used in this study was converted from a diesel engine to spark ignition. Therefore, the intake port geometry had been designed to create swirl air motion. In the classic gasoline engine, this design is different and more simple. In addition, the compression ratio selected was 12. Due to the piston design of the research engine, it allows the creation of different geometries on piston. These results were investigated in detail in the “ignition delay” part. In addition, the spark advance was checked on the data acquisition system by two different methods, one of them being ECU signal (5 Volt), and the other from a spark current adapter that mounted to a spark plug cable. There is a negligible delay between the values measured by these two methods (<0.3° CA).
The effect of different spark advance (SA) on the ignition delay and heat release was investigated for both fuels. It is necessary to determine the start of combustion to calculate the ignition delay time. In some of the studies, the ignition delay is assumed to be the time between the spark advance and the 5% MFB (mass fraction burned) location. In this study, the ignition delay is defined as the time between the spark advance and the start of sensible positive heat release. To achieve a positive heat release location, firstly, the heat release rate was calculated from in-cylinder pressure and volume at each crank angle step. Then, the integrated (cumulative) heat release was obtained from heat release rate data. As an overall approach, the heat release calculation starts a little before the spark advance in the case of using a pressure acquisition system, because these systems generally do not determine the start of combustion location. This start point (positive heat release location) for integrated heat release calculation is entered in the system by the user and it has to update for every change in the spark advance. It is difficult to estimate the correct start location of combustion due to ignition delay during the measurement.
In brief, to calculate the integrated heat release, the start point should be set at the moment that the heat transfer from the cylinder to the surroundings is equal or less than the heat release rate that was calculated from the pressure and volume information in the cylinder. In this study, to determine the combustion start point, the integrated heat release was calculated starting from any point during the compression stroke before spark advance. Then, the derivation of this curve was calculated. Finally, the start of combustion was determined as where the sign of derivative integrate heat release changes permanently before Top Dead Center (TDC). To do this recalculation method, a code was written to calculate the heat release rate by using an average p-V data obtained from 200 cycles by using the Rassweiler–Withrow method (Equation (1)).
Q 1 _ 2 = 1 k 1 V 2 [ p 2 p 1 ( V 1 V 2 ) k ] ,
In Figure 7, the heat release rate and two different integrated heat releases were shown together. The blue line is related to the constant starting point and the orange shows the heat release related to the starting point obtained from the recalculation method. Figure 7 shows the location of positive heat and integrated heat release in magnified view. Also, the offset position was demonstrated by an arrow. In calculation with a constant start point (blue line), even if the combustion starts in real time, it will be considered that the ignition has not started yet due to negative integrated heat release.
This problem has been removed by using a recalculation period, as described above. A heat transfer model such as Woschni can be applied on the heat release rate data to obtain integrated heat release directly. However, some assumptions are required to use a heat transfer model. Therefore, the recalculation method is more simple than a heat transfer model.
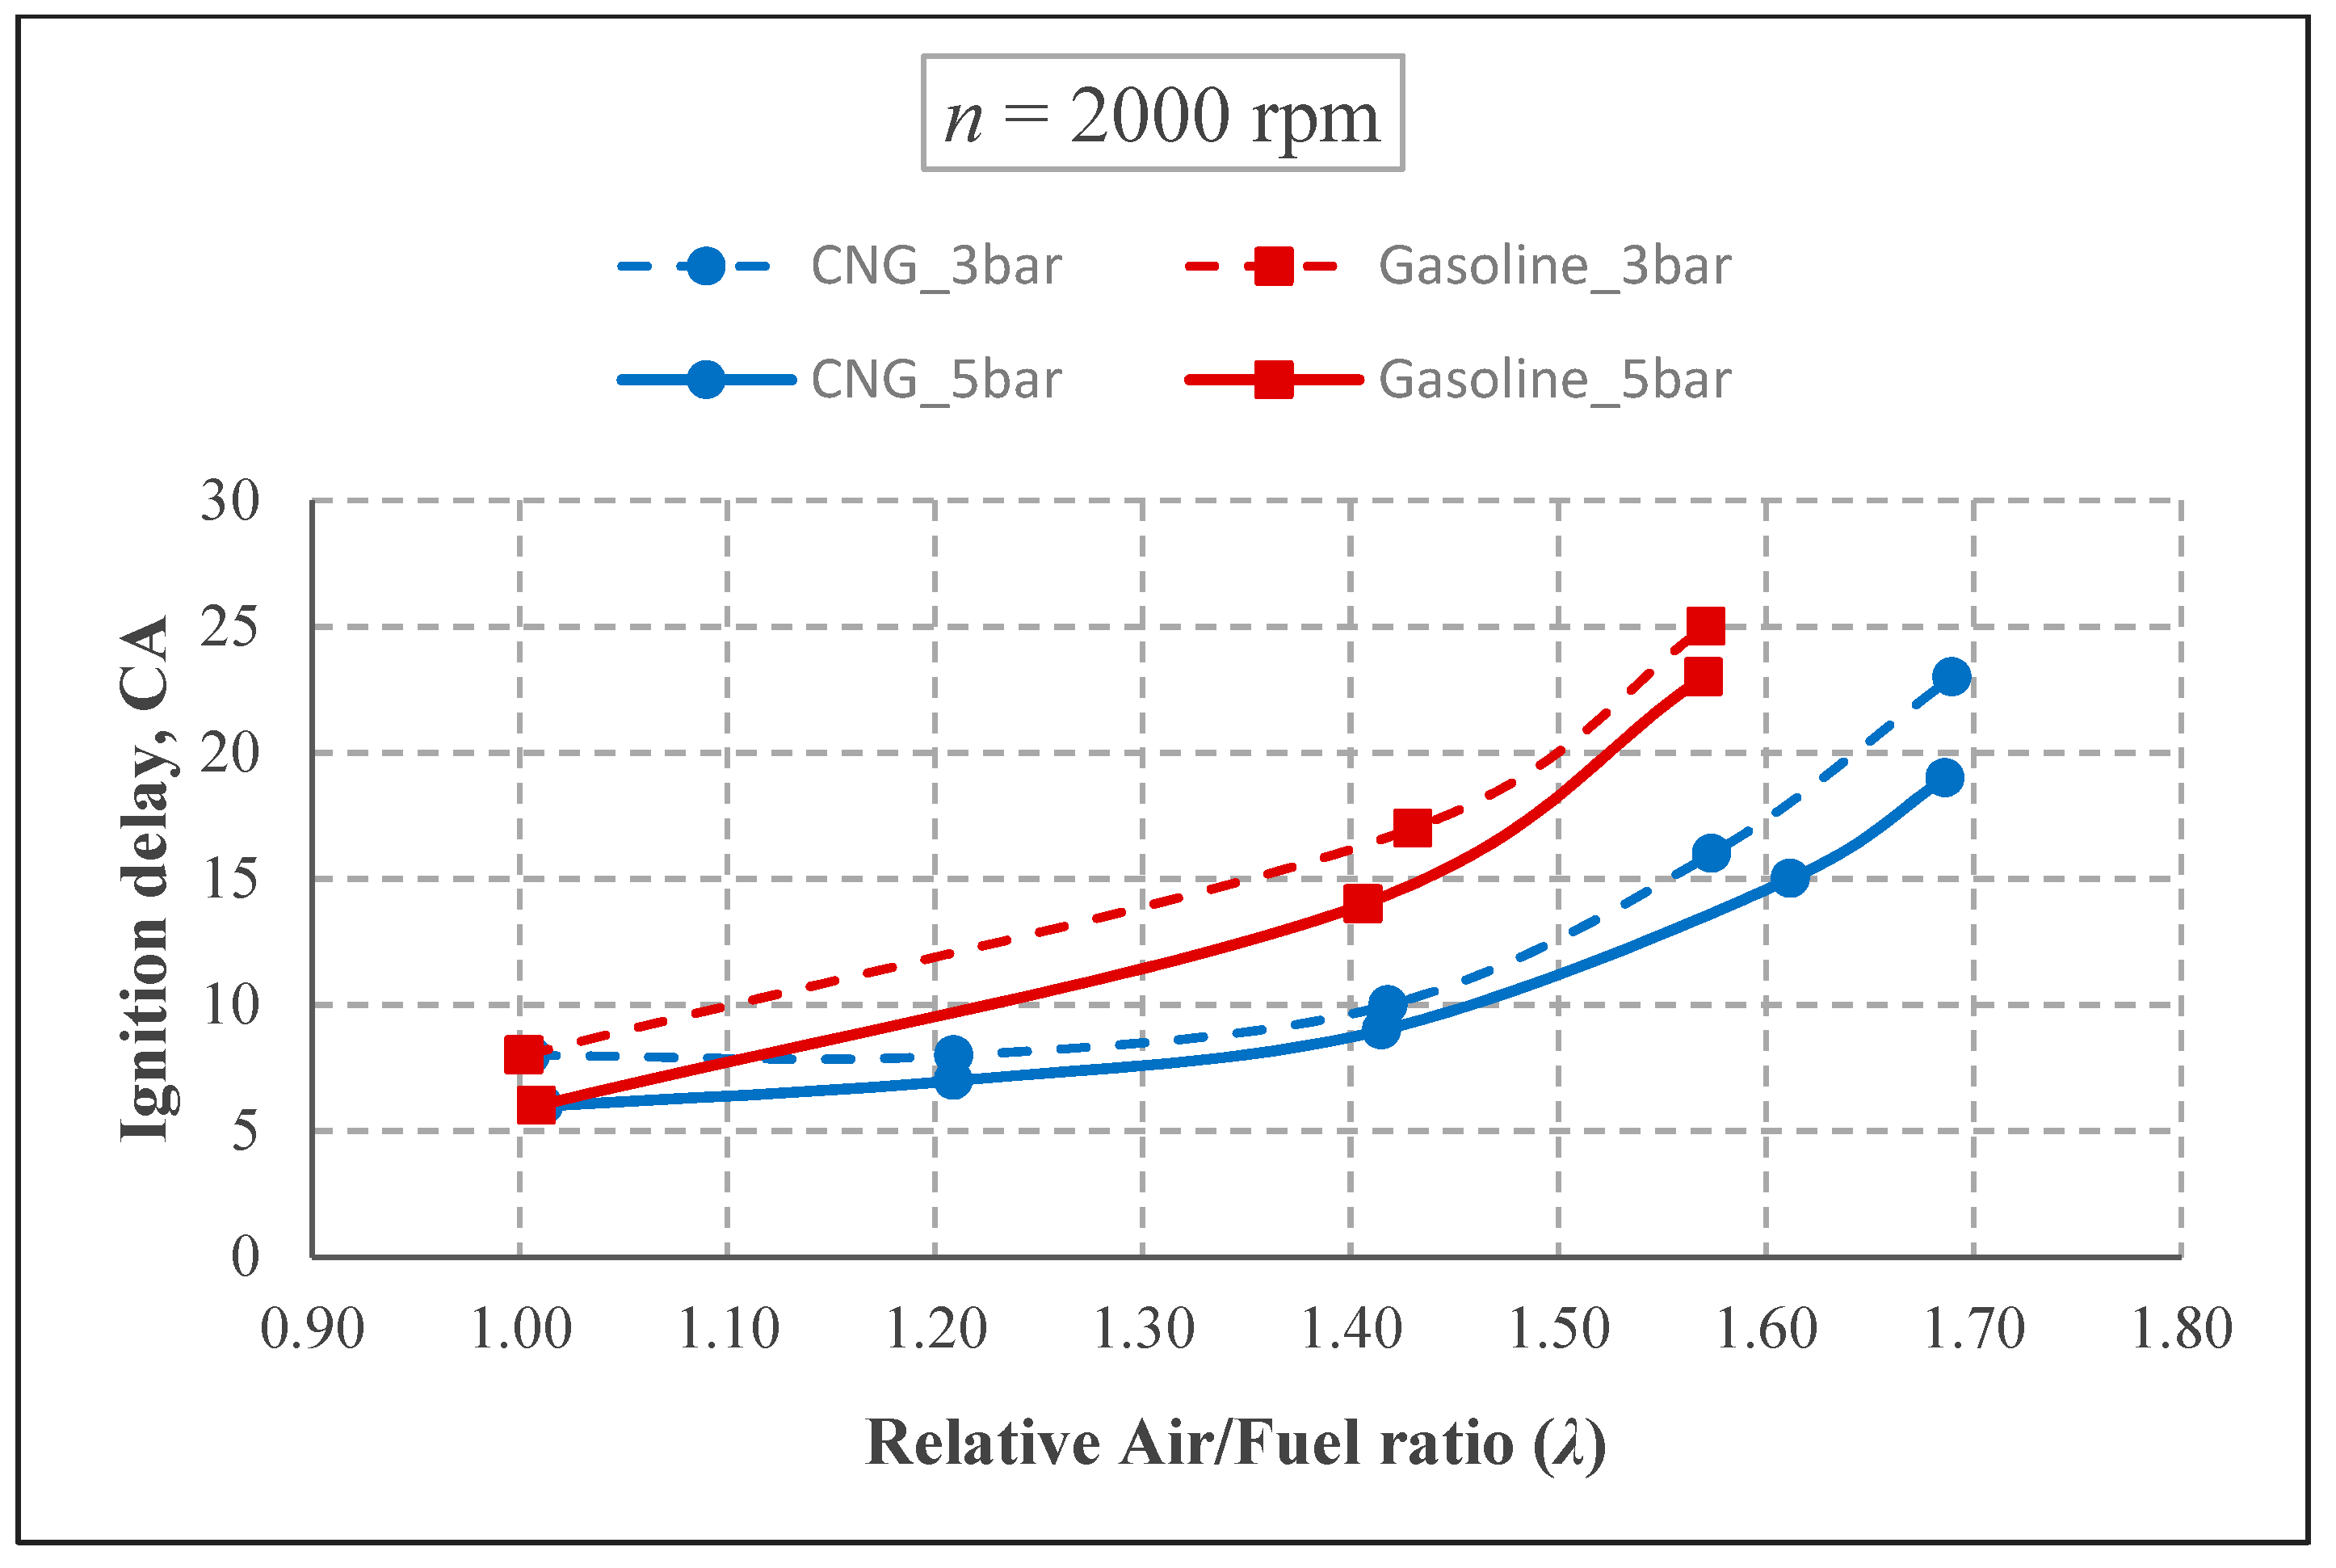
Ignition delay has been calculated after determination of the start of combustion. The time between the spark advance and start of combustion was defined as ignition delay (DI-SA). As shown in Figure 8, ignition delay had the same tendency, similar to spark advance. The ignition delay time for gasoline in ultra-lean mixture is quiet longer due to approaching the ignition limits and laminar flame speed. This effect was seen in cycle to cycle variation as well.
By increasing the speed, the ignition delay has increased as expected, but the general tendency is similar to spark advance (Figure 6 and Figure 9). The ignition delay is similar for both fuels in the case of stoichiometric mixture with the same spark advance. In addition, this period for CNG is shorter than gasoline in lean mixture. For example, at a BMEP of 5 bar and 1500 rpm, the ignition delay duration was 5° CA for both fuels in the stoichiometric condition, whereas it was 11° CA and 16° CA for CNG and gasoline in lean mixture, respectively. However, this period is defined as longer for CNG in the stoichiometric conditions by some researchers [6,7,12]. The main reason for this contrast is structural differences between the experimental engines. Pan et al. [14] have used an engine with variable compression ratio and the results show that the ignition delay decreases as compression ratio increases. But, despite the increase of compression ratio, the ignition delay for CNG was longer than gasoline. The compression ratio is set on 12 for an Antor 3LD 450 research engine. This is a high value compared to other studies. Therefore, a decrease in ignition delay is not an unexpected situation. This issue is handled in burn duration part. The ignition delay period was defined as the time between the start of combustion location (sometimes SA) and 5% or 10% MBF and the start of combustion by some researchers [13,14]. The ignition delay time based on this definition is given in Figure 10. This figure shows that the ignition delay time is less for CNG. So, both of the two definitions for ignition delay time have a negligible effect and do not change the general result in this study. The small difference between results obtained from two definitions is due to the different laminar flame speed of fuels. The combustion has started before while using 5% or 10% MBF definition. So, the ignition delay time of CNG is less than gasoline in the stoichiometric mixture due to higher laminar flame speed at low temperature and pressure conditions [5,6].
Heat release values were compared to gain an understanding about the combustion period of the fuels. Selected spark advance (SA) was the same for both fuels in the stoichiometric mixture condition. The heat release rates for both fuels with the same spark advance are shown in Figure 11. It can be seen that the gasoline burned faster than CNG. However, the heat release rates are very similar for these fuels up to the top dead center. Actually, the laminar burning speeds of both fuels in the atmospheric condition are almost the same. After TDC, the gasoline heat release rate raised more rapidly. In this operating condition, the ignition delays of both fuels are again the same (Figure 8). However, the laminar flame speeds of both fuels show different behavior under high pressure and temperature [9,24]. Consequently, during the combustion process, both fuels could be faster or slower than each other. Here, CNG has higher volumetric efficiency than gasoline due to the experimental conditions. Thus, the parameters like temperature and turbulence intensity have a positive effect on the heat release rate of CNG.
The ignition delay and burn duration depend on the heat release rate for both fuels. The turbulence has a major effect on the heat release rate. The test engine, which is used in some studies, is converted from gasoline base engine. Therefore, it is not designed to create high turbulence levels. The engine that was used in this study is converted from a diesel engine. The intake manifold geometry of this engine creates extra swirl motion. Also, in contrast to some other studies where the flat type piston has been used, there is a bowl-shaped combustion chamber on top of the piston in this study. Some researchers investigated the effect of combustion chamber geometries on burn parameters [17]. Spark advance and ignition delay decreases as the reentrant level (piston diameter/bowl diameter) increases [16]. Moreover, the reduction in bowl diameter increases the turbulence at the edge of the bowl and decreases the air motion around the spark plug. This is a positive condition for flame kernel formation process. Combustion takes place in two different stages due to the bowl. The combustion proceeds quickly in the bowl due to the high turbulence level. This is a decisive factor in early flame development period and burn duration [25,26].
As mentioned above, the combustion chamber shapes on the piston are effective on spark advance, ignition delay, and flame development period. However, the effect of the increase in turbulence intensity on CNG and gasoline was different in this study, because the spark advance and ignition delay time of CNG are higher in the experiments which used gasoline-based engines in the literature. In contrast, different results were obtained in the experiments which used diesel-based engines in this study. Brequigny et al. [27] investigated the effects of Lewis number and Markstein length (Lb) values on the laminar and turbulent flame velocities. Gasoline is more resistant to flame wrinkles due to its higher Le and Lb. Therefore, the increase in turbulence intensity is more effective on CNG, while it has a slower effect on gasoline. The high pressure and temperature in real engine operating conditions help to reduce this resistance for gasoline [27]. In contrast to gasoline, the laminar flame speed of CNG decreases excessively with increasing temperature and pressure [5]. As a result, increased turbulence intensity leads to rapid progression of CNG during ignition delay and early flame development. However, the burn speed of the CNG decreases due to the effect of high pressure on the laminar flame speed at the end of the combustion. This was seen more clearly in the stoichiometric mixture operating condition.
As previously mentioned, the heat release rate of gasoline is higher than CNG in stoichiometric mixture condition. But, in lean mixture, the relation between combustion duration slightly changes. In Figure 12, the heat release rate of both fuels is given in ultra-lean mixture conditions. In this state, the spark advance must be different for fuels to have a constant break mean effective pressure. To have maximum break torque, the spark advance for CNG and gasoline is set to 27° CA and 37° CA btdc, respectively. Although gasoline was ignited 10 CA earlier than CNG, the heat release rate was not rapid as stoichiometric mixture. Furthermore, the maximum value of the integrated heat released was the same for CNG and gasoline. However, the integrated heat release curve followed a different path from stoichiometric conditions. Especially the rapid combustion of natural gas towards the end of combustion was the main difference between stoichiometric and ultra-lean conditions.
In the literature, the period between 5% and 90% MBF was used to compare the burn duration. Figure 13 shows burn durations for CNG and gasoline at 1500 rpm. Evaluations about the combustion propagation period based on the heat release rate on the previous section were validated by the duration of combustion. In the region of λ = 1 − 1.2, the burn duration of the gasoline was less than CNG. At a BMEP of 5 bar and 1500 rpm, burn duration in the stoichiometric mixture was approximately 24° CA and 27° CA for gasoline and CNG, respectively, whereas it was approximately 34° CA and 30° CA in the lean condition (λ = 1.6). However, as shown in Figure 13, as the mixture progresses from the stoichiometric conditions to the lean region, the burn duration decreases and then increases again. Normally, burn duration increases as the mixture becomes lean [28]. This situation was observed clearly at 2000 rpm. In addition, GU21D and Kistler 6118CF-6CQ04 spark plug transducers were used at the same time to determine if there was an error caused by the transducers.
Although there was no change for the decrease of burn duration (stoichiometric to lean), it was found that there were significant differences between the 90% MBF locations that were calculated from different transducers. Generally, the location of 90% MBF occurs approximately 10° CA later according to spark plug transducers. Whereas, the 5%, 10%, 50%, and 70% MBF locations were extremely similar for both pressure transducers. Based on all these results, it was concluded that this unexpected drop tendency in burn duration was caused by a thermal shock effect on the pressure transducer. This effect became more apparent in the stoichiometric mixture due to high temperatures in the cylinder. The effect of the thermal shock on the transducer became more sensible during expansion stroke [29,30]. However, to compare gasoline and CNG, thermal shock has a negligible effect on transducers in the same relative air/fuel ratio. In order to see this effect, 5–80% MBF duration were examined under the same conditions. As shown in Figure 14, as expected, the burn duration increases when the mixture becomes leaner, whereas considering the 5–90% MBF time, an inverse tendency was observed around the stoichiometric mixture (Figure 13). The same explanation is acceptable for 2000 rpm (Figure 15). For example, at a BMEP of 5 bar and 2000 rpm, burn duration in the stoichiometric mixture was approximately 17.5° CA and 18.5° CA, whereas for lean mixture, it was approximately 25.5° CA and 22.5° CA for gasoline and CNG, respectively.
Consequently, while the burn duration for gasoline is shorter in stoichiometric mixture, in lean mixture CNG burns faster than gasoline. Contrary to some studies, the increase in turbulence intensity has reduced this difference for CNG in the stoichiometric mixture. The increase in turbulence intensity was more effective on the burn duration of CNG. This change indirectly affects the ignition advance and delay duration. Namely, the ignition advance value that was required to obtain maximum engine torque was reduced. Therefore, the ignition delay duration reduced due to higher temperature at the time of ignition in the cylinder.

4. Conclusions

As described in the results section, CNG fuel provided the desired limits (NO and COV) in the ultra-lean mixing regime. Operating with lean mixture instead of stoichiometric conditions increases the indicated efficiency for both fuels under the same BMEP. Furthermore, contrary to our expectations, THC emissions remained almost the same as gasoline. However, an after-treatment system must be used to reduce THC emission. It was observed that the burn duration of gasoline was shorter than CNG in the stoichiometric mixture. In the case of the lean mixture, this situation reversed in the lean mixture. In contrast to some studies in the literature, spark advance and ignition delay duration of the gasoline was not shorter than CNG at the stoichiometric condition. Pressure transducer errors must be taken into account when comparing the burn duration, with respect to relative air/fuel ratio. The turbulence provided by the intake port and the combustion chamber geometries of the research engine and the partially high selected compression ratio had a positive effect on the burn duration, ignition delay, and spark advance for both fuels, especially CNG. Increased turbulence did not have the same effect on both fuels. As a result, the research engine has a capacity to operate more efficiently and produce less CO2 and NO when the engine is operated with CNG.

Author Contributions

H.E.D. converted the engine to operate with CNG, performed experiments, analyzed data, and prepared the first draft. O.A.K. investigated literature and comment the results. M.J. performed all experiments. A.D. produced piston by cylindrical bowl, designed the paper, and contributed analysis.

Funding

This work is supported by The Scientific and Technological Research Council of TURKEY (Project number: 218M232).

Acknowledgments

The authors would like to thank CNGTURK and Olgun Auto Companies for providing CNG equipment and information.

Conflicts of Interest

The authors declare no conflict of interest.

References

  1. Hora, T.D.; Agarwal, A.K. Experimental study of the composition of hydrogen enriched compressed natural gas on engine performance, combustion and emission characteristics. Fuel 2015, 160, 470–478. [Google Scholar] [CrossRef]
  2. Königsson, F.; Stalhammar, P.; Angstrom, H.E. Characterization and Potential of Dual Fuel Combustion in a Modern Diesel Engine. In Proceedings of the SAE 2011 Commercial Vehicle Engineering Congress, Chicago, IL, USA, 13–14 September 2011; p. 13. [Google Scholar]
  3. Van Basshuysen, R. Natural Gas and Renewable Methane for Powertrains; Springer: Berlin, Germany, 2015; Volume 10, p. 978-3. [Google Scholar]
  4. Poulton, M.L. Alternative Fuel for Road Vehicles; WIT Press/Computational Mechanics: Southampton, UK, 1994. [Google Scholar]
  5. Ran, Z.; Hariharan, D.; Lawler, B.; Mamalis, S. Experimental study of lean spark ignition combustion using gasoline, ethanol, natural gas, and syngas. Fuel 2019, 235, 530–537. [Google Scholar] [CrossRef]
  6. Pourkhesalian, A.M.; Shamekhi, A.H.; Salimi, F. Alternative fuel and gasoline in an SI engine: A comparative study of performance and emissions characteristics. Fuel 2010, 89, 1056–1063. [Google Scholar] [CrossRef]
  7. Yontar, A.A.; Doğu, Y. Experimental and numerical investigation of effects of CNG and gasoline fuels on engine performance and emissions in a dual sequential spark ignition engine. Energy Sources Part A Recovery Util. Environ. Eff. 2018, 40, 2176–2192. [Google Scholar] [CrossRef]
  8. Aljamali, S.; Mahmood, M.W.; Abdullah, S.; Yusoof, A. Comparison of Performance and Emission of a Gasoline Engine Fueled by Gasoline and CNG Under Various Throttle Positions. J. Appl. Sci. 2014, 14, 386–390. [Google Scholar] [CrossRef]
  9. Fu, J.; Shu, J.; Zhou, F.; Liu, J.; Xu, Z.; Zeng, D. Experimental investigation on the effects of compression ratio in-cylinder combustion process and performance improvement of liquifed methane engine. Appl. Therm. Eng. 2017, 113, 1208–1218. [Google Scholar] [CrossRef]
  10. Demirci, A. The Effects of Different Combustion Chamber Geometries on the Performance and Emissions of A Internal Combustion Engine. Ph.D. Thesis, Istanbul Technical University, Istanbul, Turkey, 2017. [Google Scholar]
  11. Jahirul, M.I.; Masjuki, H.H.; Saidur, R.; Kalam, M.A.; Jayed, M.H.; Wazed, M.A. Comparative engine performance and emission analysis of CNG and gasoline in a retrofitted car engine. Appl. Therm. Eng. 2010, 30, 2219–2226. [Google Scholar] [CrossRef]
  12. Ramasamy, D.; Goh, C.Y.; Kadirgama, K.; Benedict, F.; Noor, M.M.; Najafi, G.; Carlucci, A.P. Engine performance, exhaust emission and combustion analysis of a 4-stroke spark ignited engine using dual fuel injection. Fuel 2017, 207, 719–728. [Google Scholar] [CrossRef]
  13. Pan, J.; Li, N.; Wei, H.; Hua, J.; Shu, G. Experimental investigations on combustion acceleration behavior of methane/gasoline under partial load conditions of SI engines. Appl. Therm. Eng. 2018, 139, 432–444. [Google Scholar] [CrossRef]
  14. Reynolds, C.; Evans, R. Improving Emissions and Performance Characteristics of Lean Burn Natural Gas Engines through Partial Stratification. Int. J. Engine Res. 2004, 5, 105–114. [Google Scholar] [CrossRef]
  15. Yan, B.; Tong, L.; Wang, H.; Zheng, Z.; Qin, Y.; Yao, M. Experimental and numerical investigation of the effects of combustion chamber reentrant level on combustion characteristics and thermal efficiency of stoichiometric operation natural gas engine with EGR. Appl. Therm. Eng. 2017, 123, 1473–1483. [Google Scholar] [CrossRef]
  16. Johansson, B.; Olsson, K. Combustion Chambers for Natural Gas SI Engines Part I: Fluid Flow and Combustion, Lund Institute of Technology. J. Fuels Lubr. 1995, 104, 374–385. [Google Scholar]
  17. Reyes, M.; Tinaut, F.V.; Giménez, B.; Pérez, A. Characterization of cycle-to-cycle variations in a natural gas spark ignition engine. Fuel 2015, 140, 752–761. [Google Scholar] [CrossRef]
  18. Ben, L.; Raud-Ducros, N.; Truquet, R.; Charnay, G. Influence of Air/Fuel Ratio on Cyclic Variation and Exhaust Emission in Natural Gas SI Engine. In Proceedings of the SAE Future Transportation Technology Conference & Exposition, Costa Mesa, CA, USA, 17–19 August 1999; p. 10. [Google Scholar]
  19. Singha, E.; Morgantib, K.; Dibblea, R. Dual-fuel operation of gasoline and natural gas in turbocharged engine. Fuel 2019, 237, 694–706. [Google Scholar] [CrossRef]
  20. Kutlar, O.A. A New Method to Decrease The Fuel Consumption at Part Load Conditions of Four Stroke Otto Cycle (Rochas) Engine. Ph.D. Thesis, Istanbul Technical University, Istanbul, Turkey, 2013. [Google Scholar]
  21. Tekeli, Ö. Designing and Production Ignition and Injection Units of a Gasoline Engine with Skip Cycle. Master’s Thesis, Istanbul Technical University, Istanbul, Turkey, 2013. [Google Scholar]
  22. Europian Commission. Technical and General Requirements Relating to Emission Limits and Type-Approval for Internal Combustion Engines for Non-Road Mobile Machinery (EU 2016/1628). Available online: https://eur-lex.europa.eu/legal-content/EN/TXT/?uri=CELEX:32016R1628 (accessed on 4 October 2019).
  23. Heywood, J.B. Internal Combustion Engine Fundamentals; McGraw-Hill Education: New York, NY, USA, 1988. [Google Scholar]
  24. Amirante, R.; Distaso, E.; Paolo Tamburrano, P.; Reitz, R.D. Laminar flame speed correlations for methane, ethane, propane and their mixtures, and natural gas and gasoline for spark-ignition engine simulations. Int. J. Engine Res. 2017, 18, 951–970. [Google Scholar] [CrossRef]
  25. Gary, M.; Ravikrishna, R.V. In-cylinder flow and combustion modeling of a CNG-fuelled stratified charge engine. Appl. Therm. Eng. 2019, 149, 425–438. [Google Scholar]
  26. Liu, J.; Dumitrescu, C.E. Flame development analysis in a diesel optical engine converted to spark ignition natural gas operation. Appl. Energy 2018, 230, 1205–1217. [Google Scholar] [CrossRef]
  27. Brequignyi, P.; Halter, F.; Mounaim- Rousselle, C.; Dubois, T. Fuel Performence of Spark Ignition (SI) Engines: Impact of Flame Stretch. Combust. Flame 2016, 166, 98–112. [Google Scholar] [CrossRef]
  28. Lee, K.; Ryu, J. An experimental study of the flame propagation and combustion characteristics of LPG fuel. Fuel 2005, 84, 1116–1127. [Google Scholar] [CrossRef]
  29. Brunt, M.F.J.; Emtage, A.L. Evaluation of IMEP Routines and Analysis Errors. J. Engines 1996, 105, 749–763. [Google Scholar]
  30. Christine, B.; Bargende, M. Thermoschockkorrektur bei Druckindizierungen mit Zünd-und Glühkerzenadaptern (Thermoshock correction when indicating the cylinder pressure with spark and glow plug adapters). MTZ Motortechnische Zeitschrift 1995, 56, 736–741. [Google Scholar]
Figure 1. Antor 3LD450 single cylinder research engine.
Energies 12 04432 g001
Figure 2. NO emission for both fuels according to g/kWh unit.
Energies 12 04432 g002
Figure 3. NO emission for gasoline and compressed natural gas (CNG), n = 2000 rpm.
Energies 12 04432 g003
Figure 4. Coefficient of variation (COV) value for net indicated mean effective pressure.
Energies 12 04432 g004
Figure 5. Change of the spark advance with respect to break mean effective pressure (BMEP) and relative air/fuel ratio.
Energies 12 04432 g005
Figure 6. Changes of spark advance with respect to BMEP and relative air/fuel ratio.
Energies 12 04432 g006
Figure 7. Determination of first sensible positive heat release location (start of combustion).
Energies 12 04432 g007
Figure 8. Ignition delay duration for both fuels, n = 1500 rpm.
Energies 12 04432 g008
Figure 9. Ignition delay duration for both fuels, n = 2000 rpm.
Energies 12 04432 g009
Figure 10. Ignition delay for both fuels by different criteria.
Energies 12 04432 g010
Figure 11. Heat release rate in the stoichiometric mixture for both fuels.
Energies 12 04432 g011
Figure 12. Heat release rate in the ultra-lean mixture for both fuels.
Energies 12 04432 g012
Figure 13. Burn duration (5–90%) for CNG and gasoline at 1500 rpm.
Energies 12 04432 g013
Figure 14. Burn duration vs. relative air/fuel ratio for CNG and gasoline at 1500 rpm.
Energies 12 04432 g014
Figure 15. Burn duration vs. relative air/fuel ratio for both fuels at 2000 rpm.
Energies 12 04432 g015
Table 1. Specifications of research engine.
Engine Specification
Engine nameAntor 3LD450
Cylinder number1
FuelGasoline, CNG
Compression ratio12
Engine volume, ml454
Bore, mm85
Stroke, mm80
Fuel systemElectronically controlled, PFI
Ignition systemElectronically controlled, spark ignition
ChargingNaturally aspirated
Table 2. Properties of natural gas and gasoline.
FuelLow Heating Value, kJ/kgAir/Fuel Ratio at Stoichiometric Mixture, kg air/kg fuelLow Heating Value of Mixture (λ = 1), kJ/kg mixtureHydrogen/Carbon Ratio
Natural gas49,00016.82752.83.9
Gasoline44,00014.62820.51.85
Table 3. Uncertainties of experimental measurements and calculations.
ParameterMeasurement DeviceSourceAccuracy or Uncertainty
Spark advanceEncoderFitting uncertainty±0.1° CA
Engine torqueEddy current dynamometerCalibration error±1.0%
Engine speedSpeed sensorEngine speed fluctuation±1.0%
Fuel consumption (gasoline)AVL Fuel balanceCalibration error±0.1%
Fuel consumption (CNG)Radwag WLC 60/C2/KRepeatability±1 g
In cylinder pressureAVL GU21DIMEP Stability<3%
Cyclic temperature drift<±0.5 bar
Exhaust emissionsHoriba Mexa 7500Calibration error<2%
Table 4. Experiment matrix.
FuelEngine Speed, rpmBMEP, barRelative Air/Fuel Ratio
Gasoline CNG1500–20003–51
1.2
1.4
1.6
1.7 *
* This condition was tested only by CNG.

