Abstract
This paper proposes an Adaptive Rule-Based Energy Management Strategy (ARBS EMS) for a parallel hybrid electric vehicle (HEV). The aim of the strategy is to facilitate the aftermarket hybridization of medium- and heavy-duty vehicles. ARBS can be deployed online to optimize fuel consumption without any detailed knowledge of the engine efficiency map of the vehicle or the entire duty cycle. The proposed strategy improves upon the established Preliminary Rule-Based Strategy (PRBS), which has been adopted in commercial vehicles, by dynamically adjusting the regions of operations of the engine and the motor. It prevents the engine from operating in highly inefficient regions while reducing the total equivalent fuel consumption of the vehicle. Using an HEV model developed in Simulink®, both the proposed ARBS and the established PRBS strategies are compared over an extended duty cycle consisting of both urban and highway segments. The results show that ARBS can achieve high MPGe with different thresholds for the boundary between the motor region and the engine region. In contrast, PRBS can achieve high MPGe only if this boundary is carefully established from the engine efficiency map. This difference between the two strategies makes the ARBS particularly suitable for aftermarket hybridization where full knowledge of the engine efficiency map may not be available.
1. Introduction
A hybrid electric vehicle (HEV) typically refers to a vehicle with an internal combustion engine, an electrical motor and an onboard electric energy storage which are operated according to an energy management strategy (EMS). The electric energy storage can be a battery or a supercapacitor. Supercapacitors have 10 to 100 times larger power density than batteries [1]. However, batteries are more popular in HEVs because of their higher energy density. In fact, batteries can store up to 30 times more charge than supercapacitors [2]. An analysis of energy management strategies for HEVs that include an internal combustion engine and a supercapacitor is provided in [3]. The focus of this study is on the optimization of energy management in HEVs where the source of electric energy is a battery. This choice was primarily motivated by the availability and the popularity of batteries as an electric energy source in current HEVs especially in the context of aftermarket hybridization.
Compared to conventional vehicles, HEVs produce significantly less pollutants and use less fuel [4]. In fact, due to increasing greenhouse emission restrictions, many light and heavy-duty vehicle manufacturers launched several hybrid electric models. For example, in 2015 around 384,000 and 633,000 hybrid units were sold in the US [5] and Japan [6], respectively. In response to this growing market, new technologies were also developed to help enhance fuel economy in HEVs. For instance, a parallel HEV equipped with an automatic dry clutch and a hierarchical control to regulate the engine start was introduced in [7]. An adaptive cruise control system for HEVs was also proposed in [8].
An important aspect of fuel economy in HEVs is the energy management strategy (EMS). The objective of the EMS is to efficiently use the two sources of energy available in the HEV, namely the engine and the electric motor. These EMS strategies broadly fall under two categories: optimization-based (OBS) and rule-based (RBS) [9].
The OBS category relies on several optimization techniques including dynamic programming (DP) [10], particle swarm optimization (PSO) [11] and the equivalent consumption minimization strategy (ECMS) [12]. When the DP technique is used, the problem is discretized over time into a sequence of optimization sub-problems. To obtain a global optimum, these sub-problems are then solved by using backward induction. Because it uses backward induction, this technique requires a priori knowledge of the entire duty cycle to optimize fuel economy in HEVs. PSO also needs full a priori knowledge of the entire duty cycle. When PSO is used as the optimization technique, the objective function is the total fuel consumed. Particles represent potential solutions that optimize the objective function and these solutions are updated at each iteration of PSO according to the current best fuel economy solution for each particle as well as the current best global fuel economy solution across all particles.
The third OBS technique, ECMS, tries to overcome the limitation imposed by the a priori knowledge of the entire duty cycle underlying the DP and PSO techniques by converting the global optimization problem into a local problem. The global objective function is transformed into a local optimization problem by including a fuel equivalent cost for use of the battery. ECMS can be implemented online. However, establishing the fuel equivalent cost factor for the conversion of the battery usage into equivalent fuel cost requires substantial calibration for this approach to generate optimal solutions. Moreover, the resulting solutions are often duty cycle-specific [13].
The second category of EMS strategies is the RBS category. The RBS strategies are computationally more efficient than the OBS strategies and therefore can be easily implemented online. One of the most widely adopted rule-based EMS is the preliminary rule-based strategy (PRBS) which was introduced in [14,15]. PRBS is based on the engine efficiency map of the vehicle and is powertrain-specific. The fuzzy rule-based strategy (FRBS) [16] is another RBS technique that is not specific to a given powertrain. However, while still practical for online deployment, it is computationally more complex than PRBS.
In general, RBS is the EMS strategy of choice for commercial applications. This energy management strategy has been successfully implemented in various commercial vehicles including the Toyota Prius [17]. It is computationally efficient and does not rely on the knowledge of the entire duty cycle. However, it still may require extensive, engine efficiency map-specific tuning by experts and its optimality may not be guaranteed. In contrast, OBS can be optimal but may not be suitable for online deployment because of its computational complexity. Hybrid strategies that leverage the characteristics of these two categories where an OBS approach is used to inform an RBS online implementation have been proposed in the literature. For example, DP, support vector machines and neural networks have been adapted to a rule-based online implementation in [10,18,19], respectively.
This paper proposes a rule-based EMS strategy, named Adaptive Rule-Based Strategy (ARBS), which dynamically modifies the PRBS rules to maintain the battery state of charge around a predefined reference value. The proposed strategy does not require extensive tuning, can be implemented online, takes into consideration extended travel distances and does not depend on detailed knowledge of the operational specifications of the engine. These characteristics make the proposed approach competitive when compared to current RBS strategies especially for aftermarket hybridization of vehicles.
Section 2 describes the HEV model that is used to analyze the performance of the EMS strategies. Section 3 introduces the proposed ARBS strategy and compares it to the current state-of-the-art PRBS rule-based strategy. Section 4 discusses the performance of ARBS when applied to a mixed urban and highway duty cycle. Finally, Section 4 summarizes the findings of this study and outlines direction for future work.
2. HEV Model
To evaluate the performance of the proposed EMS strategy, a vehicle model is needed. The vehicle model used in this paper is physics-based and was adapted from [20,21]. It includes modules implemented in Simulink® for the engine, transmission, vehicle road load, battery and driver.
The main characteristics of the target HEV used in this study are summarized in Table 1. The vehicle includes a 6-speed automatic transmission and a diesel engine that can deliver a maximum power of 321.44 kW. The battery is a 48 V lithium ion battery and the accessory load is set to a constant value of 3 kW.

Table 1.
Vehicle Characteristics.
2.1. Notation
The main parameters used in the EMS strategies are summarized in Table 2.
Table 2.
Definition of EMS parameters.
2.2. Engine Model
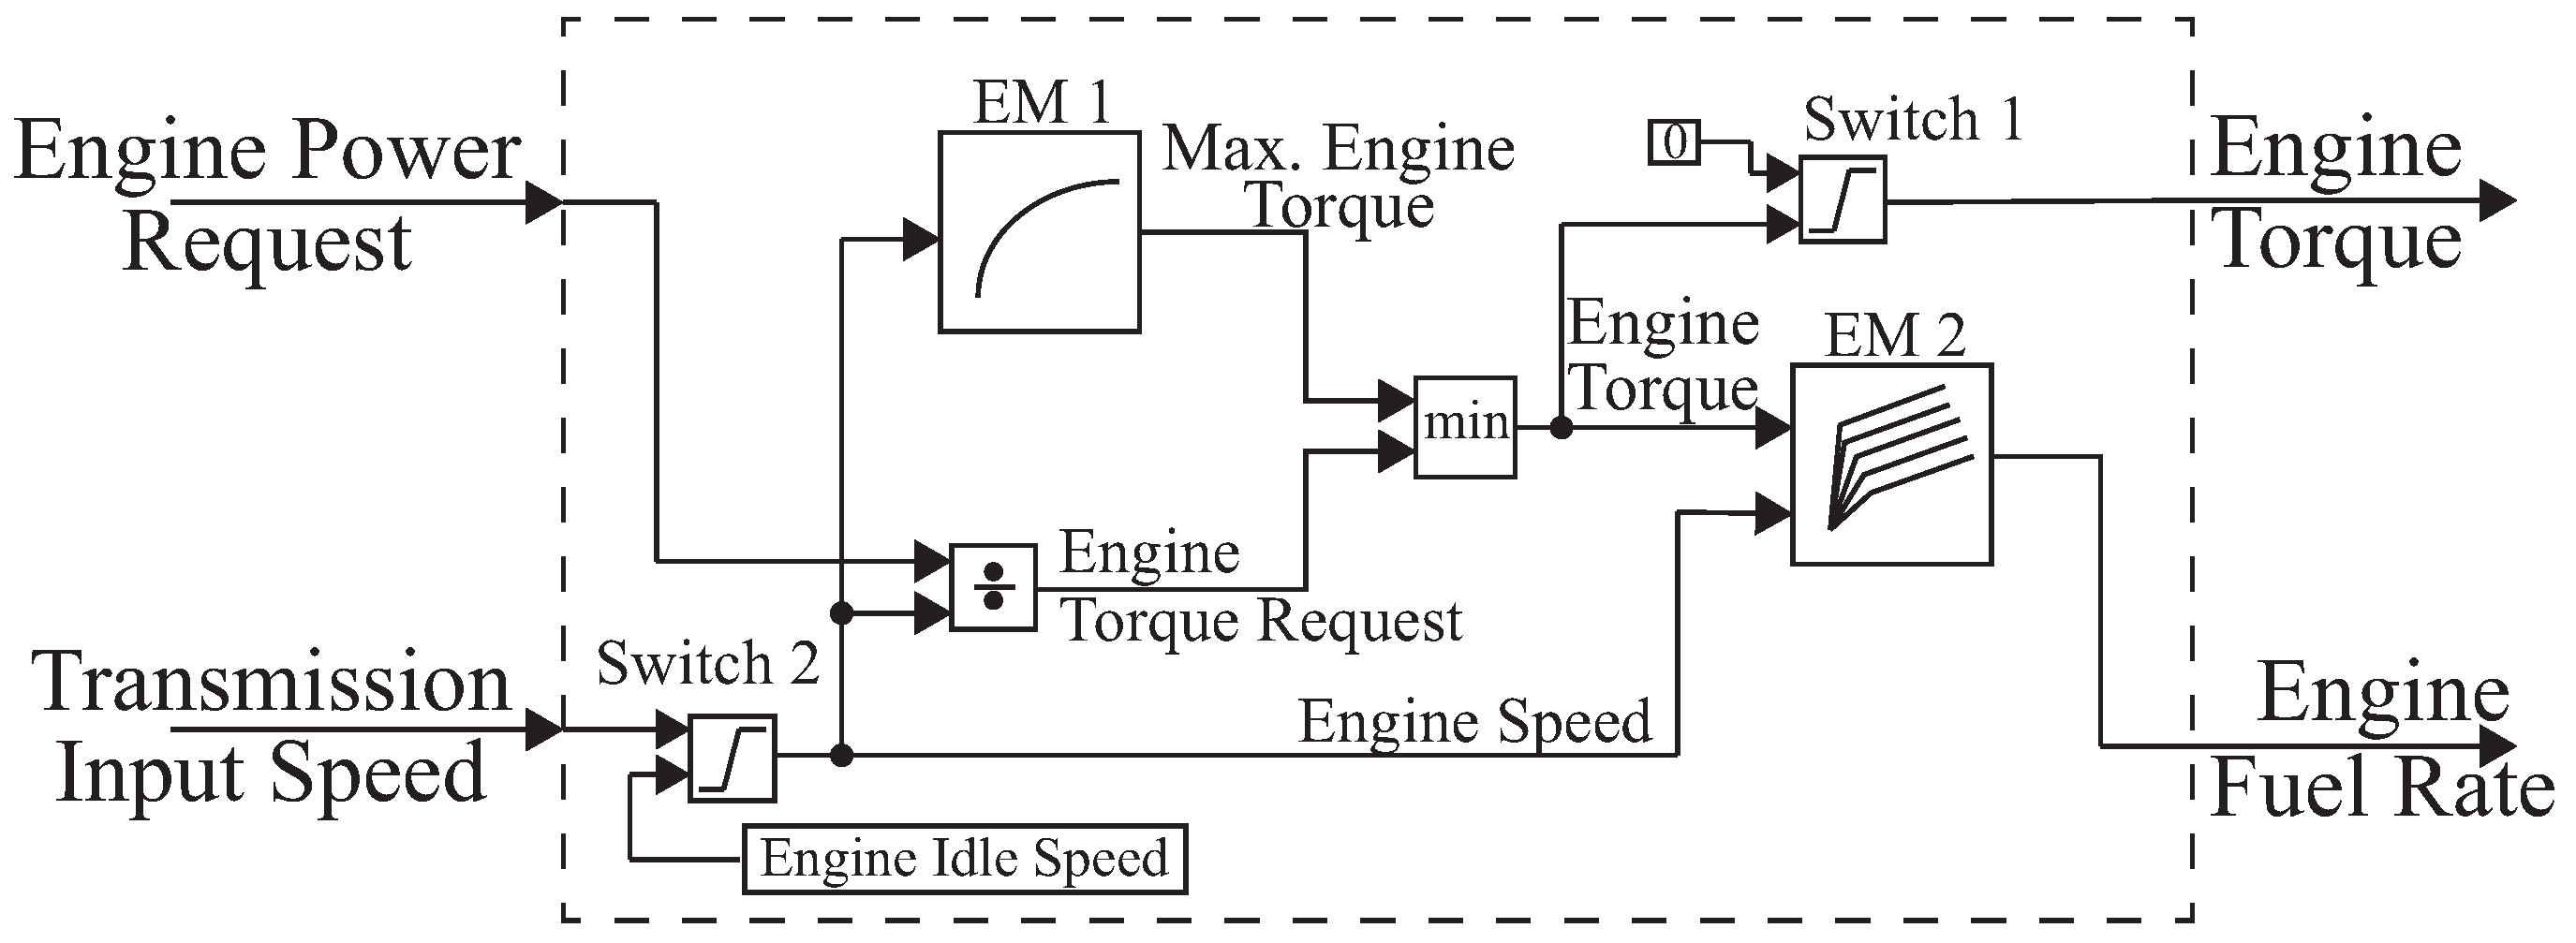
The Engine (Figure 1) is modeled following the approach described in [22,23] as a combination of two engine maps, EM1 and EM2. The inputs of the model consist of the engine power request () and the transmission input speed. The outputs are the engine torque and the engine fuel rate.

Figure 1.
Engine model.
EM1 defines the maximum engine torque curve. It is used to limit the engine torque request derived from the engine speed and the engine power request. EM2 defines the engine fuel rate as a function of the engine speed and the engine torque. These engine maps represent the operational specifications of the engine and are measured during performance testing of the engine.
In addition to the above two engine maps, the engine model also emulates the behavior of the torque converter clutch () by using two switches (Figure 1). Switch 1 forces the engine propulsion torque to zero and switch 2 holds the engine speed constant when the engine is in the idle state. When combined, the engine maps and the logic for the replicate the expected operational behavior of the engine.
2.3. Transmission Model
The transmission model (Figure 2) consists of two components: a constant gain block and a transmission gear box. The constant gain block represents the average efficiency of the transmission and the driveline. According to [24], drivetrain losses are between 8% and 12%. In this study, losses were set to 12% to evaluate the proposed EMS strategy under low transmission efficiency scenarios which may be consistent with aftermarket hybridization.

Figure 2.
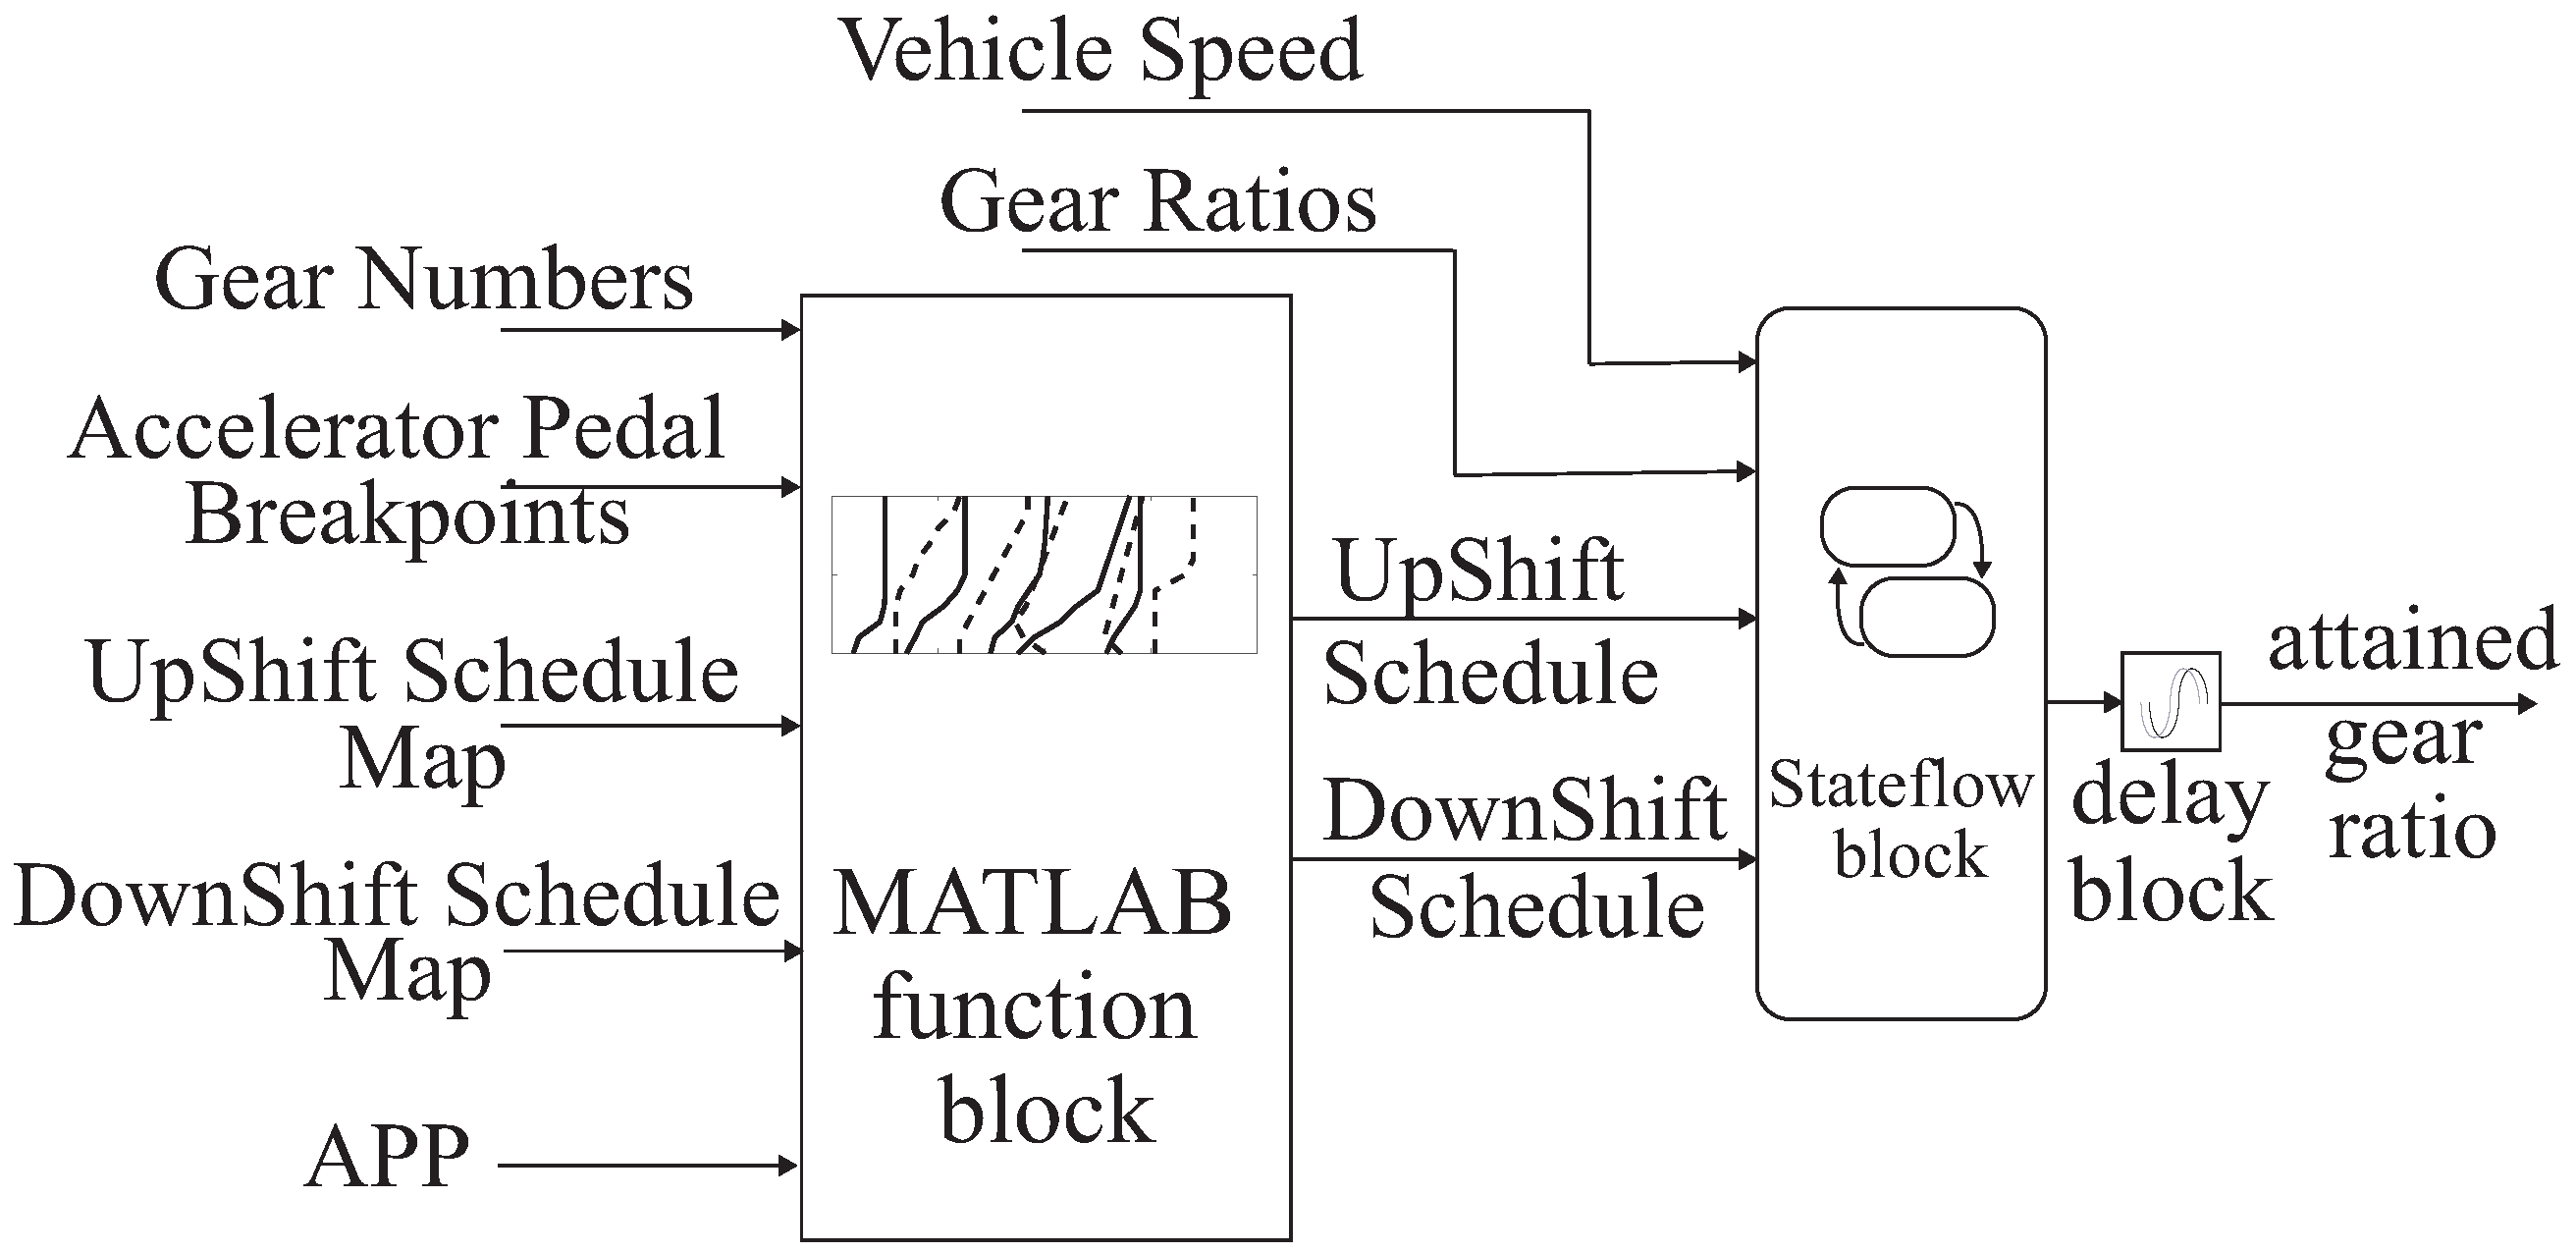
Transmission gear box model.
The transmission gear box selects the gear based on the transmission shift schedule maps. For this study, both the transmission shift schedule maps and the gear ratios (Figure 2) were extracted from data which was collected from a vehicle that has the same transmission as the target HEV vehicle described in Table 1.
Following the approach described in [25], the transmission gear box selects the gear transition boundaries for all the gears based on the current driver accelerator pedal position () and the transmission shift schedule maps. The stateflow block receives this boundary information and selects the appropriate gear based on the current vehicle speed.
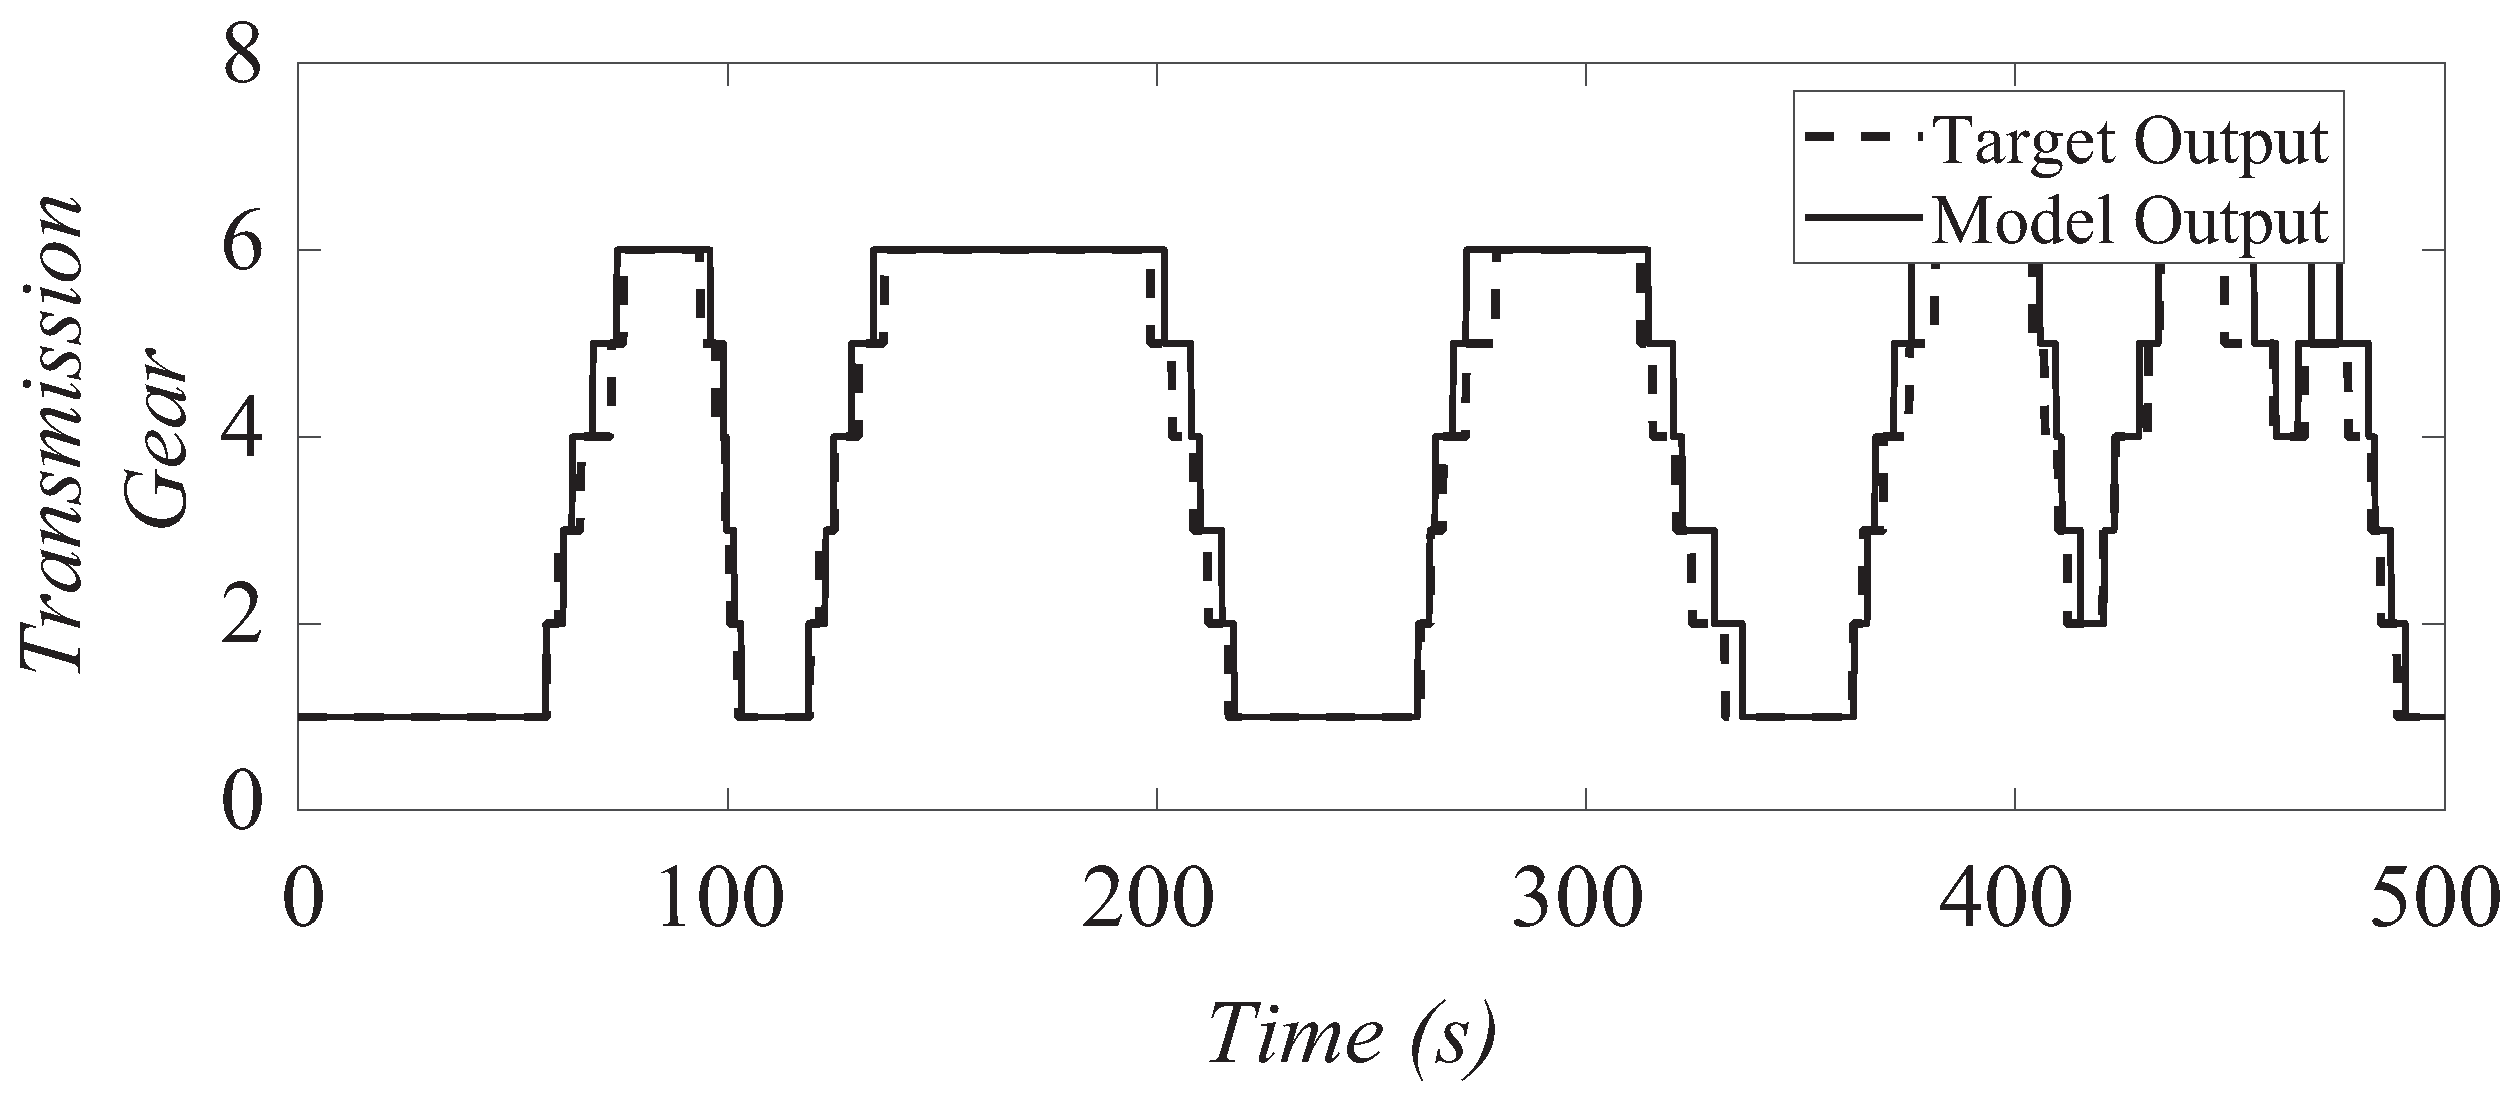
The transmission model was validated using the duty cycle which is described in Section 4. The error (1) between the predicted and the actual gear for this duty cycle is 5.7%. A sample comparison of the predicted and the actual gear for a period of 500 s. is shown in Figure 3.
where is the target output, is the corresponding model output and S is the number of samples. and represent the maximum and minimum of over all the samples, respectively.
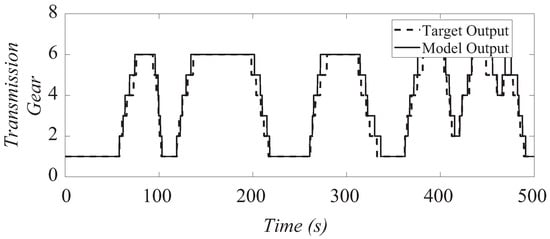
Figure 3.
Output of the transmission gear box model versus the actual gear over a sample period of 500 s.
2.4. Vehicle Roadload Model
The vehicle roadload model simulates the interaction between the vehicle and the road. The model generates vehicle speed by taking into account the force produced by the engine and the battery as well as the external forces acting on the vehicle. According to [26], the total vehicle roadload dynamics can be described as follows:
where is the aerodynamic drag coefficient which is determined empirically for each vehicle [27], corresponds to the air density, v is the vehicle speed, A is the frontal area of the vehicle, N is the normal component (i.e., with respect to ground) of the weight force on the wheels, is the coefficient of rolling resistance, is the road grade, g is the gravitational constant and is the mass of the vehicle. Table 3 summarizes the values of the constant parameters used in (2) for this study.
Table 3.
Roadload model parameters.
The roadload model was validated using the duty cycle mentioned above. The error as defined in (1) between the predicted and simulated vehicle speed for this duty cycle is 3.8%. Figure 4 depicts the actual and simulated vehicle speeds for a sample period of 500 s.
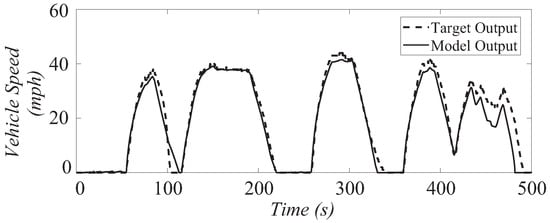
Figure 4.
Simulated versus actual vehicle speed over a sample period of 500 s.
2.5. Battery Model
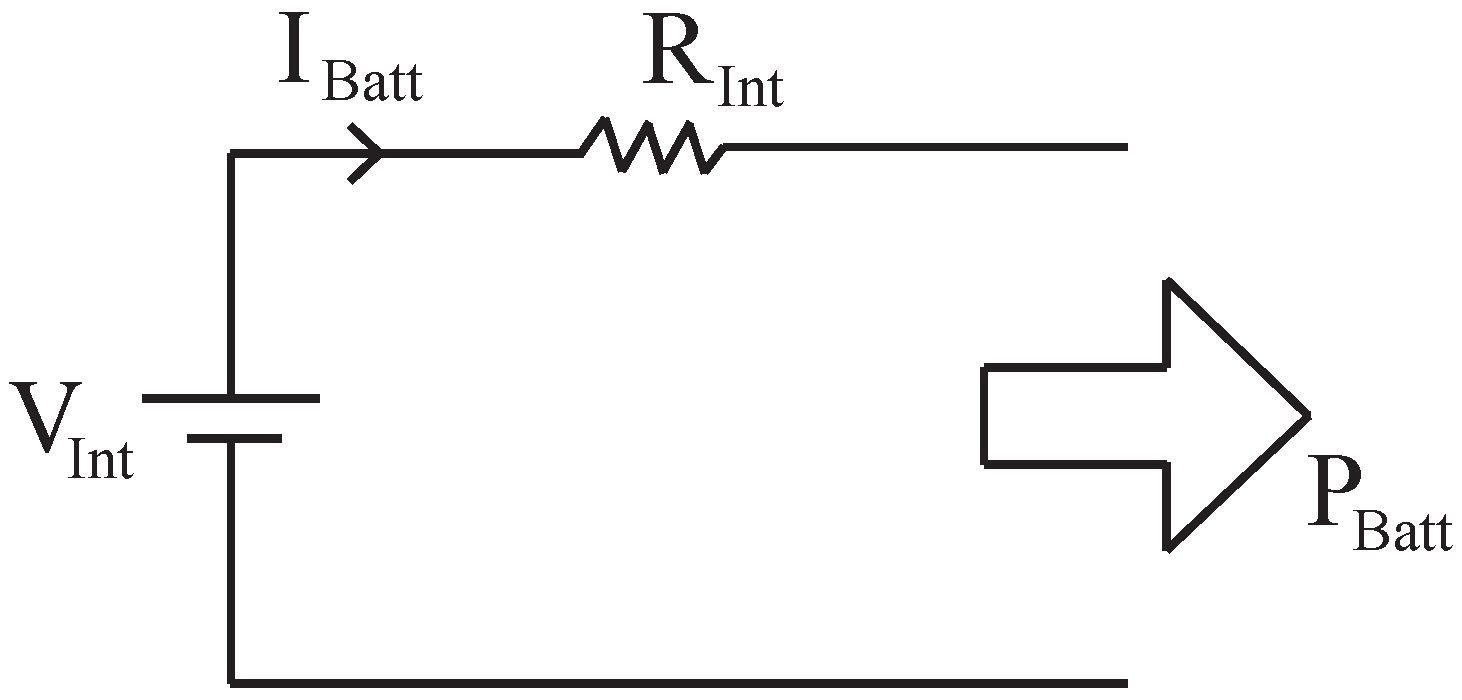
The battery pack in the HEV is modeled as a combination of series and parallel cell batteries. The circuit used to model a single cell battery is shown in Figure 5.
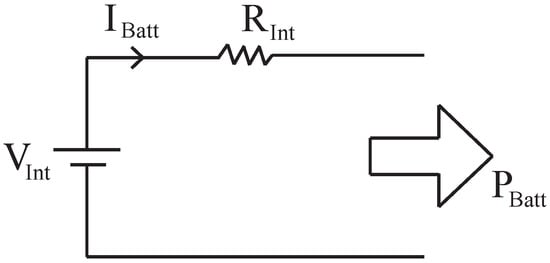
Figure 5.
Battery cell model.
The battery discharging current is assumed to be positive in the remainder of the paper. As a result, the battery discharging power is also assigned a positive value. Therefore, if the battery is discharging, both the battery power () and the battery current () have positive values. In addition to delivering power to the vehicle, the battery can also absorb power () from the vehicle during regenerative braking. Since the battery is charging during regenerative braking, the regenerative power () takes on negative values.
According to [28], the battery current during discharge is given by:
where and are the battery internal voltage and resistance, respectively. The battery current when charging is negative and follows the same definition in (3) with replacing .
The state of charge () of the battery represents the amount of energy left in the battery. As defined in [28], the relationship between and is given by the coulomb counting differential equation shown below:
where is the total capacity of the battery.
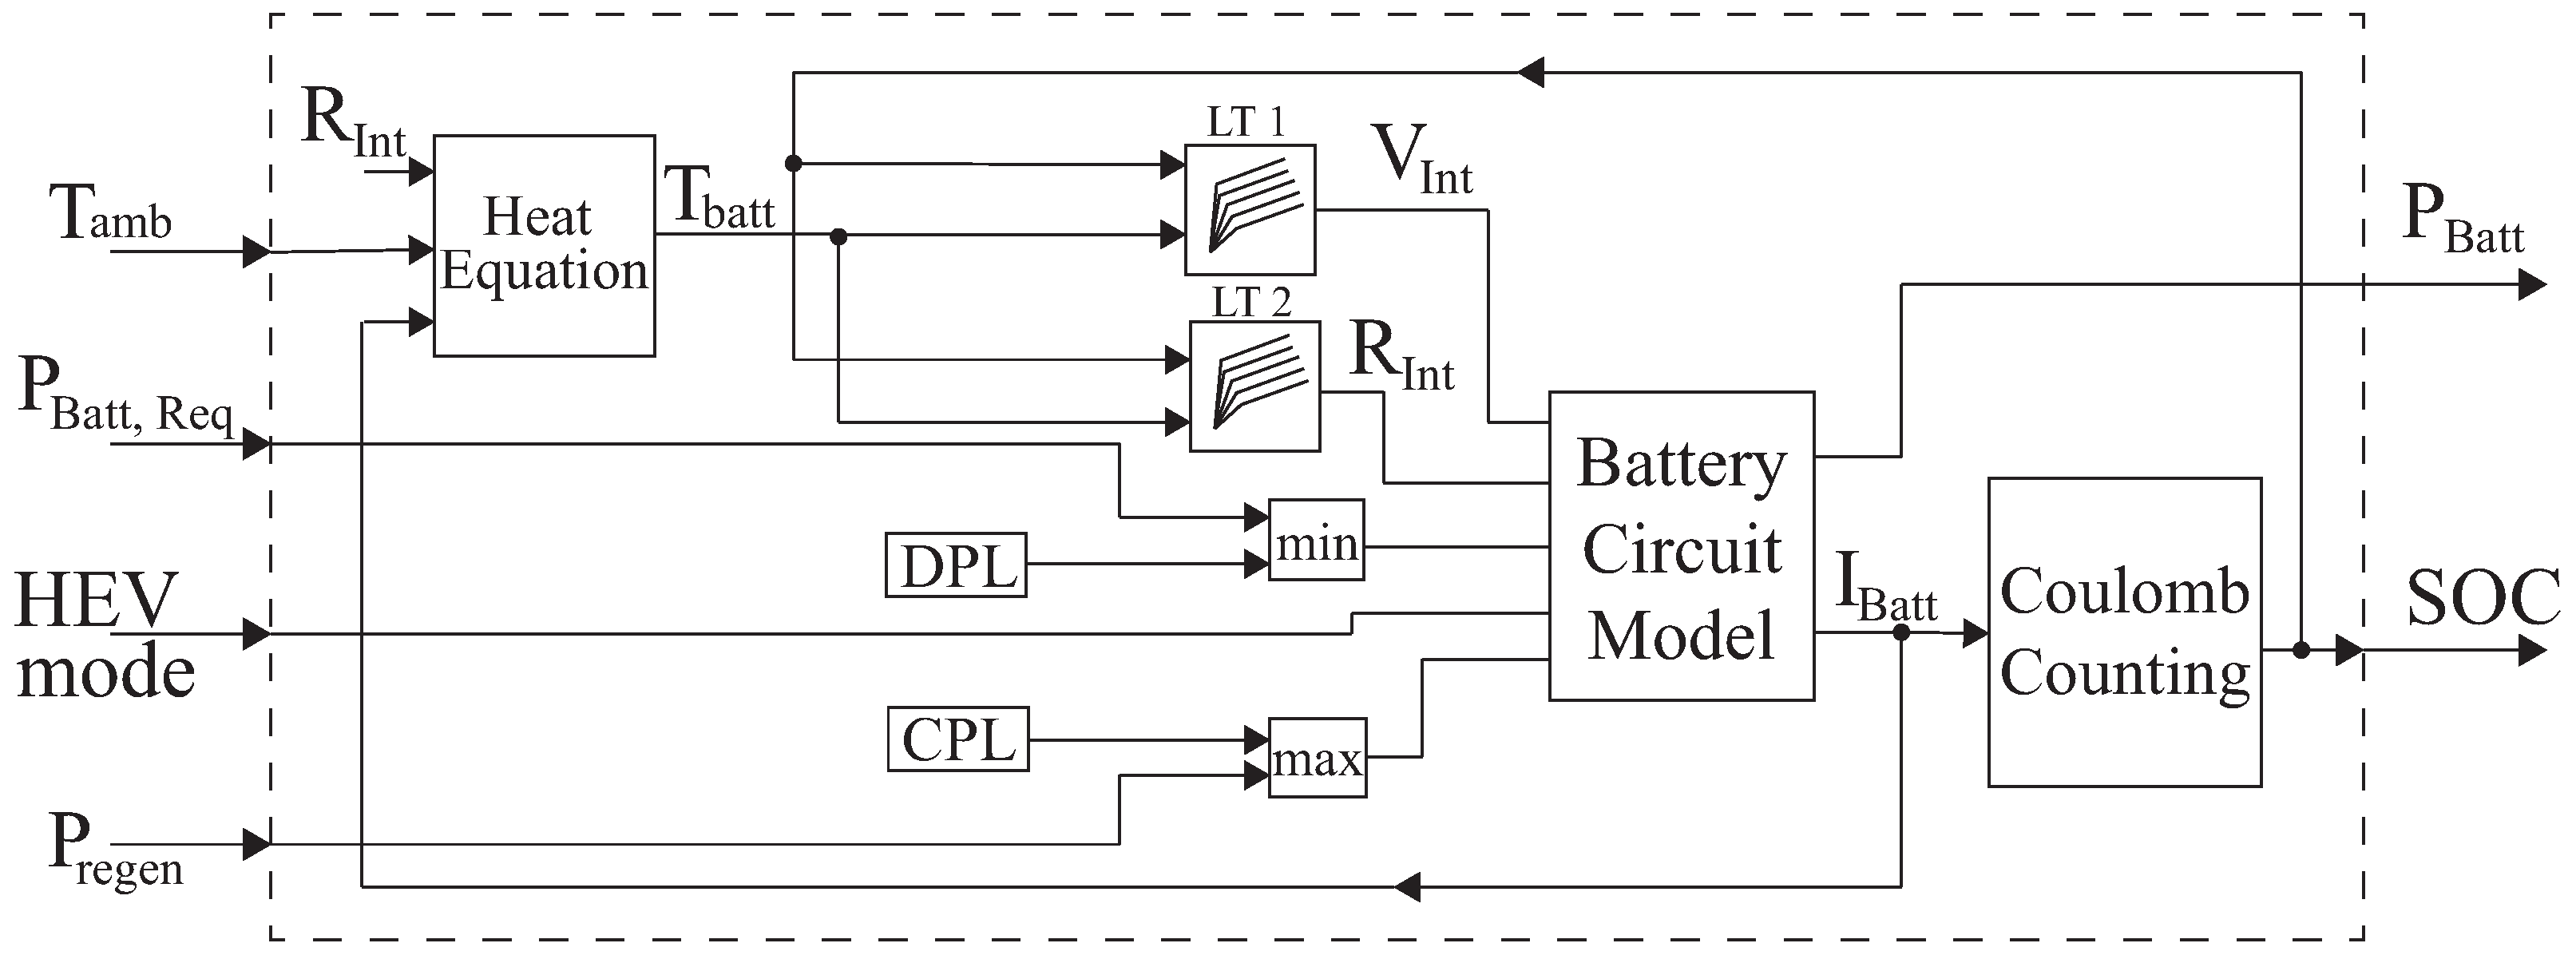
The internal parameters, and of the battery vary with different levels of and battery temperature (). In the battery model, these relationships are represented by two look-up tables: LT1 and LT2 which define and as a function of and , respectively. These tables are derived by using numerical parameter estimation from experimental data collected during pulse current discharge tests on a high-power lithium cell as described in [29]. Moreover, the battery temperature () varies with the ambient temperature () and the heat generated in the battery. This variation is modeled by using the heat transfer equation (5) defined in [29] which establishes the relationship between the change in , the heat capacity of the cell and the heat generated in .
where is the heat capacity of the cell, is the heat exchange coefficient of the battery obtained from [29] and is kept constant.
The integrated battery model is shown in Figure 6. Since high battery currents can lead to extreme battery temperatures, the values of charging power limit (CPL) and discharging power limit (DPL) are used to limit the current in the battery and consequently control the temperature of the battery.
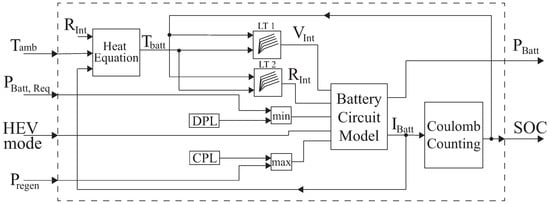
Figure 6.
Battery model. The indicates whether the battery is charging or discharging.
In this paper, a 48 V battery system was selected to cost-effectively meet the constraints of aftermarket hybridization. The 48 V batteries are used in both mild HEVs [30] as well as full hybrid vehicles [31]. Adding a 48 V battery, as opposed to a high voltage battery, to a conventional vehicle can help reduce fuel consumption and meet strict emission regulations [32] while maintaining cost within an acceptable range for aftermarket hybridization.
2.6. Driver
The aim of the driver model is to ensure that the vehicle model follows a specific duty cycle. The inputs of the model (Figure 7) are the current vehicle speed , the target vehicle speed and the road grade . Using these inputs, the driver model generates and the brake pedal position ().
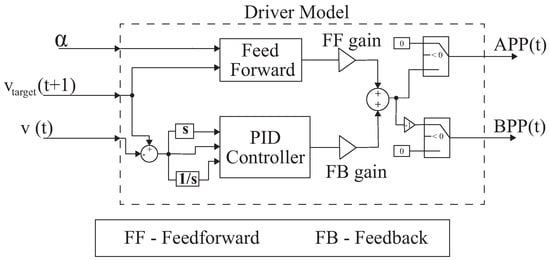
Figure 7.
Driver model.
The driver model consists of two controllers. The first, is a feedforward controller that generates the current pedal positions and according to the target vehicle speed . The second controller is a feedback controller which measures the error between and . As shown in Figure 7, the feedforward and the feedback controllers are regulated by the gain factors and , respectively.
3. Rule-Based Energy Management Strategy
An EMS is necessary for an HEV to supply the desired vehicle power, , at the wheels. The role of the EMS is to efficiently split into a request for engine power, and a request for battery power, . The split always adheres to the following relation:
The parameters used to describe the two EMS strategies discussed in this paper are summarized in Table 2. Moreover, for both EMS strategies, we make the simplifying assumption that the accessory load is a constant (Table 1) which is added to the desired vehicle power .
In this section, we first review the approach used by the PRBS strategy [14] to split the desired vehicle power into engine power and battery power. This approach is then compared to the split approach of the proposed ARBS.
3.1. Preliminary Rule-Based Strategy
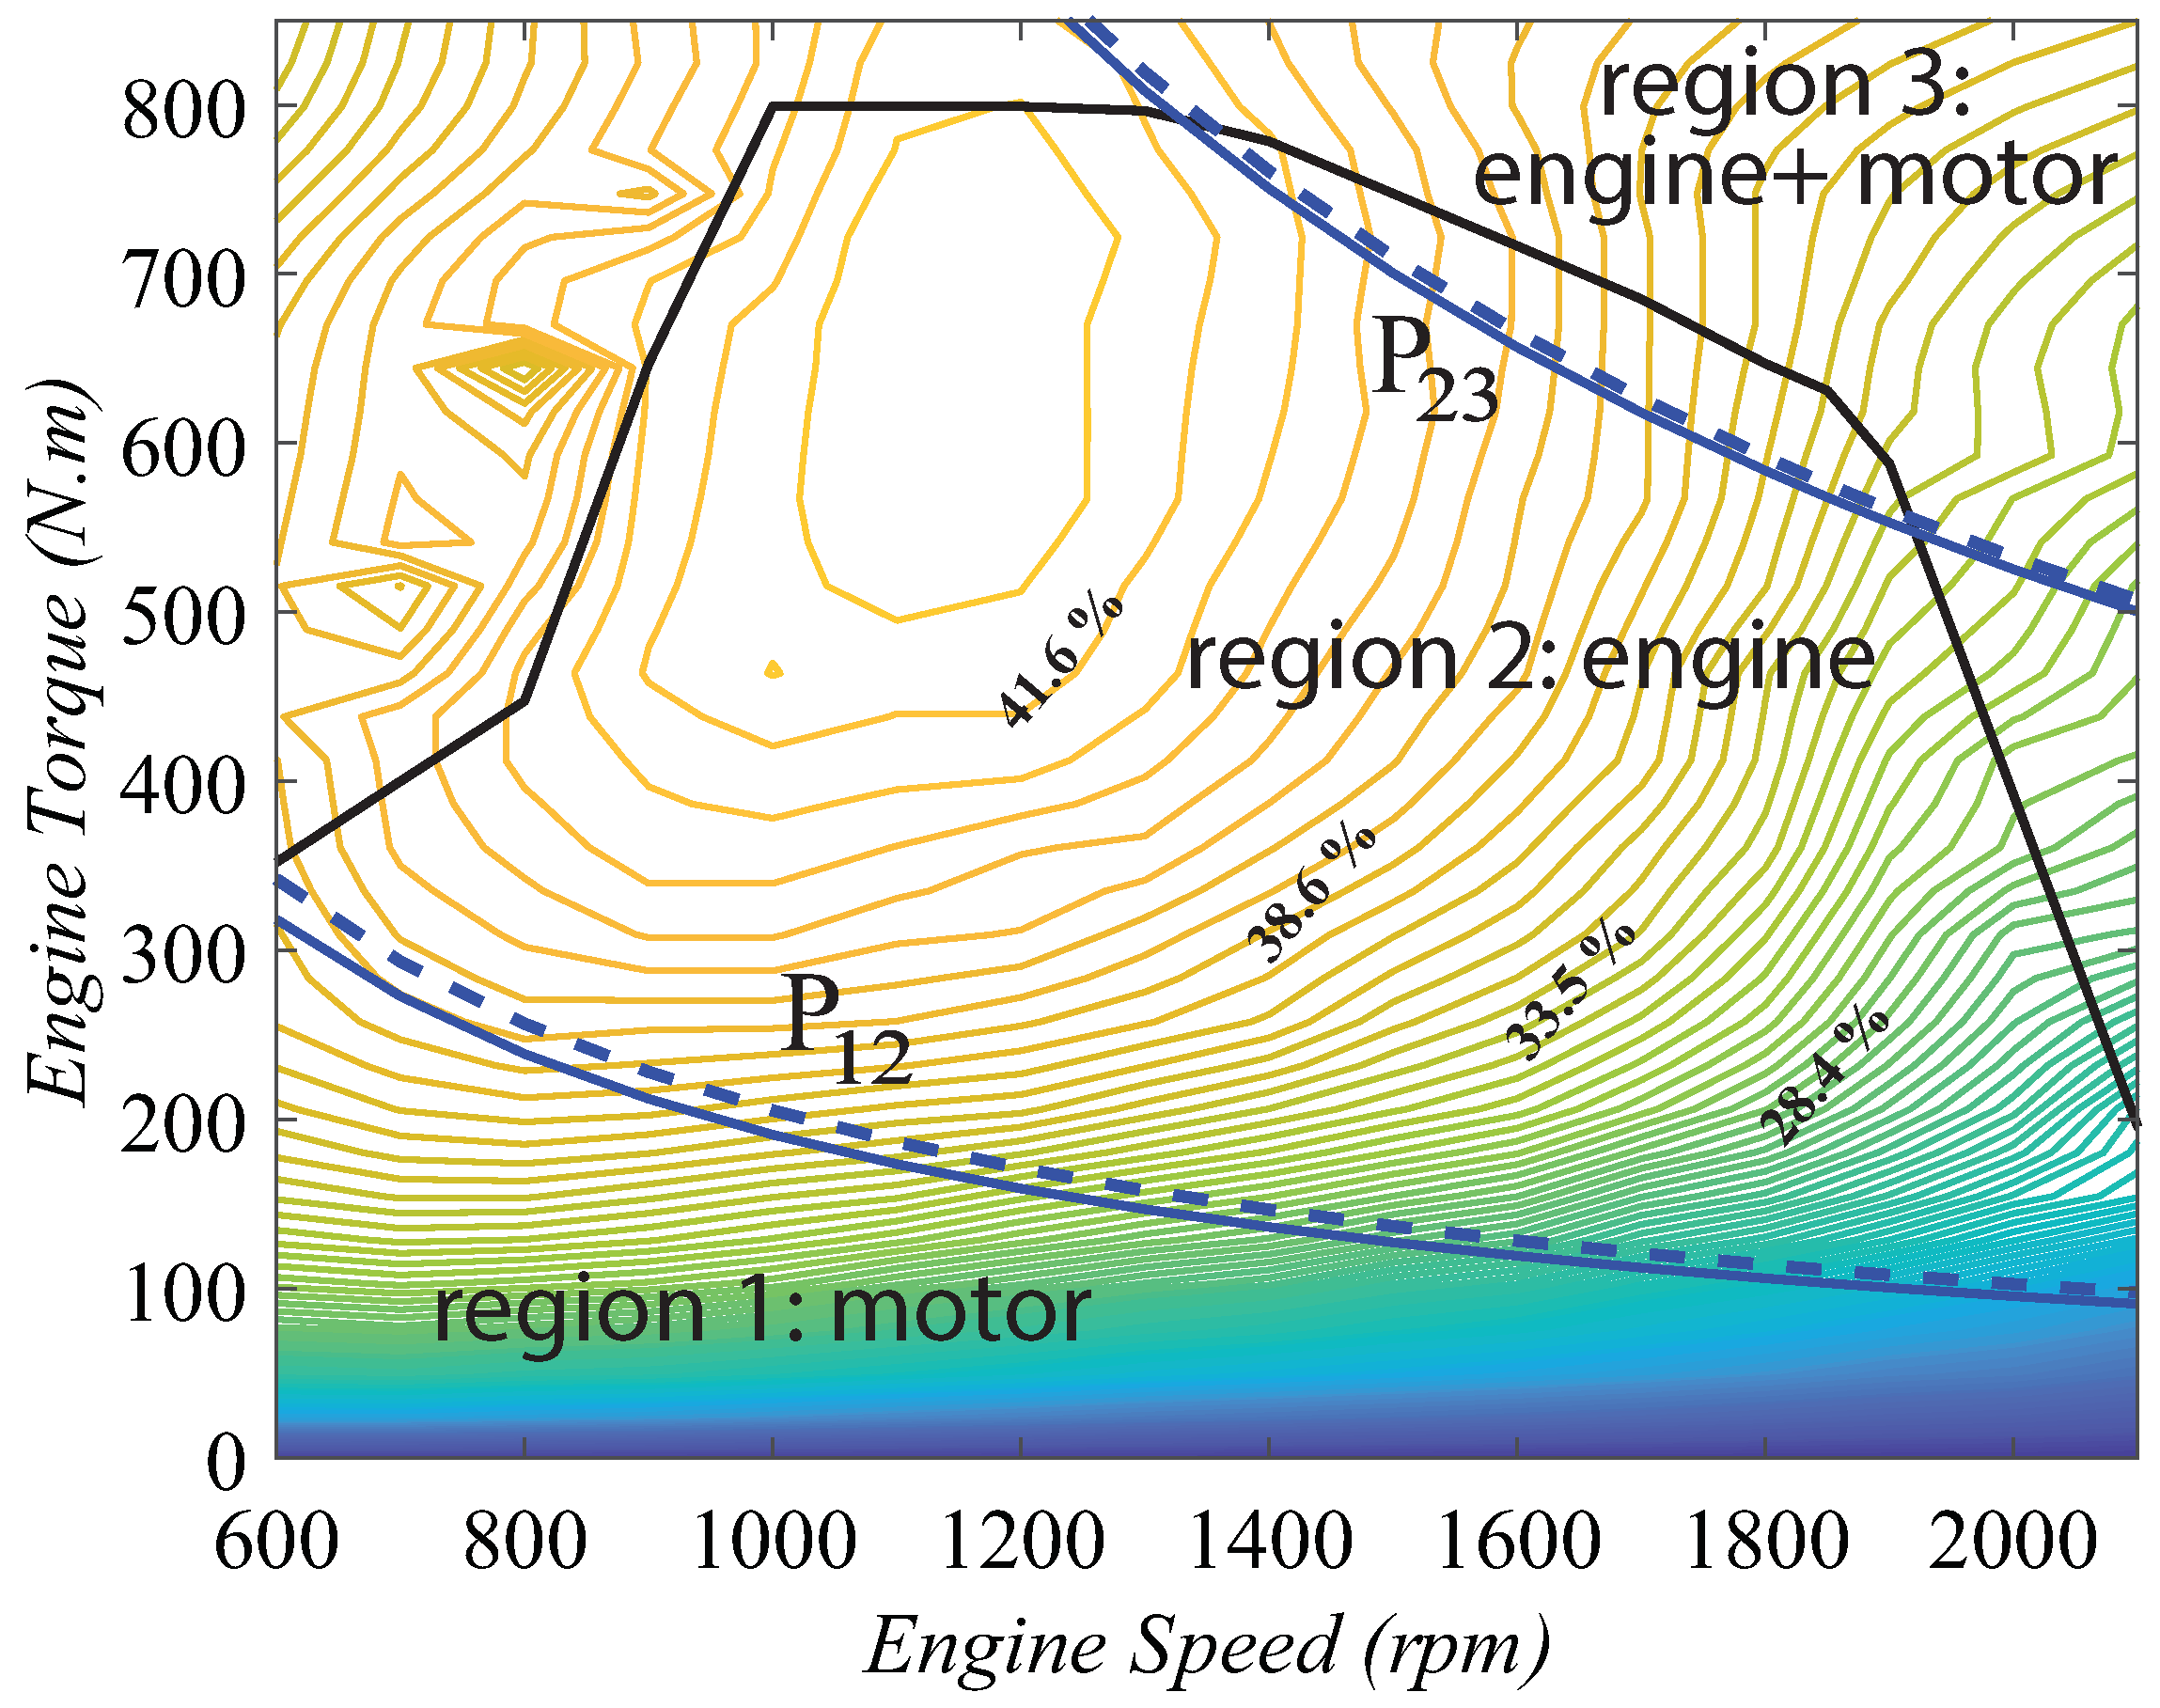
The RBS strategy was initially introduced in 1997 [33]. Subsequently, a PRBS strategy for a parallel hybrid heavy-duty truck was proposed in [14]. The PRBS strategy relies on the efficiency map of the target engine which consists of three operating regions as shown in Figure 8. In the motor region (region 1), only the battery provides the propulsion power. Similarly, in the engine region (region 2) only the engine supplies the power to the vehicle. The engine + motor region (region 3) represents the case when both the engine and the battery provide propulsion power. The power values and define the boundaries between operating regions 1 and 2 and operating regions 2 and 3, respectively. Typically, these values are determined experimentally with the purpose of constraining the engine to high efficiency operating levels.
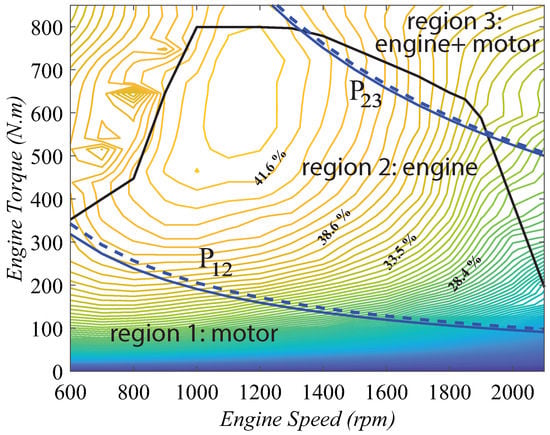
Figure 8.
Engine efficiency map with the three operating regions used in the PRBS strategy. The dashed curves represent the margin for and as the vehicle switches from one region to another. The solid black line is the maximum torque curve of the engine. The percentages represent the efficiency of the engine.
The PRBS strategy is implemented in a controller. At any time during the operation of the vehicle, and are fed to the PRBS controller. The value is generated by the battery model whereas is calculated from the output of the driver model based on a vehicle pedal progression map. Using this information and the value of the current engine speed, , the controller first identifies the region of on the engine efficiency map (Figure 8) and then defines the power split (6) according to the following rules:
- in region 1:
- -
- If , then all the requested power is provided by the battery.
- -
- Otherwise, the engine supplies + , where is delivered to the driveline and is used to recharge the battery.
- in region 2: In this case, is delivered by the engine irrespective of the value of .
- in region 3:
- -
- If , the engine supplies to the driveline and to charge the battery.
- -
- Otherwise, the engine delivers and the balance of the requested power (i.e., ) is provided by the battery.
In addition to the above operating modes, the HEV absorbs power to recharge the battery while it is decelerating. This process is called regenerative braking. When the requested power is negative (i.e., ), the PRBS controller compares to :
- -
- If , then no power is absorbed by the battery and the vehicle must slow down using the friction brakes.
- -
- Otherwise, the battery is recharged through regenerative braking, i.e., the motor in the HEV acts as a generator, absorbs the net vehicle inertia and helps it to stop.
Finally, to prevent high frequency switching between operating regions, the power region boundary and the are adjusted by a constant margin. and are adjusted by the constant margin (Table 2). The boundary curves derived from these step changes are shown by dashed lines in Figure 8. The margin for and is set to . These margins are used in the PRBS rules when establishing the operating region (i.e., and ) and when comparing to either or (i.e., and ) in order to maintain the current operating region of the vehicle, thereby limiting switching between regions 1 and 2 and between regions 2 and 3.
3.2. Adaptive Rule-Based Strategy
The PRBS strategy described above is easy to implement online. However, the strategy suffers from a few limitations. First, establishing the appropriate region boundaries requires detailed knowledge of the engine fuel efficient map. This knowledge may not be accessible in the case of aftermarket hybridization. Moreover, the same region boundaries are maintained across all duty cycles and vehicles. Therefore, if for a given duty cycle mostly falls in region 1, the battery will be used extensively causing its quick depletion. This will force the vehicle to operate in region 2 and rely primarily on the engine even if lies in an inefficient operating region for the engine. This limitation is particularly detrimental over extended distances. Moreover, this scenario will occur despite the fact that PRBS allows for a margin on and and a margin on and . These PRBS margins are intended to reduce the frequency of switching between operating regions and do not adapt to different vehicles and duty cycles.
The main contribution of the proposed ARBS approach is that it introduces an additional controller in front of the PRBS controller that dynamically adjusts at each time step according to the duty cycle. The output of this front controller is fed into the traditional PRBS controller described in the previous subsection as shown in Figure 9.
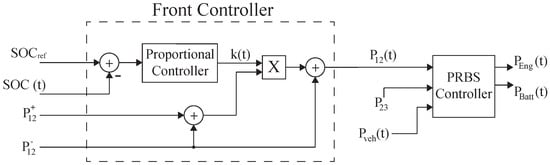
Figure 9.
ARBS controller.
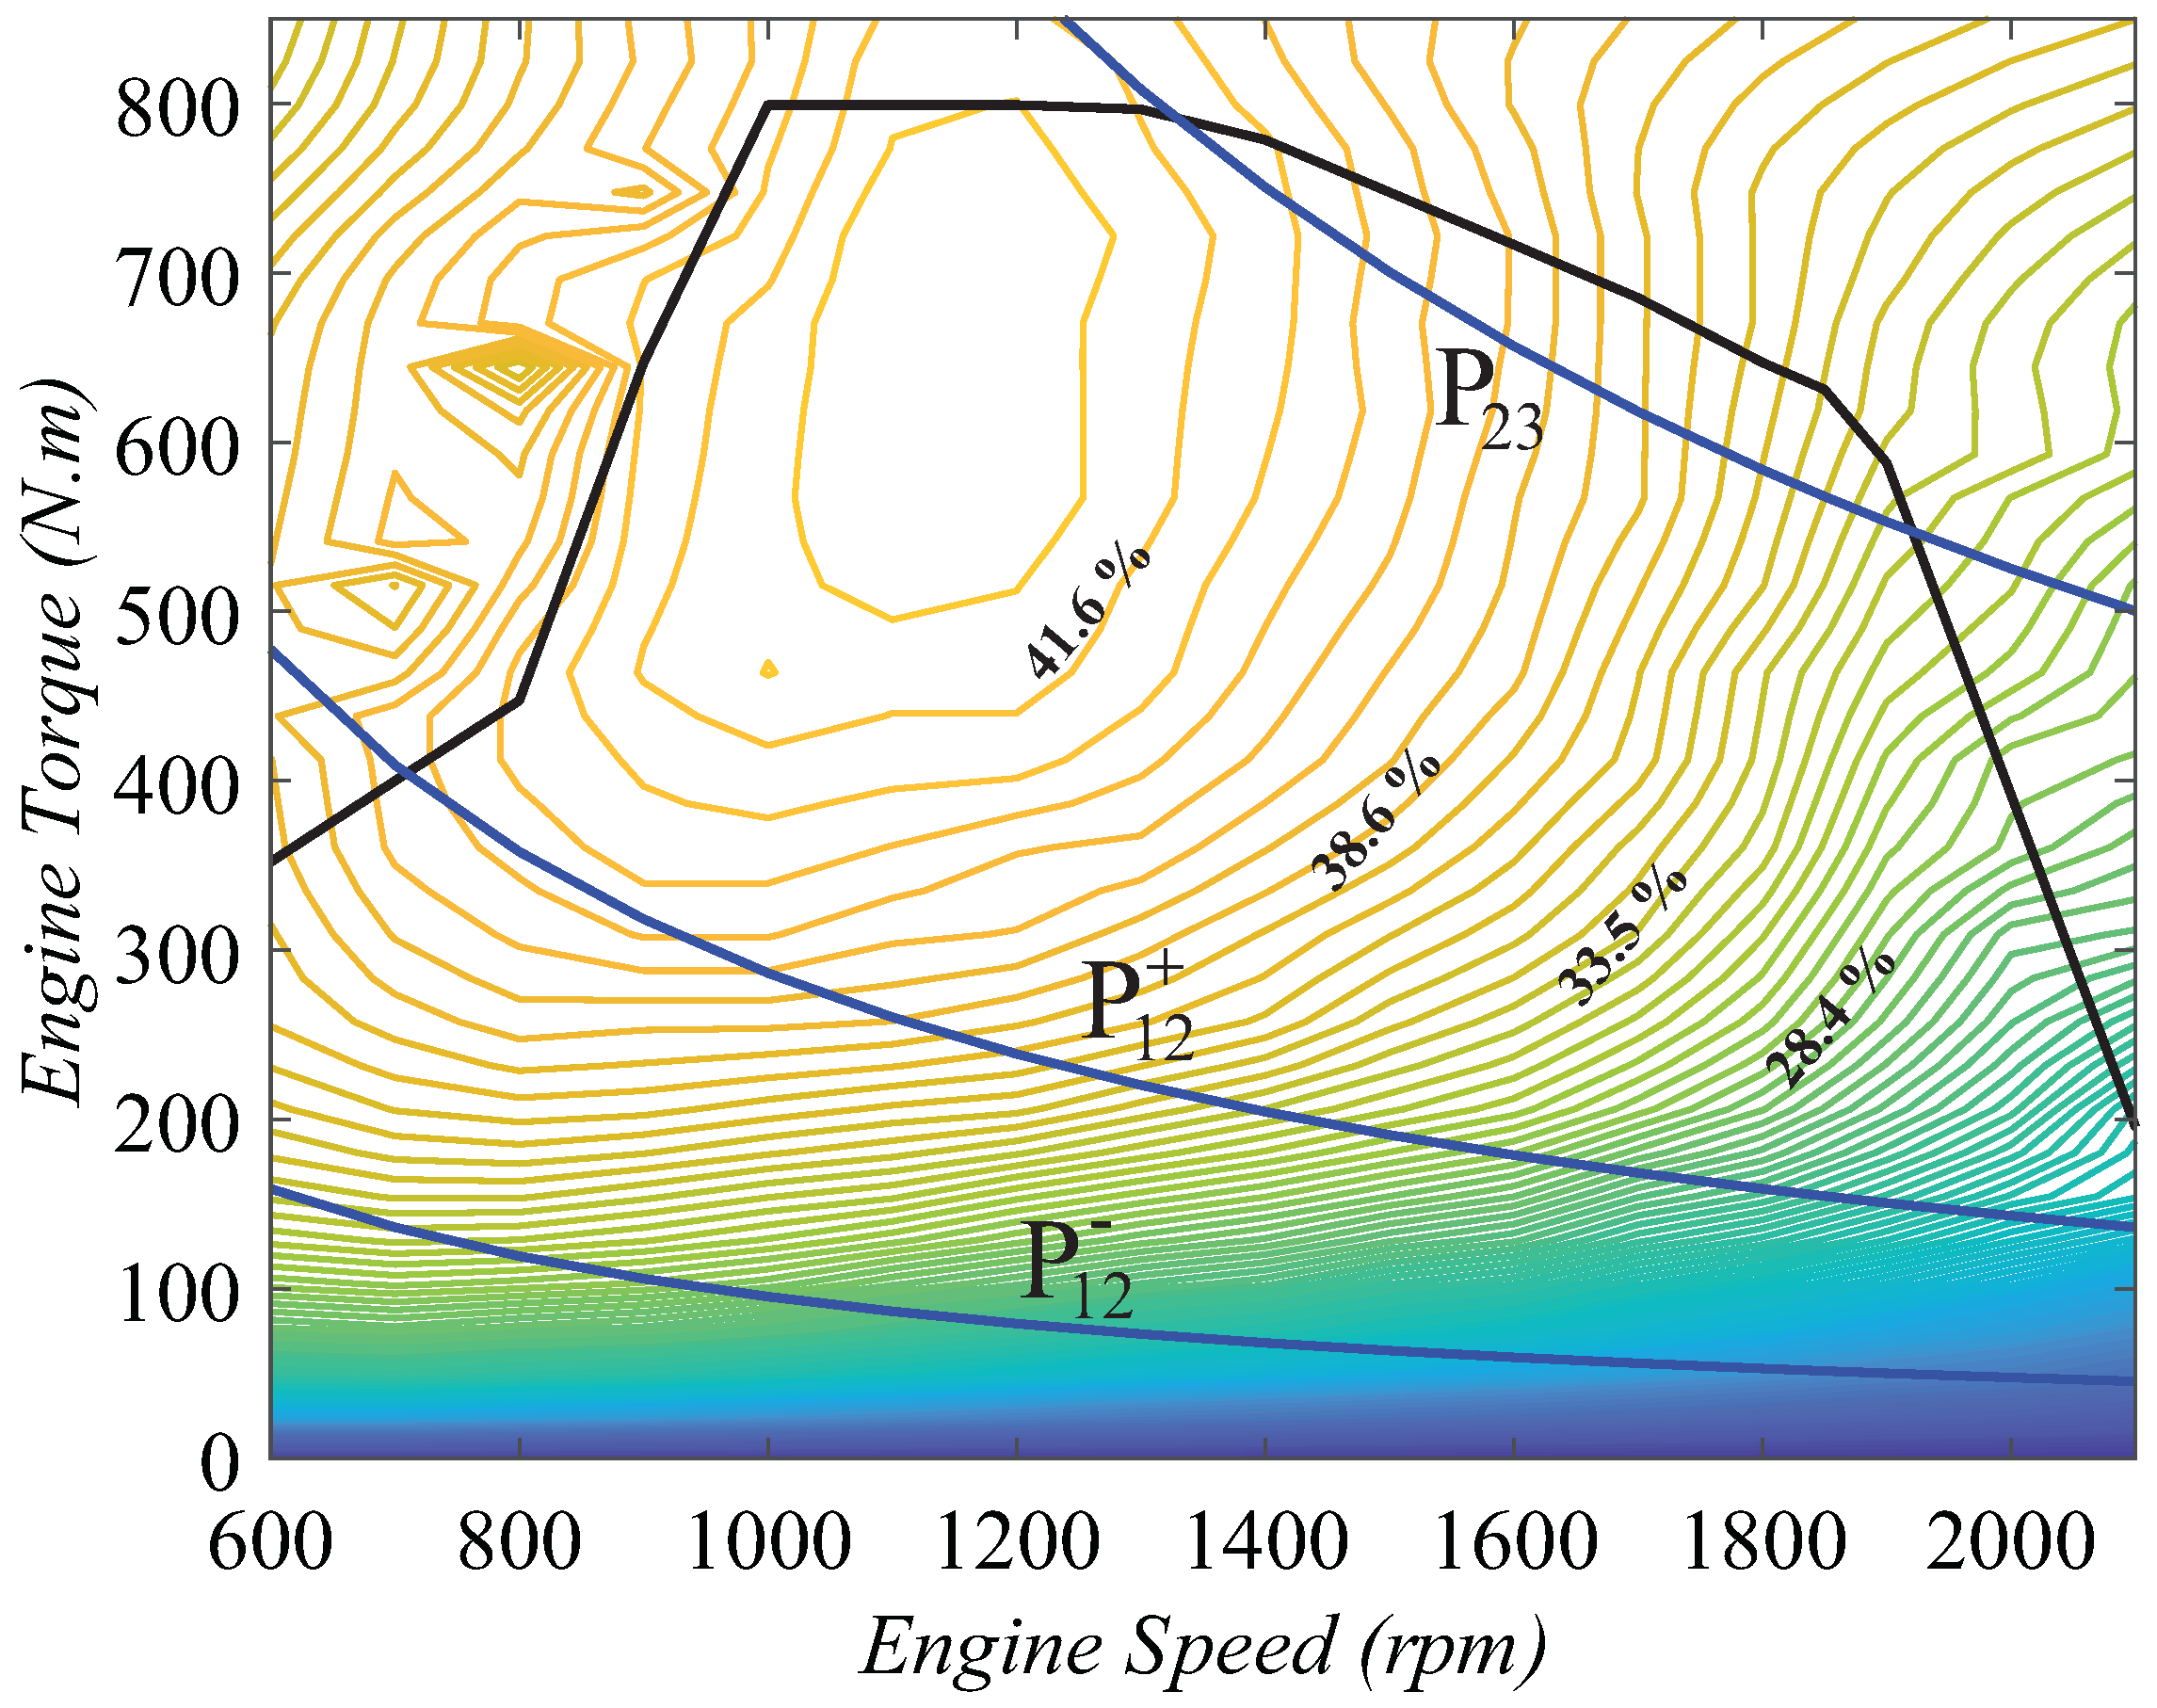
The time variant in ARBS is defined as follows:
where and are the maximum and minimum boundary values for (Table 2). Similar to the PRBS strategy, the value of is kept constant for the ARBS strategy. Figure 10 shows the , and boundaries on the engine efficiency map for ARBS.

Figure 10.
Engine efficiency map with region boundaries for the ARBS strategy.
The ARBS also tries to maintain the battery close to a reference value which is set to . The value of is determined based on the rated operating range of the battery. It is compared to by using a proportional controller which is embedded within the front controller. The output of this proportional controller, , is used to derive in (7) and is defined as follows:
where is the gain of the proportional controller (Figure 9). It is set based on the maximum allowable variation in the battery compared to . Since the value of is restricted to the range between and (7), the value of is between 0 and 1 (i.e., ).
If the battery is depleting, the ARBS controller increases thereby extending region 2 (engine) and reducing region 1 (motor) by an amount proportional to the difference between and . This process dynamically promotes the use of the engine and discourages the use of the battery thus, protecting it from depletion.
The magnitude of the action of the controller depends on its gain , and the difference (8). As mentioned above, the output of the controller, , is between 0 and 1. Therefore, the limits on the value of are:
Within this range for , the controller is active whereas outside of this range, the controller is saturated. In this study, is set to be 0.05, and since , the controller is active when is between 40% and 60%.
The proposed ARBS described above only modifies the boundary, , between regions 1 and 2 to a time variant boundary while keeping the boundary, , between region 2 and 3 constant. It is possible to also apply a similar approach to . The added benefits of this enhancement will be investigated in future work.
4. Performance Evaluation
To compare the PRBS and ARBS strategies, the HEV vehicle model described in Section 2 is implemented with the PRBS controller and the ARBS controller described in Section 3. The resulting model was used to simulate an extended duty cycle which was constructed from 6 short trips collected from a single vehicle and different drivers (Table 4). Each driver generated two trips where drivers were instructed to exhibit good driving behavior in the first trip and bad driving behavior in the second trip. Good driving behavior entails anticipating braking and coasting when possible. The vehicle was driven on a route around the Indianapolis area that includes segments of city and highway driving. The extended duty cycle is about 56 miles in length with a duration of 8000 s.
Table 4.
Characteristics of the six trips used to generate the extended duty cycle.
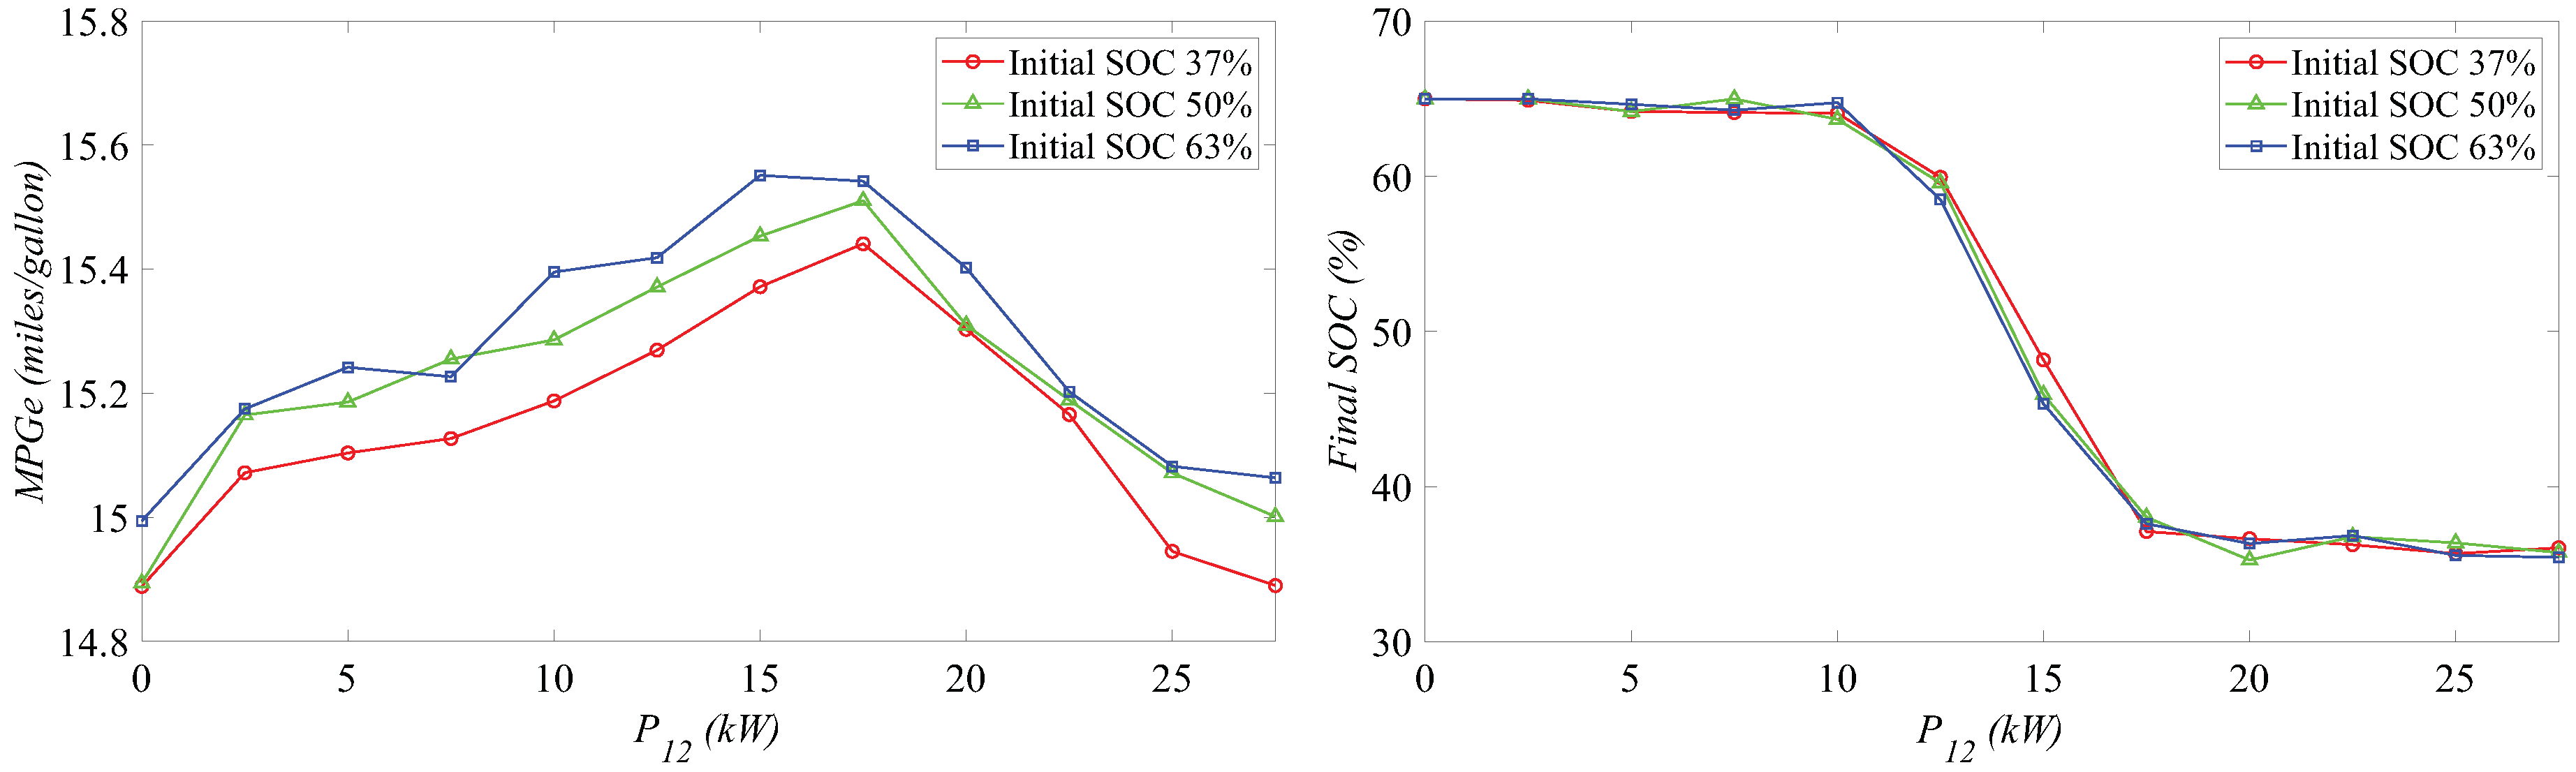
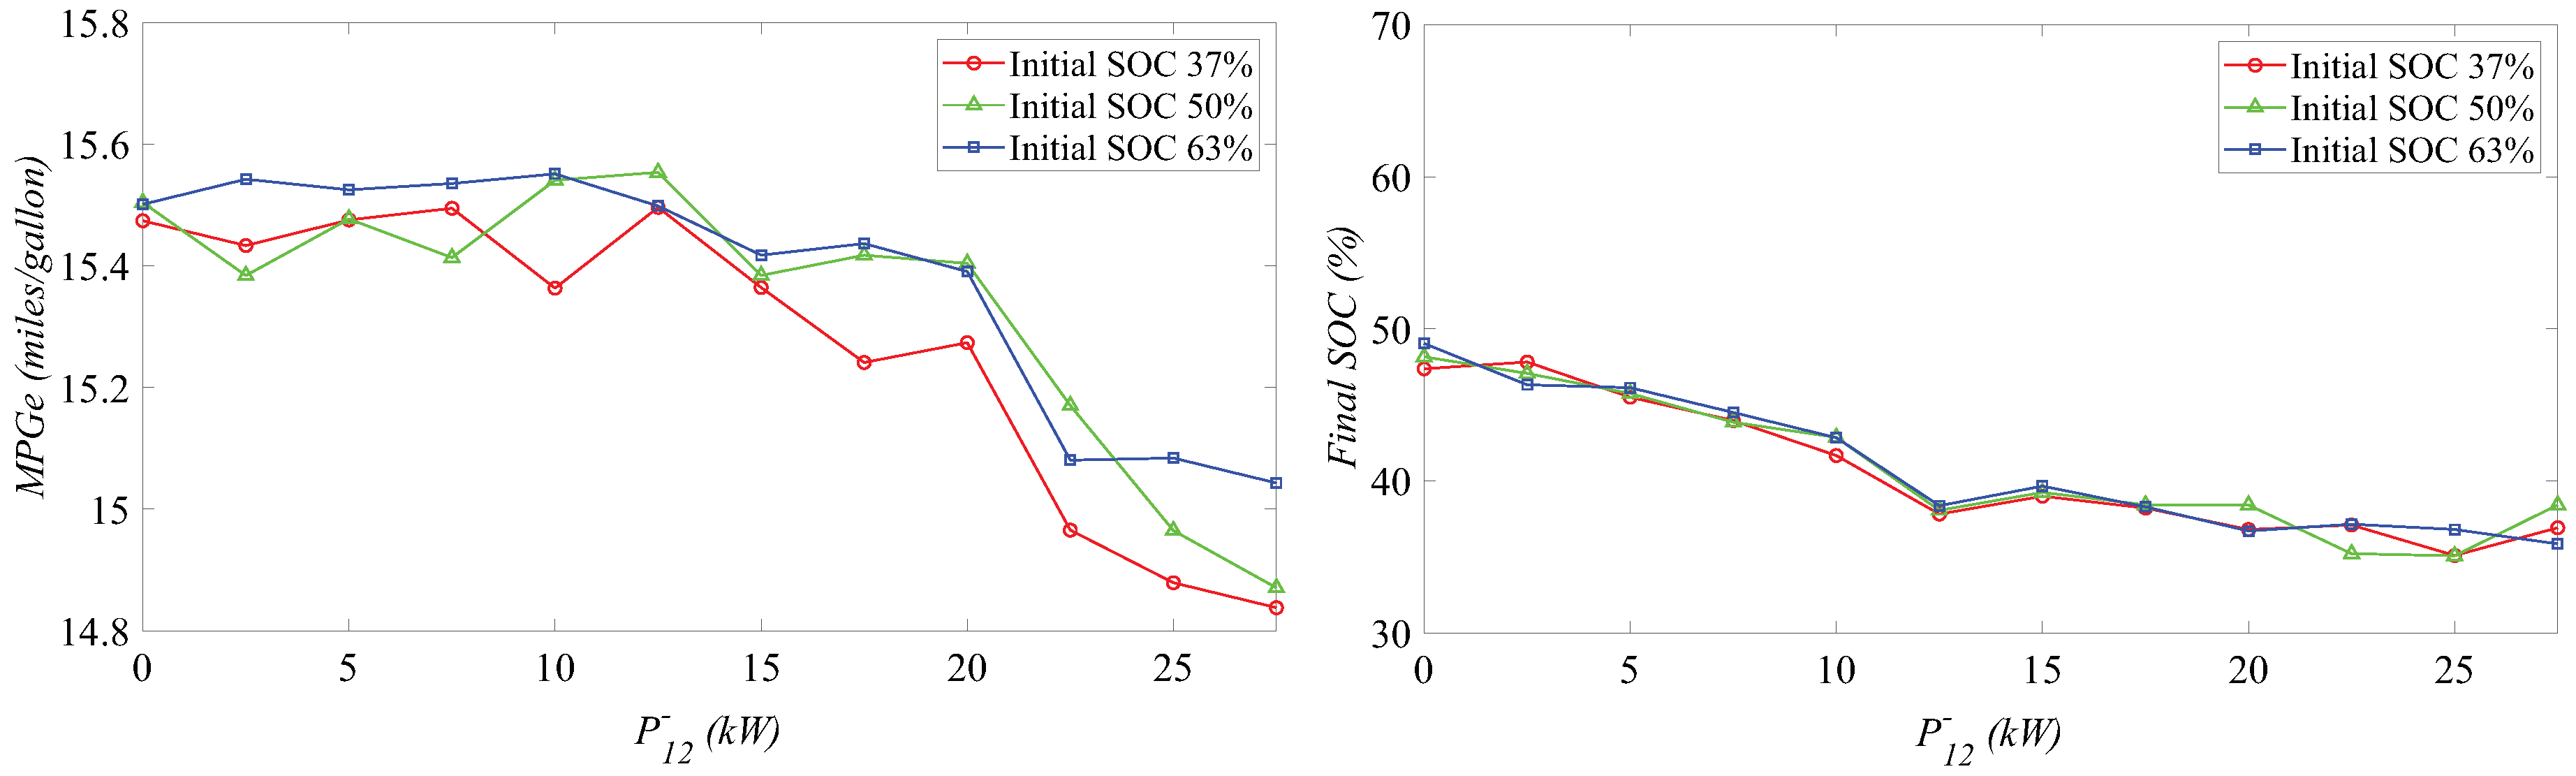
The values of the power parameters used in the simulation of PRBS and ARBS are given in Table 5. Figure 11 and Figure 12 show the miles per gallon equivalent (MPGe) and the final SOC resulting from the simulation of the PRBS and ARBS strategies, respectively. Three different values of initial SOC are used in the simulation and the values of (PRBS) and (ARBS) are varied from 0 to 27.5 kW with a 2.5 kW increment.
Table 5.
Values and ranges of the power parameters used for the simulation of the PRBS and ARBS strategies.
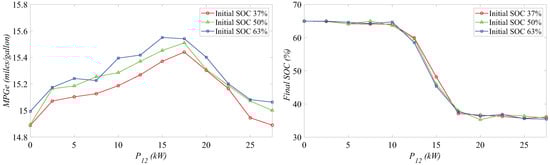
Figure 11.
MPGe and battery final SOC for the PRBS strategy when evaluated with different values of initial SOC and .
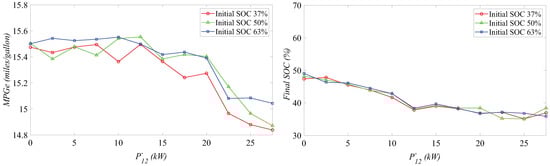
Figure 12.
MPGe and battery final SOC for the ARBS strategy when evaluated with different values of initial SOC and .
The miles per gallon equivalent (MPGe) is a metric introduced by the EPA [34] to compare vehicles with different energy sources. It represents the number of miles driven per diesel gallon equivalent energy and assumes that one gallon of diesel fuel has 38.08 kWh of energy [35]. MPGe is defined as:
where is the number of miles driven, and is the total net energy spent over the trip in kWh. is calculated by converting the change in SOC and the fuel spent by the vehicle to its energy content in kWh as follows:
where is the actual fuel consumed in gallons, is the energy content of one gallon of diesel fuel, is the battery capacity, is the final SOC and is the initial SOC of the battery. The values of these parameters are maintained constant across all the simulations.
It is worth noting that in the ECMS strategy, the equivalence factor is the weight assigned to the difference between and . This equivalence factor can take on different values and is adjusted according to the duty cycle. On the other hand, the factor which is used to convert the change in SOC to the energy spent by the battery in the ARBS strategy is constant.
As shown in Figure 11, the MPGe value for PRBS is highest when kW. The MPGe is low when is low because the engine region is large and extends to inefficient regions of the engine efficient map. In addition, when is low, the battery does not sufficiently discharge because the motor region is small. As a result, the final SOC of the battery is high for low values of and the battery only charges through regenerative braking.
When is high, the motor region is large causing the battery to quickly drain thereby making it unavailable during the vehicle operation. Figure 11 shows that for high values of , the final SOC is close to its lower limit of 35%. When the battery becomes unavailable, the engine is forced to operate in its inefficient region which leads to a low MPGe.
In fact, for the PRBS strategy, high MPGe (i.e., ≈15.4 miles/gallon) are only possible for a very narrow range of values. This highlights the importance of the knowledge of the engine efficiency map and the difficulty in calibrating the strategy for a given vehicle.
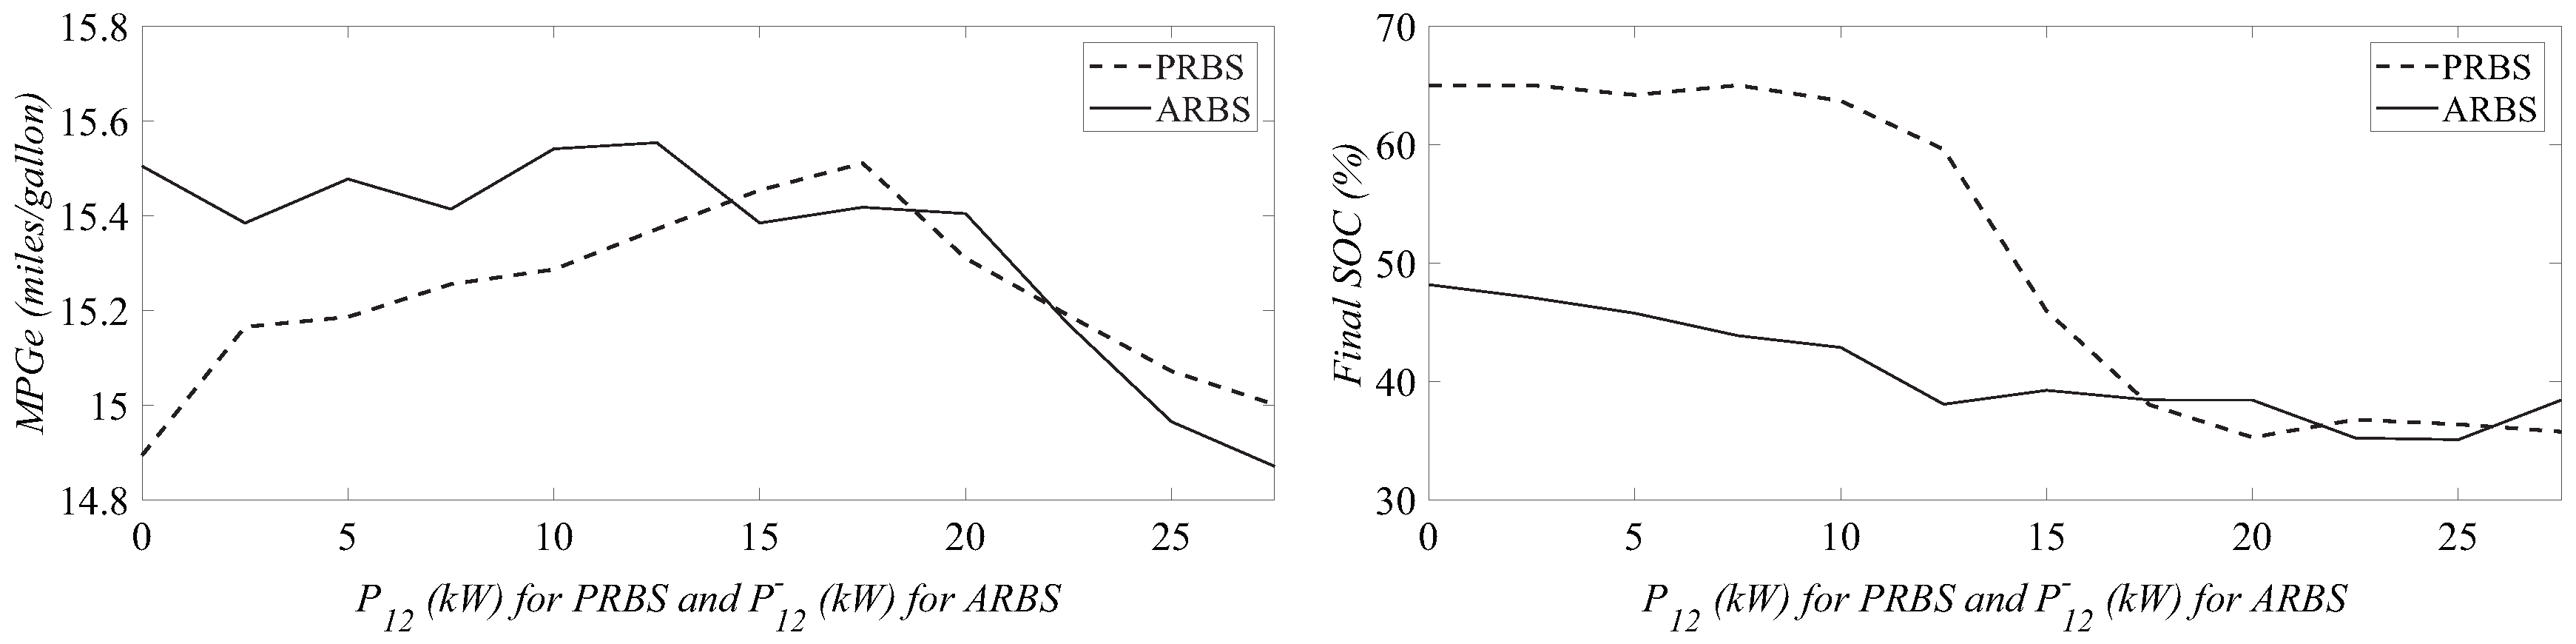
In contrast, under the ARBS strategy, the MPGe value is maintained at a high value (i.e., ≈15.5 miles/gallon) for an extended range of values from 0 kW to 15 kW (Figure 12). The ARBS controller can deliver high MPGe values when is low by adjusting in order to maintain the battery SOC around the reference SOC of 50%. As such, it neither completely drains the battery nor charges it to the upper limit (65%) ensuring it is available during the operation of the vehicle. Figure 13 compares the MPGe and the final SOC of the two strategies when the initial SOC of the battery is set to 50%. This figure confirms that the ARBS strategy maintains a higher MPGe than that of PRBS when kW. Thereafter, the two strategies are comparable.
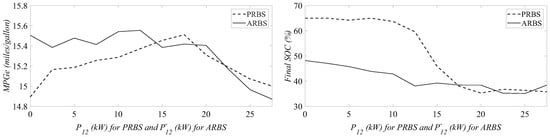
Figure 13.
MPGe and battery final SOC for the PRBS and ARBS strategies with initial SOC of 50%.
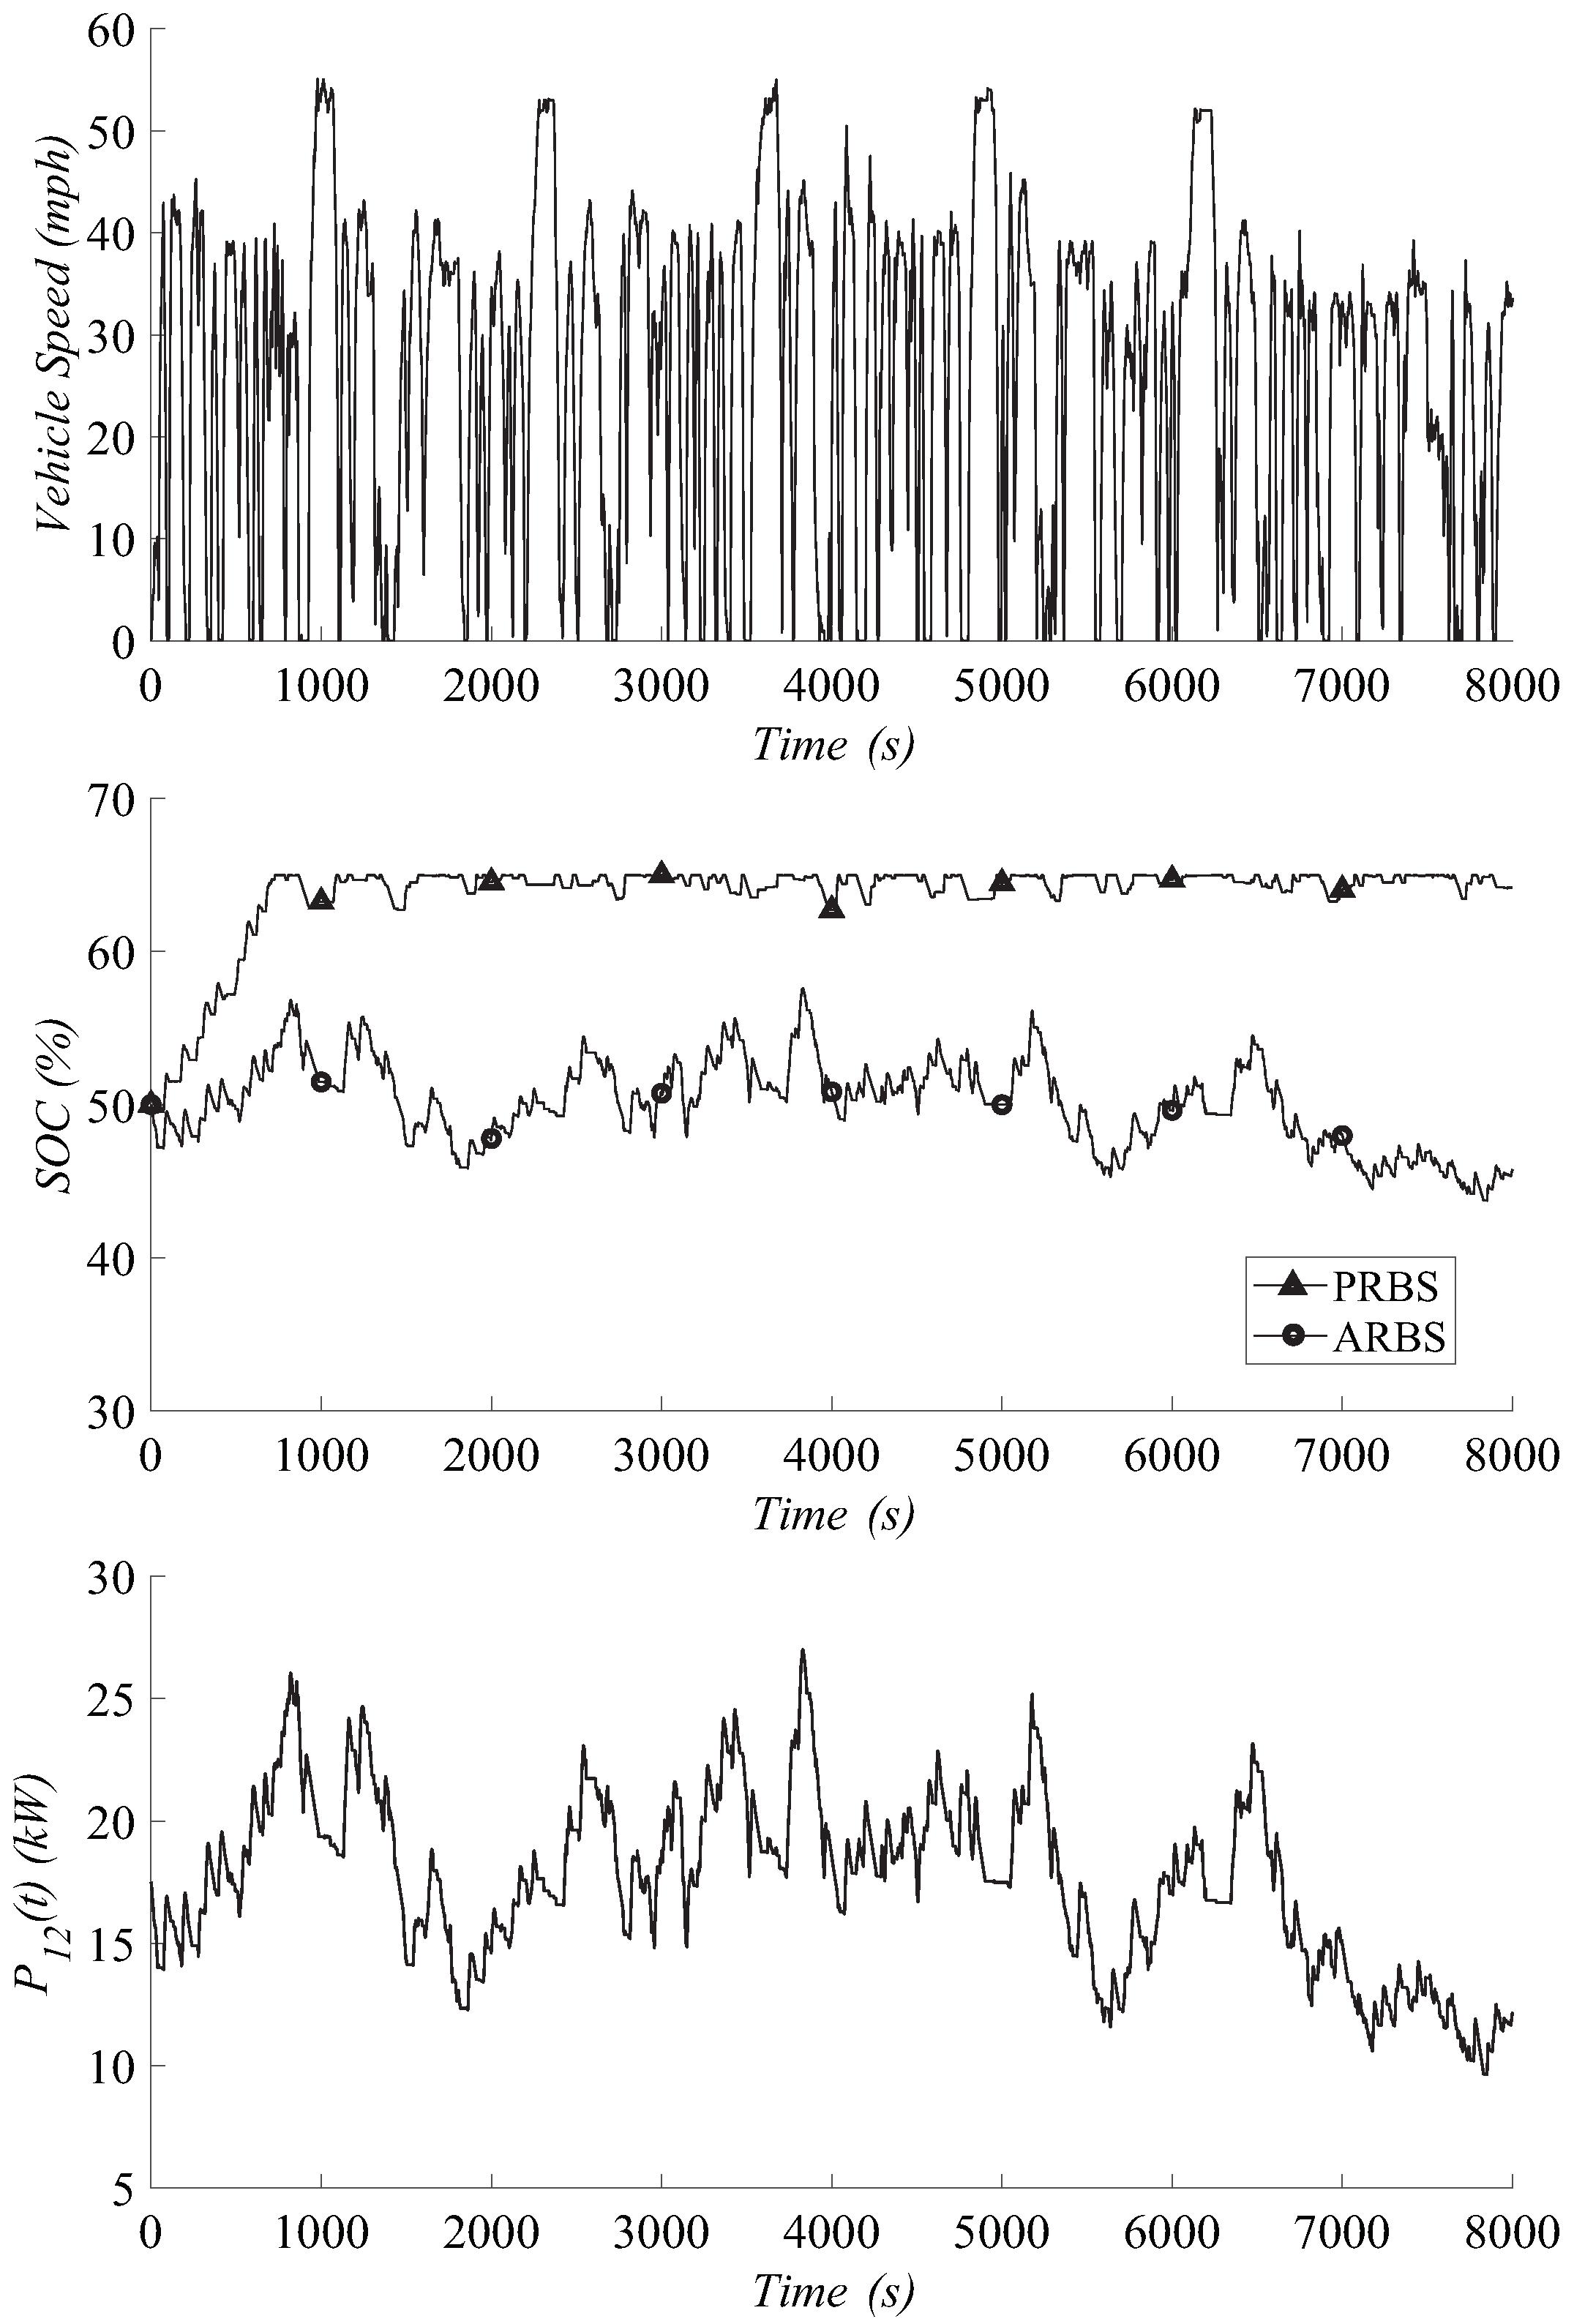
The dynamic optimization behavior of ARBS is illustrated in Figure 14 which shows the SOC value for PRBS and ARBS along the duty cycle. For this example scenario, and are both set to 5 kW and the initial SOC of the battery is set to 50%. Figure 14 shows that as the battery SOC decreases below 50%, the ARBS controller tries to preserve the SOC by reducing and consequently reducing the motor region. Conversely, the ARBS controller increases when the SOC increases beyond 50%.
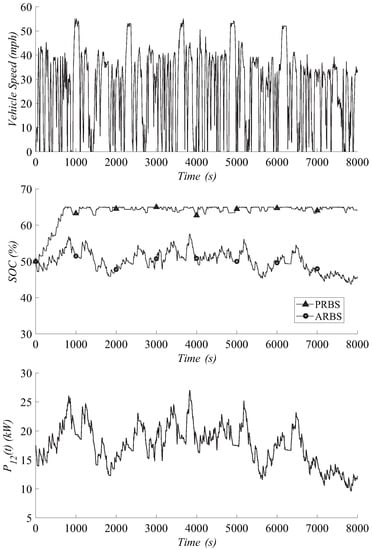
Figure 14.
Vehicle speed, battery SOC for PRBS and ARBS, and the dynamic value of as generated by the ARBS controller for the extended duty cycle. For this example simulation, kW, kW and the initial SOC is set to 50%.
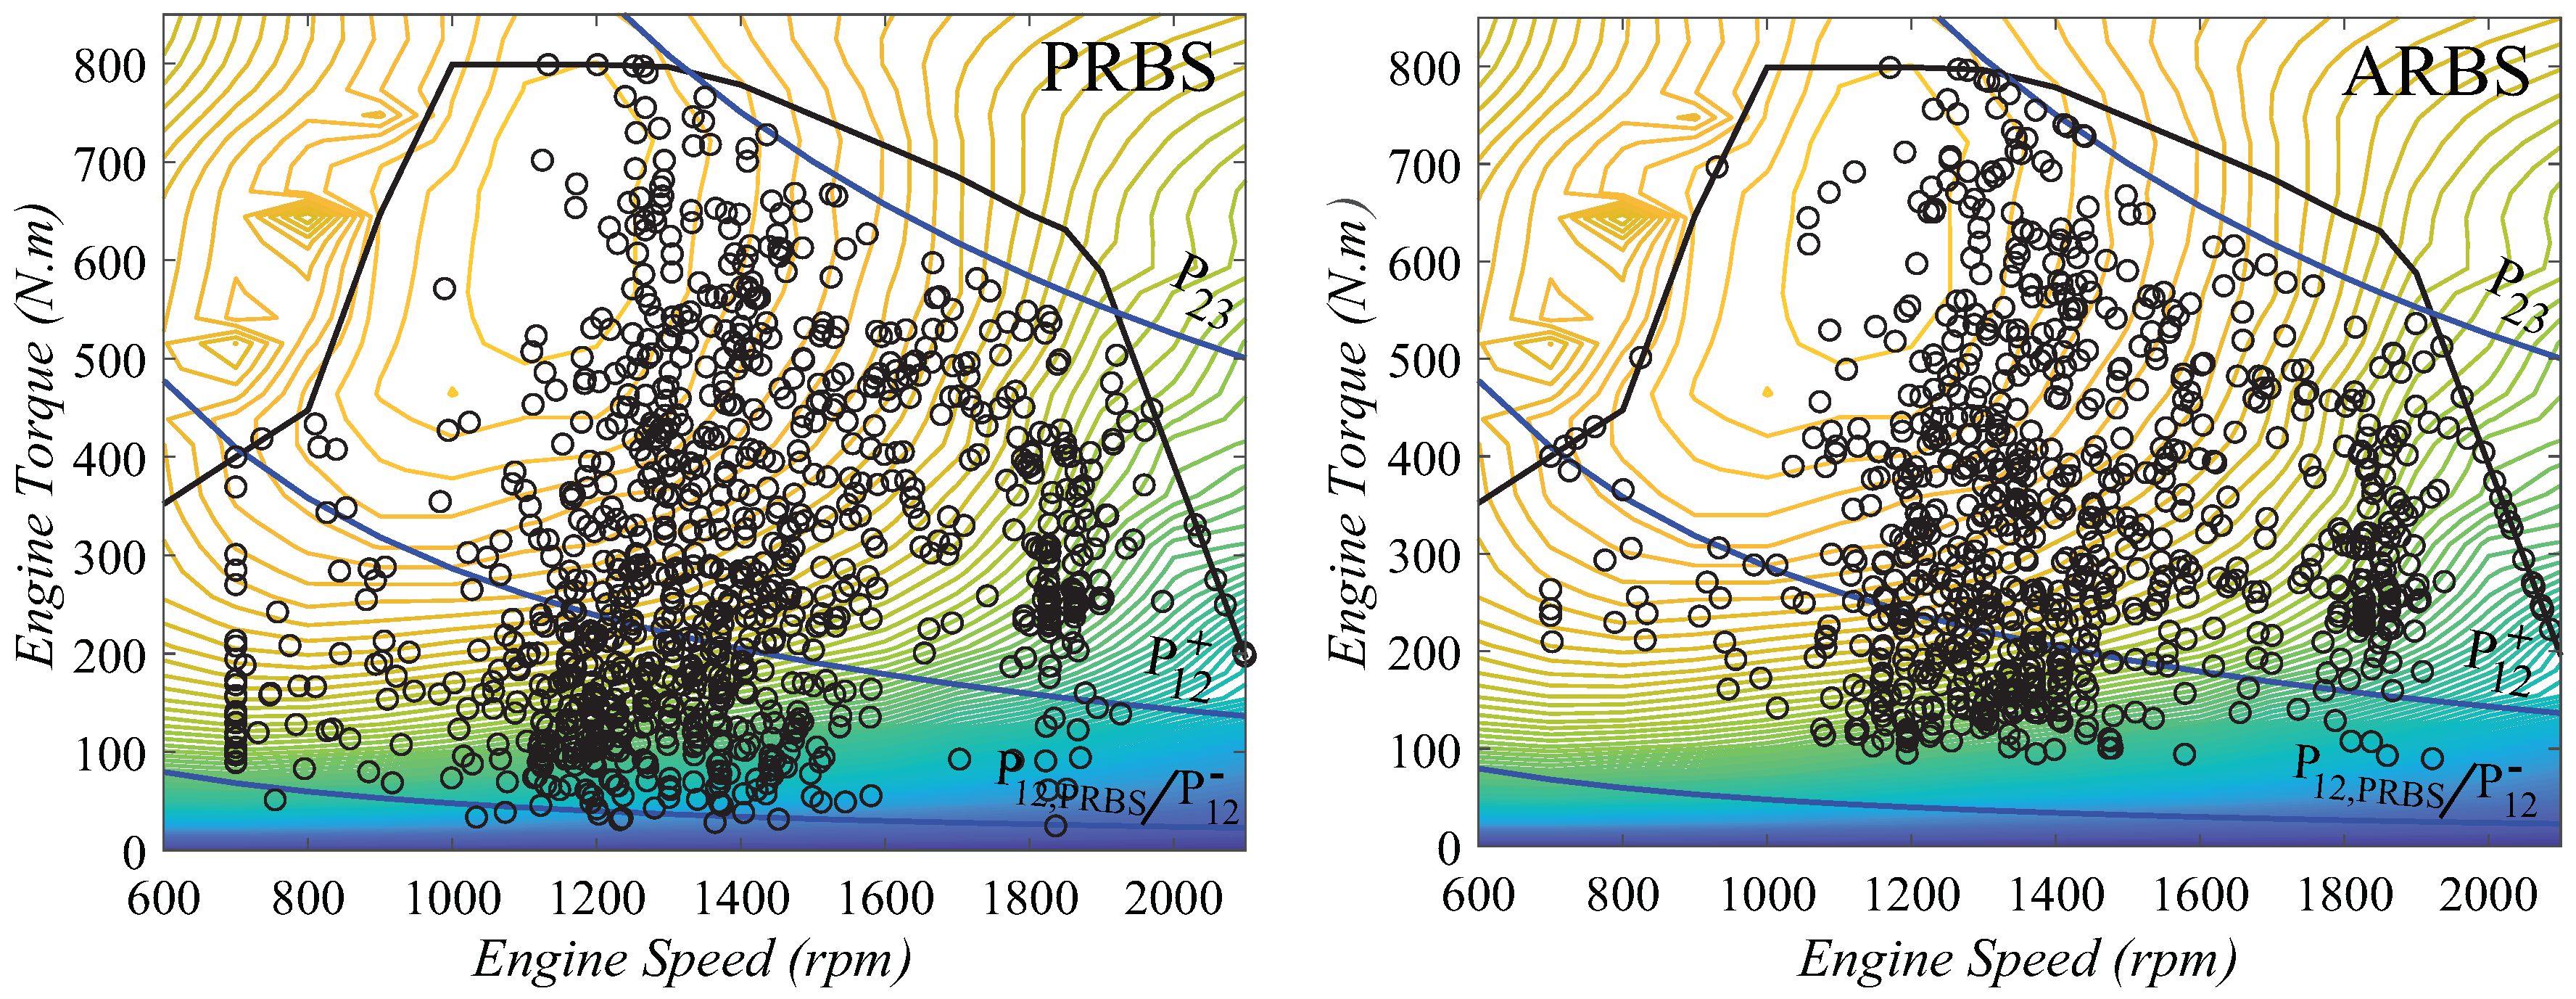
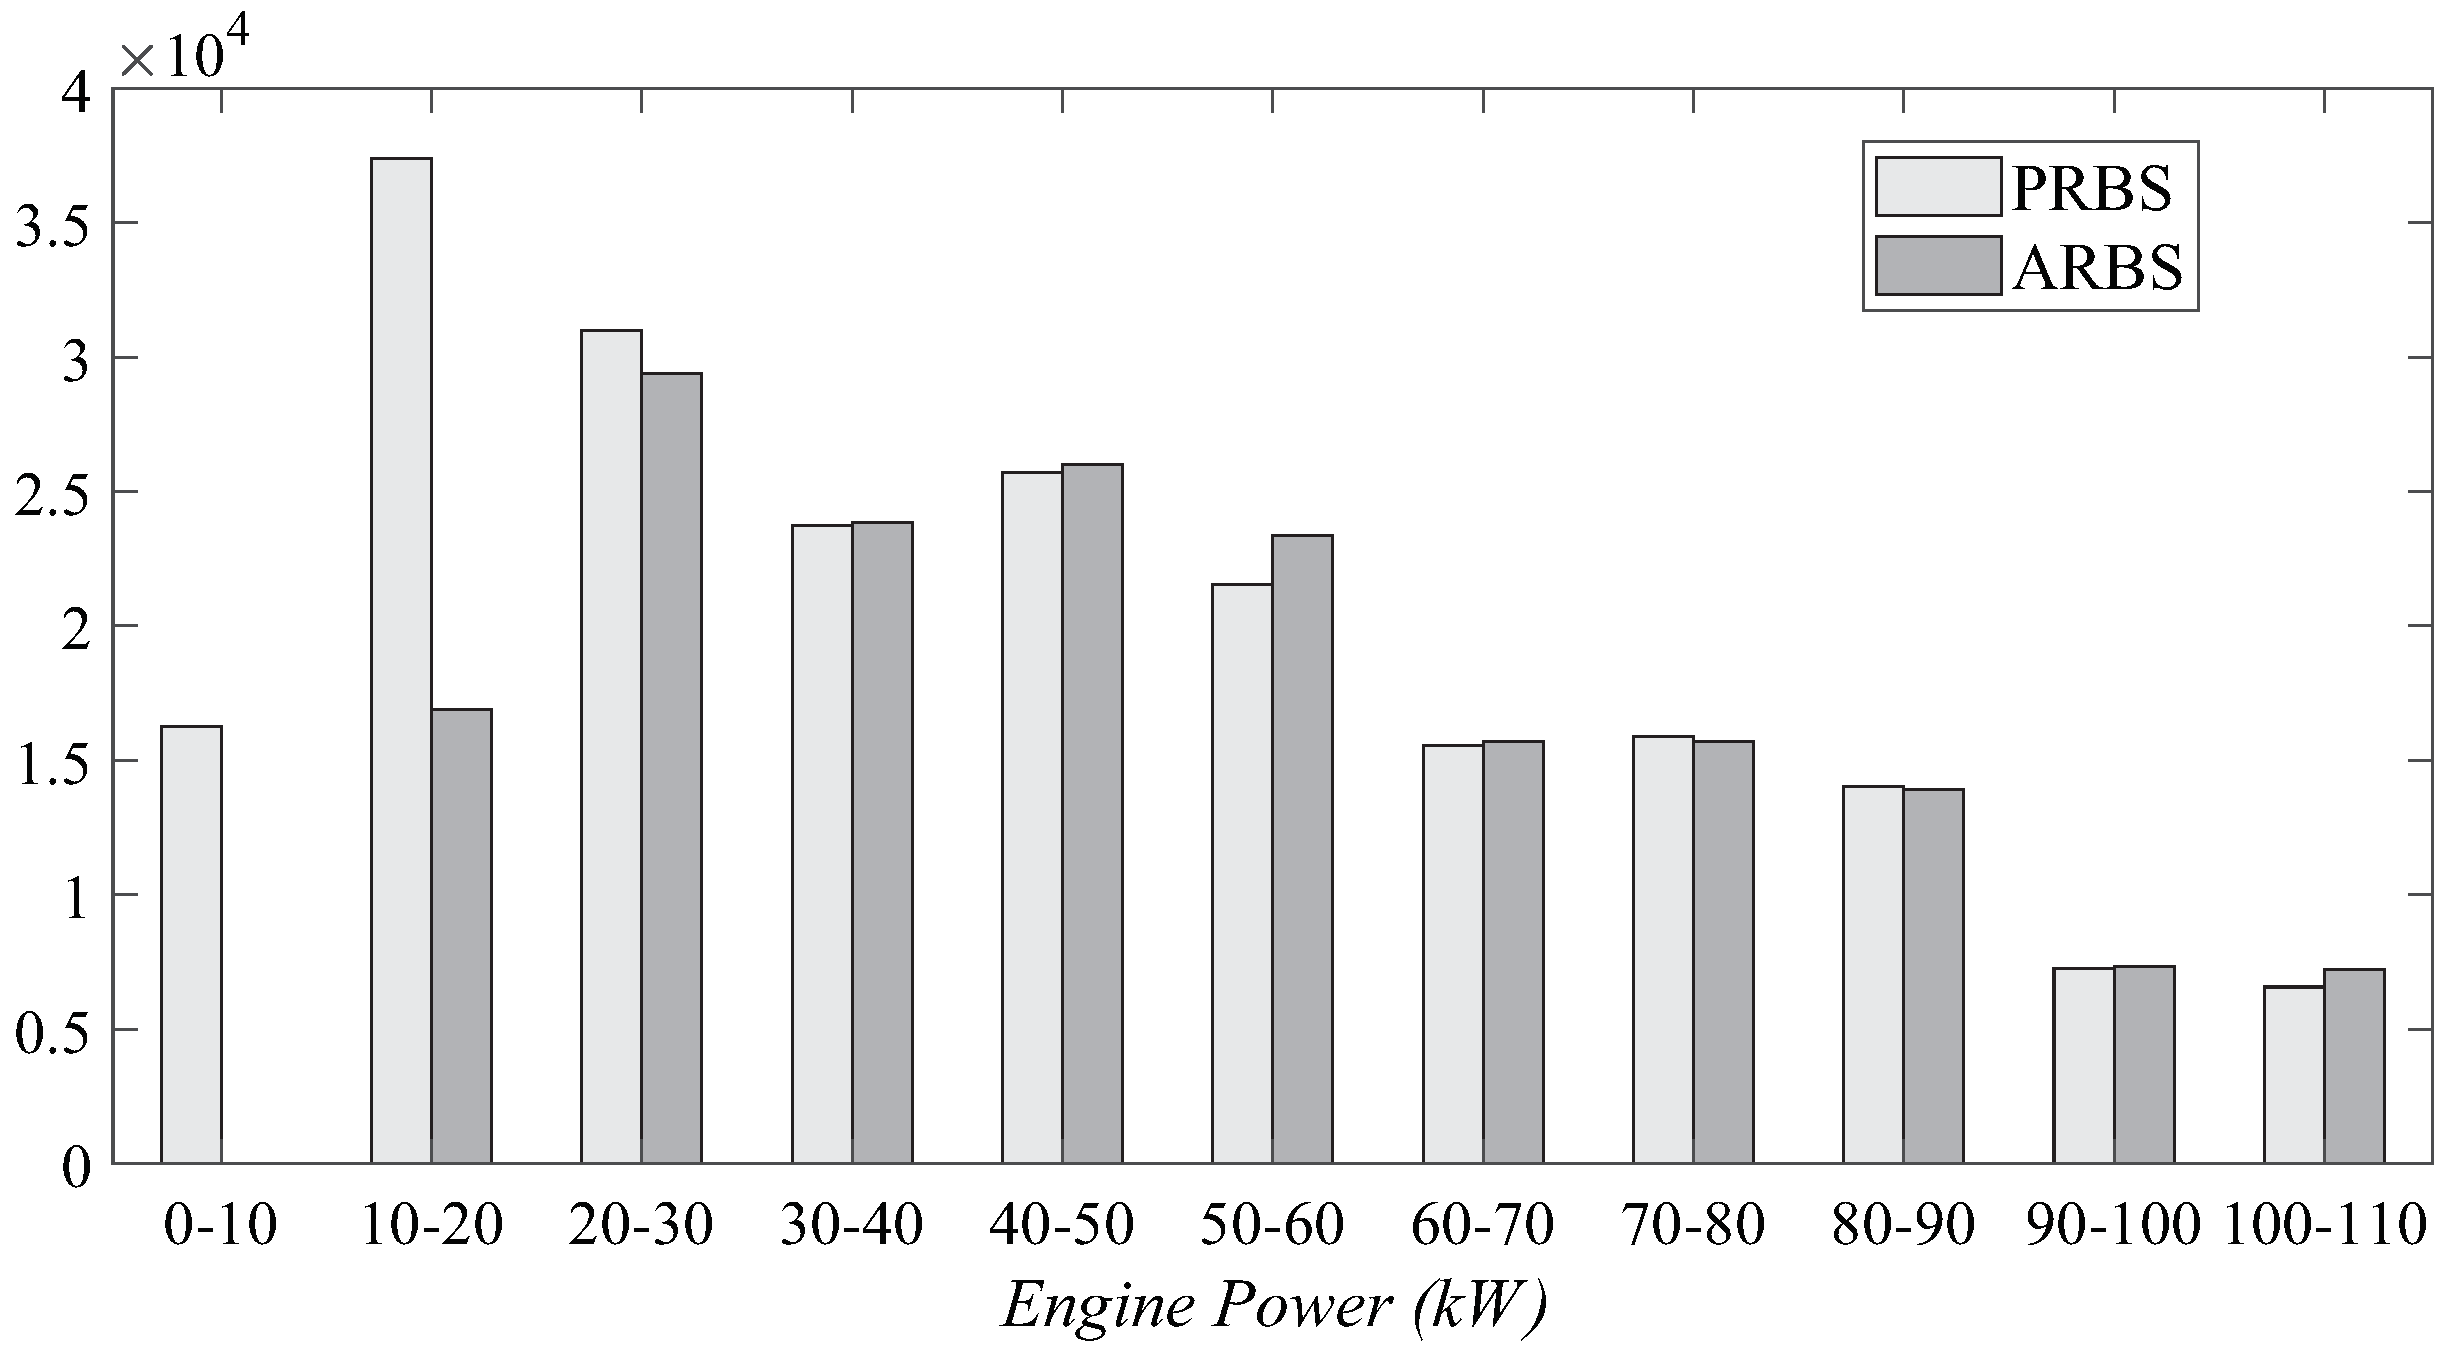
Figure 15 shows the engine operating points at an interval of 4 s during the duty cycle for both the PRBS and the proposed ARBS strategies. This figure confirms that the engine operates in an inefficient region more frequently under PRBS than under ARBS. Indeed, under PRBS, many engine operating points are near the boundary curve. An analysis of the power delivered by the engine also shows that ARBS does not use the engine in these inefficient regions. In fact, the ARBS controller eliminates the operation of the engine below 10 kW as shown in Figure 16. Moreover, the engine under the ARBS controller operates less frequently under 30 kW. Engine operation above 30 kW is similar for PRBS and ARBS because the ARBS controller does not modify engine operation above the threshold = 30 kW.
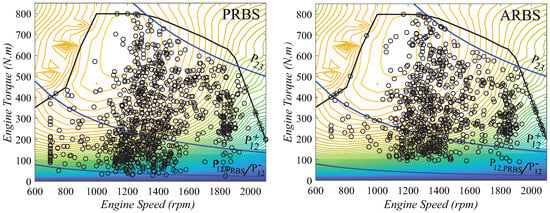
Figure 15.
PRBS and ARBS engine operating points during the duty cycle at 4 s intervals with kW and kW.
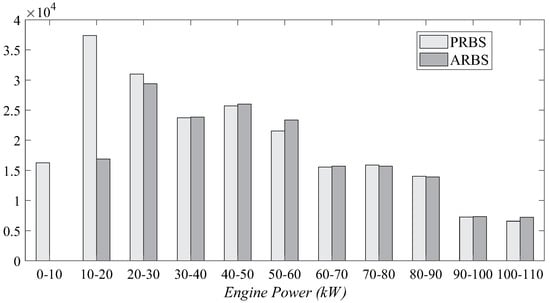
Figure 16.
Histogram of power delivered by the engine under PRBS and ARBS during the duty cycle at 4 s intervals with kW and kW.
5. Conclusions
The need for the hybridization of conventional vehicles is expected to continue to grow in order to meet the demand for fuel efficient vehicles that can satisfy increasingly strict emission regulations. To achieve high fuel efficiency, an EMS strategy is used to adequately manage the two sources of energy in an HEV. An EMS strategy that can be implemented online and without complete knowledge of the entire duty cycle of the vehicle is a requirement for the rapid deployment of hybridization at scale. Currently, the PRBS strategy is the EMS of choice because its underlying rule-based approach makes it easy to deploy online. However, this strategy relies on the availability of the engine efficiency map to define the boundaries and the operating regions of the HEV.
This paper introduces an adaptive EMS strategy for a parallel HEV which can effectively support the hybridization of conventional vehicles using an affordable 48 V battery system. As in the case of PRBS, the proposed ARBS is easy to deploy online. However, it also has the added benefit of being engine-map agnostic which makes it suitable for aftermarket hybridization. The added benefit of ARBS is achieved by dynamically adjusting the boundary between the motor region and the engine region according to the requirements of the duty cycle. This boundary is adjusted intelligently such that an optimal behavior is achieved whereby ARBS uses all the available energy from the battery only when the engine is operating at its lowest efficiency. Under the PRBS strategy, this boundary is fixed and typically estimated based on the analysis of the engine efficient map of the vehicle. The proposed ARBS dynamically adjusts this boundary within broadly defined lower () and upper () thresholds. The simulations of the ARBS and PRBS presented in this paper show that ARBS can deliver higher MPGe even if is set to 0 kW. Moreover, ARBS can prevent the battery from depleting by maintaining the SOC around a predefined reference value. The long-term benefits of this behavior may include extending the lifetime of the battery by preventing over-discharge and reducing the number of charge-discharge cycles [36].
Future work will consider applying a similar dynamic strategy to the boundary between the engine region and the engine+motor region. Additional improvement may also be achieved by using an elliptic instead of a linear operating boundary.
Author Contributions
Conceptualization and methodology, R.B.M., A.B., E.C.d.S.J., and Z.B.-M.; software, R.B.M. and E.C.d.S.J.; validation, R.B.M. and Z.Z.; formal analysis, A.B. and E.C.d.S.J.; resources, A.B.; Writing–original draft preparation, R.B.M., A.B., E.C.d.S.J., and Z.B.-M.; Writing–review and editing, R.B.M., A.B., E.C.d.S.J., and Z.B.-M.
Funding
This research was supported in part by Allison Transmission, Inc.
Conflicts of Interest
The authors declare no conflict of interest.
References
- Camara, M.B.; Gualous, H.; Gustin, F.; Berthon, A. Design and new control of DC/DC converters to share energy between supercapacitors and batteries in hybrid vehicles. IEEE Trans. Veh. Technol. 2008, 57, 2721–2735. [Google Scholar] [CrossRef]
- Thounthong, P.; Rael, S.; Davat, B. Energy management of fuel cell/battery/supercapacitor hybrid power source for vehicle applications. J. Power Sources 2009, 193, 376–385. [Google Scholar] [CrossRef]
- Polini, C.; Di Napoli, A.; Pede, G.; Rossi, E.; Villante, C. Energy management in hybrid electric vehicle with ICE and ultracapacitors. In Proceedings of the Electrical Systems for Aircraft, Railway and Ship Propulsion, Bologna, Italy, 19–21 October 2010; pp. 1–6. [Google Scholar]
- Severinsky, A.J. Hybrid Electric Vehicle. U.S. Patent No 5,343,970, 6 September 1994. [Google Scholar]
- December 2015 Hybrid Car Sales Numbers. Available online: https://www.hybridcars.com/december-2015-dashboard (accessed on 7 January 2019).
- Hybrids Account for Nearly 20 Percent of Cars in Japan. Available online: https://www.japantimes.co.jp/news/2018/10/27/business/hybrids-account-nearly-20-percent-cars-japan-automobile-association-says (accessed on 7 January 2019).
- Wang, X.; Li, L.; Yang, C. Hierarchical control of dry clutch for engine-start process in a parallel hybrid electric vehicle. IEEE Trans. Transp. Electrif. 2016, 2, 231–243. [Google Scholar] [CrossRef]
- Luo, Y.; Chen, T.; Zhang, S.; Li, K. Intelligent hybrid electric vehicle ACC with coordinated control of tracking ability, fuel economy, and ride comfort. IEEE Trans. Intell. Transp. Syst. 2015, 16, 2303–2308. [Google Scholar] [CrossRef]
- Zhang, P.; Yan, F.; Du, C. A comprehensive analysis of energy management strategies for hybrid electric vehicles based on bibliometrics. Renew. Sustain. Energy Rev. 2015, 48, 88–104. [Google Scholar] [CrossRef]
- Bianchi, D.; Rolando, L.; Serrao, L.; Onori, S.; Rizzoni, G.; Al-Khayat, N.; Hsieh, T.M.; Kang, P. A rule-based strategy for a series/parallel hybrid electric vehicle: an approach based on dynamic programming. In Proceedings of the ASME 2010 Dynamic Systems and Control Conference, Cambridge, MA, USA, 12–15 September 2010; American Society of Mechanical Engineers: New York, NY, USA, 2010; pp. 507–514. [Google Scholar]
- Wu, J.; Zhang, C.H.; Cui, N.X. PSO algorithm-based parameter optimization for HEV powertrain and its control strategy. Int. J. Automot. Technol. 2008, 9, 53–59. [Google Scholar] [CrossRef]
- Onori, S.; Serrao, L.; Rizzoni, G. Hybrid Electric Vehicles: Energy Management Strategies; Springer: Berlin/Heidelberg, Germany, 2016. [Google Scholar]
- Sun, C.; He, H.; Sun, F. The role of velocity forecasting in adaptive-ECMS for hybrid electric vehicles. Energy Procedia 2015, 75, 1907–1912. [Google Scholar] [CrossRef]
- Lin, C.C.; Peng, H.; Grizzle, J.W.; Kang, J.M. Power management strategy for a parallel hybrid electric truck. IEEE Trans. Control Syst. Technol. 2003, 11, 839–849. [Google Scholar]
- Banvait, H.; Anwar, S.; Chen, Y. A rule-based energy management strategy for plug-in hybrid electric vehicle (PHEV). In Proceedings of the American Control Conference, ACC’09, St. Louis, MO, USA, 10–12 June 2009; pp. 3938–3943. [Google Scholar]
- Schouten, N.J.; Salman, M.A.; Kheir, N.A. Fuzzy logic control for parallel hybrid vehicles. IEEE Trans. Control Syst. Technol. 2002, 10, 460–468. [Google Scholar] [CrossRef]
- Mansour, C.; Clodic, D. Dynamic modeling of the electro-mechanical configuration of the Toyota Hybrid System series/parallel power train. Int. J. Automot. Technol. 2012, 13, 143. [Google Scholar] [CrossRef]
- Huang, X.; Tan, Y.; He, X. An intelligent multifeature statistical approach for the discrimination of driving conditions of a hybrid electric vehicle. IEEE Trans. Intell. Transp. Syst. 2011, 12, 453–465. [Google Scholar] [CrossRef]
- Chen, Z.; Mi, C.C.; Xu, J.; Gong, X.; You, C. Energy management for a power-split plug-in hybrid electric vehicle based on dynamic programming and neural networks. IEEE Trans. Veh. Technol. 2014, 63, 1567–1580. [Google Scholar] [CrossRef]
- Karbowski, D.; Pagerit, S. Autonomie, a plug-and-play software architecture. In Proceedings of the Vehicle Power and Propulsion Conference, Lille, France, 1–3 September 2010. [Google Scholar]
- Brooker, A.; Gonder, J.; Wang, L.; Wood, E.; Lopp, S.; Ramroth, L. FASTSim: A Model to Estimate Vehicle Efficiency, Cost and Performance; Technical report; SAE Technical Paper No. 2015-01-0973; Society of Automotive Engineering (SAE) International: Warrendale, PA, USA, 2015. [Google Scholar]
- Lygoe, R. Fitting Automotive Microprocessor Control Look-Up Tables to a Response Surface Model Using Optimisation Methods; Technical report; SAE Technical Paper No. 981459; Society of Automotive Engineering (SAE) International: Warrendale, PA, USA, 1998. [Google Scholar]
- Markel, T.; Brooker, A.; Hendricks, T.; Johnson, V.; Kelly, K.; Kramer, B.; O’Keefe, M.; Sprik, S.; Wipke, K. ADVISOR: A systems analysis tool for advanced vehicle modeling. J. Power Sources 2002, 110, 255–266. [Google Scholar] [CrossRef]
- Bosch, R. Bosch Automotive Handbook, 5th ed.; Bentley Publishers: Cambridge, MA, USA, 2002. [Google Scholar]
- Moawad, A.; Rousseau, A. Impact of Transmission Technologies on Fuel Efficiency-Final Report; Report No. DOT HS; National Highway Traffic Safety Administration (NHTSA): Washington, DC, USA, 2012; Volume 811, p. 667.
- Gillespie, T.D. Fundamentals of Vehicle Dynamics; Technical report; SAE Technical Paper; Society of Automotive Engineering (SAE) International: Warrendale, PA, USA, 1992. [Google Scholar]
- Swift, A. Calculation of vehicle aerodynamic drag coefficients from velocity fitting of coastdown data. J. Wind. Eng. Ind. Aerodyn. 1991, 37, 167–185. [Google Scholar] [CrossRef]
- Pickenhain, S.; Burtchen, A. Optimal energy control of hybrid vehicles. In Modeling, Simulation and Optimization of Complex Processes HPSC 2015; Springer: New York City, NY, USA, 2017; pp. 179–188. [Google Scholar]
- Huria, T.; Ceraolo, M.; Gazzarri, J.; Jackey, R. High fidelity electrical model with thermal dependence for characterization and simulation of high power lithium battery cells. In Proceedings of the 2012 IEEE International Electric Vehicle Conference, Greenville, SC, USA, 4–8 March 2012; pp. 1–8. [Google Scholar]
- Harrop, P. 48V Mild Hybrid and 48V Full Hybrid Vehicles 2020–2030. 2019. Available online: https://www.idtechex.com/en/research-report/48v-mild-hybrid-and-48v-full-hybrid-vehicles-2020-2030/683 (accessed on 17 October 2019).
- Congress, G.C. Continental Presents 48V Full-Hybrid System; Motor Delivers up to 30 kW. 2019. Available online: https://www.greencarcongress.com/2019/07/20190702-conti.html (accessed on 17 October 2019).
- Kuypers, M. Application of 48 Volt for Mild Hybrid Vehicles and High Power Loads; Technical report; SAE Technical Paper No. 2014-01-1790; Society of Automotive Engineering (SAE) International: Warrendale, PA, USA, 2014. [Google Scholar]
- Jalil, N.; Kheir, N.A.; Salman, M. A rule-based energy management strategy for a series hybrid vehicle. In Proceedings of the 1997 American Control Conference (Cat. No. 97CH36041), Albuquerque, NM, USA, 6 June 1997; Volume 1, pp. 689–693. [Google Scholar]
- EPA. New Fuel Economy and Environment Labels for a New Generation of Vehicles; Regulatory Announcement EPA-420-F-11-017; US Environmental Protection Agency: Washington, DC, USA, 2011.
- US Department of Energy. Fuel Properties Comparison—Alternative Fuels Data Center. 2014. Available online: https://afdc.energy.gov/fuels/properties (accessed on 15 June 2019).
- Qadrdan, M.; Jenkins, N.; Wu, J. Smart Grid and Energy Storage. In McEvoy’s Handbook of Photovoltaics; Elsevier: Amsterdam, The Netherlands, 2018; pp. 915–928. [Google Scholar]


© 2019 by the authors. Licensee MDPI, Basel, Switzerland. This article is an open access article distributed under the terms and conditions of the Creative Commons Attribution (CC BY) license (http://creativecommons.org/licenses/by/4.0/).