Article

A Hybrid Methodology for Analyzing the Performance of Induction Motors with Efficiency Improvement by Specific Commercial Measures

1
Institute of Electrical Engineering, Chinese Academy of Sciences, Beijing 100190, China
2
Research Laboratory of Electronics, Massachusetts Institute of Technology, Cambridge, MA 02139, USA
3
School of Electrical and Electronic Engineering, Nanyang Technological University, Singapore 639798, Singapore
4
Department of Electrical and Computer Engineering, The Ohio State University, Columbus, OH 43210, USA
*
Author to whom correspondence should be addressed.
Energies 2019, 12(23), 4497; https://doi.org/10.3390/en12234497
Submission received: 6 November 2019 / Revised: 20 November 2019 / Accepted: 23 November 2019 / Published: 26 November 2019

Abstract

:
This paper presents a hybrid methodology to analyze the commercial measures of changing stator windings and adjusting air gap length to upgrade efficiency of typical three-phase direct-on-line induction motors with die-cast copper rotor (DCR). The calculation is carried out through combining the time-stepping and time-harmonic finite element analysis (FEA) and the circuit equivalent circuit model. Typical full-load performance of stator windings with different air gap lengths are computed by MATLAB invoking the 2D transient and eddy current field analysis in ANSYS/MAXWELL. Then, MATLAB scripts about post-processing of the FEA results are used to obtain the full-load running performance including the loss distribution and circulating current. The MATLAB scripts of circuit model built based on the FEA results is used to compare the overload and starting performance. After that, four stators with the four windings and three DCRs with different air gap of an 11 kW motor are fabricated and tested to validate the calculations. By comparing results from both calculations and measurements, it is shown that the factors of stator windings and air gap length can effectively improve the efficiency of the 11 kW DCR induction motor without the addition of extra materials. The motor with the 11/12 pitch Y-Δ series winding and 0.6 mm air gap has the best performance, in terms of efficiency, overloading capability and starting performance. Its efficiency can increase from 90% to the highest 92.35% by sole adjustment of stator winding and air gap length.

1. Introduction

Energy issues have caused motor designers, manufacturers and users to pay more attention to efficiency when applying electric motors to production and daily life, as they consume roughly two-thirds of all the electrical energy used by industrial or commercial applications in industrialized countries [1]. Three-phase squirrel-cage induction motors are one of the most widely used motor types in various fields [2,3,4], therefore it is extremely meaningful to increase the efficiency of this kind of motor.
Many technical measures have been investigated for improving the efficiency of induction motors. The higher efficiency can usually be achieved by increasing the active materials, such as increasing the stack length [5,6], in induction motors. Another measure of upgrading materials such as premium electrical grade lamination steel is used for decreasing core losses and Ohmic losses [6,7,8]. The efficiency can also be improved by enhancing the performance of cooling and bearing systems to reduce the mechanical losses [7] and improving cooling performance to make Ohmic losses less significant [9]. These methods either rise the raw material cost or increase manufacturing complexity. Although geometry optimization techniques [10,11,12,13,14,15,16] can be used to increase the efficiency of induction motors without increasing the active materials, this technique ends up producing a different design from the original one. Consequently, a new stator and rotor punching mold is required and additional cost results. It can be seen that in practice these measures can only be used to design a new motor, therefore many manufacturers have paid more attention to ways of increasing the efficiency of their induction motors with the least cost. That means the techniques should change construction or parameters of the existing motors as little as possible. Die-cast copper rotor (DCR) technology that involves the development of heated nickel-base alloy dies presents a potential route to design high efficiency induction motors [5,6,17]. Therefore, cast aluminum rotors of typical existing induction motors are replaced with DCRs without changing any rotor parameters. Besides, it is convenient to adjust the air gap length of the rotor. Another useful technique is to change the stator winding [18,19,20,21,22], such as Y-Δ hybrid windings [18,19,20], concentric single-double layer windings [21] or adjust the parameters of single layer and double layer windings [22], to increase motors efficiency. Therefore, techniques for changing the type of stator windings and the air gap length are investigated in this paper.
Many calculation methods have been developed to predict the running performance of induction motors [2,21,23,24,25,26,27,28]. The steady-state performance of induction motors, including losses distribution, can be obtained by improving algorithms in FEM [2,23,24,25], but this method usually need researchers to write their own FEM program, which may be too complex to realize by other researchers and manufacturers. The steady-state and transient-state of induction motors can be carried out through circuit models [2,21,26,27,28]. Researchers have used FEM to determine the parameters of the equivalent circuit model which considers the impacts of stray losses and harmonic torques [26]. The equivalent circuit is able to calculate the stray load losses of induction motors through modifying its structure based on motor power balance [27]. Based on the manufacturer’s data, the parameters of the equivalent circuit model are optimized to improve its precision of calculating starting and full-load performance [28]. The transient-state performance of induction motors, such as starting and overload performance, is always determined through circuit models with inductances [2,21]. Although these methods can calculate the transient-state and steady-state performance, it is not easy to calculate the full-load, starting and overload performance of induction motors at the same time.
This paper aims to develop a hybrid methodology using the commercial software MATLAB to invoke ANSYS/MAXWELL to compute the effect of commercial measures, such as changing the type of stator windings and the air gap length, to increase the efficiency of an 11 kW direct-on-line induction motor with a DCR. The calculation method, which consists of the combined 2D time-stepping finite element method (FEM), 2D eddy current field and analytical formulas, is applied to evaluate the influence of the measures on the full-load performance including losses distribution, circulating zero-order current in the stator windings. Additionally, characteristics of the overload and starting performance are investigated. Finally, an experimental setup is established to validate the proposed ideas.

2. Hybrid Methodology

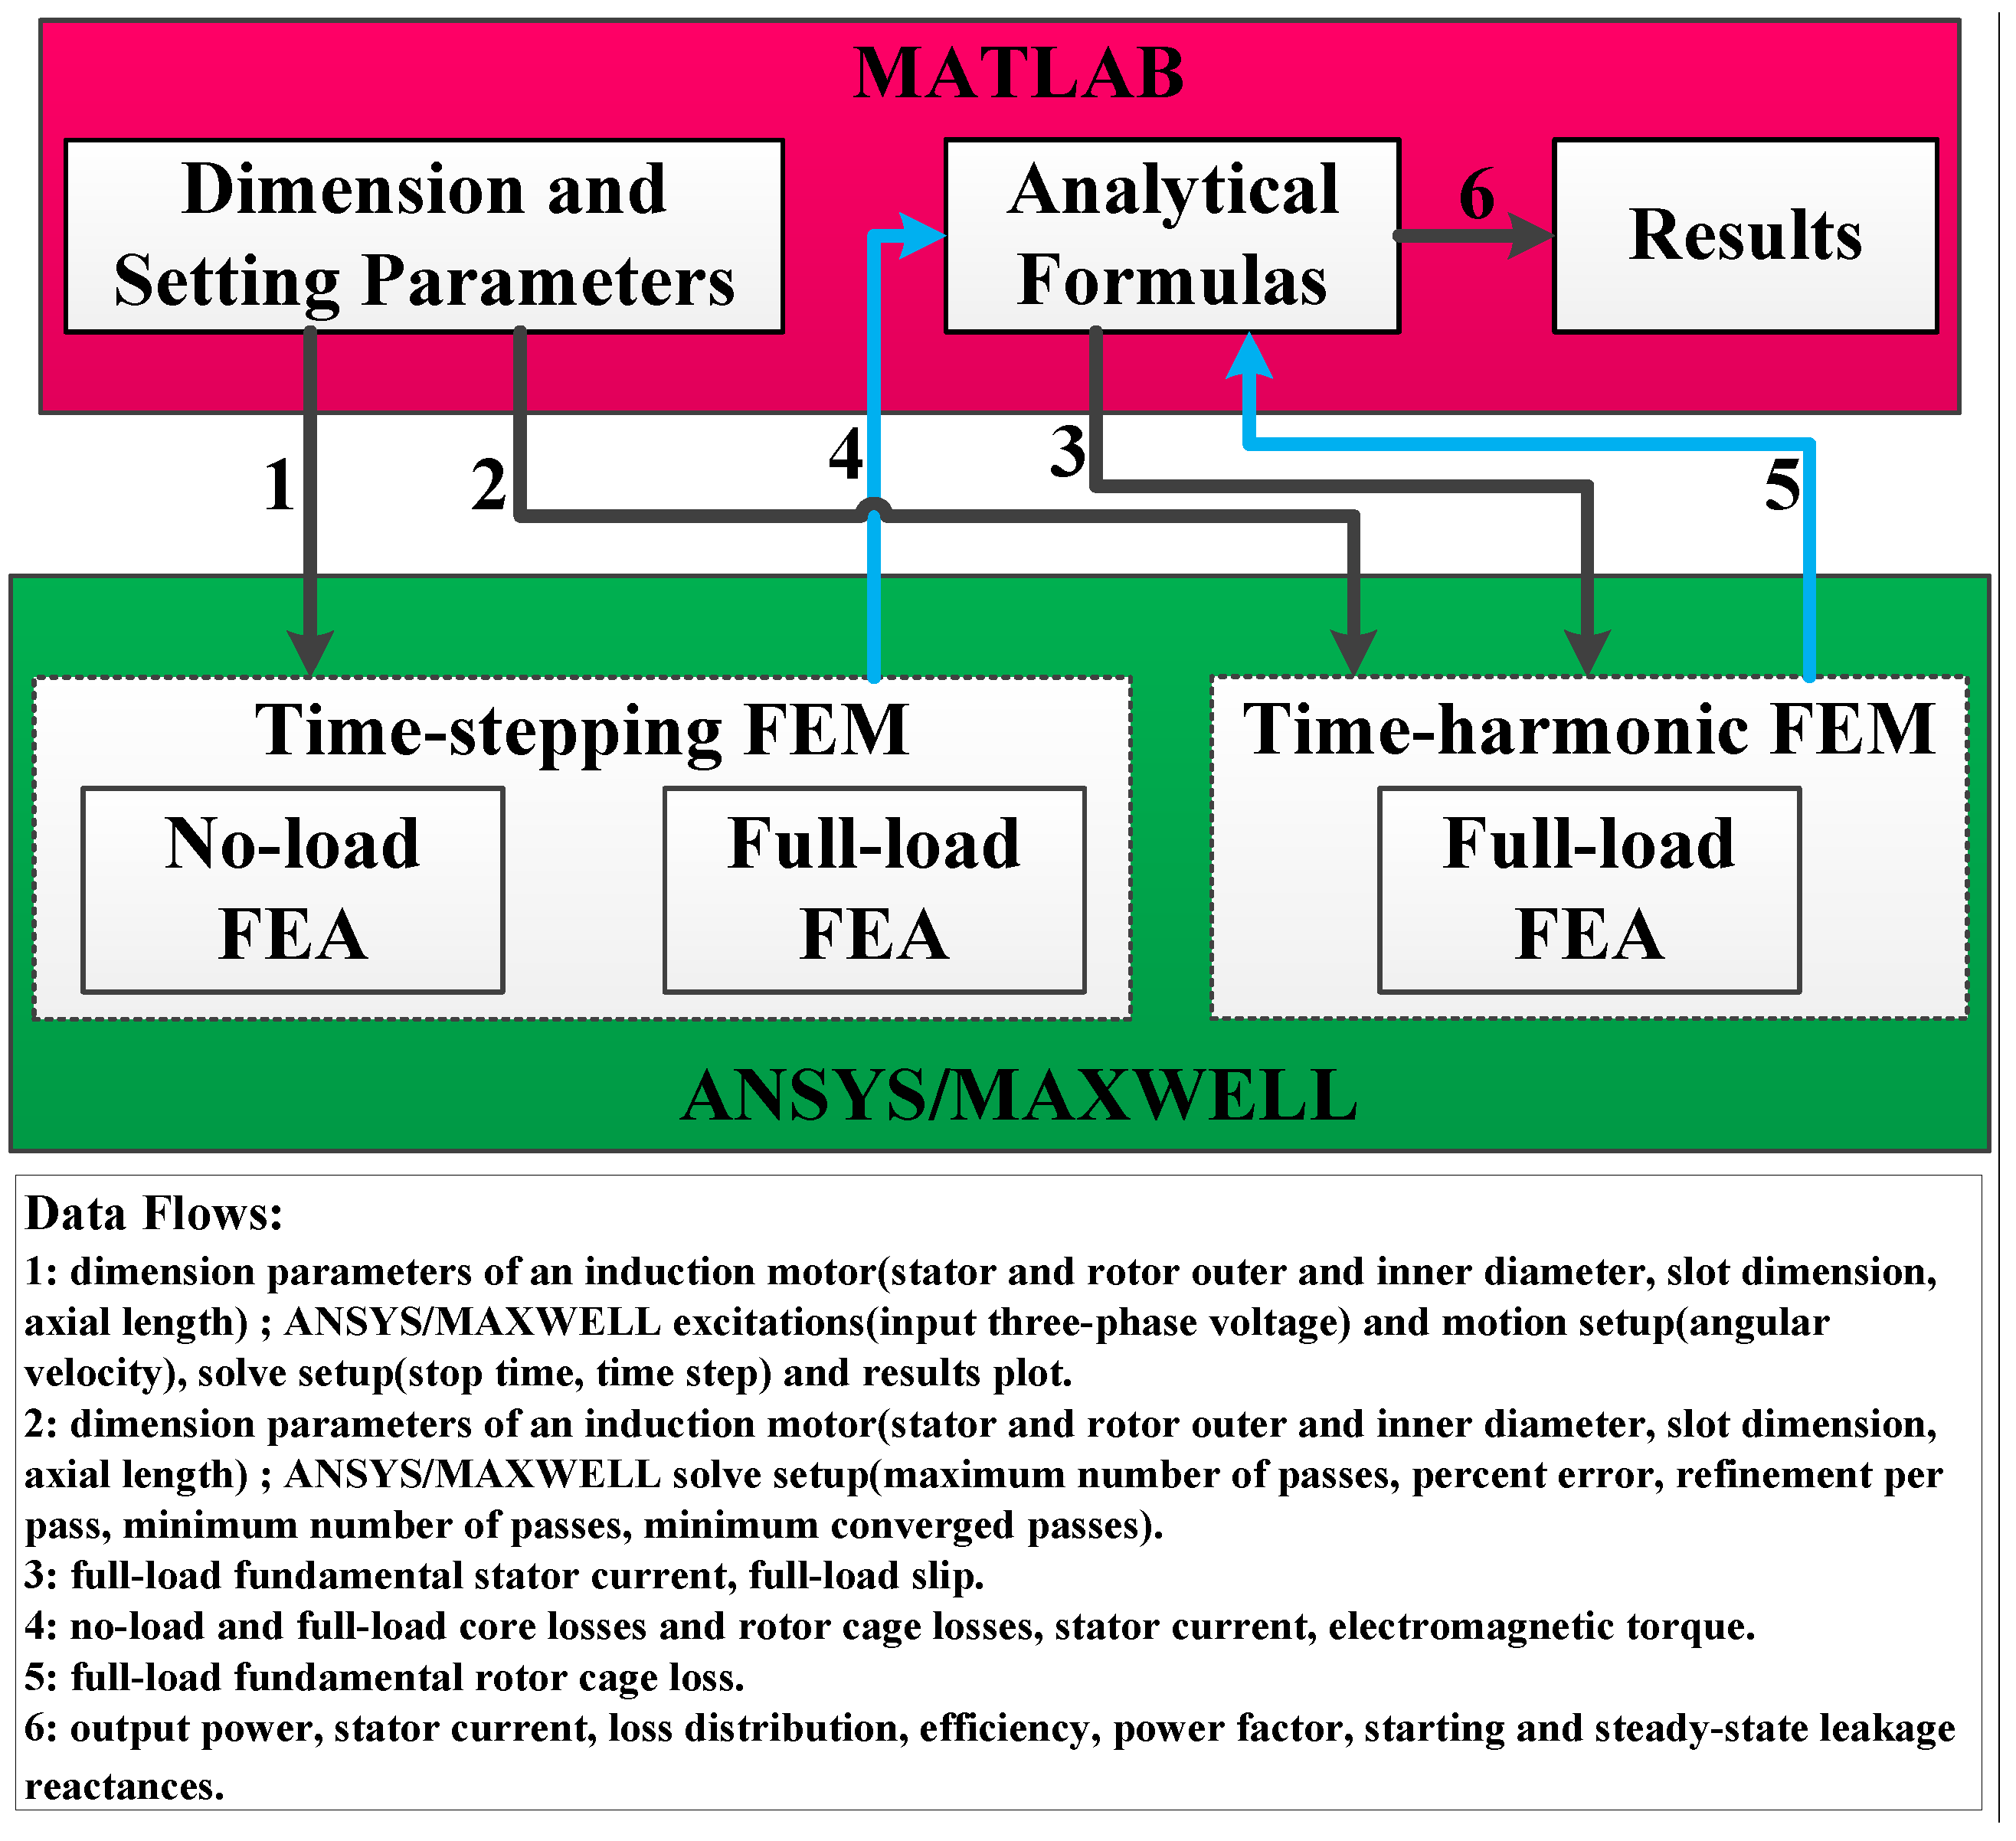
2.1. Program Structure

The aim of this paper is to develop a hybrid methodology to analyze the influence of commercial measures to comprehensively increase the efficiency of induction motors on full-load, performance while their overload and starting performance does not degenerate. Note that 2D finite element models are used in this paper because the commercial measures concerned, such as changing the type of stator windings and the air gap length, have no important influence on end-winding field. If some other measures that change the end-winding field were to be implemented, 3D models should be used instead of 2D ones. Figure 1 shows the detailed structure of the calculation method. The calculation is realized based on the commercial software MATLAB and ANSYS/MAXWELL. Specifically, a MATLAB program is written to assign values to the dimension of an induction motor and the settings in ANSYS/MAXWELL. Therefore, it is convenient to change the parameters of the induction motor. Then the program invokes ANSYS/MAXWELL to build 2D finite element model of the induction motor. After that, the MATLAB program activates the 2D transient field analysis to conduct time-stepping finite element analysis (FEA) at no-load and full-load condition. Then, the results of time-stepping FEA will be processed to obtain the results of no-load and full-load fluxes, currents and losses by the MATLAB program. Based on the full-load results, the MATLAB will invoke the eddy current field analysis to conduct the full-load FEA to get the fundamental losses. Finally, some analytical formulas and the FEA results are used to calculate the leakage reactance in order to analyze the starting and overload performance of induction motors through the MATLAB program. It should be noticed that the MATLAB program also conduct post-processing, such as FFT analysis and mathematical operations, to obtain power factor, efficiency, harmonic current and so on. In order to be more understandable about the hybrid methodology, a substantial portion of the MATLAB codes for invoking and dealing with the no-load simulation are presented in the Appendix A.

2.2. Full-Load Performance Calculation

Since the main purpose of the hybrid methodology is to analyze the efficiency of commercial measures on full-load condition, loss calculation is an important part in the calculation. The eddy current loss of rotor end-rings is assumed to be same to simplify the loss calculation. The total losses P l L o a d of the induction motor at full-load condition can be defined by:
P l L o a d = P 1 c o p p e r L o a d + P i r o n N o L o a d + P 2 c a g e F L o a d + P s L o a d + P m
where P 1 c o p p e r L o a d is the copper loss of the stator windings under full-load conditions, P i r o n N o L o a d is the no-load core loss, P 2 c a g e F L o a d is the fundamental eddy current loss of the rotor squirrel cage under full-load, P s L o a d is the full-load stray loss and P m is the mechanical loss. The mechanical loss P m can be calculated by an empirical equation [21].
In the calculation, the mechanical loss P m is calculated based on the steady-state speed under full-load conditions. The electromagnetic losses consist of P 1 c o p p e r L o a d , P i r o n N o L o a d , P 2 c a g e F L o a d and P s L o a d , colored in Figure 2.
Figure 2 shows that 2D time-stepping and time-harmonic FEM are combined to calculate all these magnetic losses through ANSYS/MAXWELL 2D. Figure 3a shows the 2D model and its mesh. The half model is used because of electromagnetic symmetry, and its total number of mesh elements is roughly 16,000 whose results are almost the same as the results of the roughly 26,000 elements obtained by mesh refinement.
The grade of electrical steel laminations used in the induction motor is DW470-50 whose curve of flux density B versus magnetic field strength H is shown in Figure 3b. The calculation process is as described below.
Firstly, the no-load and full-load performance of the induction motor is computed by the classical field-circuit coupled 2D time-stepping FEM coupled with the primary voltage equation, in which the resistance and end-winding leakage inductance of the stator winding and rotor cage are calculated by the analytical formulas [21]. For a 2D XY problem, the vectors have only one component in the z-direction. The 2D time-dependent magnetic equation [29] of an induction motor is expressed as:
× υ × A = J S σ d A d t
where υ is the reluctivity, A is the magnetic vector potential, σ is the conductivity, t is the time, J s is the source current density that is given by [29]:
J S = d f N f i f S f a · p
where d f is the polarity (+1 or −1) to represent forward or return paths of stator windings, N f is the total conductor number of the filaments in the winding, S f is the total area of the cross-section of the region occupied by the winding, a is the number of parallel branches in the winding, p is the ratio of the original full model to the field domain to be solved, i f is the total terminal current flowing into a filament winding which is calculated by:
u S = d f N f L S f a d A d t · d Ω + ( R d c + R e n d + R e x t ) · i f + ( l e n d + l e x t ) · d i f d t
where L is the axial length, R d c is the total DC resistance of the straight portion of the stator windings, R e n d is the end-turn resistance of the stator windings, L e n d is the end-turn inductance of the stator windings, u s is the source voltage of the stator windings, Ω is the cross-section of the conductors.
The magnetic vector potential A and current is obtained through Equations (2)–(4), then other parameters, such as the magnetic flux, electromagnetic torque, etc., are calculated. The input of the time-stepping FEM is the voltage source of stator windings and the rotor rotating speed. The no-load speed is set at the synchronous speed ns (unit: rpm). The full-load simulation proceeds as follows. Note that searching the input of the full-load speed is realized by a MATLAB script with the secant method:
(1)
Assuming rotating speeds n1 and n2 (n1n2, unit: rpm) that are a little less than the synchronous speed as the input speeds, calculate their output torques T1 and T2 by the time-stepping FEM and the empirical equation [21], respectively. Note that output torque Tj is calculated by:
T j = T e m ( 3 / p ) 3 · ( D 1 o u t ) 4 π n j / 30 × 10 4 , j = 1 , 2 , 3 ,
In Equation (5), p denotes the number of pole pairs, D1out denotes the stator outer diameter and its unit is m, Tem denotes the electromagnetic torque computed by the time-stepping FEM. If:
| T 1 T n | ε or | T 2 T n | ε
then the speed fulfilling Equation (6) is the full-load speed and the algorithm goes to Step 4; otherwise, subscript i = 3 and the algorithm goes to Step 2. In Equation (6), Tn denotes the full-load torque 70.8 Nm corresponding to 11 kW output power and ε denotes the allowable error.
(2)
Calculate the speed ni by:
n i = n i 1 T i 1 T n T i 1 T i 2 ( n i 1 n i 2 ) , i = 3 , 4 , 5 ,
then calculate the output torque Ti (i = 3, 4, 5, …) by the time-stepping FEM and (5).
(3)
If:
| T i T n | ε
then ni is the full-load speed and the algorithm proceeds to Step 4; otherwise i = i + 1 and the algorithm goes to Step 2.
(4)
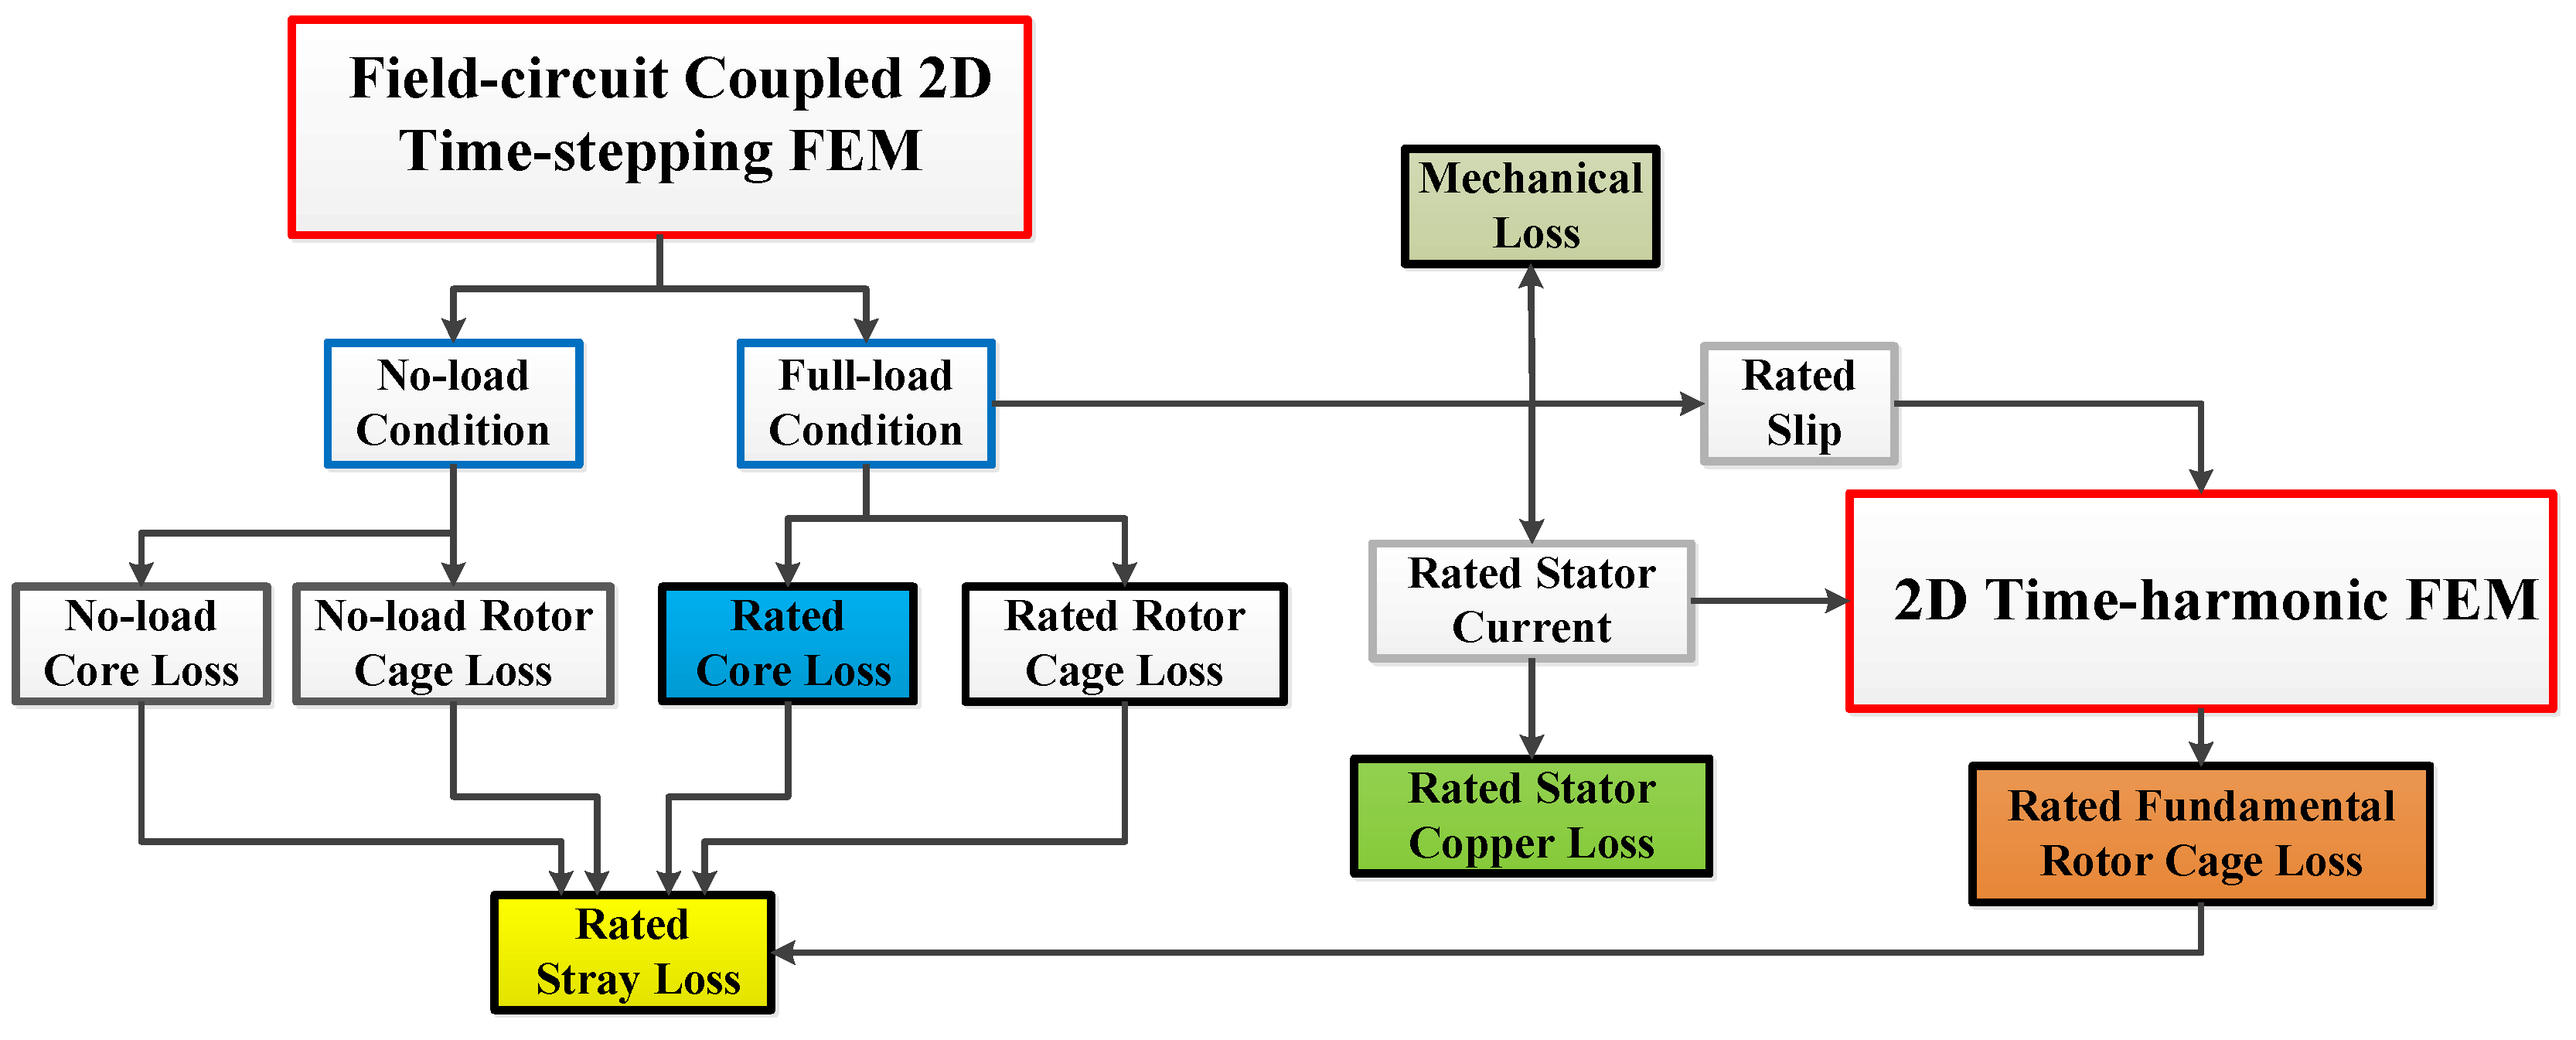
Using the full-load speed calculate the full-load results. By solving the electromagnetic equations coupled to the primary voltage equation, they are obtained that the stator current I1m at each phase m (m = A, B, C.), and the current density of the rotor bar Jr. Then the copper loss of stator windings P 1 c o p p e r L o a d and the total eddy current loss of the rotor squirrel cage P 2 c a g e L o a d on full-load condition can be calculated. The full-load core loss P i r o n L o a d and no-load core loss P i r o n N o L o a d are computed based on the magnetic flux.
Then the classical 2D time-harmonic FEA is applied to compute the fundamental eddy current loss of the rotor squirrel cage P 2 c a g e F L o a d . Similarly, the phasors in 2D time-harmonic FEA have only one component in the z-direction. Its equation is:
× υ × A = J S j ω σ A
I = Ω ( J S j ω σ A ) d Ω
where ω is the fundamental frequency, I is the stator winding current. The input of the 2D time-harmonic FEA is the fundamental component of FFT analysis of stator winding current from the 2D time-stepping FEM results. Note that the rotor bar conductivity should be multiplied by full-load slip obtained from the 2D time-stepping FEM results rather than setting the rotor rotating speed. The fundamental eddy current loss of the rotor squirrel cage P 2 c a g e F L o a d can be calculated based on the results of the fundamental current density of rotor bar JrF.
According to the definition in the IEEE standard 112-method B [30], the stray loss is calculated by:
P s L o a d = ( P 2 c a g e L o a d P 2 c a g e F L o a d ) + ( P i r o n L o a d P i r o n N o L o a d )
Finally, all the losses colored in Figure 2 are calculated through the FEA of ANSYS/MAXWELL and its results processed by MATLAB. The efficiency η can be obtained by losses and output power. Power factor cos ϕ is calculated based on the fundamental angle between the phase voltage and the phase current which is computed by FFT analysis. Additionally, circulating currents in Δ windings can be separated from the fundamental currents.

2.3. Overload and Starting Performance Calculation

The overload and starting performance is evaluated based on the T equivalent circuit model. The calculation is shown in the part of “Analytical Formulas” in Figure 1.
The overload performance of an induction motor is determined by its peak torque Tmax. Since R 1 2 ( X σ 1 + X σ 2 ) 2 , the peak torque Tmax can approximately be:
T m a x m p U N φ 2 4 π f ( X σ 1 + X σ 2 ) 1 ( X σ 1 + X σ 2 )
where U N φ is the rated phase voltage, R 1 is the phase resistance of the stator winding, X σ 1 is the total steady-state stator leakage reactance, X σ 2 is the total steady-state rotor cage leakage reactance (reported to the stator). Equation (12) shows the peak torque of induction motors is inversely proportional to the total stator and rotor leakage reactances.
Because the induction motor studied in this paper is direct-on-line starting, it is necessary to analyze the starting performance. The starting torque Tst can be calculated by:
T s t = m p U N φ 2 R 2 ( s t ) 2 π f Z s t 2 1 Z s t 2
where R 2 ( s t ) is the rotor cage resistance (reported to the stator) at starting stage and Z s t is the magnitude of total impedance at start. It should be noticed R 2 ( s t ) is calculated based on skin effect [21].
During starting stage, magnetizing current can be neglected because the voltage drop of stator impedance is much higher than those at the steady-state stage. Therefore, the total starting impedance Z s t can be calculated approximately by the T model:
Z s t ( R 1 + R 2 ( s t ) ) 2 + ( X σ 1 ( s t ) + X σ 2 ( s t ) ) 2
where R 1 is the phase resistance of the stator winding, X σ 1 ( s t ) is the total stator leakage reactance at starting stage and X σ 2 ( s t ) is the total rotor leakage reactance at start (reported to the stator).

3. Specific Commercial Measures for Efficiency Improvement

This paper investigates commercial measures, such as changing the type of stator windings and the air gap length, to further raise the efficiency of an 11 kW three-phase squirrel-cage induction motor with a DCR. The main characteristics are shown in Table 1. It should be noticed that the parameters of die-cast copper rotor are the same as typical cast aluminum rotor of an 11 kW induction motor to reduce manufacturing cost. The distinction between two of them comes from the fact that its rotor squirrel cage has been changed to copper and its outer diameter is adjusted for different air gap lengths.
Two types of stator windings, namely Δ winding and Y-Δ series winding, are studied. The Δ winding is the single-double-layer (S.D.L.) winding. As shown in Figure 4a, the single-double-layer Δ winding, which evolves from the conventional double-layer winding Figure 4b, is generally short pitched. Owning to the change, the end-winding of the single-double-layer winding is shorter than the double-layer winding. Thus, the single-double-layer winding has a smaller phase stator resistance than the overlap winding.
Y-Δ series windings, which are formed in outer-Y-inner-Δ hybrid connection, are shown in Figure 5a. Its loop current in the inner-Δ windings is relatively smaller than the outer-Δ-inner-Y windings. The basic principles of three-phase Δ-Y series windings are shown:
(1)
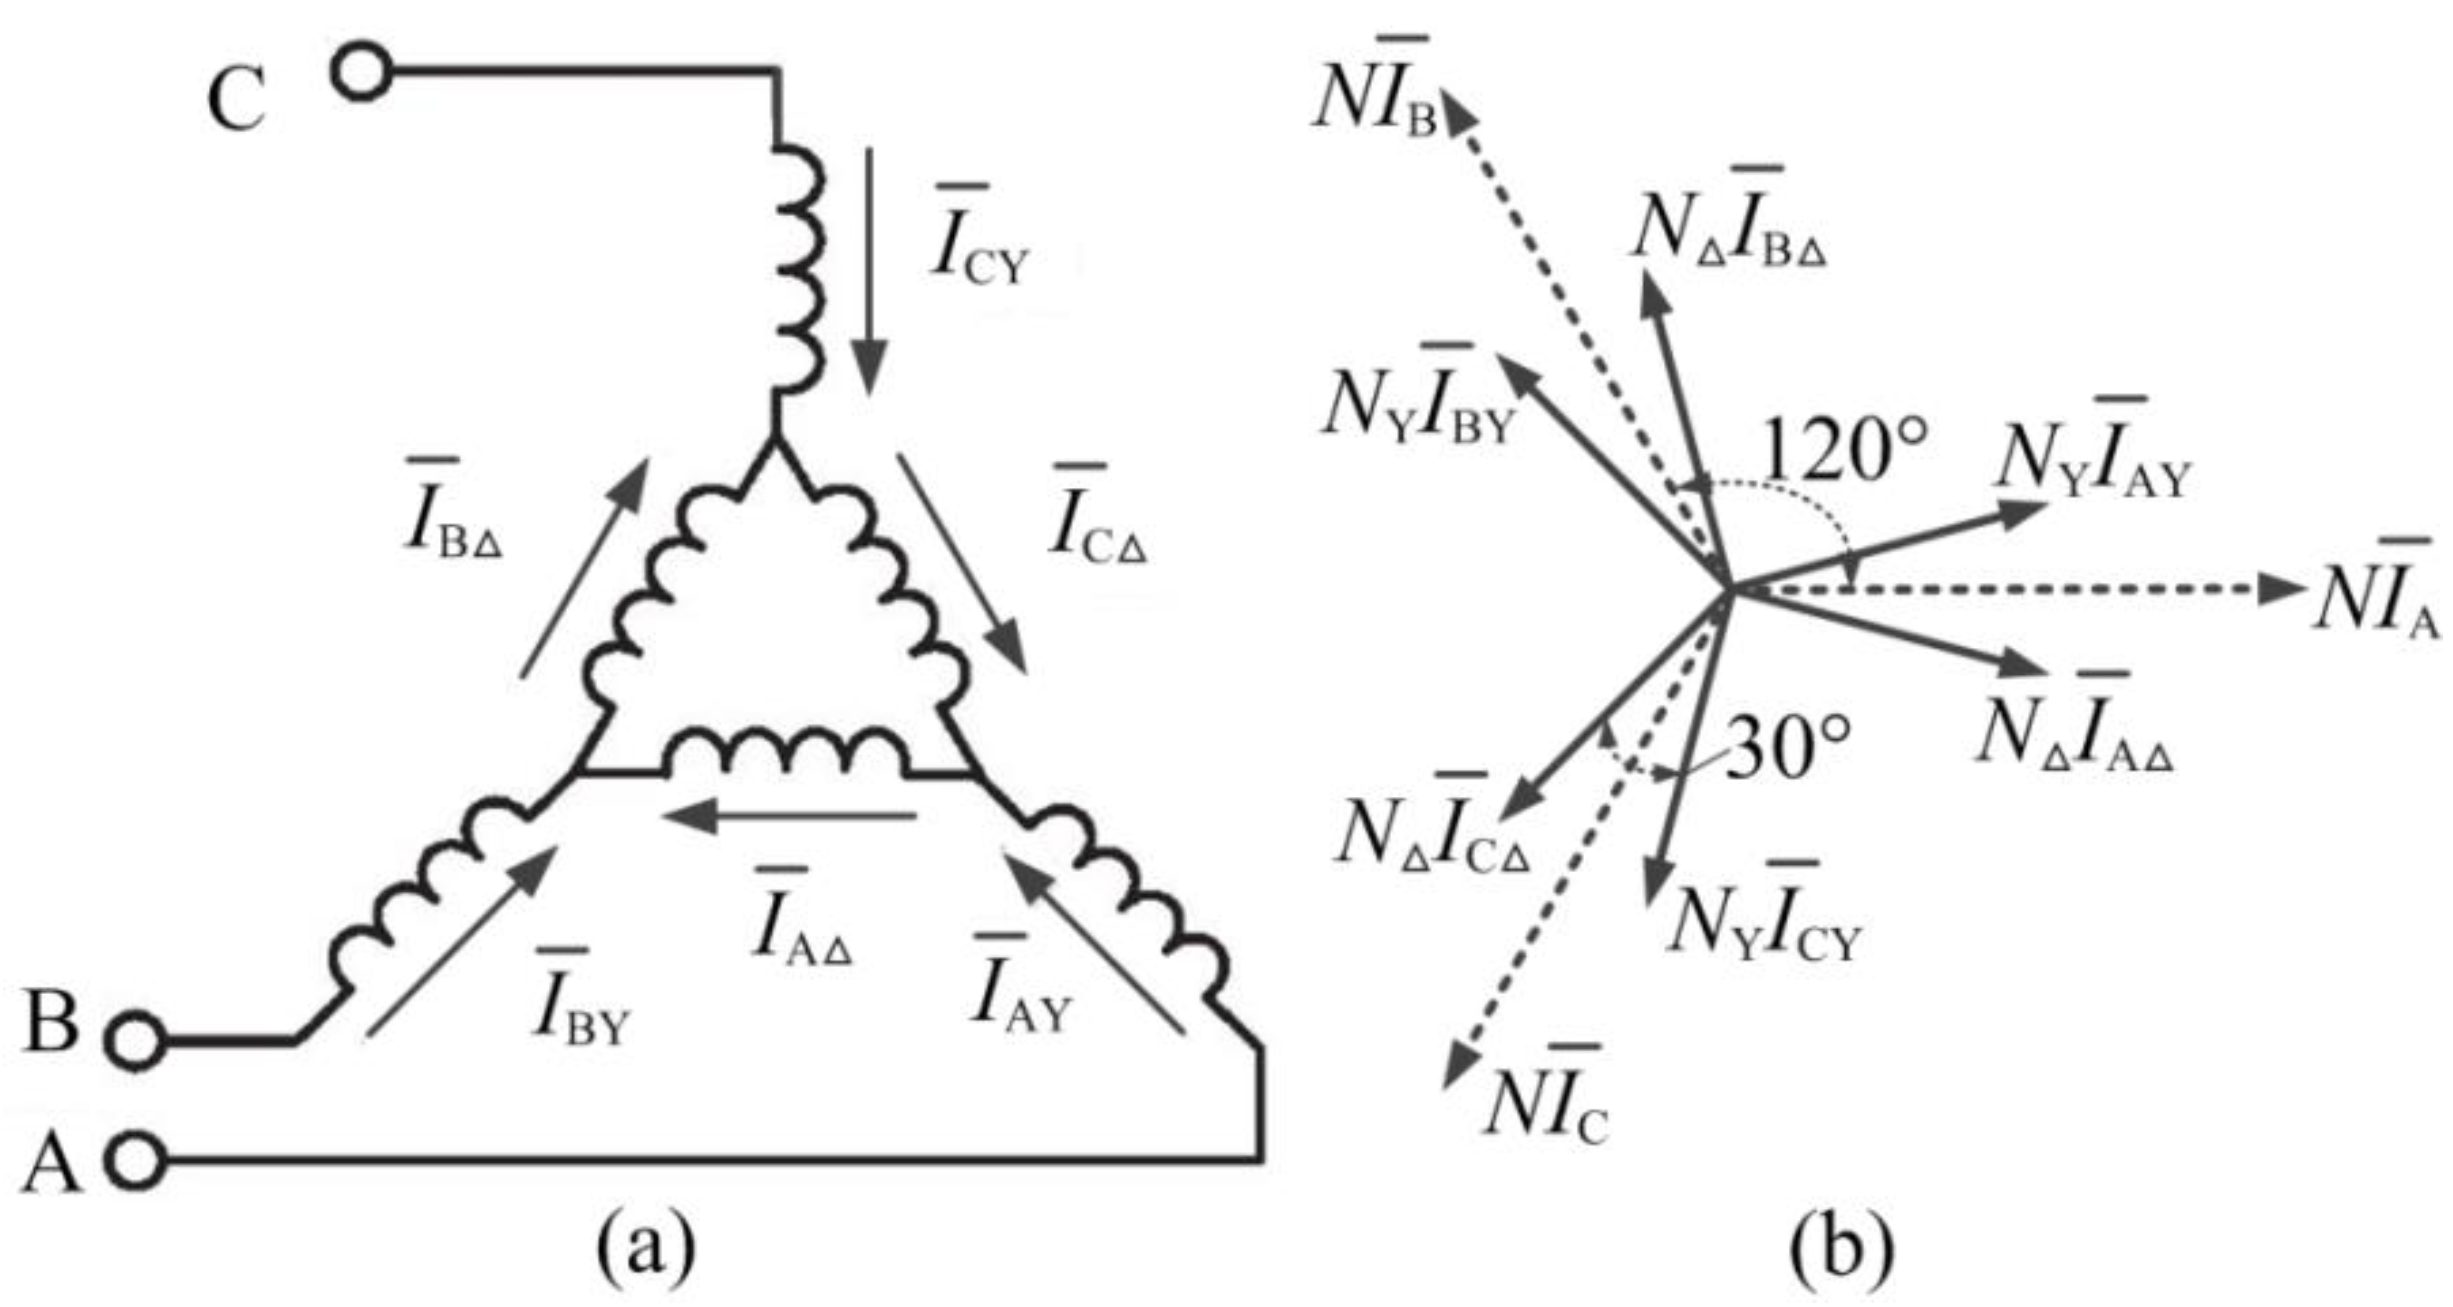
Current density of inner-Δ winding must be equal to the outer-Y.
(2)
Number of turns in series of inner-Δ winding equal to square root of three times as outer-Y windings.
Three typical Y-Δ series windings, namely single-layer Y-Δ series winding, double-layer Y-Δ series winding with a 2/3 pitch and an 11/12 pitch are studied. The winding coefficients of the Y-Δ series windings are higher because of their narrow phase belt.
Table 2 shows the specific parameters of the stator windings, where nstr is number of wires per conductor, and dw is the wire diameter, q is the number of slots per pole per phase, α is the electric angle between two stator slots, y is the coil span in terms of stator slots, and τ is pole pitch in terms of stator slots, p is the number of pole pairs, R1sm is the phase resistance of stator windings, N is the number of turns in series per phase. The four windings are numbered to simplify the introduction in Table 2. As the number of turns in series per phase N must be an integer number and the four types of windings are designed to keep the same fundamental magnetomotive force (MMF), NΔ/NY of Y-Δ series windings are close to 3 . The cross-sectional area per conductor of the outer-Y winding must be approximately 3 times larger than those of the inner-Δ winding in order to make the current density to be the same. The number of parallel branches of these four stator windings is 1.

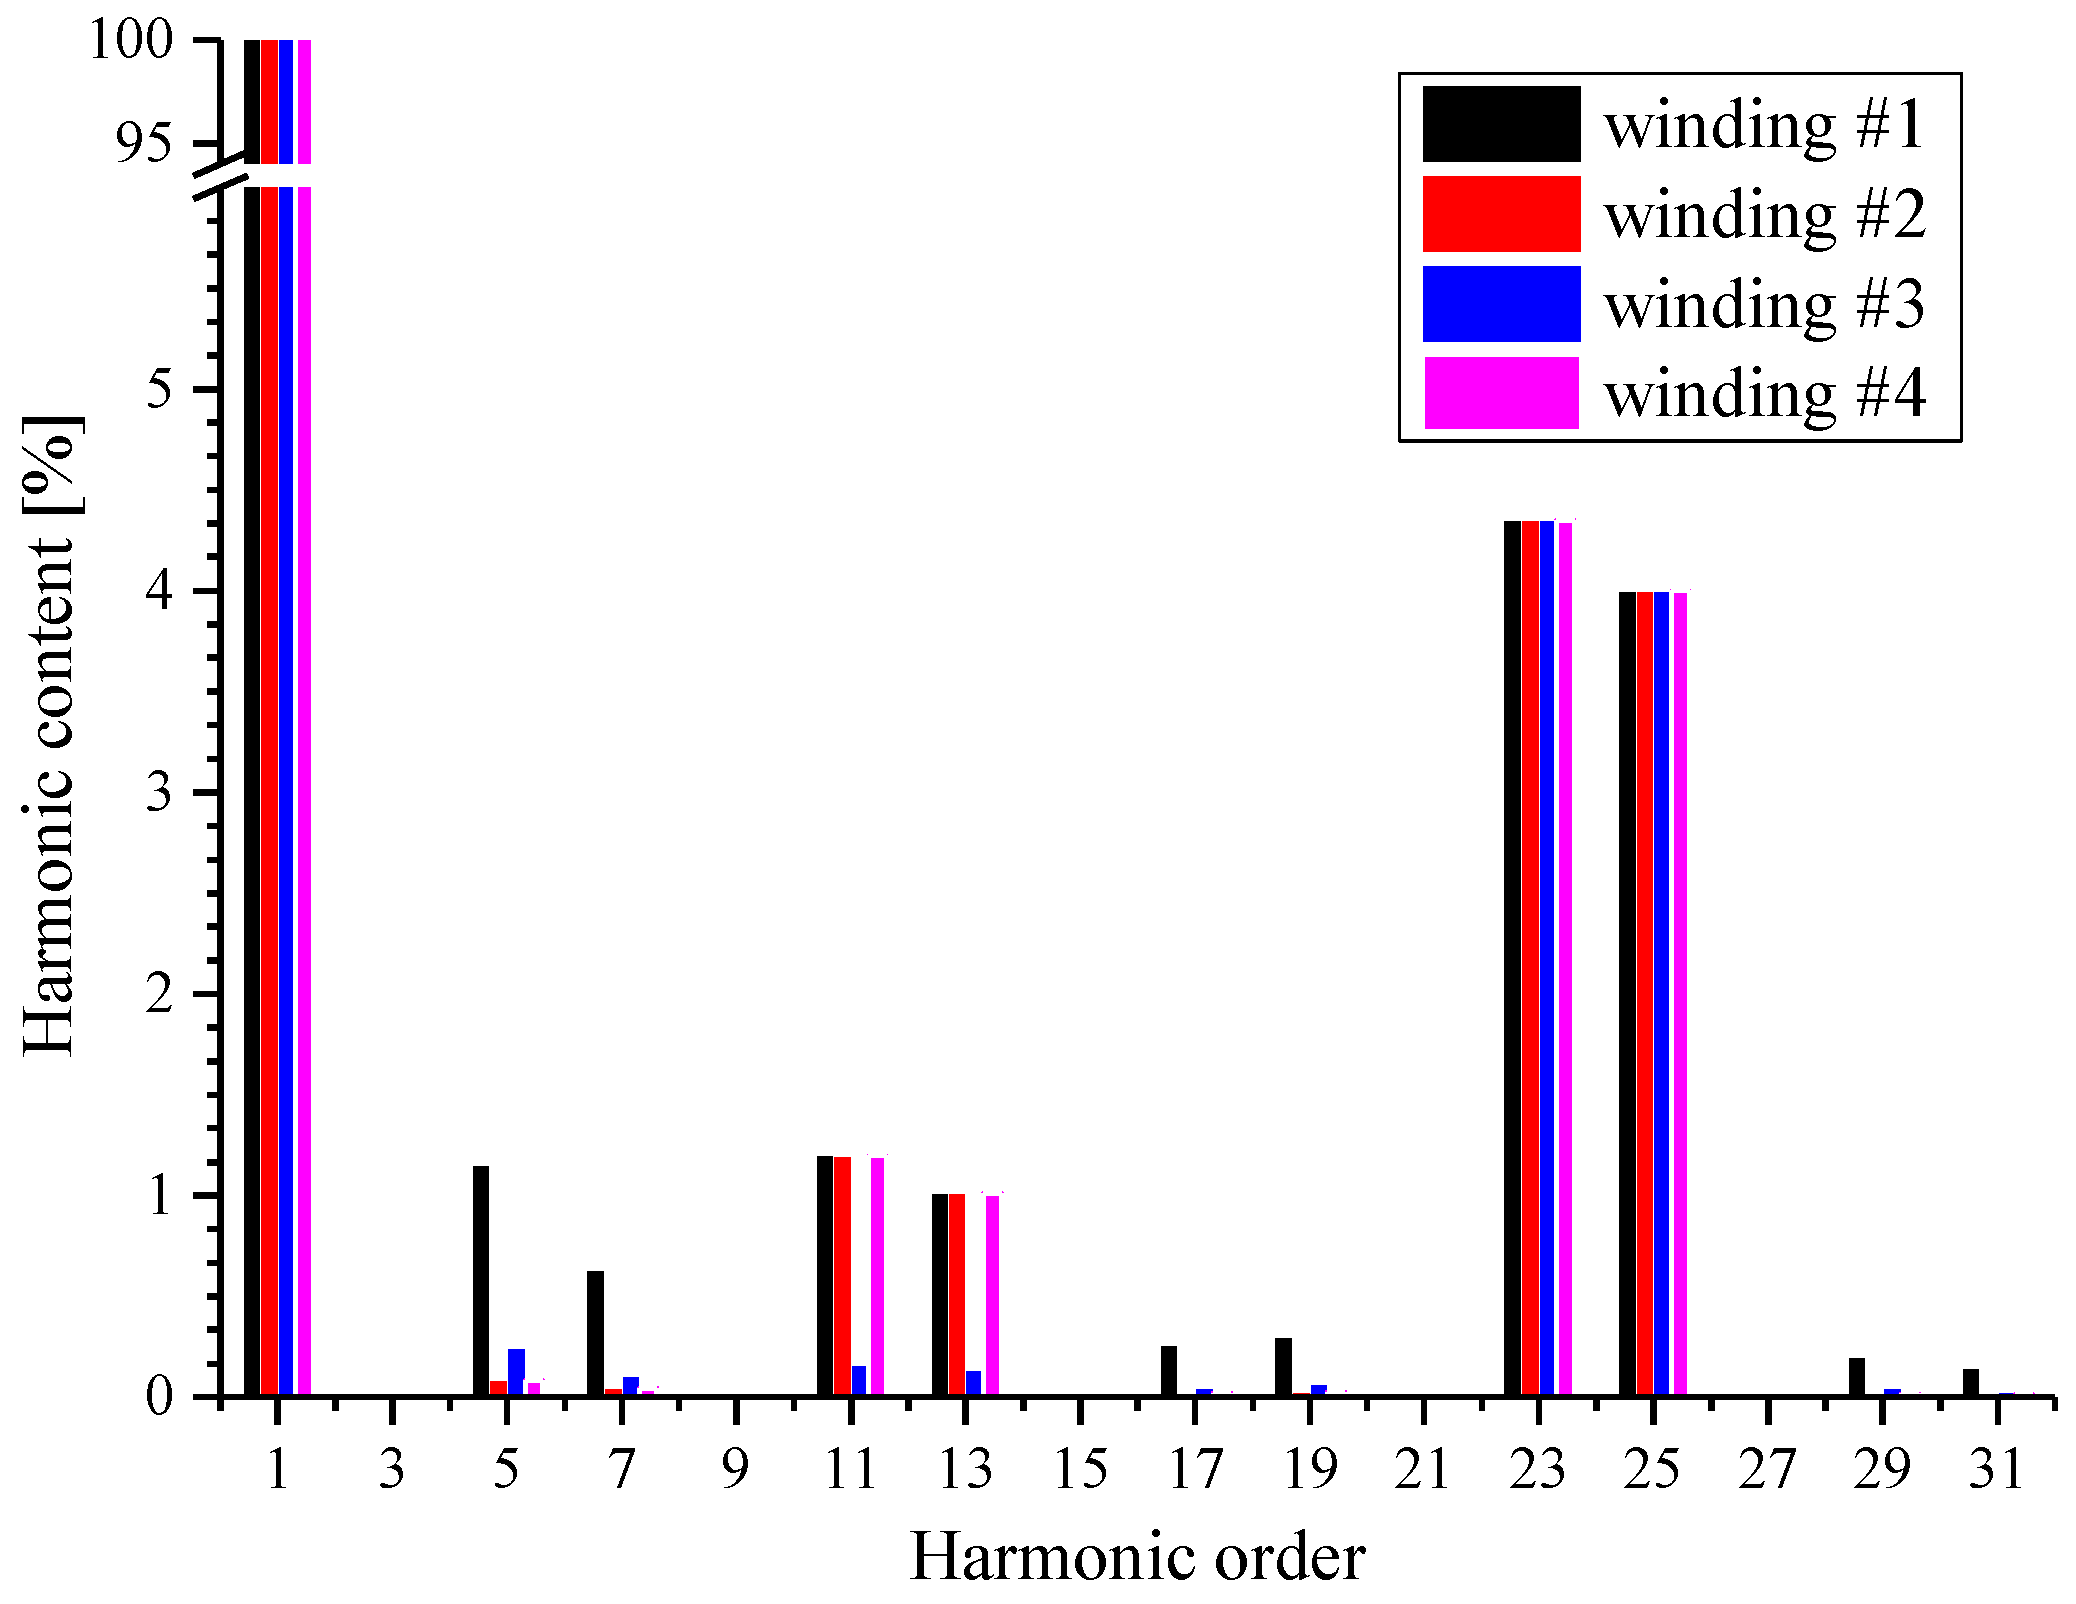
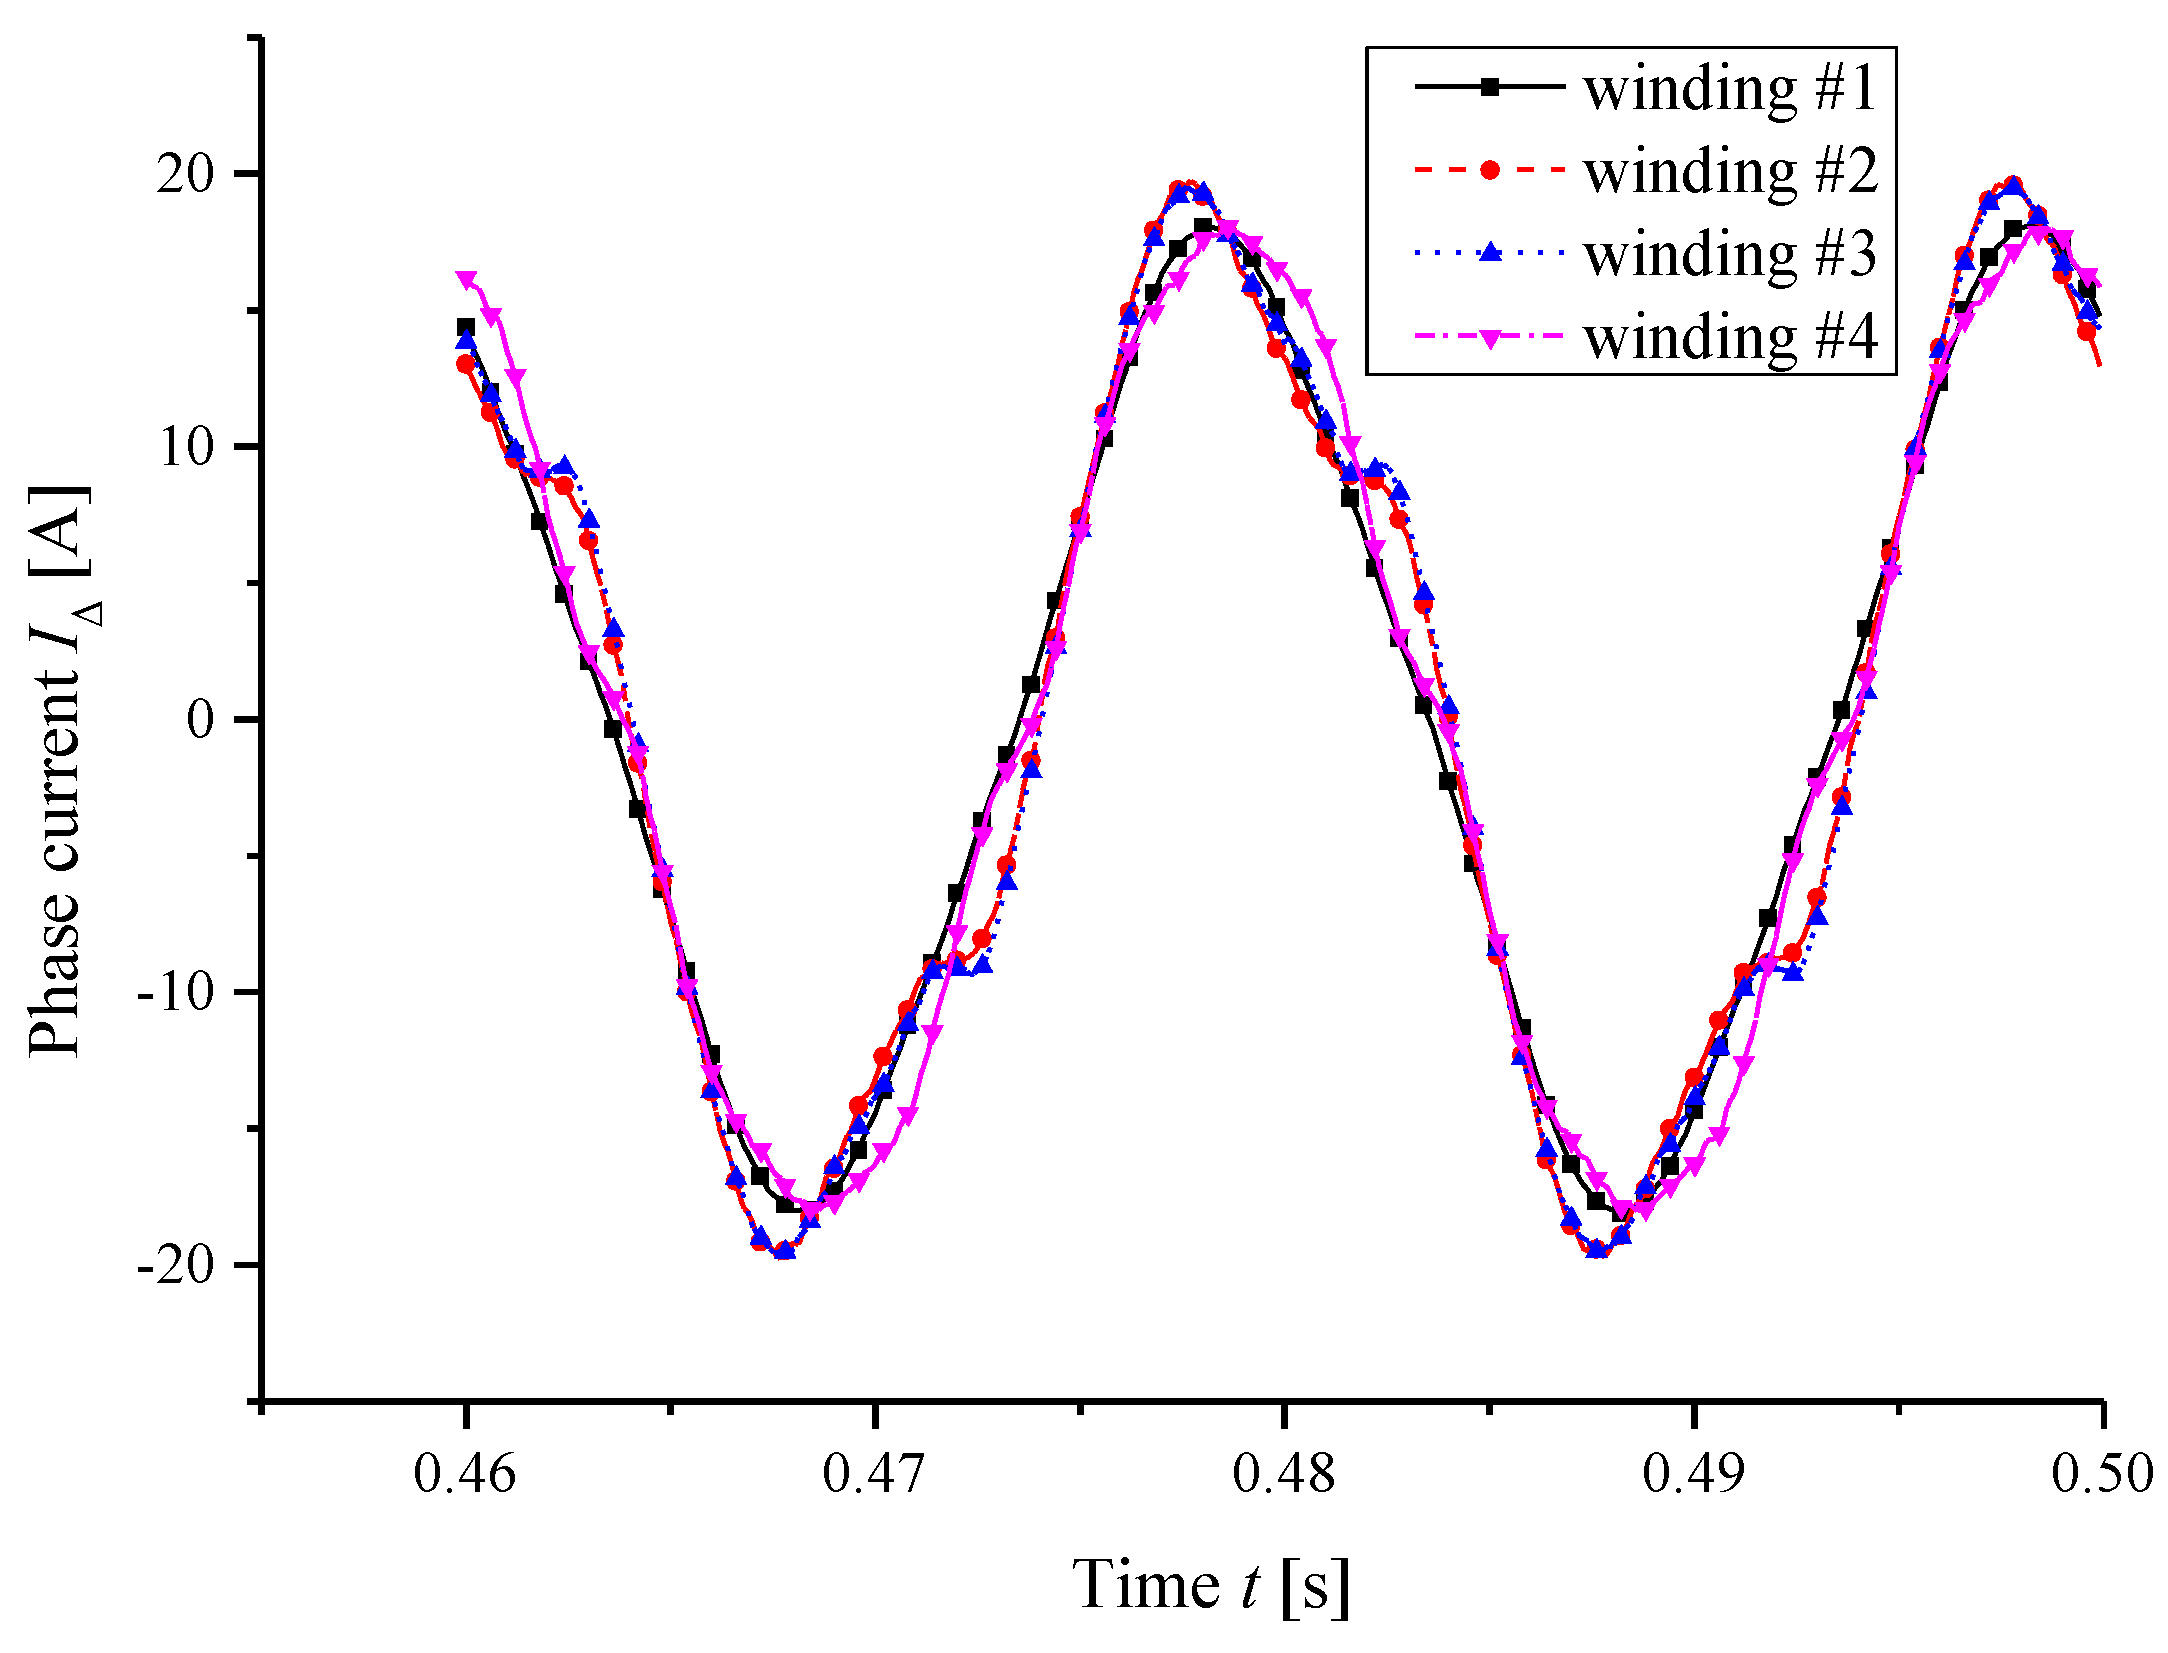
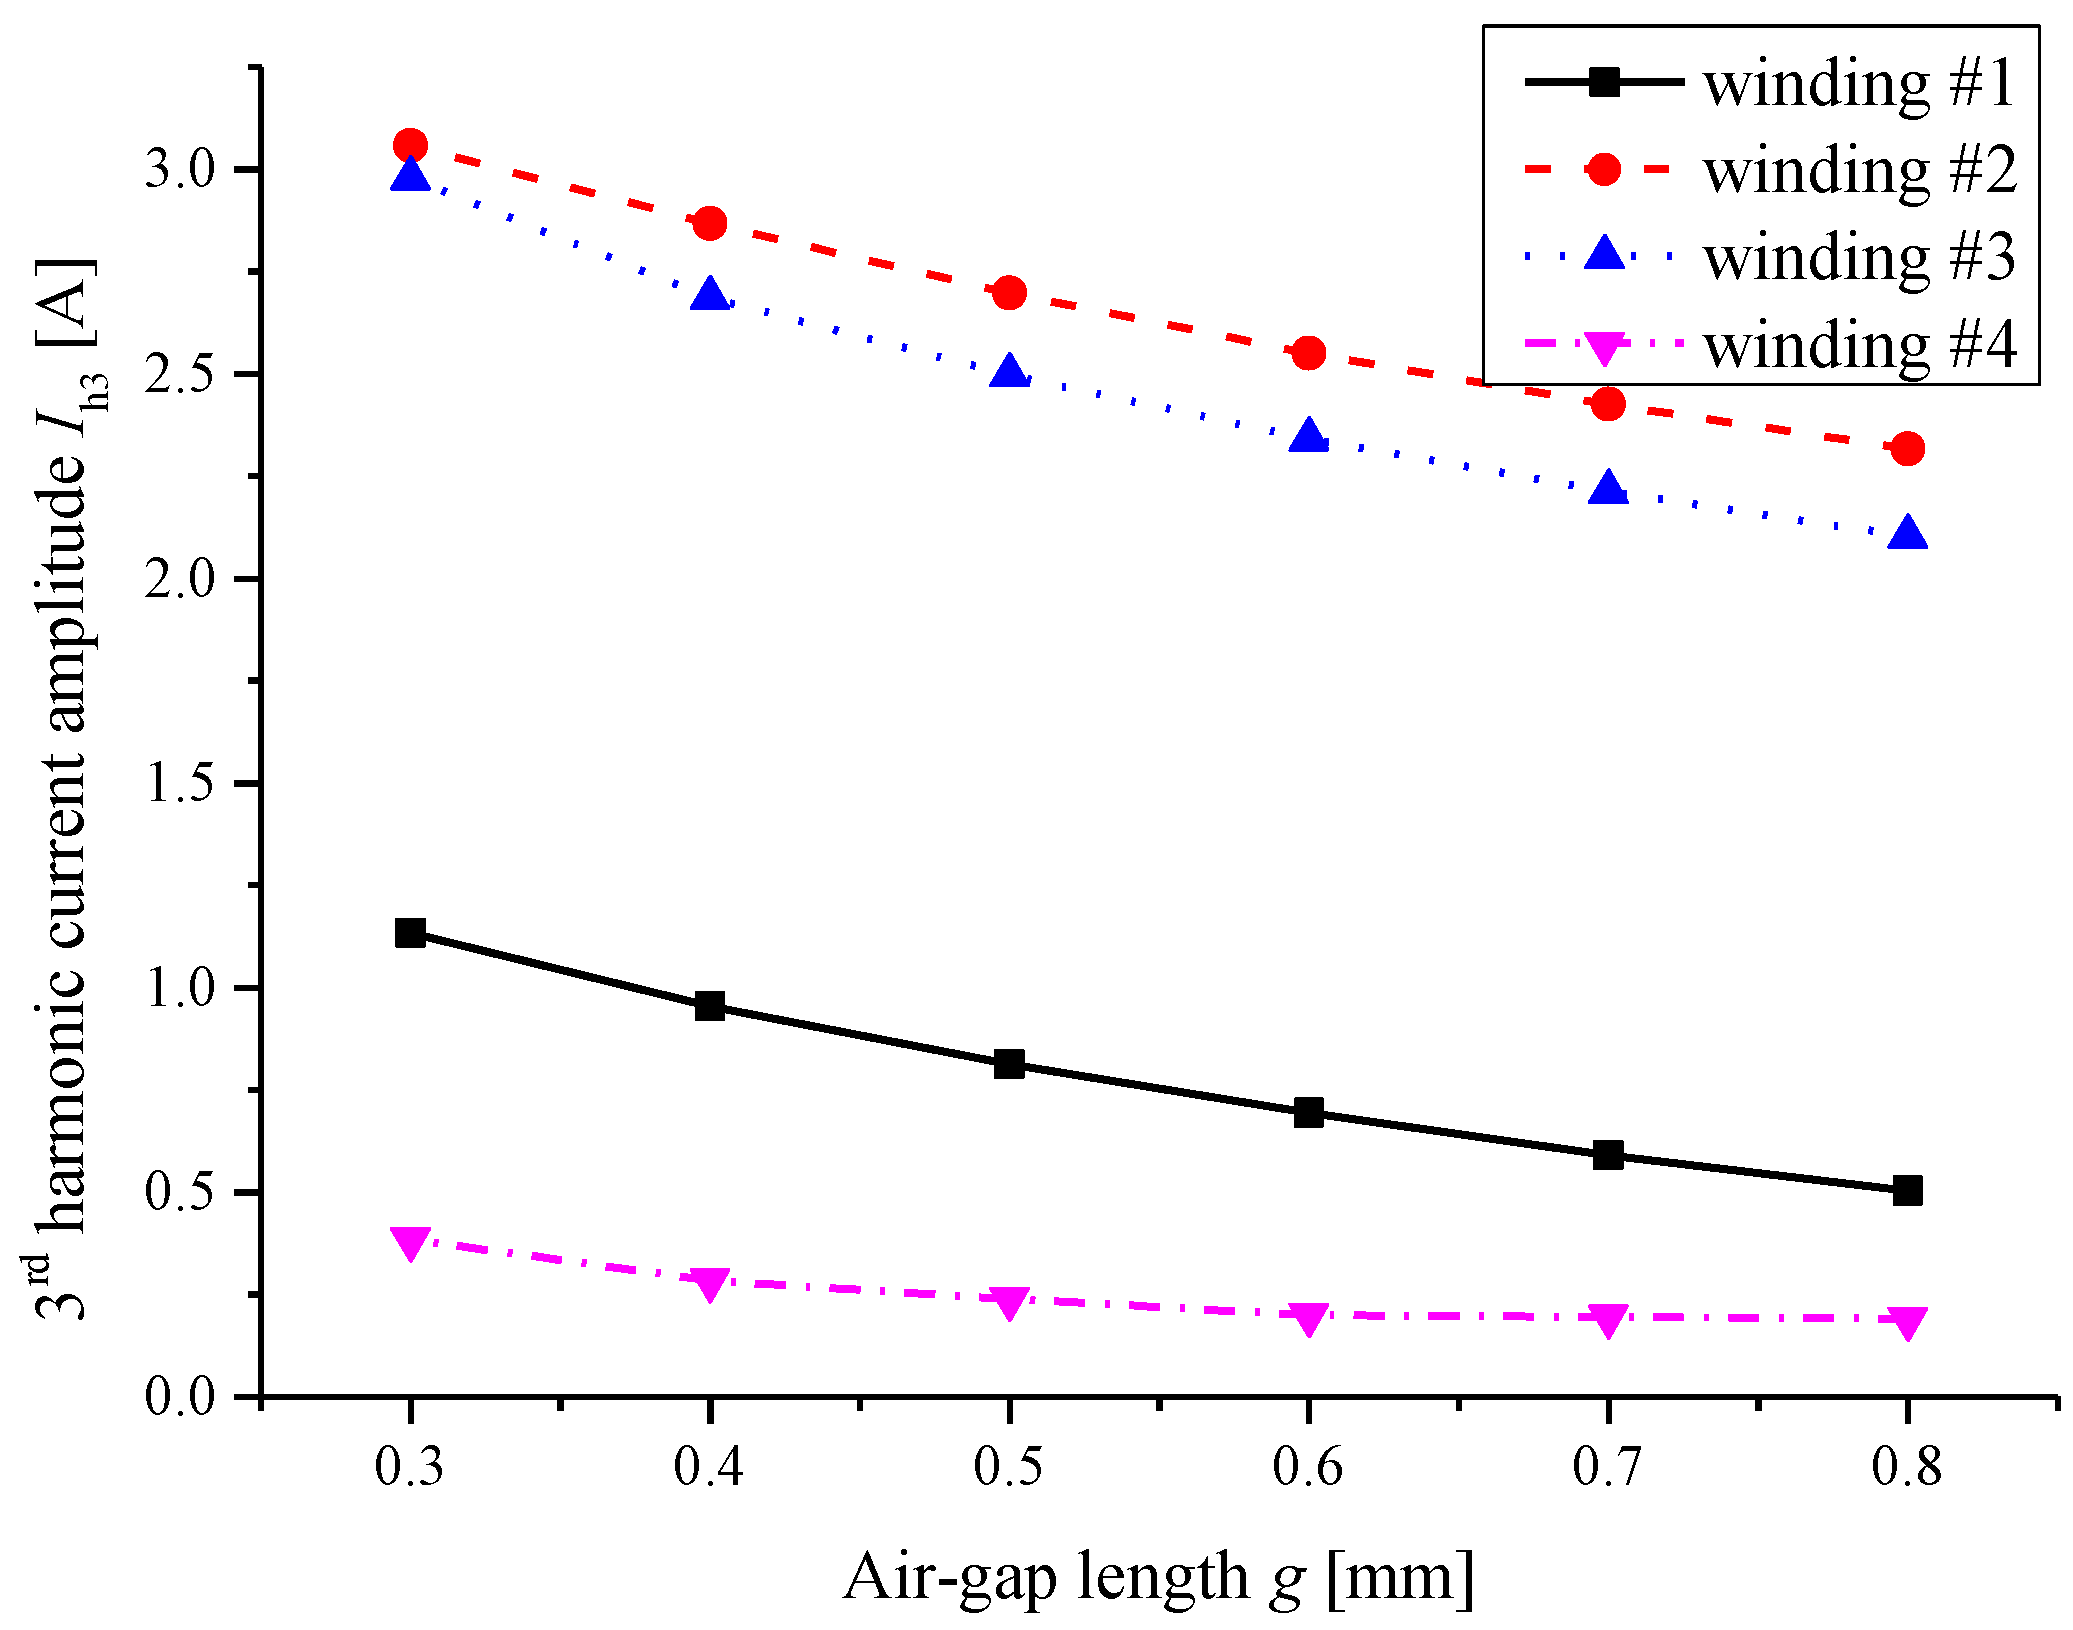
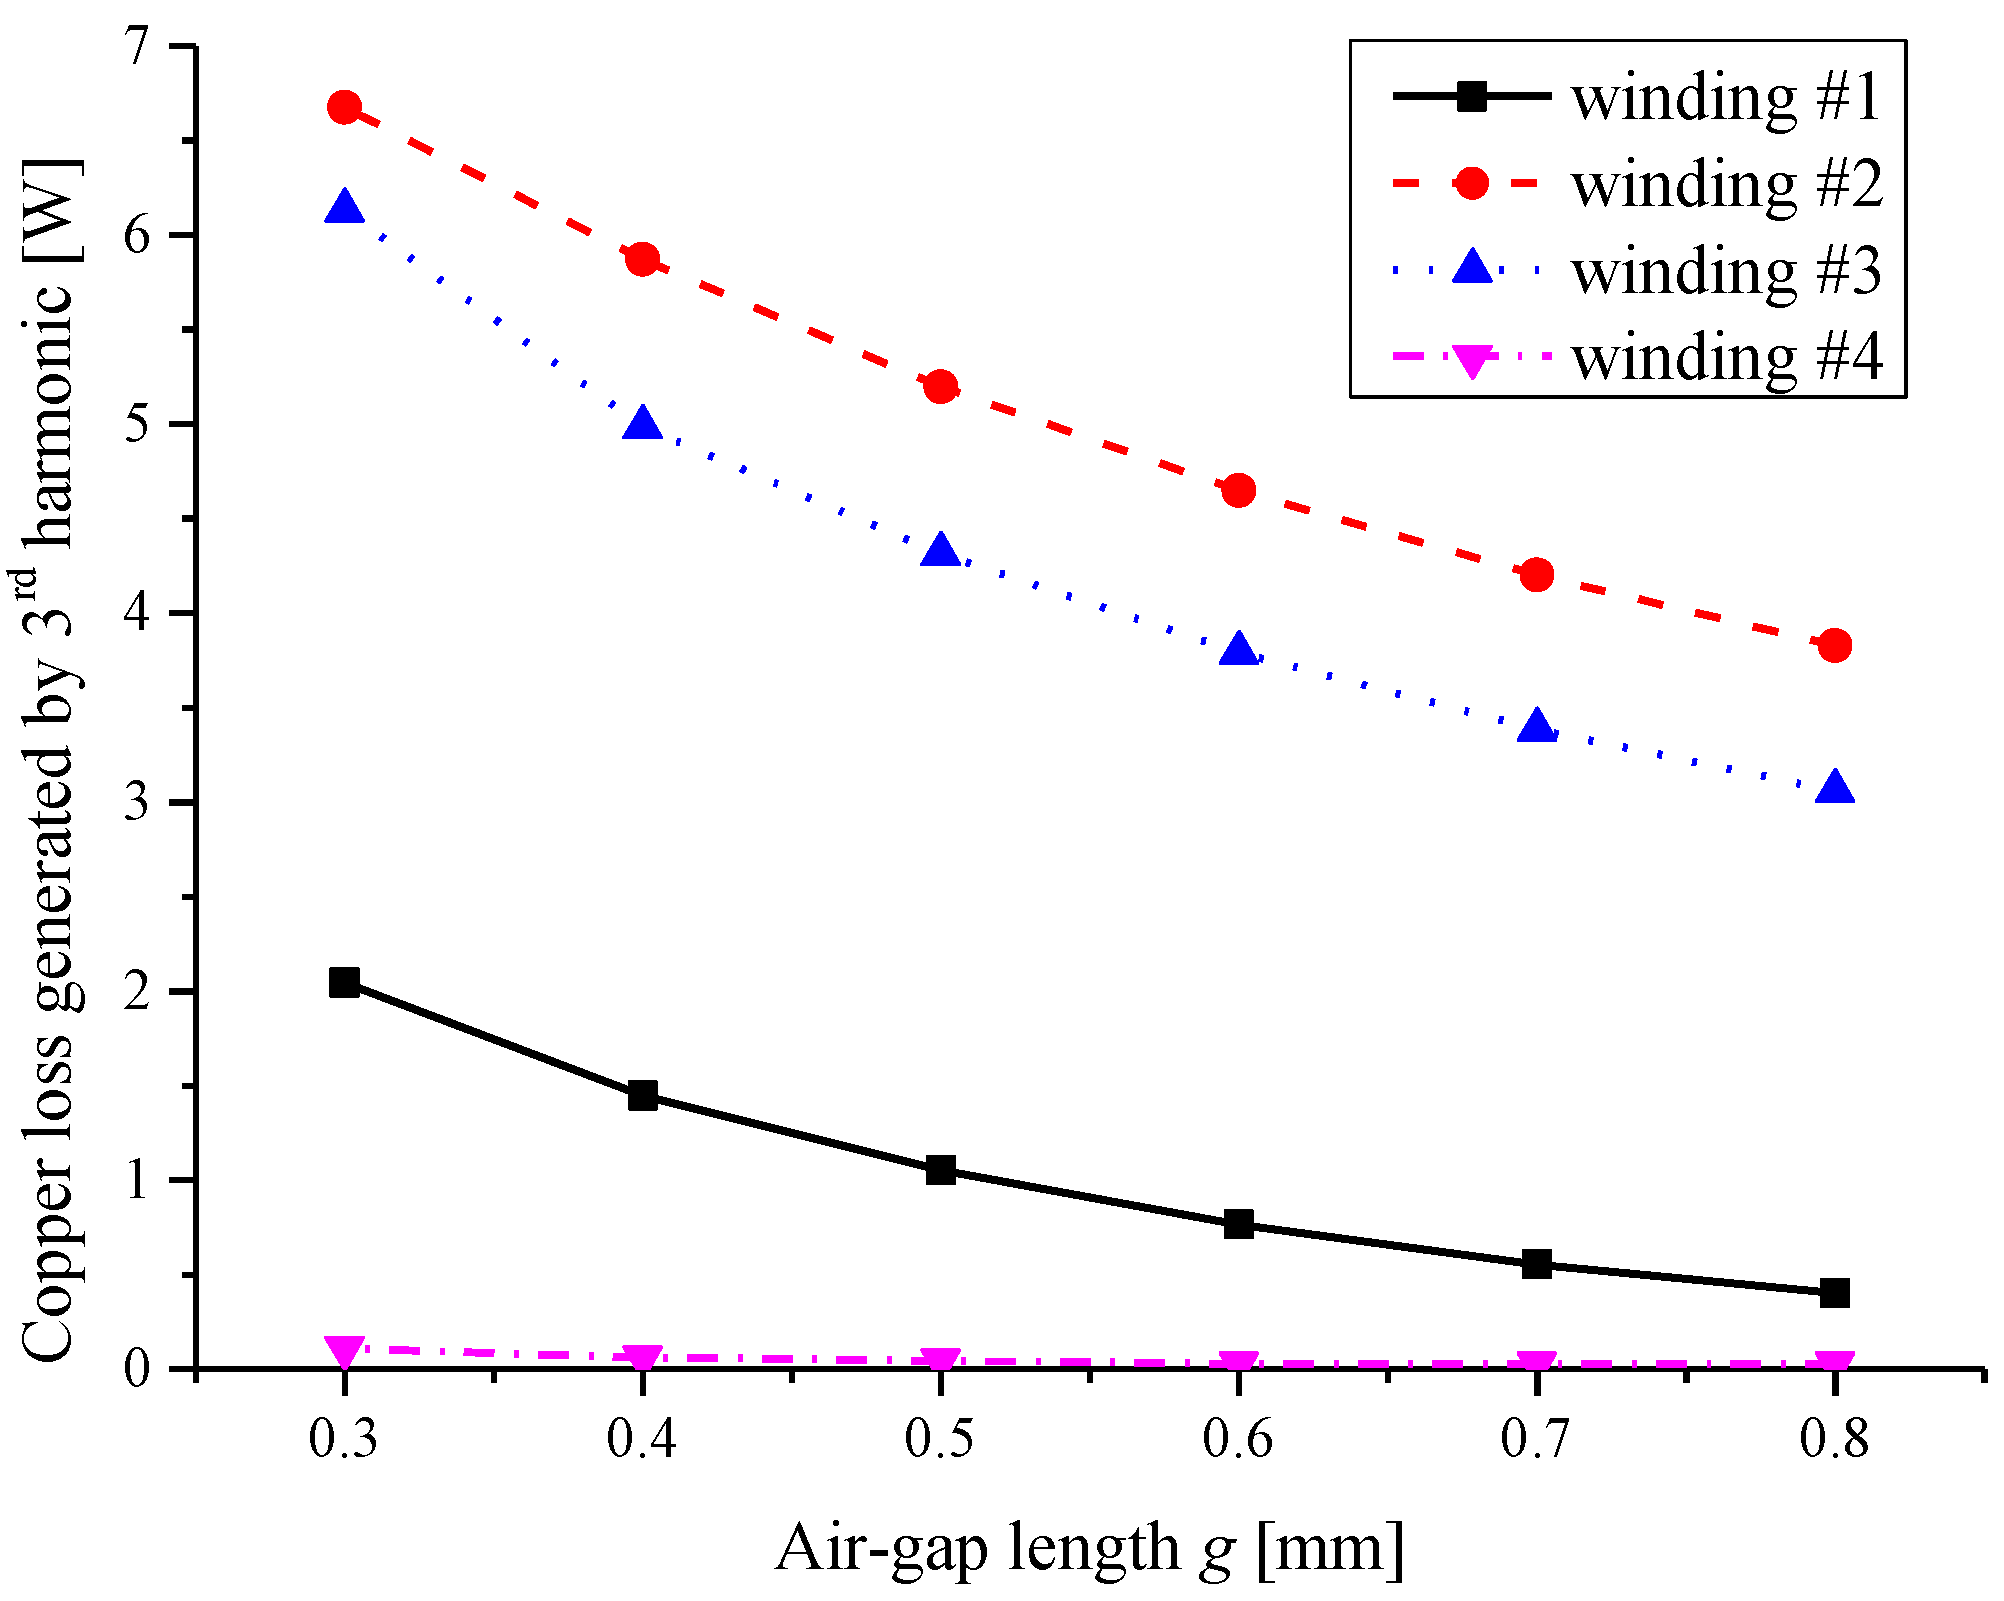
3.1. Harmonic Analysis of Stator Windings
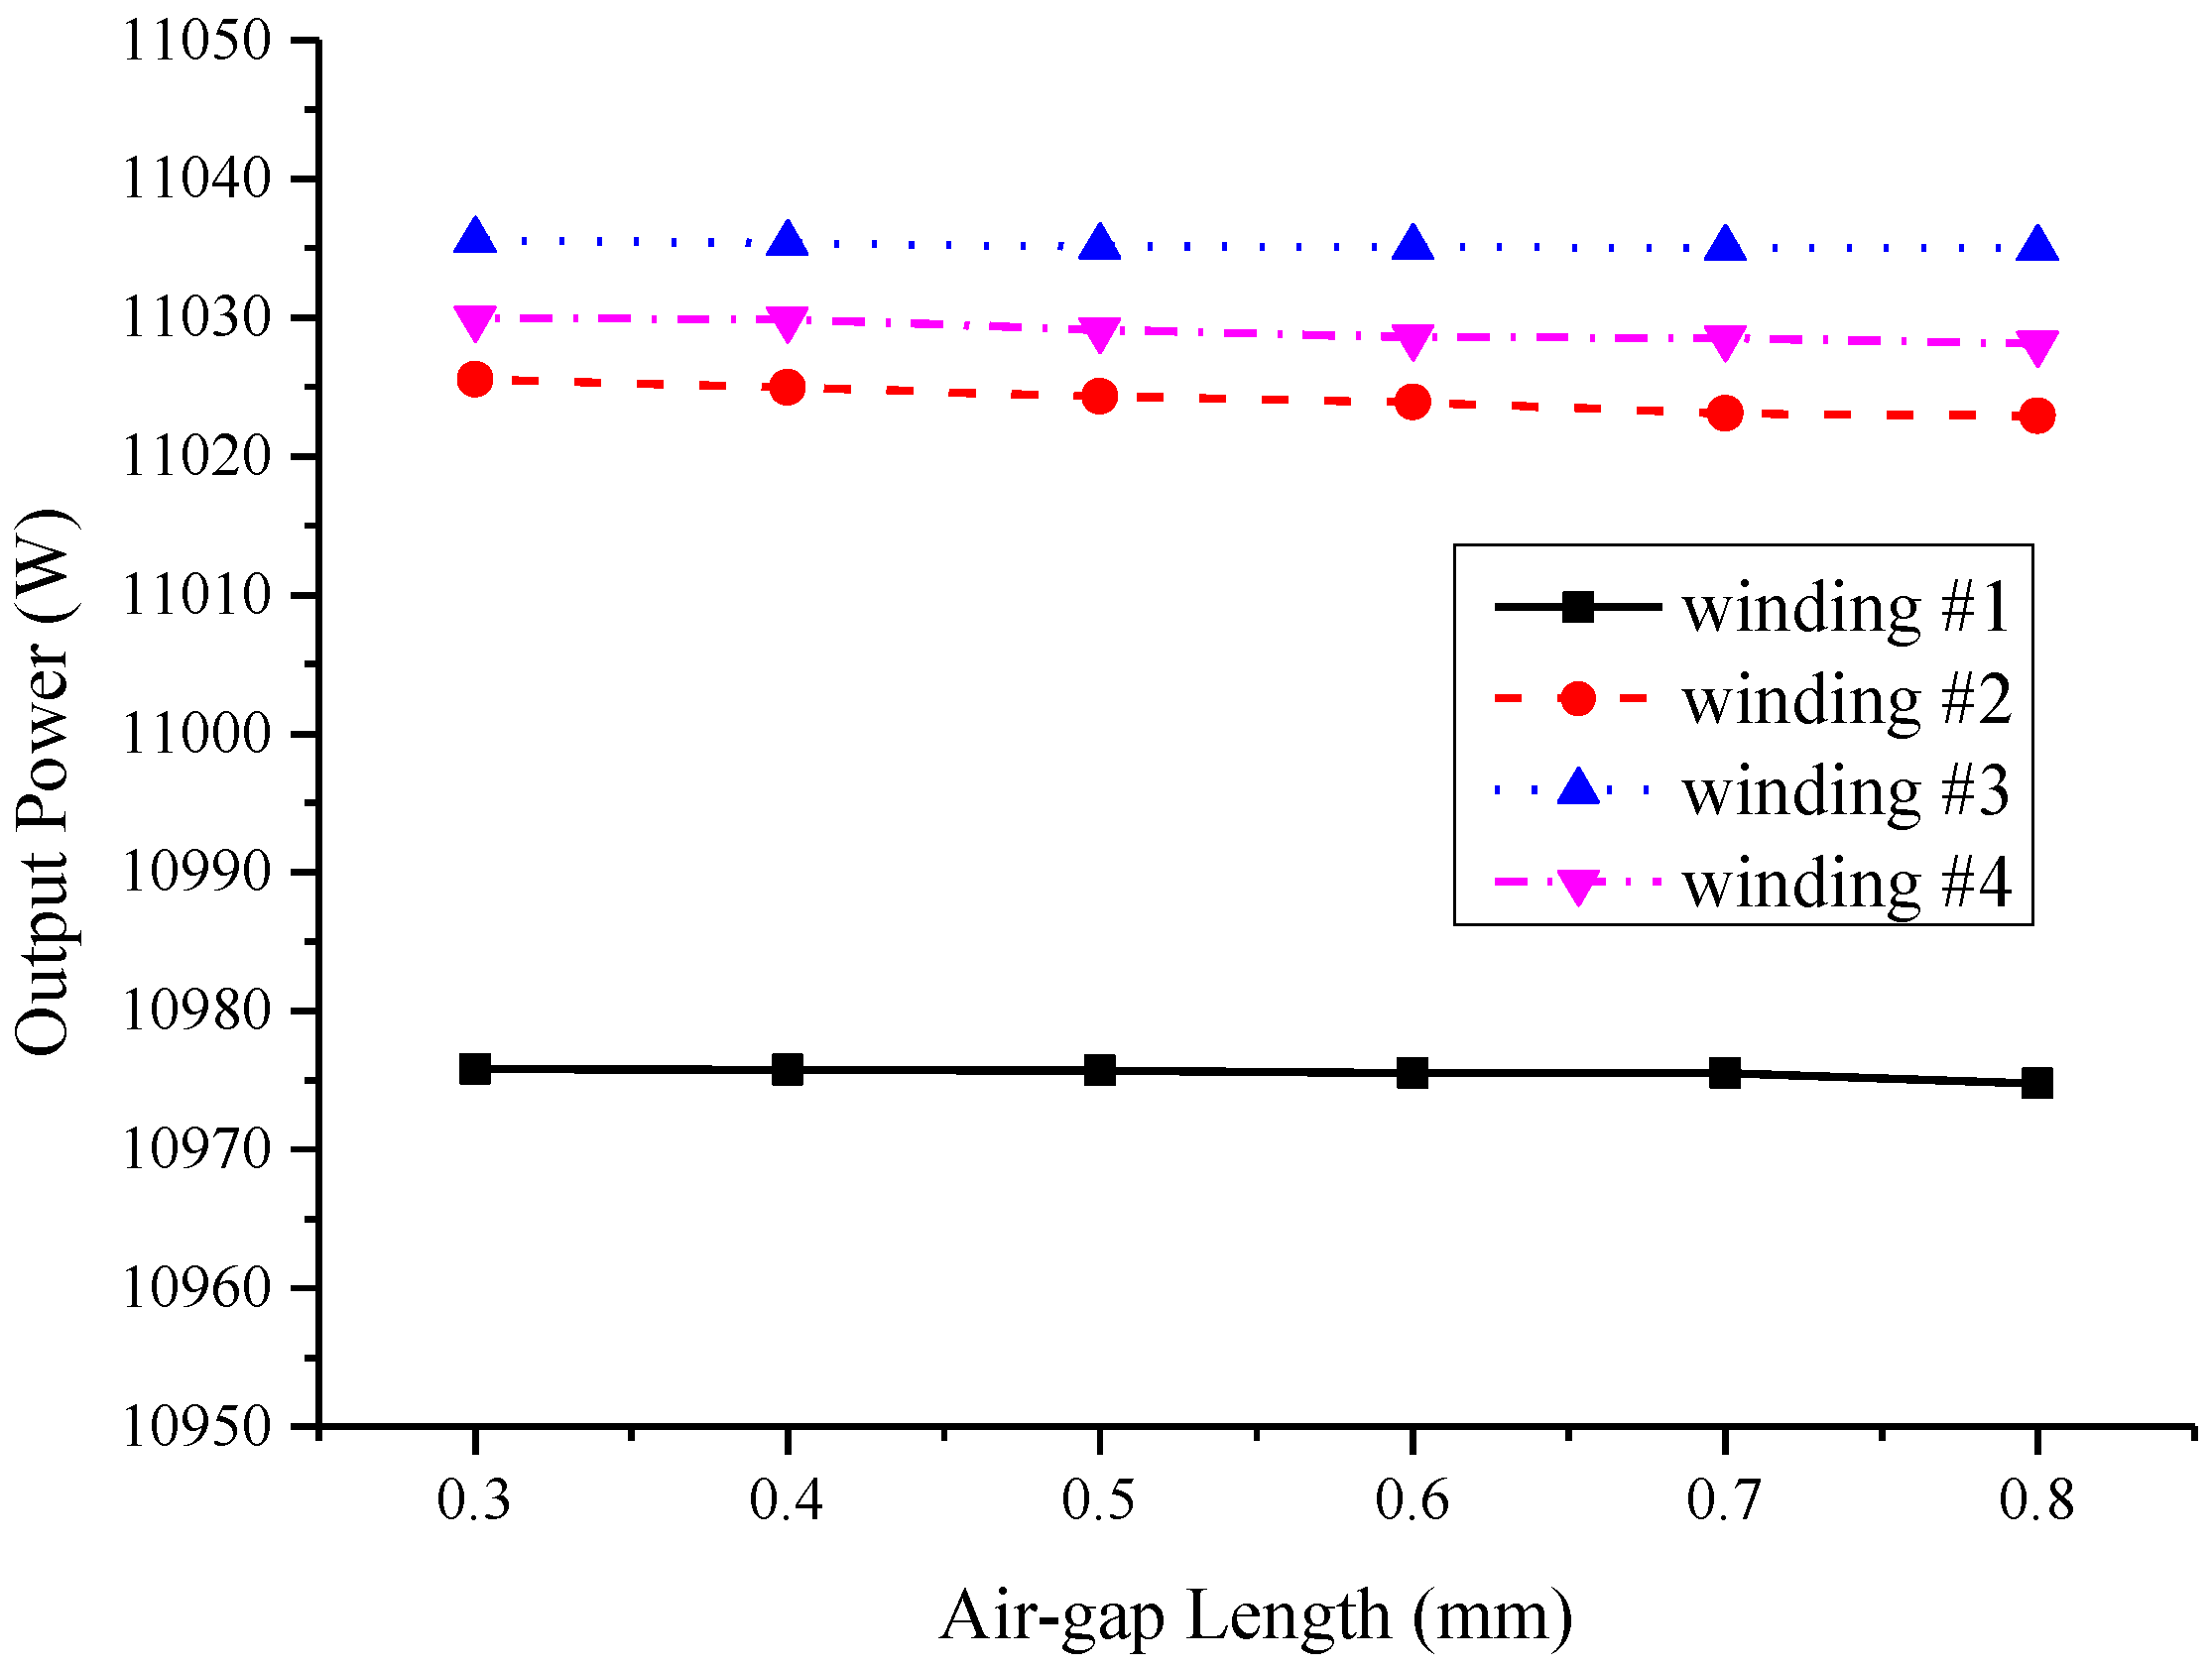
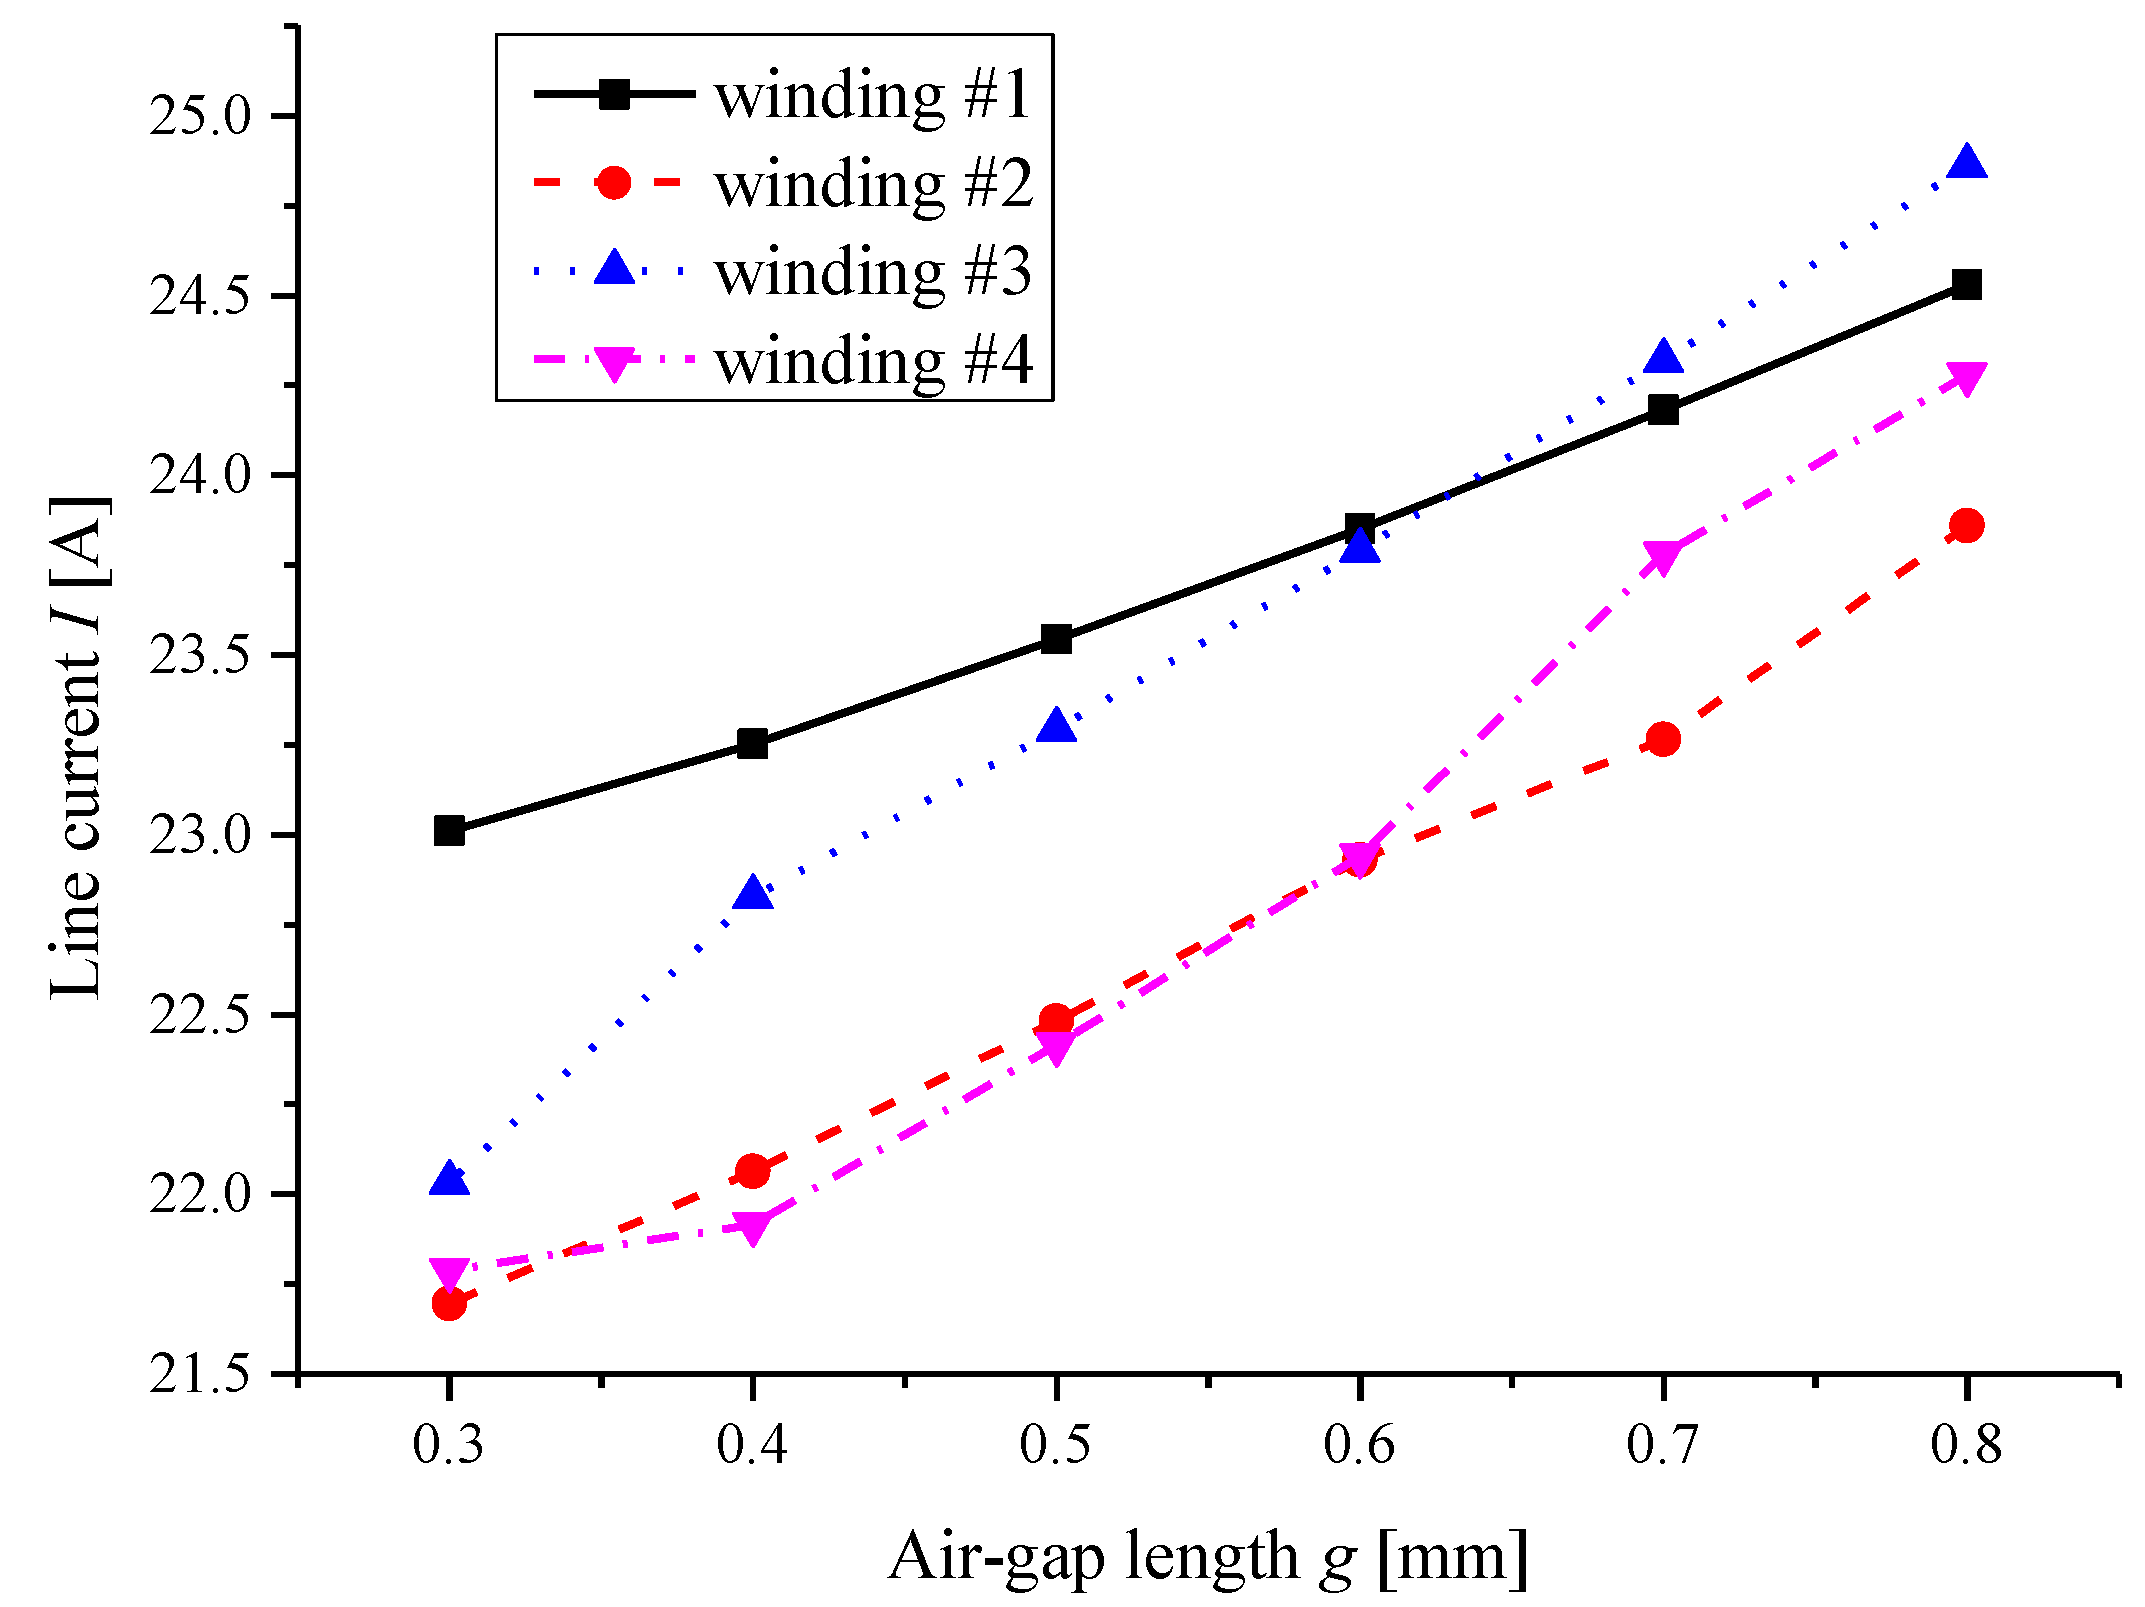
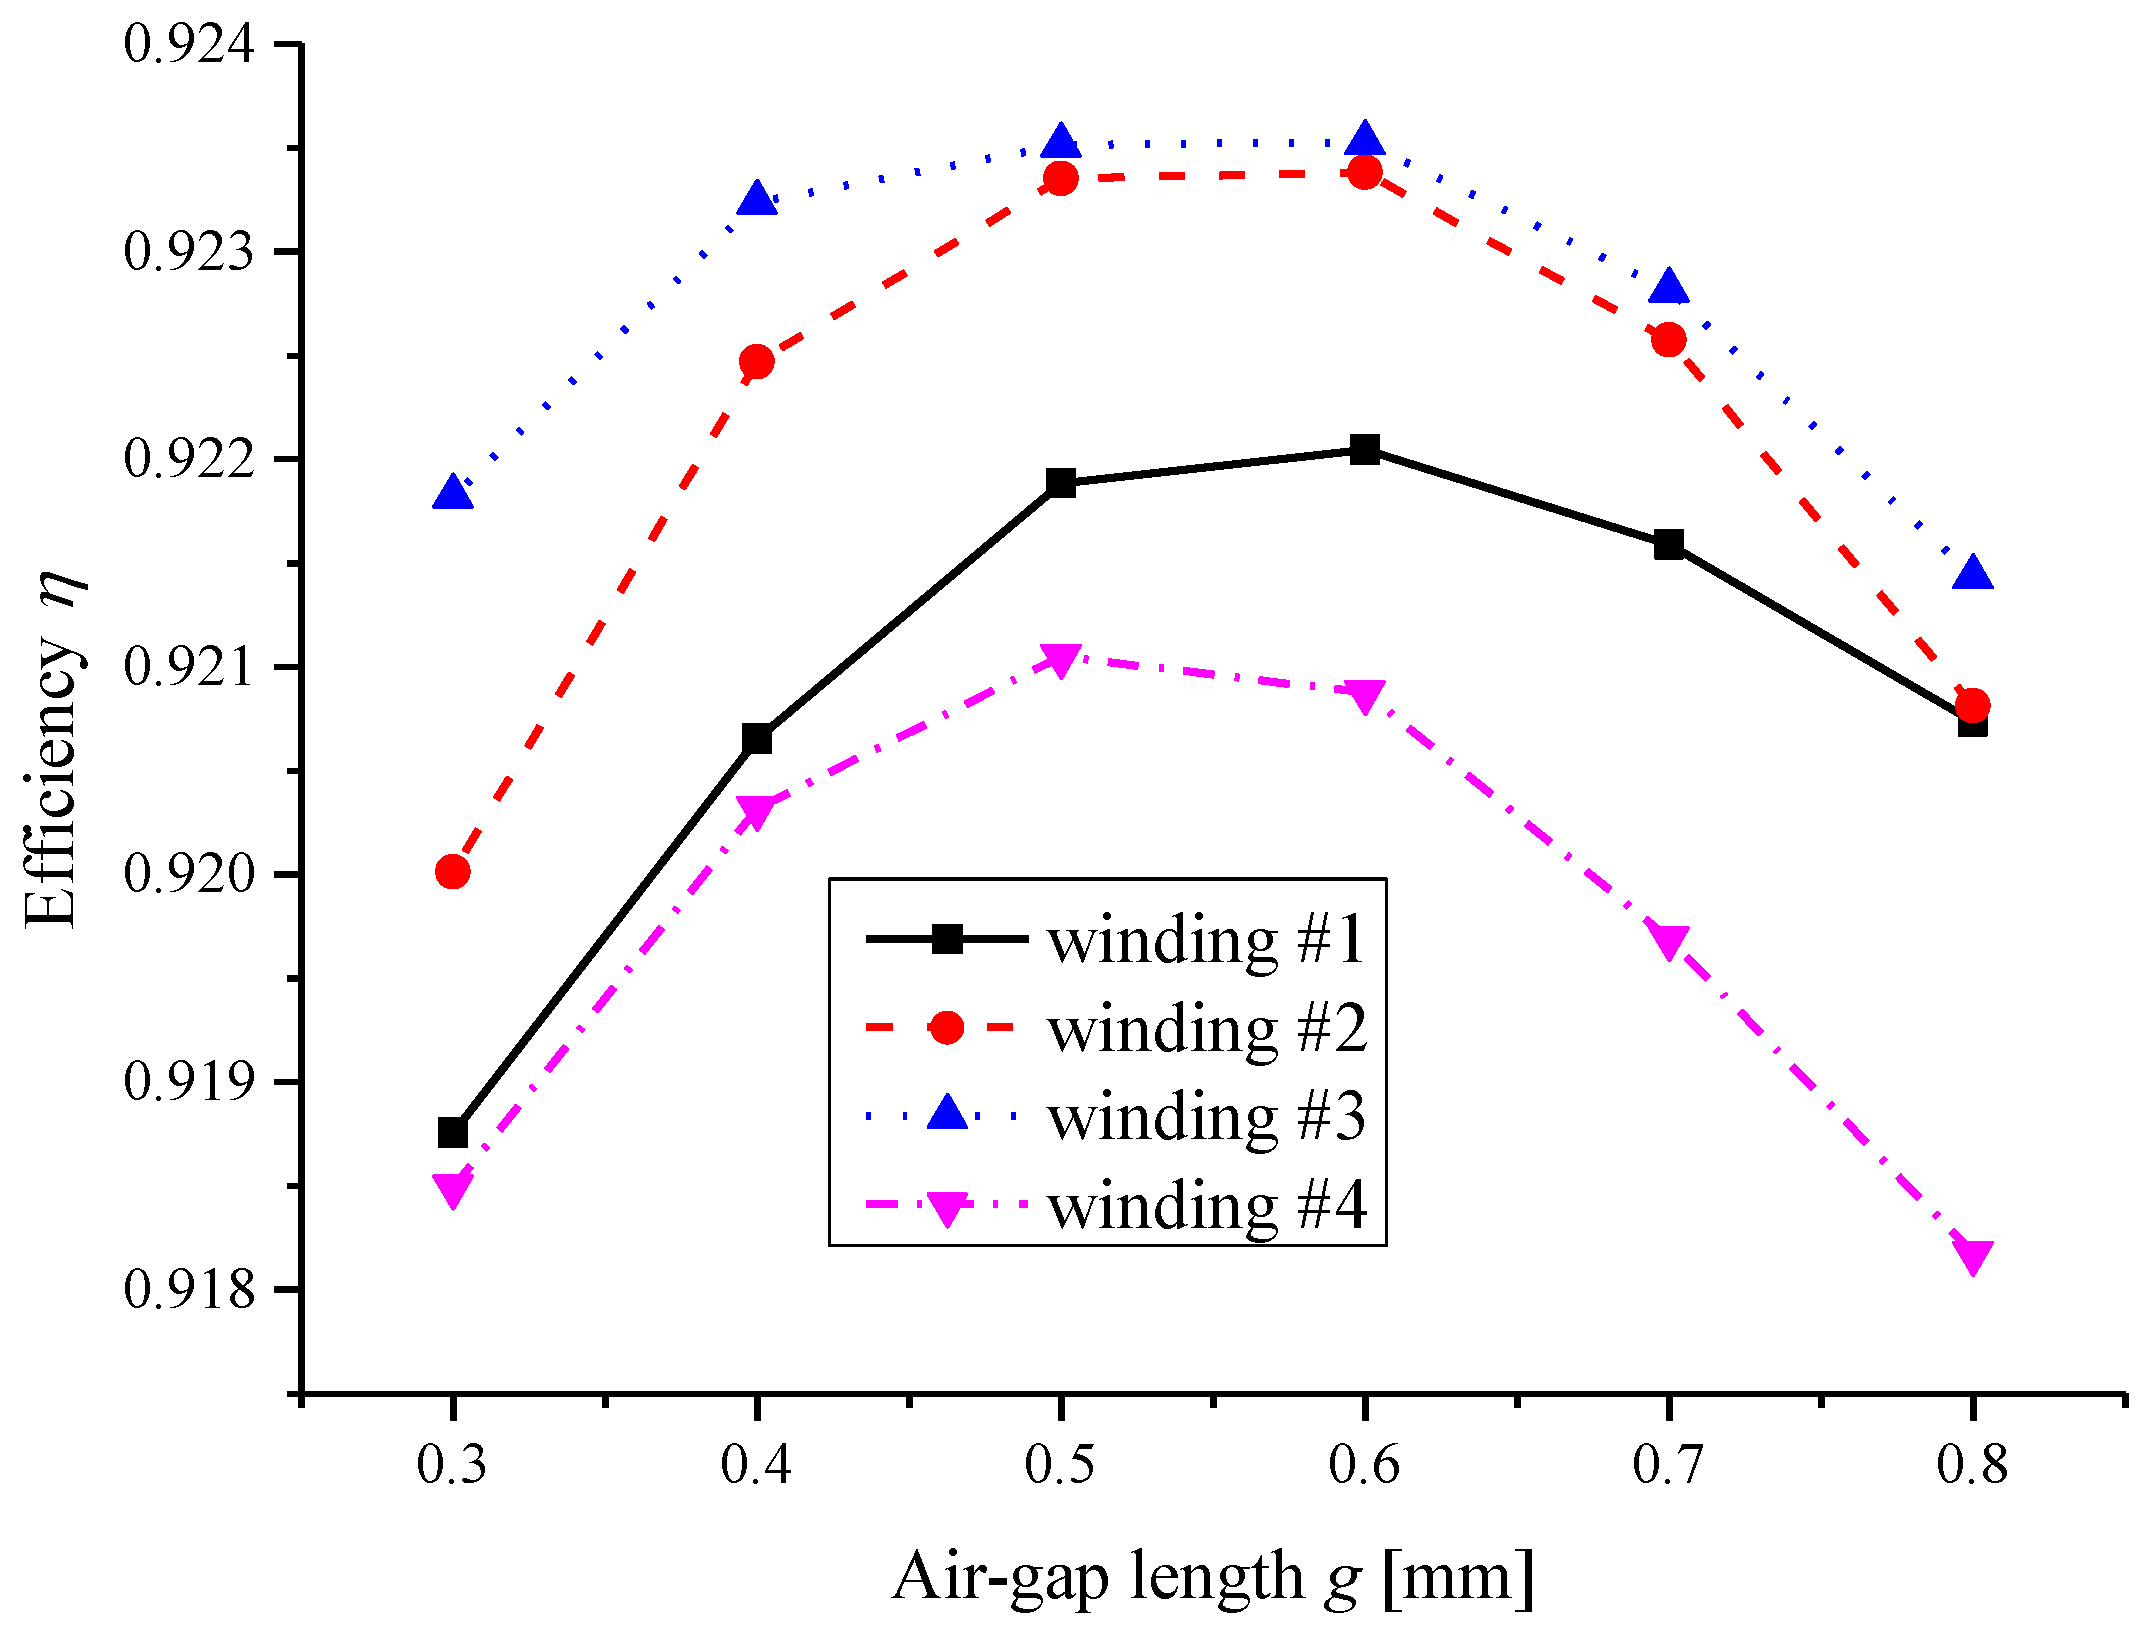
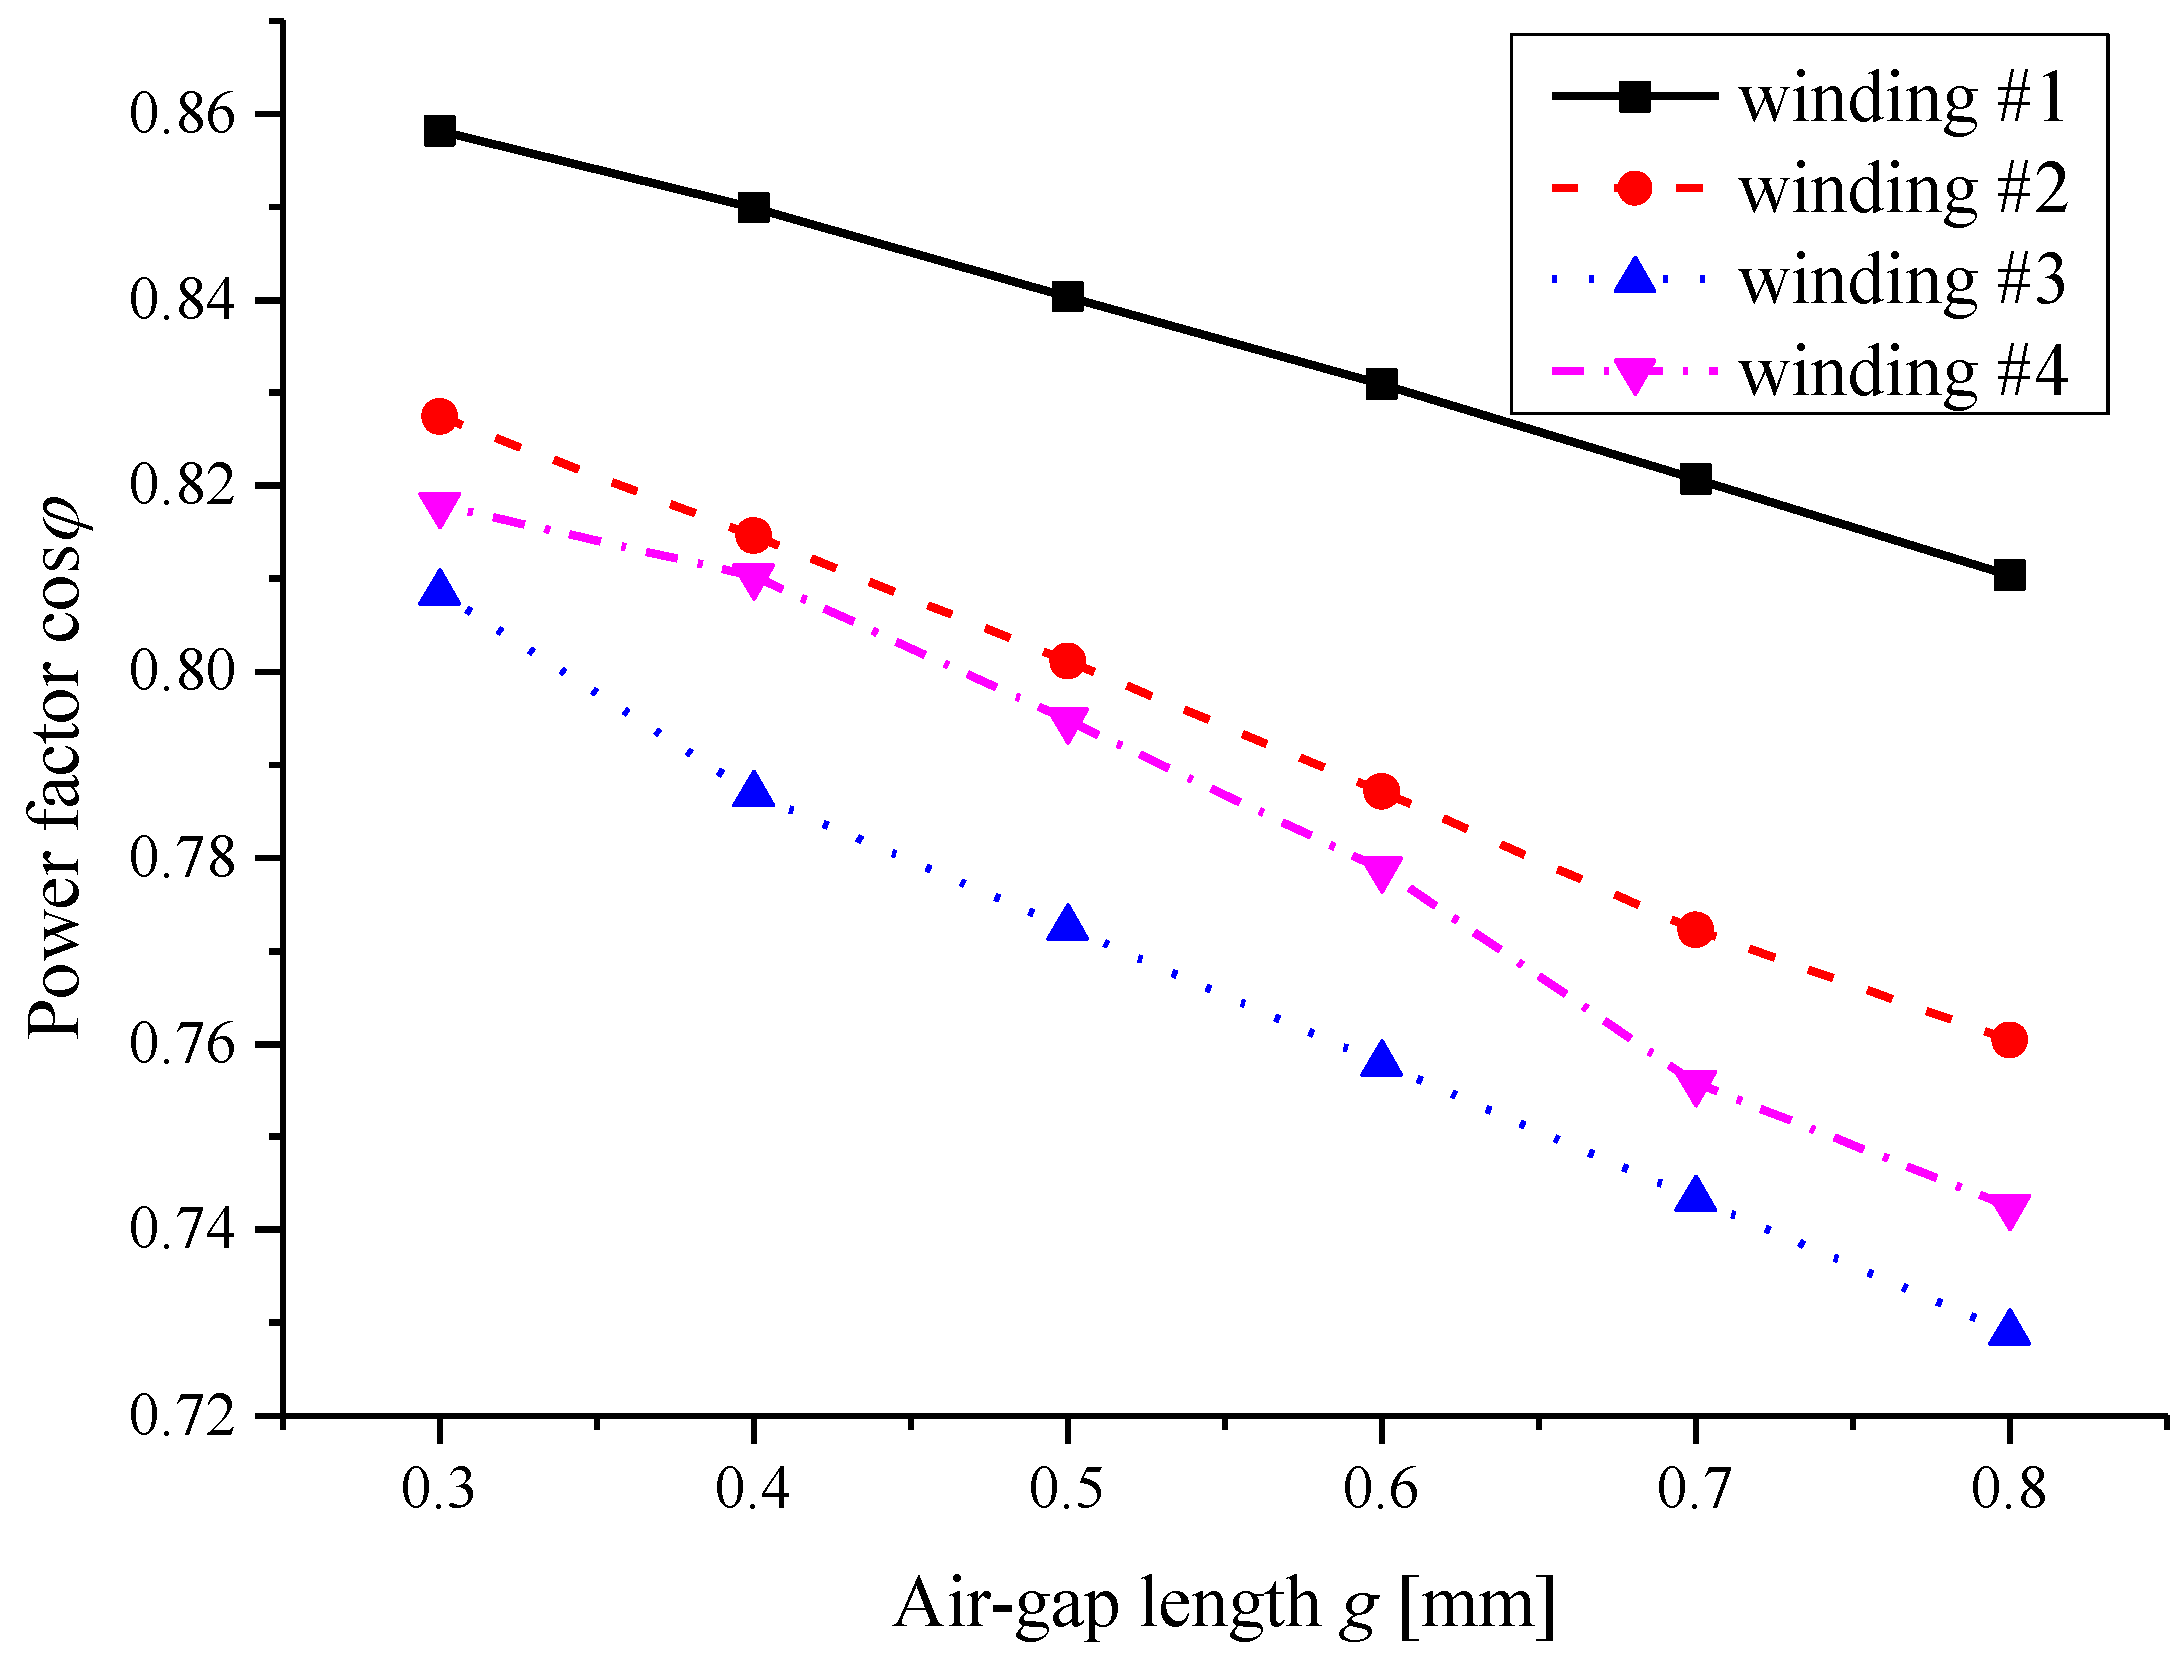
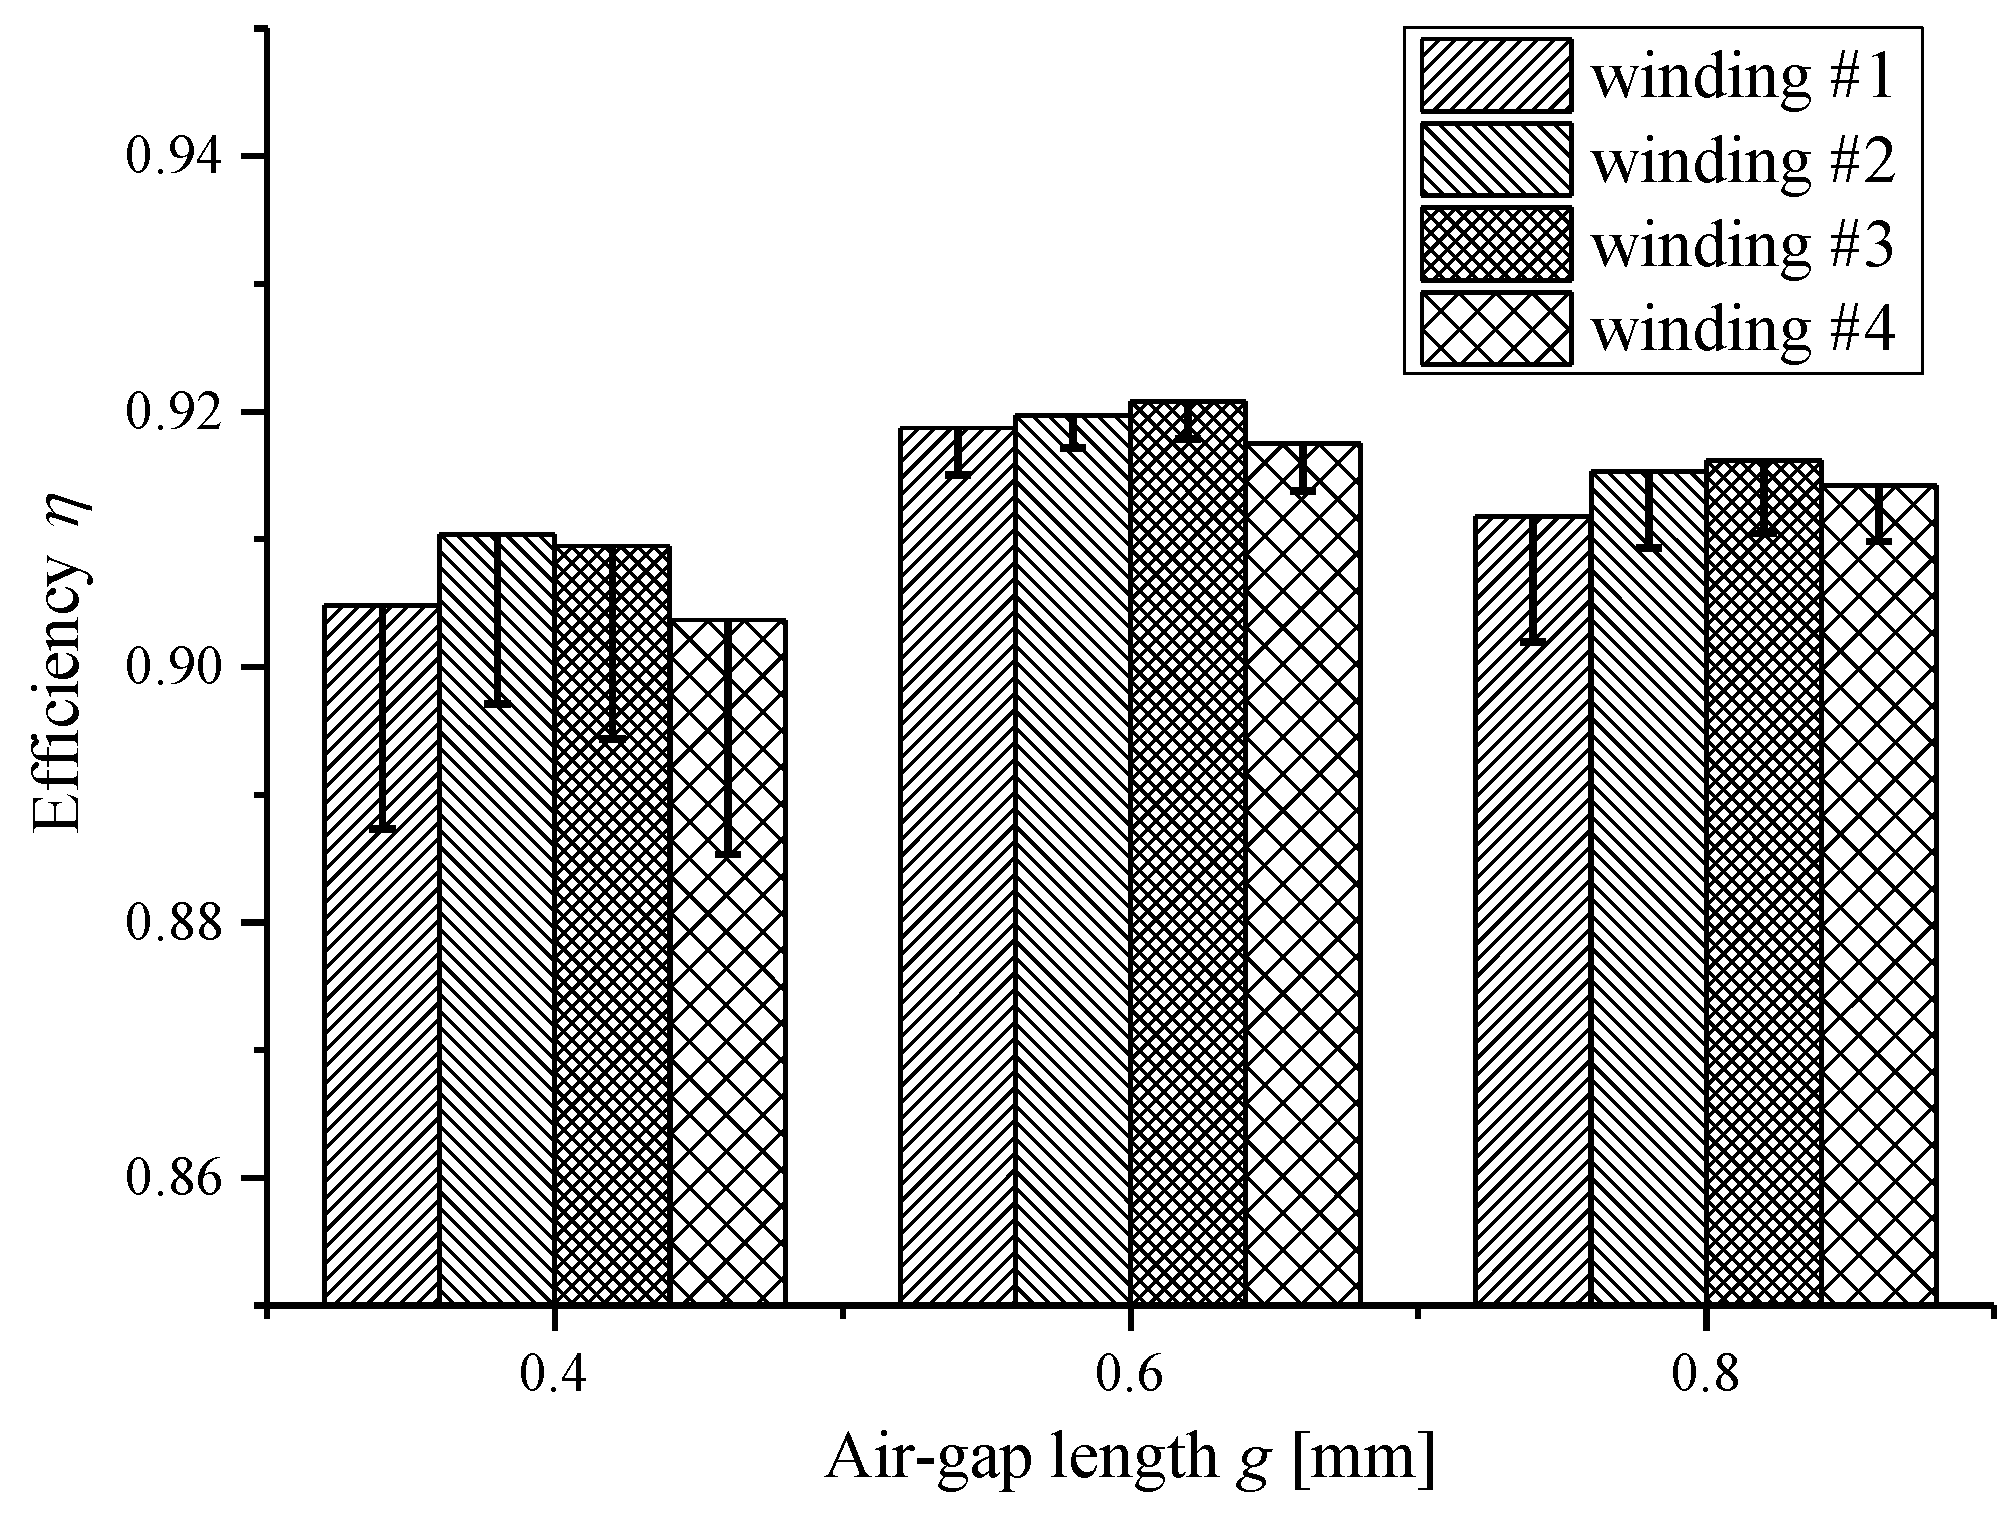
The γ-th harmonic amplitude of the MMF for the single-double-layer winding is [18]:
F φ γ s d = 3 2 π N s d I s d p s d q s d 1 γ sin γ q s d α s d 2 sin γ α s d 2 sin ( π 2 γ y s d τ s d )
and the γ-th harmonic amplitude of the MMF for the Y-Δ series windings is [18]:
F φ γ Y Δ = F φ γ Y + ( 1 ) k · F φ γ Δ
F φ γ Y = 3 2 π N Y I Y p Y q Y 1 γ sin γ q Y α Y 2 sin γ α Y 2 sin ( π 2 γ y Y τ Y )
F φ γ Δ = 3 2 π N Δ I Δ p Δ q Δ 1 γ sin γ q Δ α Δ 2 sin γ α Δ 2 sin ( π 2 γ y Δ τ Δ )
In Equations (15)–(18), the definition of N, p, q, y, τ, α is the same as Table 2. γ = 6k ± 1, k = 0, 1, 2, … because the (3k)th harmonics counteract in the three-phase windings. The subscript sd denotes the single-double-layer winding, and Y-Δ denotes the Y-Δ series hybrid winding. I is the root-mean-square (RMS) value of the phase-current in the stator winding.
Figure 6 shows the MMF distribution of the four types of windings calculated by Equations (15)–(18), where harmonic content is defined by the MMF ratio of the specific harmonic to the fundamental harmonic. The winding #1 contains (6k ± 1) th (k = 1, 2, 3, ….) harmonics where the 5th and 7th harmonics are reduced by the 5/6 pitch. From the Equation (16), it can be found that the MMF of the Y-Δ series windings is zero if the MMF of the inner Y winding is equivalent to the outer Δ winding and k is an odd number. Therefore, the windings #2 and #4 approximately contain (6k ± 1)th harmonics where k = 2, 4, 6, … because the harmonic content of k = 1, 3, 5, … are nearly suppressed. The winding #3 contains the least harmonics that are approximately (12k ± 1)th harmonics where k = 2, 4, 6, …

3.2. Air Gap Length

The air gap length should always be small to decrease the no-load current of induction motors. There is mechanical minimum limitation for the air gap length to prevent the possible contact between stator and rotor. Reference [21] offers the following equation for estimation of the air gap length g:
g = 0.3 × ( 0.4 + 7 D 1 i n L ) × 10 3
where the unit is meters, D1in is the stator inner diameter, L is the axial length.
The stator differential leakage reactance Xd1 can be calculated by [21]:
X d 1 = 12 π f · μ 0 · ( N 2 p ) · τ · L k c k s a t g · [ γ = 5 ( k w γ γ ) 2 ]
k s a t = F δ + F t 1 + F t 2 F δ
where μ0 is the magnetic constant, τ is the pole pitch in terms of length, kc is the Carter coefficient, ksat is the saturation factor, Fδ is the air gap MMF drop, Ft1 is the stator tooth MMF drop, Ft2 is the rotor tooth MMF drop, and k is the winding factor of the γth harmonic.
Equation (20) shows that harmonic leakage reactance is inversely proportional to air gap length. Therefore, air gap should be somewhat large enough to make sure harmonic leakage reactance is small so as its stray loss. According to Equation (19), air gap g of the 11 kW induction motor is approximately 0.5 mm. Therefore, the 11 kW induction motor with air gap varying around 0.5 mm is analyzed.

4. Calculation Results and Evaluation

Through the calculation above, the full-load, overload and starting performance of the 11 kW induction motor with a DCR are computed and compared with each other for the commercial measures that changing types of stator windings and air gap length.

4.1. Full-Load Performance

Figure 7, Figure 8, Figure 9, Figure 10, Figure 11, Figure 12, Figure 13 and Figure 14 show the calculation results of the 11 kW induction motor with the four stator windings and the different air gap lengths based on the method indicated in Figure 1 and Figure 2. In the simulation, the input phase voltage is set as 220 V/50 Hz. The output torque is kept with the value of 70.8 Nm at full load. The full-load temperature of the motors is assumed as 77 °C based on a preliminarily thermal analysis which is not presented in this paper. The no-load condition is set at the synchronous speed of 1500 rpm. The no-load temperature is assumed as the room temperature of 15 °C.
Figure 7 shows the output power of the 11 kW induction motors with the four types of stator windings with various air gap lengths. Since the rotating speed of the motors decrease slightly with the increased air gap lengths for each stator winding, the maximum reduction of the output power of the motor with each stator winding is less than 4 W by increasing the air gap length. Therefore, the output powers for the motors with stator winding #1, #2, #3 and #4 are approximately 10.98, 11.02, 11.04 and 11.03 kW. Figure 8 compares the losses of the induction motor with stator windings and various air gap lengths. As shown, the mechanical losses of the motor with the four windings are almost constant because the speed for each stator winding is roughly constant. The full-load fundamental rotor cage losses and no-load core losses reduce slightly with the increased air gap lengths. However, the full-load copper loss and stray loss change greatly with the increased air gap lengths. As seen in Figure 9, the line current of the motor raises with the increased air gap lengths so as copper losses. The copper losses of the winding #1 and #4 are greater than those in #2 and #3 because the fundamental winding factors of the #1 and #4 are relatively lesser. Although the proportion of the stray loss is not high in the total losses, it decreases significantly with the increased air gap lengths. As a consequence of low harmonics, the stray loss of the #3 winding is least in the four types of windings regardless of any air gap length. Furthermore, the total losses of the motor with the four windings reach the minimum value with air gap is set between 0.5 mm and 0.6 mm. Based on the results, the efficiency of the windings can be obtained as shown in Figure 10. Obviously, the efficiency of the #3 is the highest among all these windings. The efficiency of #2 is only slightly lower than the #3, while #4 is the lowest. Besides, when air gap length is 0.6 mm, the efficiencies of #1, #2 and #3 reach highest while #4 can reach highest when its air gap length is set as 0.5 mm.
Figure 11 shows the power factors of the motors. As seen, the power factors of the motors with the four types of windings reduce with the increased air gap lengths. In particular, power factor of the winding #3 is lowest and the power factors of #4, #2 and #1 all increase accordingly.
From the calculated results, it can be shown that winding #3 has the highest efficiency because it owns the second highest winding factor with the lowest harmonics. Superficially, it seems that the winding #2 is better than the #3 because the efficiency of the #2 is close to the #3 while its power factor is a little bit higher than that in #3. In order to keep the fundamental MMF same as the other three windings, the ratio of the number of turns for the winding #3 in series per phase of the inner Δ to the outer Y, NΔ/NY, is 1.667. This particular value is not fairly close to 3 so that the electromagnetic fields of the inner Δ and the outer Y winding are distorted. Therefore, the power factor and the current of the winding #3 are both deteriorated. If the ratio of the winding #3 is close to 3 , as similar as its counterpart does, i.e., #2 and #3 are 1.750 and 1.714, respectively, its power factor and current could be close to that in #2. Furthermore, the efficiency of the #3 winding would be higher because of it consists of smaller copper loss.
Although the suggested value by empirical equation is 0.5 mm, it should also be noted the best air gap lengths of the efficiency should instead be 0.6 mm for the #1, #2 and #3 and 0.5mm for the #4. The difference is caused possibly by the greater copper loss in the #4 winding. The relatively smaller air gap in #4 winding results with less current so as copper loss, and hence resulting the highest efficiency.
Besides (3k)th (k = 1, 2, 3, ….) harmonics cause circulating zero-order currents in Δ windings and it will increase copper loss. The steady-state full-load phase currents of the Δ winding in the four stator windings with different air gap lengths can be calculated by 2D FEA. Figure 12 shows the steady-state phase currents in the Δ winding of the four stator windings with 0.3 mm air gap. It can be seen that the current waveforms are distorted because of harmonic current. The waveform distortion of the winding #2 and #3 is more severe than those in winding #1 and #4. The results imply the winding #2 and #3 contain more current harmonics. The 3rd harmonic current amplitude Ih3 is analyzed by using FFT because it is the main harmonic content that causes circulating zero-order current whose results are shown in Figure 13. Then, the stator copper losses caused by 3rd harmonic current are calculated and shown in Figure 14. Since greater air gap reduces harmonic amplitude, all 3rd harmonic currents of the four windings decrease with the increased air gap lengths. Furthermore, the 3rd harmonic current of the winding #2 is close to the winding #3 and they are much higher than those in winding #1 and #4. The winding #4 contains the lowest 3rd harmonic current because of its 2/3 pitch eliminates (3k)th (k = 1, 2, 3, ….) harmonics. Therefore, copper loss caused by 3rd harmonic current of winding #4 is close to zero. It is the lowest value among all four windings, although it is also the Y-Δ series winding. The copper loss of 3rd harmonic current of the winding #1 is a litter higher than the winding #4, while it is much less than those in winding #2 and #3. They are both Y-Δ series winding whose inner Δ winding has remarkable 3rd circulating current.

4.2. Overload Performance

In the Equation (12), the total stator and the total rotor leakage reactances are calculated by:
X σ 1 = X s 1 + X d 1 + X e 1
X σ 2 = X s 2 + X d 2 + X e 2
where X s 1 is stator slot leakage reactance, X d 1 is starting stator differential leakage reactance and X e 1 is starting stator end-winding leakage reactance, X s 2 is the rotor slot leakage reactance (reported to the stator), X d 2 is the rotor differential leakage reactance (reported to the stator) and X e 2 is the rotor end-winding leakage reactance (reported to the stator).
Equation (20) shows that the stator differential leakage reactance X d 1 is proportional to γ = 2 ( k γ / γ ) 2 which is the differential leakage coefficient. The calculated values of the differential leakage coefficients of single-double layer Δ winding with q = 4, and Y-Δ series winding with q = 2 for various pitches are shown in Figure 15. It can be seen that the coefficients of Y-Δ series winding are much less than those in single-double layer Δ winding. It is because (6k ± 1)th harmonics, where k is odd number, are suppressed in the Y-Δ winding.
Figure 16 and Figure 17 show the per unit values of the stator differential leakage reactance x ^ d 1 and rotor differential leakage reactance x ^ d 2 (reported to the stator) of the four stator windings, with air gap varying from 0.3 mm to 0.8 mm. Obviously, the stator and rotor differential leakage reactances decrease with increased air gap. The reason is that the differential leakage reactance is inversely proportional to equivalent air gap length, as described in the Equation (20). Due to minimum number of turns in series per phase and harmonic contents, winding #3 has the lowest differential leakage reactance.
The per unit value of rotor slot leakage reactance x ^ s 2 (reported to the stator) can be calculated by [21]:
x ^ s 2 = 8 π f μ 0 L P o u t ( N k w 1 ) 2 N r U n 2 · λ s 2
where kw1 is the fundamental winding factor, Nr is the number of rotor slots, λ s 2 is the rotor slot leakage coefficient which is determined by the rotor slot geometry [21] including the rotor slot bridge. As shown in Figure 18, the rotor slot leakage reactance x ^ s 2 (reported to the stator) also varies with air gap length. Due to the total length of the air gap and rotor slot bridge keeps constant, the rotor slot leakage reactance increases at the beginning and then decrease with increased air gap which causes the length reduction of the rotor slot bridge. The stator and rotor leakage reactance including stator slot leakage reactance x ^ s 1 , stator end-winding leakage reactance x ^ e 1 and rotor end-winding leakage reactance x ^ e 2 (reported to the stator), are summarized in Table 3. Furthermore, the reciprocal of total stator and rotor leakage reactances of the 11 kW induction motors with four stator windings, with various air gap lengths are calculated and shown in Figure 19. Regarding any air gap lengths, winding #3 owns the highest value with its peak torque roughly 1.1 times larger than the other three windings. The peak torque of winding #2 is somewhat greater than winding #4, and peak torque of winding #1 is close to the #2. Therefore, the induction motor with winding #3 consists of the better overload performance than all the other three windings. Additionally, the overload capability can be enhanced by increasing the air gap length.

4.3. Starting Performance

In Equation (14), the total stator and the total rotor leakage reactance at starting stage is calculated by:
X σ 1 ( s t ) = X s 1 ( s t ) + X d 1 ( s t ) + X e 1 = λ s 1 ( s t ) λ s 1 X s 1 + k s t X d 1 + X e 1
X σ 2 ( s t ) = X s 2 ( s t ) + X d 2 ( s t ) + X e 2 = λ s 2 ( s t ) λ s 2 X s 2 + k s t X d 2 + X e 2
where kst is the starting leakage flux saturation coefficient which is obtained by looking up the curve of kst versus the virtual air gap flux density BL for the starting flux leakage [21]. Assuming the stator and rotor slot MMF drop takes place only in the air gap for the starting flux leakage, the virtual air gap flux density is calculated by the stator and rotor slot MMF of the starting flux leakage. Besides, the stator and rotor slot MMF is calculated by the starting stator current Ist1. Note that Ist1 is obtained by iterative calculation. Specifically, making an assumption of Ist1(0) is to calculate the total starting impedance Z s t , then the starting stator current Ist1(1) is computed based on the results of Z s t . This iterative calculation continues until the value of |Ist1(i+1)Ist1(i)| (i = 0, 1, 2, …) is less than an allowable error. λ s is the slot leakage coefficient, the subscript 1 denotes the stator, the subscript 2 denotes the rotor and the subscript (st) denotes the starting parameter. λ s 1 and λ s 2 is determined by the stator and the rotor slot geometry respectively. λ s 1 ( s t ) and λ s 2 ( s t ) is calculated by the stator and the rotor slot geometry and the coefficient kst.
The results of the coefficient kst of the four stator windings versus air gap length are shown in Figure 20. The starting stator and the rotor differential leakage reactances X d 1 ( s t ) and X d 2 ( s t ) can be obtained by the results of the coefficient kst, Figure 16 and Figure 17. The starting stator and rotor slot leakage reactances X s 1 ( s t ) and X s 2 ( s t ) are also calculated through the coefficient kst and the steady-stator values. Besides, the stator and rotor end-winding leakage reactances are the same as the steady-state parameters in Table 3.
Assuming the starting rotor resistances (reported to the stator) keep constant for the different stator windings and air gap length, their starting torques only vary with the magnitude of total starting impedance. Thus, the starting torques can be seen to be directly proportional to the reciprocals of magnitude square of total impedance at starting 1 / Z s t 2 , as described in Equation (13). Figure 21 shows the calculated per unit results of the parameters 1 / z ^ s t 2 of the motors with different stator windings and air gap lengths. It can be seen that they decrease with increased air gap lengths, with reduced amplitudes confined within 5% for all the four windings. Besides, the parameter 1 / z ^ s t 2 of winding #3 is much higher than the other three windings. The parameters 1 / z ^ s t 2 of the#1, #2 and #4 decrease when the #4 is close to the #1 because the #4 winding has much greater stator resistance and maximum number of turns in series per phase. Therefore, the starting performance of the winding #3 is superior to the other three windings with its starting torque is roughly 1.3 times higher than the others.

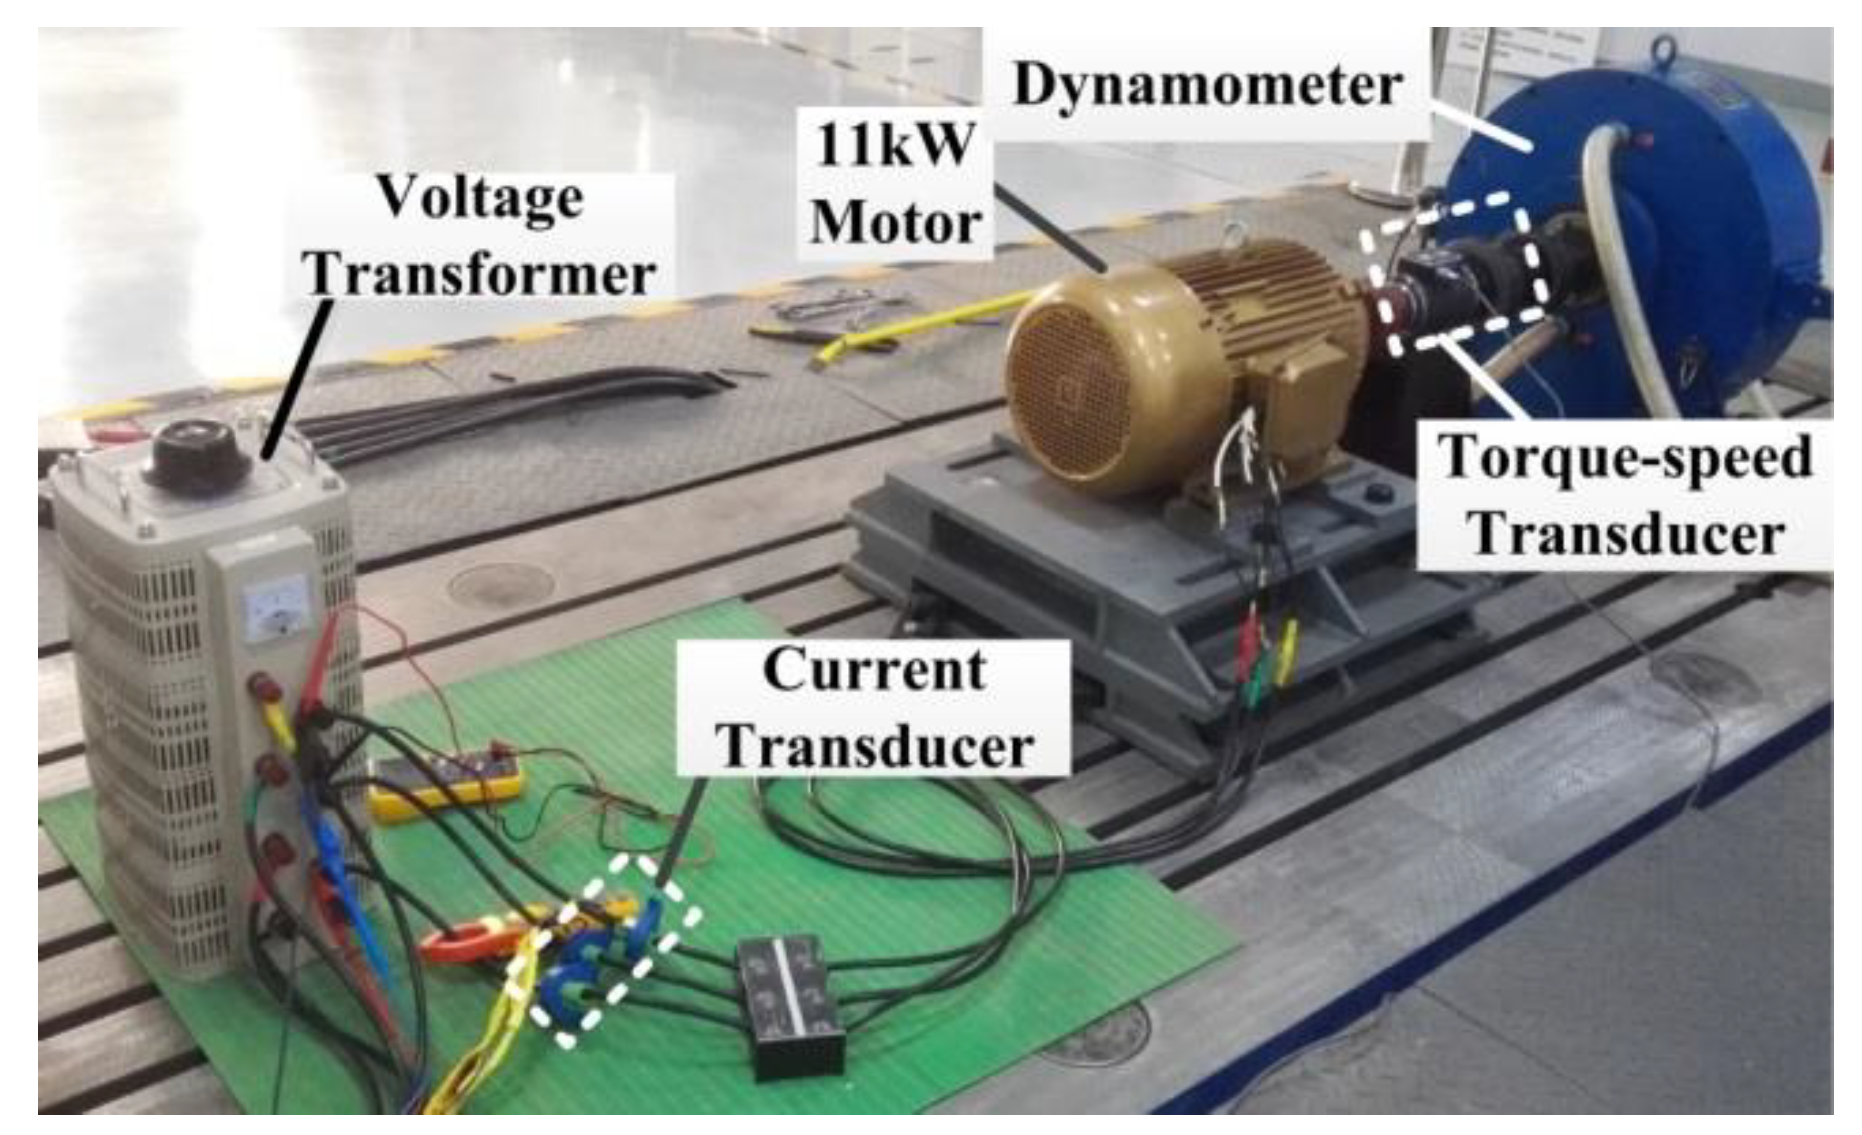
5. Experimental Results

The 11 kW induction motor with four types of stator windings and three non-skewed die-cast copper rotors corresponding to air gap length of 0.4, 0.6 and 0.8 mm are fabricated and tested to validate the calculation results of the hybrid methodology. These stators and rotors can be assembled into twelve 11 kW prototypes, respectively. No-load and full-load tests of the prototypes are carried out in accordance with the standard of IEEE 112-B [30]. At the full-load test, the shaft torque method is used to obtain data with higher accuracy [31]. Figure 22 shows one of the 11 kW prototypes with its experimental test bench. It can be seen that a high precision torque-speed transducer is installed between the prototype and a dynamometer to make sure the output torque is 70.8 Nm on full-load condition. The experimental devices are summarized in Table 4. The signal of the torque-speed transducer is used to test the output torque and speed of the motor shaft directly. The signal of three current transducers and voltage from the output of voltage transformer are input into the high-precision power analyzer.
The resistances of the stator windings are measured at the room temperature of 3 °C. The measured data are shown in Table 5. It can be seen that the phase resistances at full-load test are smaller than the calculated values in Table 2. The difference mainly comes from inaccurate calculation of end-winding lengths which is acceptable.
Experimental results of efficiency and power factor are shown in Figure 23 and Figure 24, respectively. As shown, with the air gap length of 0.6 mm, winding #3 consists of the highest efficiency. It somehow consists of lower power factor than the others, with differences increasing from 90% to 92.35% by only changing the stator winding and air gap length. Figure 23 and Figure 24 also show the relative errors comparing the experimental and simulation results. The relative error ε is defined as:
ε = x e x s x e
where x e is the experimental value, x s is the simulation value. It can be seen that the experimental efficiency is close to the simulation results that all the relative errors are less than 2%. The relative errors of the power factor are a little greater than the efficiency, especially for the winding #2, #3 and #4 which are all the Y-Δ series windings. The reason is the imbalance between the outer-Y winding and the inner-Δ in the Y-Δ series windings in the external circuit model of the Y-Δ series windings coupled with 2D FEA model, which causes the current distortion leading the current to lag behind the voltage. That means the power factor is sensitive to the unbalanced end-winding leakage inductances in the external circuit, in which the end-winding leakage inductances of the inner-Δ winding should be equal to three times as much as the outer-Y winding. Although the leakage inductances are calculated by analytical equations in [21], it is difficult to strictly meet this requirement. Therefore, the calculation of the power factor for the winding #2, #3 and #4 is lower than the experimental value. That is why the highest power factor in the experiment is the winding #2 rather than the simulation result of winding #1. Fortunately, the relative errors of the power factor are less than 9% which fulfil the engineering requirement. Furthermore, the influence of the power factor error is relatively small on the computational precision of efficiency.
It is expected the efficiency can reach 90% if cast-aluminum rotor is replaced with cast-copper rotor. Obviously the performance of winding #3 can be further improved by adjusting its ratio of the number of turns in series per phase of the inner Δ to the outer Y—NΔ/NY. The weight of these four windings is all around 9 kg which is a standard value for an 11 kW induction motor.

6. Conclusions

The proposed hybrid methodology in this paper is realized by combining FEA and the circuit equivalent circuit model through commercial software MATLAB and ANSYS/MAXWELL to analyze the commercial measures (i.e., changing stator windings and adjusting air gap length) of raising efficiency of induction motors. The methodology is used to compute the starting, overload and full-load performances of induction motors. As an example, it is investigated that a direct-on-line 11 kW DCR induction motor with different air gap lengths and four types of stator windings (i.e., the single-double-layer Δ winding with 5/6 pitch, the single-layer Y-Δ series winding, the double-layer Y-Δ series winding with an 11/12 pitch, and the double-layer Y-Δ series winding with a 2/3 pitch) thoroughly by the proposed hybrid methodology. The results show that the 11 kW DCR induction motor selecting the double-layer Y-Δ series winding with an 11/12 pitch and 0.6 mm air gap has the highest efficiency. Furthermore, the calculation results are validated by the experimental results of fabricated prototypes. In conclusion, the hybrid methodology presented in this paper is effective to analyze and determine the commercial measures of changing stator winding types and adjusting air gap length to improve the efficiency of induction motors.

Author Contributions

Conceptualization, C.A., C.H.T.L., J.L.K., Y.H., H.W. and Z.Z.; software, C.A. and C.H.T.L.; validation, C.A. and Y.H.; investigation, C.A. and J.L.K.; writing—original draft, C.A.; writing—review and editing, C.A., C.H.T.L., J.L.K. and Z.Z.; supervision, J.L.K. and H.W.; funding acquisition, C.A.

Funding

This research was funded by Supported by National Natural Science Foundation of China, grant number 51607172, and China Scholarship Council, grant number 201804910160.

Conflicts of Interest

The authors declare no conflicts of interest.

Appendix A

This appendix presents a substantial portion of the MATLAB codes for the no-load simulation of the proposed hybrid methodology shown in Figure 1. It is not difficult to write other MATLAB codes of the proposed hybrid methodology based on the no-load example and the introduction in this paper.
%----------------------------------------------------------------------------------------------------------------------------
%Invoke ANSYS/MAXWELL
AnsoftApp = actxserver(’Ansoft.ElectronicsDesktop’);
Desktop = AnsoftApp.GetAppDesktop();
Desktop.RestoreWindow;
Project = Desktop.OpenProject([FilePath,pro_nm,’.aedt’]);
% FilePath is the save path of MAXWELL file, pro_nm is the project name
%----------------------------------------------------------------------------------------------------------------------------
% Dimension parameters
D1out=260; %mm, stator outer diameter
D1in=180; % mm, stator innerr diameter
……
%Setting parameters
nr0=1500; %rpm,no-load speed
StartCvs=’1.4s’; %time starting output results
StopCvs=’1.5s’; %time ending output results
StepCvs=’1e-004s’; %time step
……
Design=Project.SetActiveDesign(NoLoad_nm); % NoLoad_nm is the name of no-load simulation
invoke(Design,’ChangeProperty’,{’NAME:AllTabs’,{’NAME:LocalVariableTab’, …
{’NAME:PropServers’,’LocalVariables’},{’NAME:ChangedProps’, …
{’NAME: D1out’, ’Value:=’, [num2str(D1out),’mm’]}}}}); %Set values of dimension parameters
……
Module = Design.GetModule(’ModelSetup’);
invoke(Module,’EditMotionSetup’, ’MotionSetup1’, {’NAME:Data’, ’Move Type:=’, ’Rotate’, ’Coordinate System:=’,...
’Global’, ’Axis:=’, ’Z’, ’Is Positive:=’, true, ’InitPos:=’, ’0’, ’HasRotateLimit:=’,...
false, ’NonCylindrical:=’, false, ’Consider Mechanical Transient:=’, false,...
’Angular Velocity:=’, [num2str(nr0),’rpm’]}); %Set values of setting parameters
Design.Analyze(’Setup1’); %Run no-load simulation
%----------------------------------------------------------------------------------------------------------------------------
% no-load output results
Module=Design.GetModule(’ReportSetup’);
invoke(Module,’CreateReport’, ’Loss Plot 1’, ’Transient’, ’Rectangular Plot’,...
’Setup1: Transient’, {’Domain:=’, ’Sweep’}, {’Time:=’, {’All’}, ’fractions:=’, {...
’Nominal’}, ’nr:=’, nr0}, {’X Component:=’, ’Time’, ’Y Component:=’, {...
’CoreLoss’}}, {}); %no-load core loss
invoke(Module,’ExportUniformPointsToFile’,’Loss Plot 1’,[FilePath,’CoreLossNoLoad.csv’],…
StartCvs, StopCvs, StepCvs); %save the no-load core loss results to .csv file
……
dt=rdcsv_V4(’CoreLossNoLoad.csv’); % rdcsv_V4 is user-defined function dealing with results
t=dt(:,1);
Pcoreloss_NoLoad=dt(:,2);
tlength=t(length(t))-t(1);
……
PcorelossNoLoad_av=trapz(t,Pcoreloss_NoLoad)/tlength;
……

References

  1. Al-Badri, M.; Pillay, P.; Angers, P. A novel algorithm for estimating refurbished three-phase induction motors efficiency using only no-load tests. IEEE Trans. Energy Convers. 2015, 30, 615–625. [Google Scholar] [CrossRef]
  2. Boldea, I.; Nasar, S.A. The Induction Machines Design Handbook; CRC Press: Boca Raton, FL, USA, 2002; pp. 413–431. [Google Scholar]
  3. Melfi, M.J.; Evon, S.; McElveen, R. Induction versus permanent magnet motors. IEEE Ind. Appl. Mag. 2009, 15, 28–35. [Google Scholar] [CrossRef]
  4. Gieras, J.F.; Saari, J. Performance Calculation for a High-Speed Solid-Rotor Induction Motor. IEEE Trans. Ind. Electron. 2012, 59, 2689–2700. [Google Scholar] [CrossRef]
  5. Kirtley, J.; Cowie, J.; Brush, E.; Peters, D.; Kimmich, R. Improving induction motor efficiency with die-cast copper rotor cages. In Proceedings of the 2007 IEEE Power Engineering Society General Meeting, Tampa, FL, USA, 24–28 June 2007; pp. 1–6. [Google Scholar] [CrossRef]
  6. Agamloh, E.B.; Cavagnino, A. High efficiency design of induction machines for industrial applications. In Proceedings of the 2013 IEEE Workshop on Electrical Machines Design, Control and Diagnosis (WEMDCD), Paris, France, 11–12 March 2013; pp. 33–46. [Google Scholar] [CrossRef]
  7. Malinowski, J.; McCormick, J.; Dunn, K. Advances in construction techniques of AC induction motors: Preparation for super-premium efficiency levels. IEEE Trans. Ind. Appl. 2004, 40, 1665–1670. [Google Scholar] [CrossRef]
  8. Parasiliti, F.; Villani, M.; Paris, C.; Walti, O.; Songini, G.; Novello, A.; Rossi, T. Three-phase induction motor efficiency improvements with die-cast copper rotor cage and premium steel. In Proceedings of the SPEEDAM’04 Symposium, Capri, Italy, 16–18 June 2004; pp. 338–343. [Google Scholar]
  9. Yoon, M.; Jeon, C.; Kauh, S.K. Efficiency increase of an induction motor by improving cooling performance. IEEE Trans. Energy Convers. 2002, 17, 1–6. [Google Scholar] [CrossRef]
  10. Li, W.; Wang, P.; Li, D.; Zhang, X.; Cao, J.; Li, J. Multiphysical Field Collaborative Optimization of Premium Induction Motor Based on GA. IEEE Trans. Ind. Electron. 2018, 65, 1704–1710. [Google Scholar] [CrossRef]
  11. Mallik, S.; Mallik, K.; Barman, A.; Maiti, D.; Biswas, S.K.; Deb, N.K.; Basu, S. Efficiency and Cost Optimized Design of an Induction Motor Using Genetic Algorithm. IEEE Trans. Ind. Electron. 2017, 64, 9854–9863. [Google Scholar] [CrossRef]
  12. Bhuvaneswari, R.; Subramanian, S. Optimization of three-phase induction motor design using simulated annealing algorithm. Electr. Power Compon. Syst. 2005, 33, 947–956. [Google Scholar] [CrossRef]
  13. Chun, Y.D.; Han, P.W.; Choi, J.H.; Koo, D.H. Multiobjective optimization of three-phase induction motor design based on genetic algorithm. In Proceedings of the 2008 18th International Conference on Electrical Machines, Vilamoura, Portugal, 6–9 September 2008; pp. 1–4. [Google Scholar] [CrossRef]
  14. Çunkaş, M.; Akkaya, R. Design optimization of induction motor by genetic algorithm and comparison with existing motor. Math. Comput. Appl. 2006, 11, 193–203. [Google Scholar] [CrossRef]
  15. Park, J.T.; Lee, C.G.; Kim, M.K.; Jung, H.K. Application of fuzzy decision to optimization of induction motor design. IEEE Trans. Magn. 1997, 33, 1939–1942. [Google Scholar] [CrossRef]
  16. Williamson, S.; McClay, C.I. Optimization of the geometry of closed rotor slots for cage induction motors. IEEE Trans Ind. Appl. 1996, 32, 560–568. [Google Scholar] [CrossRef]
  17. Lie, S.; di Pietro, C. Copper die-cast rotor efficiency improvement and economic consideration. IEEE Trans. Energy Convers. 1995, 10, 419–424. [Google Scholar] [CrossRef]
  18. Chen, J.; Chen, C. Investigation of a new AC electrical machine winding. IEE Proc. Electr. Power Appl. 1998, 145, 125–132. [Google Scholar] [CrossRef]
  19. Lei, Y.; Zhao, Z.; Wang, S.; Dorrell, D.G.; Xu, W. Design and analysis of star–delta hybrid windings for high-voltage induction motors. IEEE Trans. Ind. Electron. 2010, 58, 3758–3767. [Google Scholar] [CrossRef]
  20. Raziee, S.M.; Misir, O.; Ponick, B. Combined Star-Delta Winding Analysis. IEEE Trans. Energy Convers. 2018, 33, 383–394. [Google Scholar] [CrossRef]
  21. Shikun, C. Motor Design, 2nd ed.; Machine Press: Beijing, China, 1990. [Google Scholar]
  22. Aguiar, V.P.B.; Pontes, R.S.T.; Ferreira, F.J.T.E. Technical and Economic Evaluation of Efficiency Improvement after Rewinding in Low-Power Induction Motors: A Brazilian Case. Energies 2018, 11, 1701. [Google Scholar] [CrossRef]
  23. Ho, S.L.; Fu, W.N.; Wong, H.C. Estimation of stray losses of skewed rotor induction motors using coupled 2-D and 3-D time stepping finite element methods. IEEE Trans. Magn. 1998, 34, 3102–3105. [Google Scholar] [CrossRef]
  24. Hernandez-Aramburo, C.A.; Green, T.C.; Smith, A.C. Estimating rotational iron losses in an induction machine. IEEE Trans. Magn. 2003, 39, 3527–3533. [Google Scholar] [CrossRef]
  25. Komeza, K.; Dems, M. Finite-Element and Analytical Calculations of No-Load Core Losses in Energy-Saving Induction Motors. IEEE Trans. Ind. Electron. 2012, 59, 2934–2946. [Google Scholar] [CrossRef]
  26. Yamazaki, K.; Suzuki, A.; Ohto, M.; Takakura, T.; Nakagawa, S. Equivalent Circuit Modeling of Induction Motors Considering Stray Load Loss and Harmonic Torques Using Finite Element Method. IEEE Trans. Magn. 2011, 47, 986–989. [Google Scholar] [CrossRef]
  27. Boglietti, A.; Cavagnino, A.; Ferraris, L.; Lazzari, M. Induction Motor Equivalent Circuit Including the Stray Load Losses in the Machine Power Balance. IEEE Trans. Energy Convers. 2008, 23, 796–803. [Google Scholar] [CrossRef]
  28. Al-Jufout, S.; Al-Rousan, W.; Wang, C. Optimization of Induction Motor Equivalent Circuit Parameter Estimation Based on Manufacturer’s Data. Energies 2018, 11, 1792. [Google Scholar] [CrossRef]
  29. Maxwell ANSYS. Maxwell 2d Technical Notes. In Maxwell Online Help; ANSYS, Inc.: Canonsburg, PA, USA, 2017. [Google Scholar]
  30. Wucherer, A.; Touré, H. Standard Test Procedure for Polyphase Induction Motors and Generators; Institute of Electrical and Electronics Engineers: New York, NY, USA, 2004. [Google Scholar]
  31. Hsu, J.S.; Kueck, J.D.; Olszewski, M.; Casada, D.A.; Otaduy, P.J.; Tolbert, L.M. Comparison of induction motor field efficiency evaluation methods. In Proceedings of the IAS’96 Conference Record of the 1996 IEEE Industry Applications Conference Thirty-First IAS Annual Meeting, San Diego, CA, USA, 6–10 October 1996; pp. 703–712. [Google Scholar] [CrossRef] [Green Version]
Figure 1. Program structure of hybrid methodology.
Energies 12 04497 g001
Figure 2. Flowchart of the loss calculations.
Energies 12 04497 g002
Figure 3. FEA model and BH magnetization curve: (a) FEA model and mesh; (b) BH magnetization curve of electrical steel lamination DW470-50.
Energies 12 04497 g003
Figure 4. Δ windings and phasors: (a) Single-double-layer winding; (b) Double-layer winding; (c) Effective Δ phasor arrangement.
Energies 12 04497 g004
Figure 5. Y-Δ windings and phasors: (a) Outer-Y-inner-Δ series winding; (b) Effective Y-Δ phasor arrangement.
Energies 12 04497 g005
Figure 6. Comparison of harmonic MMF of the four stator windings.
Energies 12 04497 g006
Figure 7. Calculation results of output power versus air gap length for the four stator windings.
Energies 12 04497 g007
Figure 8. Calculation results of losses versus air gap length: (a) winding #1; (b) winding #2; (c) winding #3; (d) winding #4.
Energies 12 04497 g008
Figure 9. Calculation results of line currents versus air gap length for the four stator windings.
Energies 12 04497 g009
Figure 10. Calculation results of efficiency versus air gap length for the four stator windings.
Energies 12 04497 g010
Figure 11. Calculation results of power factor versus air gap length for the four stator windings.
Energies 12 04497 g011
Figure 12. Phase current of Δ winding versus time with 0.3 mm air gap.
Energies 12 04497 g012
Figure 13. 3rd harmonic current amplitude of phase current of Δ winding versus air gap length for the four stator windings.
Energies 12 04497 g013
Figure 14. Copper loss generated by 3rd harmonic current versus air gap length for the four stator windings.
Energies 12 04497 g014
Figure 15. Differential leakage coefficient for the four stator windings.
Energies 12 04497 g015
Figure 16. Steady-state stator differential leakage reactance versus different air gap for the four stator windings.
Energies 12 04497 g016
Figure 17. Steady-state rotor differential leakage reactance versus different air gap for the four stator windings.
Energies 12 04497 g017
Figure 18. Steady-state rotor slot leakage reactances versus different air gap for the four stator windings.
Energies 12 04497 g018
Figure 19. Reciprocal of total leakage reactances versus different air gap for the four stator windings.
Energies 12 04497 g019
Figure 20. Starting saturation coefficients versus different air gap for the four stator windings.
Energies 12 04497 g020
Figure 21. Reciprocal of magnitude square of total impedances at starting time.
Energies 12 04497 g021
Figure 22. Experimental system.
Energies 12 04497 g022
Figure 23. Experimental results of efficiency versus air gap length for the four stator windings.
Energies 12 04497 g023
Figure 24. Experimental results of power factor versus air gap length for the four stator windings.
Energies 12 04497 g024
Table 1. Characteristics and parameters of the induction motor.
ParameterValue
Number of phases, m3
Electrical output power, Pout (kW)11
Rated line voltage, UN (V)380
Frequency, f (Hz)50
Synchronous speed, n (rpm)1500
Number of pole pairs, p2
Number of stator slots, Ns48
Stator outer diameter, D1out (mm)260
Stator inner diameter, D1in (mm)180
Axial length, L (mm)170
ServiceS1
Table 2. Main Parameters of the four types of windings.
Parameter5/6Single-Layer Y-Δ11/122/3
S.D.L. ΔY-ΔY-Δ
No.#1#2#3#4
y/τ5/6111/122/3
p2222
qqsd = 4qY1 = qΔ1 = 2qY2 = qΔ2 = 2qY3 = qΔ3 = 2
α15°15°15°15°
NNsd = 176NY1 = 48NY2 = 48NY3 = 56
NΔ1 = 84NΔ2 = 80NΔ3 = 96
nstrnstr-sd = 5nstr-Y1 = 10nstr-Y2 = 10nstr-Y3 = 5
nstr-Δ1 = 6nstr-Δ2 = 6nstr-Δ3 = 5
dw (mm)dw-sd = 0.8dw-Y1 = 0.77dw-Y2 = 0.77dw-Y3 = 1.12
dw-Δ1 = 0.77dw-Δ2 = 0.77dw-Δ3 = 0.77
R1sm(at 77 °C, Ω)R = 1.059R = 0.476R3Δ = 0.461R4Δ = 0.498
R2Y = 0.164R3Y = 0.166R4Y = 0.173
Table 3. Stator and rotor steady-state leakage reactances of the four stator windings.
Winding No.#1#2#3#4
Parameter (p.u.)
x ^ s 1 0.01030.01000.00980.0099
x ^ e 1 0.00820.00870.00780.0087
x ^ e 2 0.00460.00440.00410.0044
Table 4. Experimental devices.
No.NameModelErrorQuantity
1Eddy-Current DynamometerDW160---1
2Three-Phase TransformerTSGC2---1
3Digital Torque-Speed Transducer500A±0.2%1
4Power AnalyzerNORMA 5000/PP64±0.03%1
5Current TransducerLT 58-S7±0.5%3
6Two-Arm BridgeQJ57P-1±0.05%1
Table 5. Experimental results of four 11 kW induction motors.
Winding No.#1#2#3#4
Parameter
R1sm (@ 3 °C, Ω)R1Δ = 0.853R2Δ = 0.402R3Δ = 0.366R4Δ = 0.474
R2Y = 0.138R3Y = 0.132R4Y = 0.131
R1sm (after full-load, Ω)R1Δ = 0.963R2Δ = 0.428R3Δ = 0.409R4Δ = 0.527
R2Y = 0.147R3Y = 0.147R4Y = 0.146

