Analysis of the Electric Bus Autonomy Depending on the Atmospheric Conditions
Abstract
1. Introduction
2. Materials and Methods
2.1. Electric Bus Model
2.1.1. Electric Bus Model Data
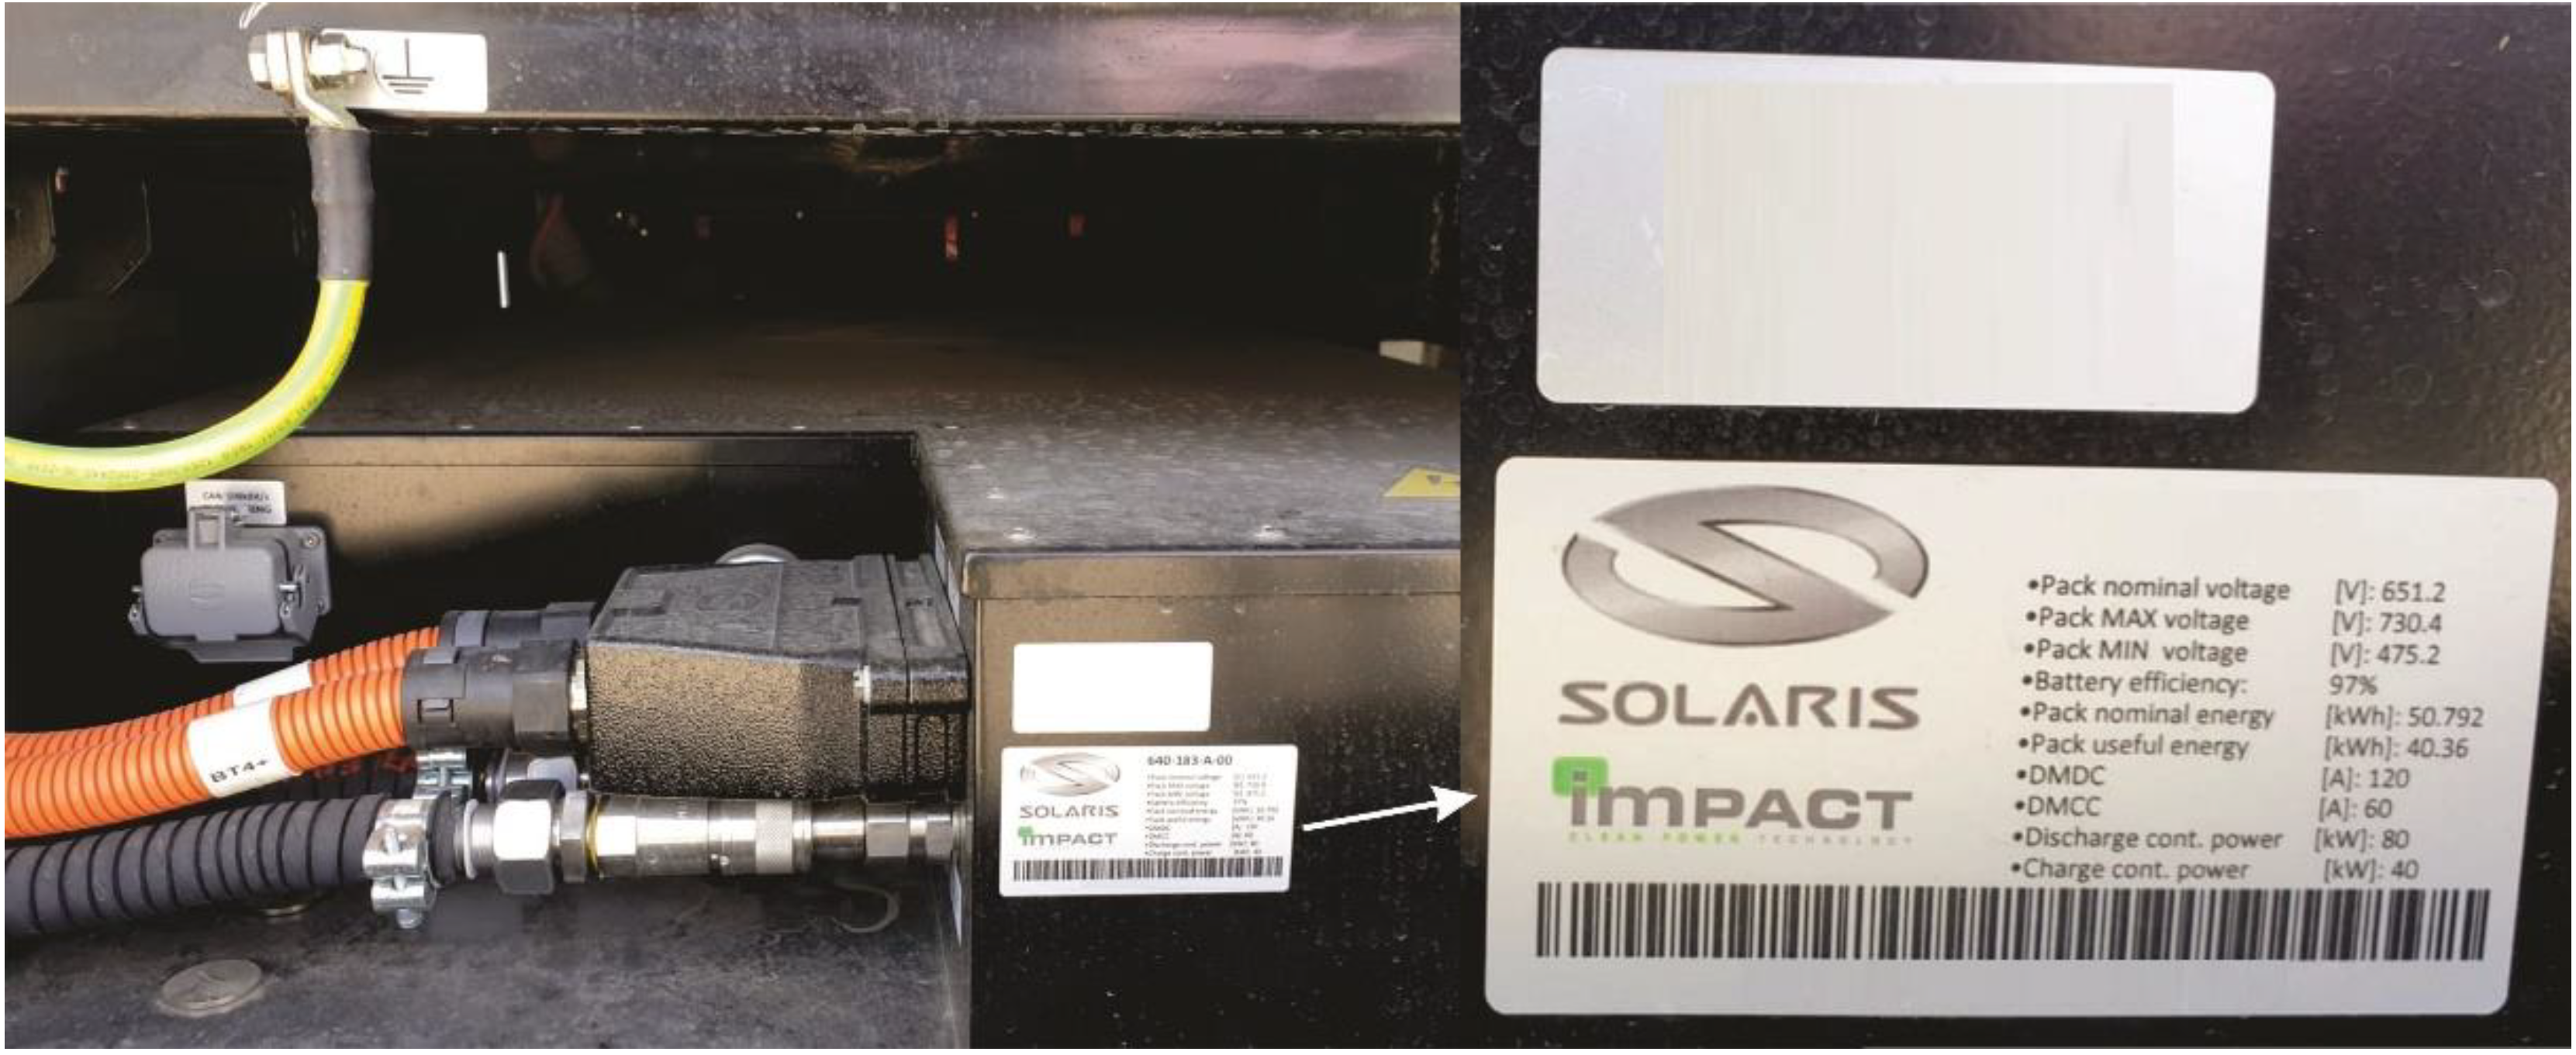
2.1.2. Battery Pack Data
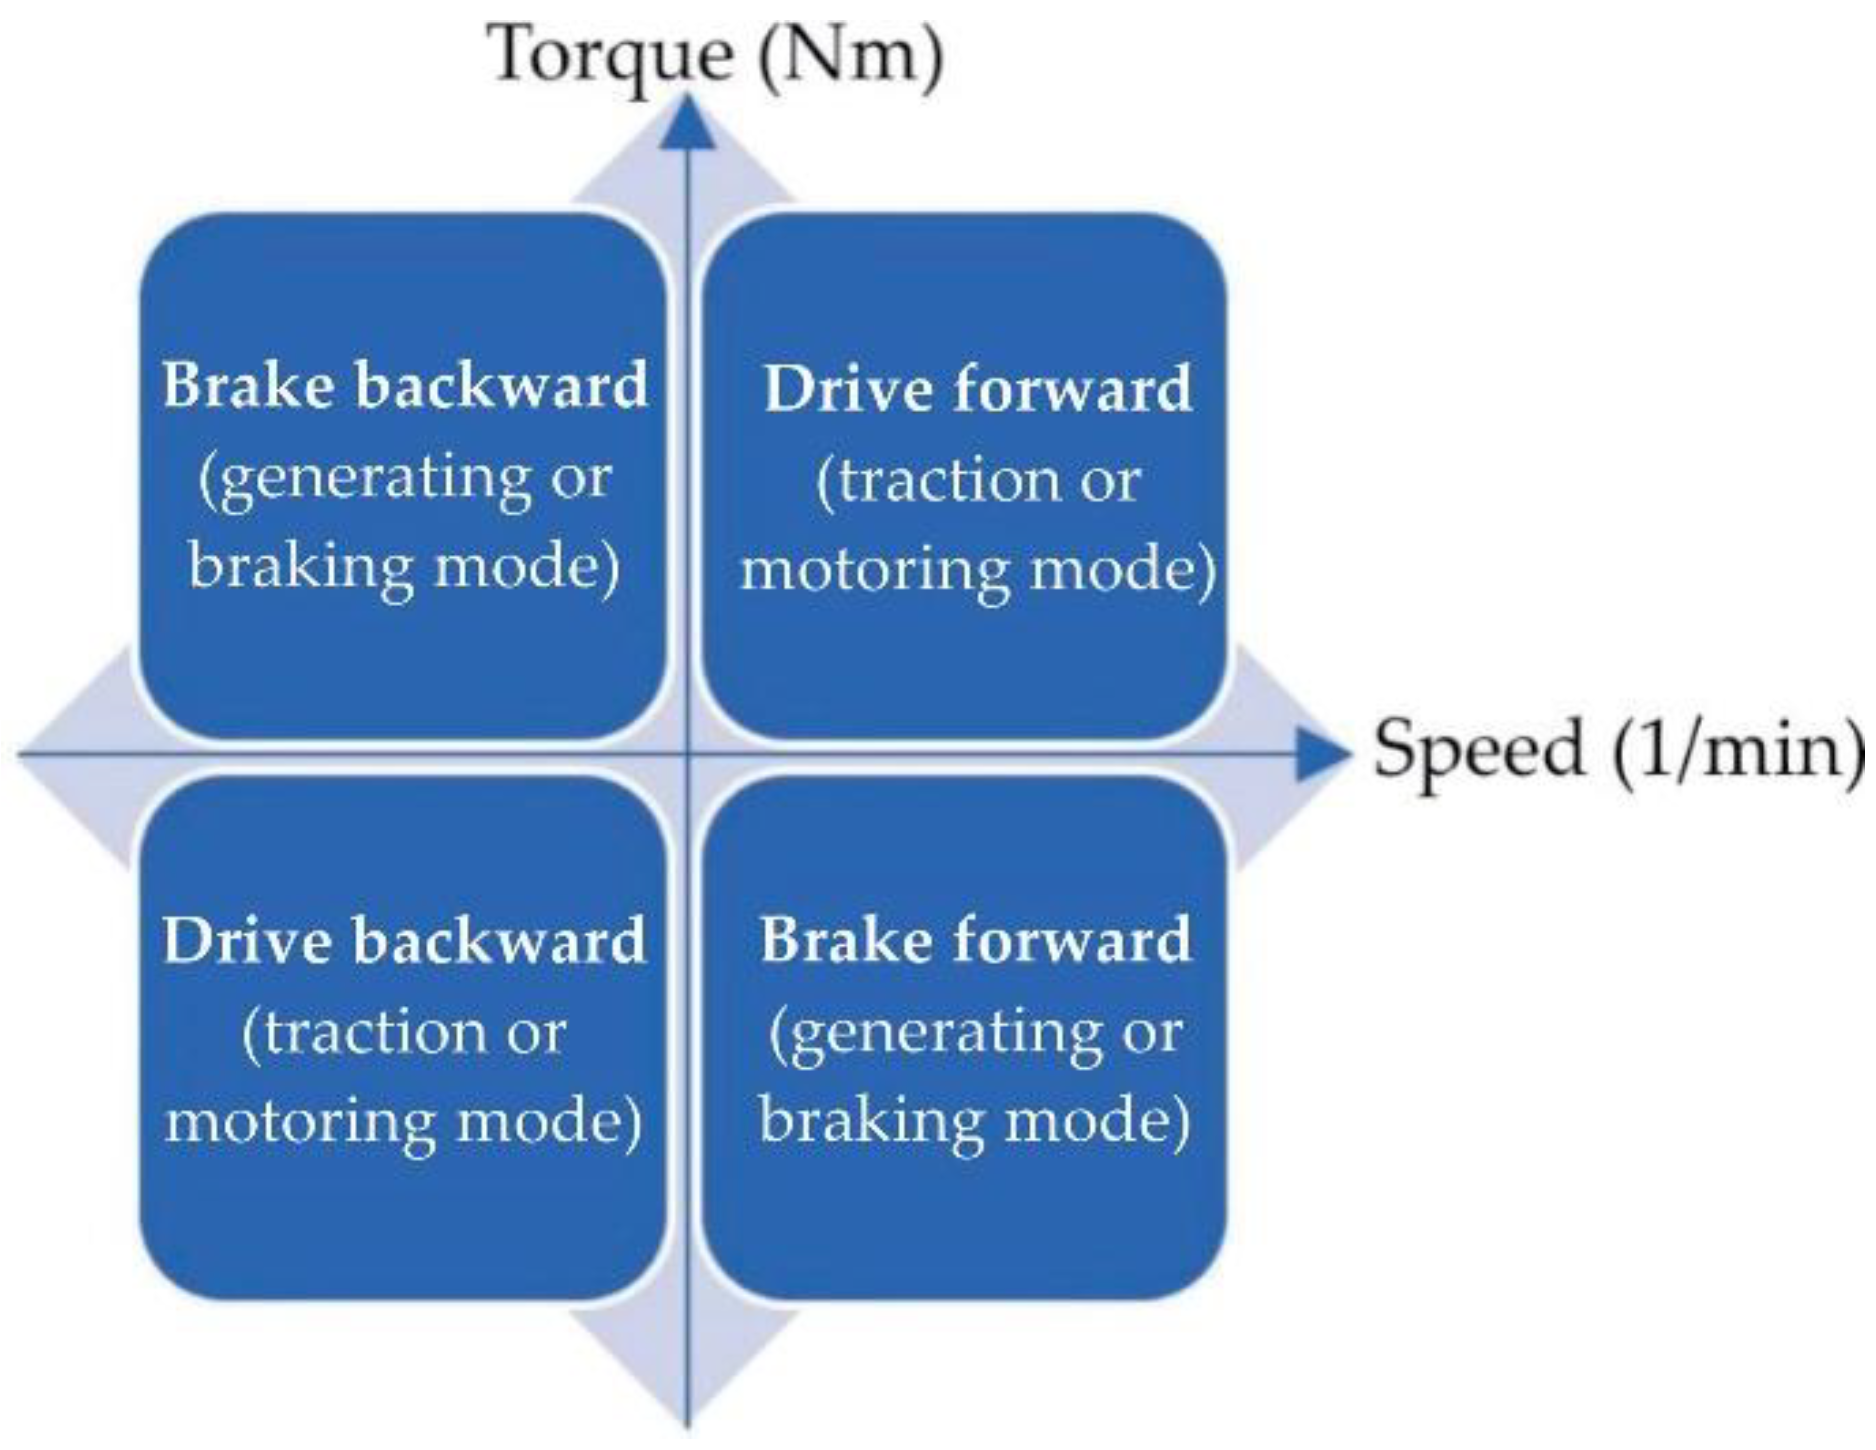
2.1.3. Electric Machine
2.2. Environment Model
2.2.1. Ambient Temperature
2.2.2. Ambient Humidity
2.2.3. Pressure and Air Density
2.3. Energy Balance
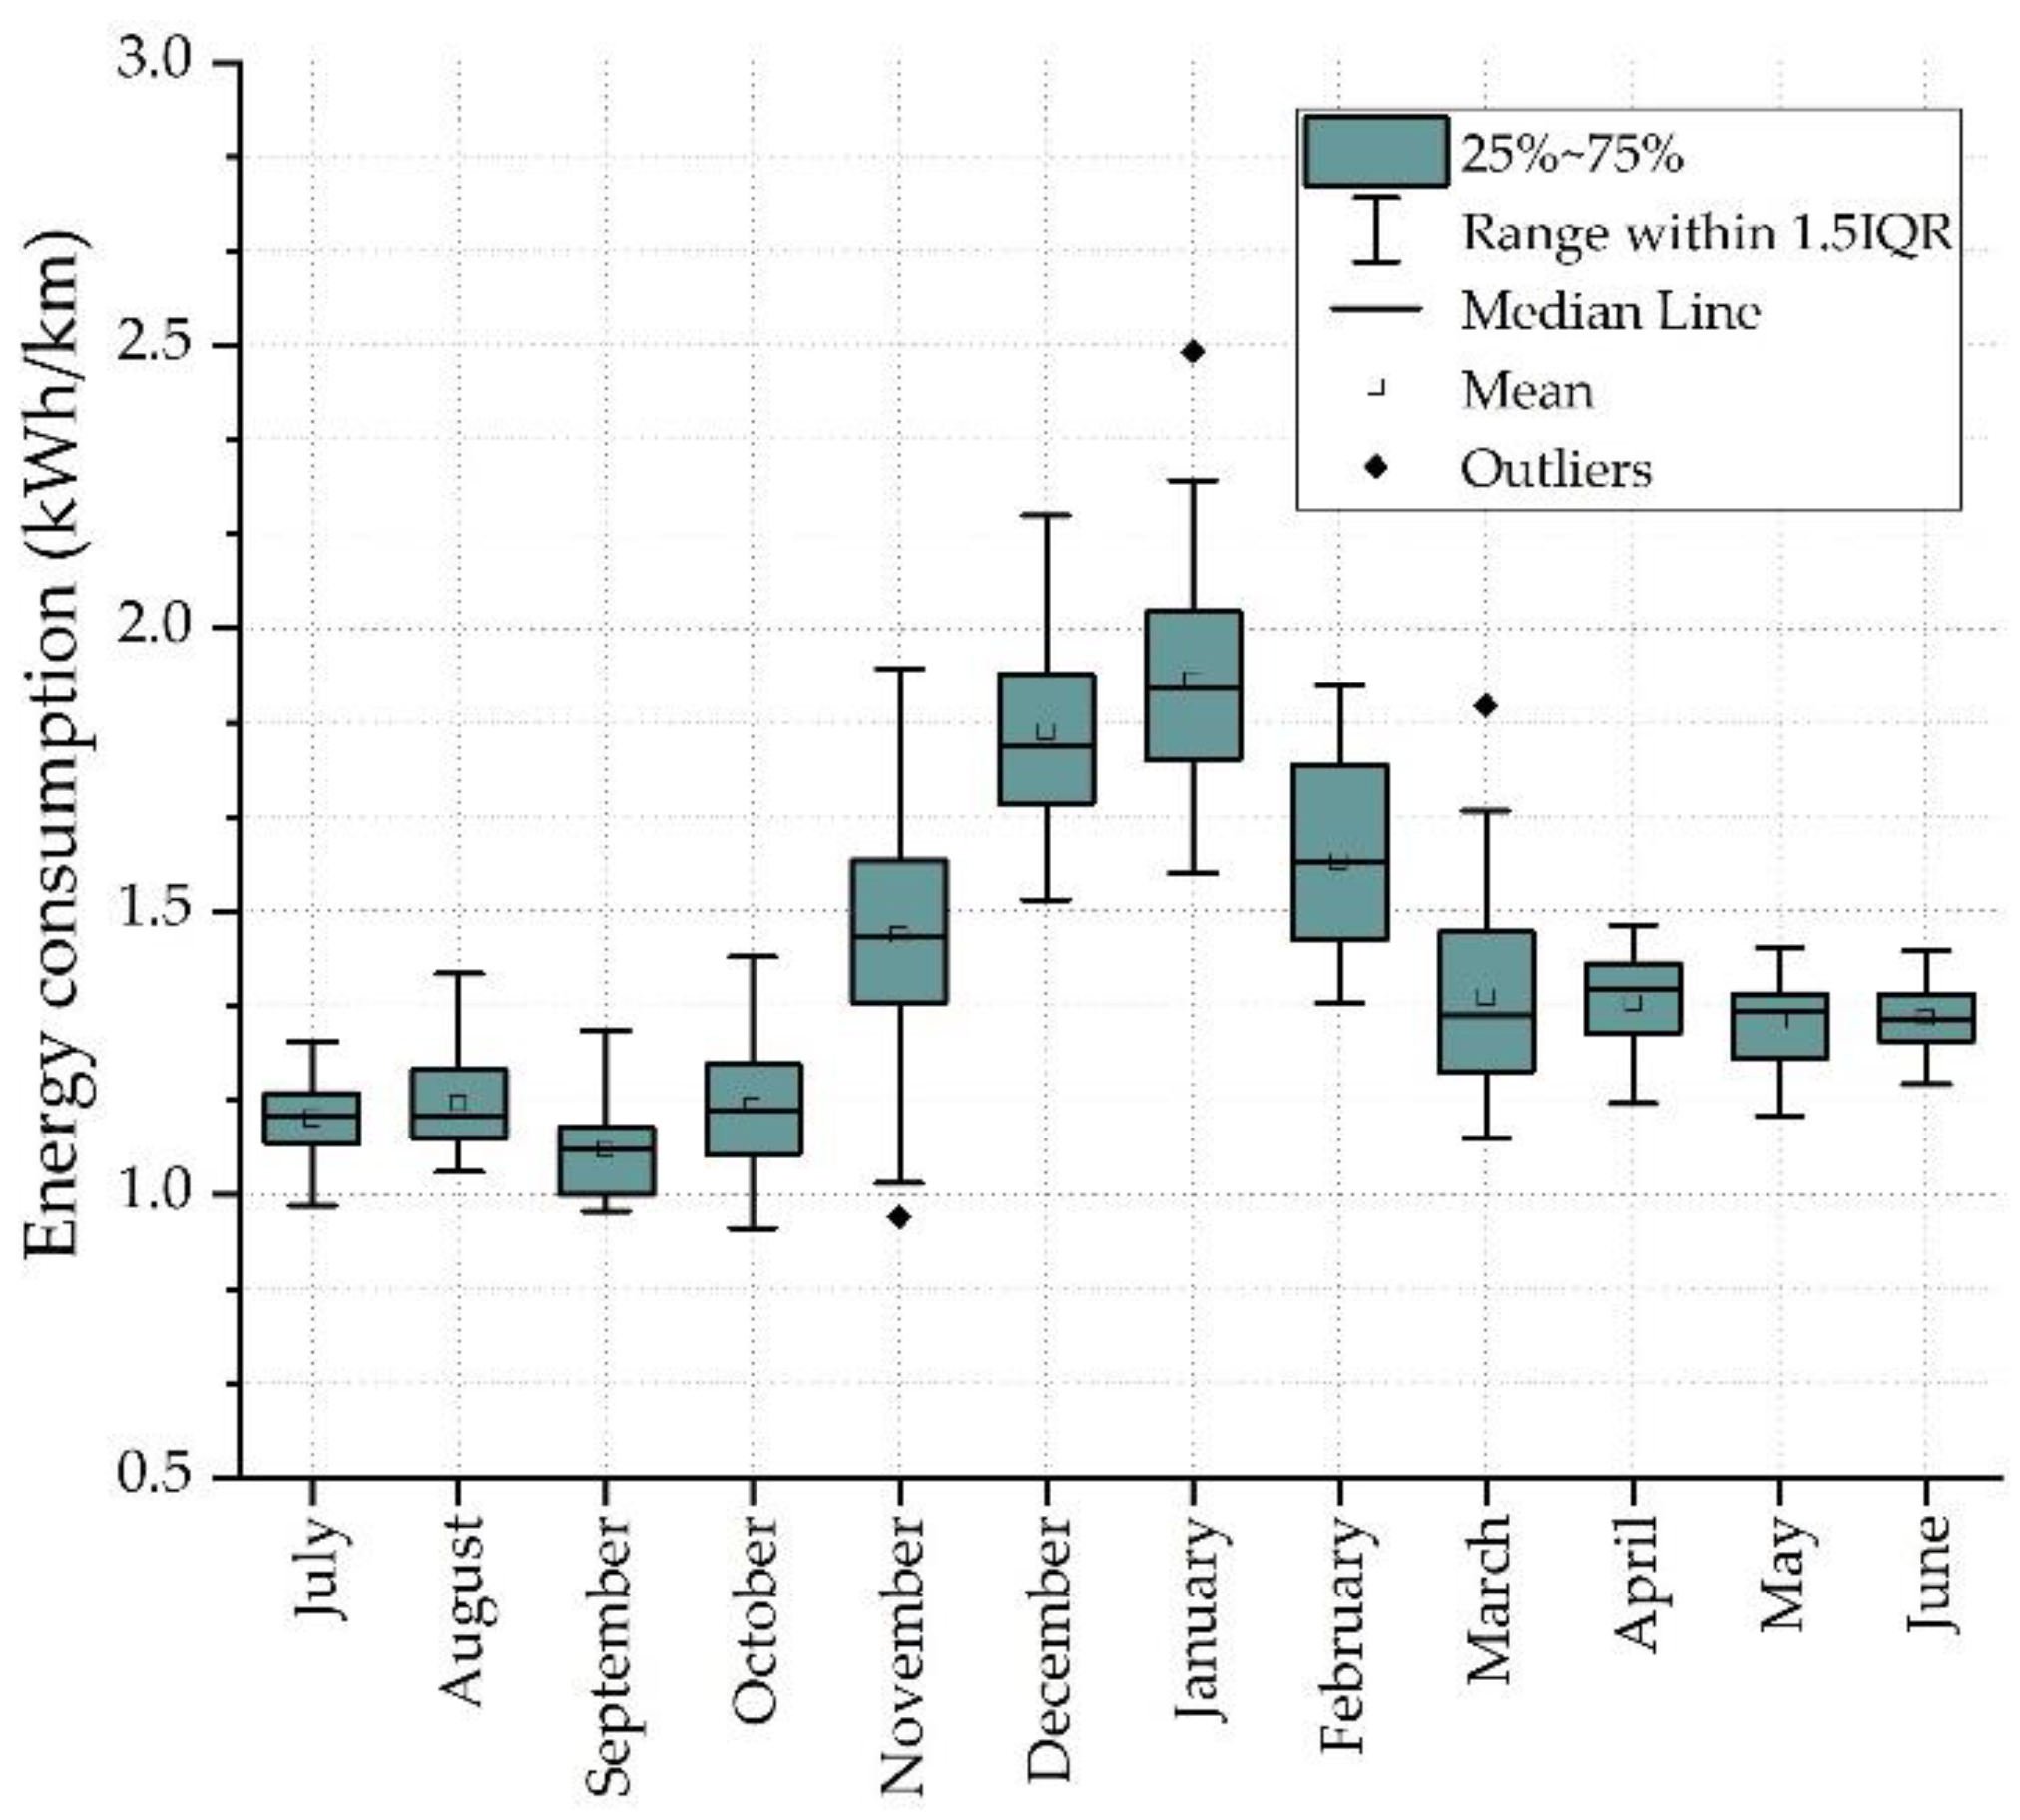
2.3.1. Energy Consumption
2.3.2. Regenerative Braking Energy
2.3.3. Total Energy Balance
3. Results
4. Discussion
5. Conclusions
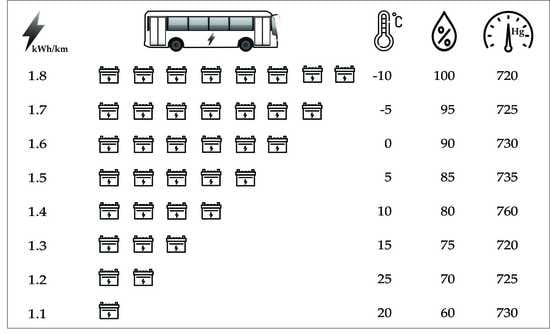
- The climatic parameters influence the consumption and energy recovery for the electric buses;
- The energy consumption of the electric buses increases with the decreasing of the temperature and the atmospheric pressure, but the same tendency exists even if the humidity and density of the air increase;
- The energy recovered by the regenerative braking of the electric buses increases with the increase of the temperature and decreases with the increase of the air humidity, its density, and the atmospheric pressure;
- Energy recovery largely compensates the energy consumption of the electric buses;
- The variations of the monitored parameters, obtained as monthly average values, compared with their annual average values, highlight the interdependence of these quantities;
- Average energy consumption, within the normal limits specified by the manufacturer and maximum energy recoveries, was obtained on the transition to the warm season;
- The energy consumption of the electric buses increases when the buses accelerate or when the buses climb the ramps, and it decreases when the buses decelerate or descend from the ramp.
Author Contributions
Funding
Acknowledgments
Conflicts of Interest
References
- Jayakumar, A.; Chamber, A.; Lie, T.T. Review of prospects for adoption of fuel cell electric vehicles in New Zealand. IET Electr. Syst. Transp. 2017, 7, 259–266. [Google Scholar] [CrossRef]
- Grijalva, E.R.; López Martínez, J.M. Analysis of the Reduction of CO2 Emissions in Urban Environments by Replacing Conventional City Buses by Electric Bus Fleets: Spain Case Study. Energies 2019, 12, 525. [Google Scholar] [CrossRef]
- Varga, B.O.; Iclodean, C.; Mariașiu, F. Electric and Hybrid Buses for Urban Transport Energy Efficiency Strategies, 1st ed.; Springer International Publishing: Cham, Switzerland, 2016; pp. 85–103. [Google Scholar]
- Official Journal of the European Union. Directive (EU) 2018/2001 of the European Parliament and of the Council of 11 December 2018 on the Promotion of the Use of Energy from Renewable Sources (Recast). 2018. Available online: https://eur-lex.europa.eu/legal-content/EN/TXT/PDF/?uri=CELEX:32018L2001&from=ro (accessed on 14 October 2019).
- Vepsäläinen, J.; Ritari, A.; Lajunen, A.; Kivekäs, K.; Tammi, K. Energy Uncertainty Analysis of Electric Buses. Energies 2018, 11, 3267. [Google Scholar] [CrossRef]
- Bak, D.B.; Bak, J.S.; Kim, S.Y. Strategies for Implementing Public Service Electric Bus Lines by Charging Type in Daegu Metropolitan City, South Korea. Sustainability 2018, 10, 3386. [Google Scholar] [CrossRef]
- Topal, O.; Nakir, I. Total Cost of Ownership Based Economic Analysis of Diesel, CNG and Electric Bus Concepts for the Public Transport in Istanbul City. Energies 2018, 11, 2369. [Google Scholar] [CrossRef]
- Bagotsky, V.S.; Skundin, A.M.; Volfkovich, Y.M. Electrochemical Power Sources: Batteries, Fuel Cells, and Supercapacitors; John Wiley & Sons, Inc.: Hoboken, NJ, USA, 2015; pp. 91–103. [Google Scholar]
- Electric Buses: Everything is Changing, Solaris Bus & Coach. Available online: http://www.oradea.ro/fisiere/module_fisiere/26259/1)%20RO_Solaris_Electric_2017_RO-1.pdf (accessed on 14 October 2019).
- Li, W.; Stanula, P.; Egede, P.; Kara, S.; Herrmann, C. Determining the main factors influencing the energy consumption of electric vehicles in the usage phase. Procedia CIRP 2016, 48, 352–357. [Google Scholar] [CrossRef]
- Kivekäs, K.; Lajunen, A.; Vepsäläinen, J.; Tammi, K. City Bus Powertrain Comparison: Driving Cycle Variation and Passenger Load Sensitivity Analysis. Energies 2018, 11, 1755. [Google Scholar] [CrossRef]
- Raab, A.F.; Lauth, E.; Strunz, K.; Göhlich, D. Implementation Schemes for Electric Bus Fleets at Depots with Optimized Energy Procurements in Virtual Power Plant Operations. World Electr. Veh. J. 2019, 10, 5. [Google Scholar] [CrossRef]
- Studiu Oportunitate 2018. Primăria și Consiliul Local Cluj-Napoca. Study of Opportunity 2018. Available online: https://storage.primariaclujnapoca.ro/userfiles/files/studiu-oportunitate-autobuze-final.pdf (accessed on 9 April 2019). (In Romanian).
- Vellucci, F.; Pede, G. Fast-Charge Life Cycle Test on a Lithium-Ion Battery Module. World Electr. Veh. J. 2018, 9, 13. [Google Scholar] [CrossRef]
- Cho, J.; Jeong, S.; Kim, Y. Commercial and research battery technologies for electrical energy storage applications. Prog. Energy Combust. Sci. 2015, 48, 84–101. [Google Scholar] [CrossRef]
- Broussely, M.; Pistoia, G. Industrial Applications of Batteries: From Cars to Aerospace and Energy Storage, 1st ed.; Elsevier Science: Amsterdam, The Netherlands, 2007; pp. 203–271. [Google Scholar]
- Demircali, A.; Sergeant, P.; Koroglu, S.; Kesler, S.; Oztürk, E.; Tumbek, M. Influence of the temperature on energy management in battery-ultracapacitor electric vehicles. J. Clean. Prod. 2018, 176, 716–725. [Google Scholar] [CrossRef]
- Iora, P.; Tribioli, L. Effect of Ambient Temperature on Electric Vehicles’ Energy Consumption and Range: Model Definition and Sensitivity Analysis Based on Nissan Leaf Data. World Electr. Veh. J. 2019, 10, 2. [Google Scholar] [CrossRef]
- Qian, K.; Zhou, C.; Yuan, V.; Allan, M. Temperature Effect on Electric Vehicle Battery Cycle Life in Vehicle-to-Grid Applications. In Proceedings of the CICED 2010 China International Conference on Electricity Distribution, Nanjing, China, 13–16 September 2010. [Google Scholar]
- Transit Cooperative Research Program. Battery Electric Buses—State of the Practice; The National Academies Press: Washington, DC, USA, 2018; Available online: https://www.nap.edu/catalog/25061/battery-electric-buses-state-of-the-practice (accessed on 1 October 2019).
- Lindgren, J.; Lund, P.D. Effect of extreme temperatures on battery charging and performance of electric vehicles. J. Power Sources 2016, 328, 37–45. [Google Scholar] [CrossRef]
- Waldmann, T.; Wilka, M.; Kasper, M.; Fleischhammer, M.; Wohlfahrt-Mehrens, M. Temperature dependent ageing mechanisms in Lithium-ion batteries—A Post-Mortem study. J. Power Sources 2014, 262, 129–135. [Google Scholar] [CrossRef]
- Yi, Z.; Smart, J.; Shirk, M. Energy impact evaluation for eco-routing and charging of autonomous electric vehicle fleet: Ambient temperature consideration. Transp. Res. Part C Emerg. Technol. 2018, 89, 344–363. [Google Scholar] [CrossRef]
- Yuksel, T.; Michalek, J.J. Effects of Regional Temperature on Electric Vehicle Efficiency, Range, and Emissions in the United States. Environ. Sci. Technol. 2015, 49, 3974–3980. [Google Scholar] [CrossRef] [PubMed]
- Zhang, Z.; Li, W.; Zhang, C.; Chen, J. Climate control loads prediction of electric vehicles. Appl. Therm. Eng. 2017, 110, 1183–1188. [Google Scholar] [CrossRef]
- Zhu, T.; Min, H.; Yu, Y.; Zhao, Z.; Xu, T.; Chen, Y.; Li, X.; Zhang, C. An Optimized Energy Management Strategy for Preheating Vehicle-Mounted Li-ion Batteries at Subzero Temperatures. Energies 2017, 10, 243. [Google Scholar] [CrossRef]
- Jardin, P.; Esser, A.; Givone, S.; Eichenlaub, T.; Schleiffer, J.E.; Rinderknecht, S. The Sensitivity in Consumption of Different Vehicle Drivetrain Concepts Under Varying Operating Conditions: A Simulative Data Driven Approach. Vehicles 2019, 1, 69–87. [Google Scholar] [CrossRef]
- Hu, X.; Huang, B.; Cherubini, F. Impacts of idealized land cover changes on climate extremes in Europe. Ecol. Indic. 2019, 104, 626–635. [Google Scholar] [CrossRef]
- Reckiena, D.; Salvia, M.; Pietrapertosa, F.; Simoes, S.G.; Olazabal, M.; De Gregorio Hurtado, S.; Geneletti, D.; Krkoška Lorencová, E.; D’Alonzo, V.; Krook-Riekkola, A.; et al. Dedicated versus mainstreaming approaches in local climate plans in Europe. Renew. Sustain. Energy Rev. 2019, 112, 948–959. [Google Scholar] [CrossRef]
- Soares, M.B.; Alexander, M.; Dessai, S. Sectoral use of climate information in Europe: A synoptic overview. Clim. Serv. 2018, 9, 5–20. [Google Scholar] [CrossRef]
- Rymarz, J.; Niewczas, A.; Stoklosa, J. Reliability Evaluation of the City Transport Buses Under Actual Conditions. Transp. Telecommun. 2015, 16, 259–266. [Google Scholar] [CrossRef]
- Briec, E.; Müller, B. (Eds.) Electric Vehicle Batteries: Moving from Research towards Innovation, Reports of the PPP European Green Vehicles Initiative; Springer International Publishing: Cham, Switzerland; Berlin, Germany, 2015. [Google Scholar]
- Qin, N.; Brooker, R.P.; Raissi, A. Electric Bus Systems. EVTC Report Number: FSEC-CR-2060-17. 2017. Available online: http://www.fsec.ucf.edu/en/publications/pdf/FSEC-CR-2060-17.pdf (accessed on 2 October 2019).
- Linden, D.; Reddy, T.B. (Eds.) Handbook of Batteries, 3rd ed.; McGraw-Hill: New York, NY, USA, 2002. [Google Scholar]
- Nitta, N.; Wu, F.; Lee, J.T.; Yushin, G. Li-ion battery materials: Present and future. Mater. Today 2015, 18, 252–264. [Google Scholar] [CrossRef]
- Łebkowski, A. Studies of Energy Consumption by a City Bus Powered by a Hybrid Energy Storage System in Variable Road Conditions. Energies 2019, 12, 951. [Google Scholar] [CrossRef]
- Andreev, A.A.; Vozmilov, A.G.; Kalmakov, V.A. Simulation of lithium battery operation under severe temperature conditions. J.Proeng 2015, 129, 201–206. [Google Scholar] [CrossRef][Green Version]
- AVL CRUISE, Users Guide; VERSION 2011, Document No. 04.0104.2011, Edition 06/2011; AVL LIST GmbH: Graz, Austria, 2011.
- Solaris Electric Buses experience and Further Development, Electrické Autobusy pro Mĕsto II. Available online: http://www.proelektrotechniky.cz/pdf/SeminarEbusyII/Figaszewski_Solaris_Ebus.pdf (accessed on 3 October 2019).
- Liu, H.; Wang, C.; Zhao, X.; Guo, C. An Adaptive-Equivalent Consumption Minimum Strategy for an Extended-Range Electric Bus Based on Target Driving Cycle Generation. Energies 2018, 11, 1805. [Google Scholar] [CrossRef]
- Soltani, M.; Ronsmans, J.; Kakihara, S.; Jaguemont, J.; Van den Bossche, P.; Van Mierlo, J.; Omar, N. Hybrid Battery/Lithium-Ion Capacitor Energy Storage System for a Pure Electric Bus for an Urban Transportation Application. Appl. Sci. 2018, 8, 1176. [Google Scholar] [CrossRef]
- Yildiz, M.; Karakoc, H.; Dincer, I. Modeling and validation of temperature changes in a pouch lithium-ion battery at various discharge rates. Int. Commun. Heat Mass Transf. 2016, 75, 311–314. [Google Scholar] [CrossRef]
- Mallon, K.R.; Assadian, F.; Fu, B. Analysis of On-Board Photovoltaics for a Battery Electric Bus and Their Impact on Battery Lifespan. Energies 2017, 10, 943. [Google Scholar] [CrossRef]
- Wu, X.; Lv, S.; Chen, J. Determination of the Optimum Heat Transfer Coefficient and Temperature Rise Analysis for a Lithium-Ion Battery under the Conditions of Harbin City Bus Driving Cycles. Energies 2017, 10, 1723. [Google Scholar] [CrossRef]
- Bloomberg New Energy Finance, Electric Buses in Cities—Driving Towards Cleaner Air and Lower CO2. 29 March 2018. Available online: https://data.bloomberglp.com/professional/sites/24/2018/05/Electric-Buses-in-Cities-Report-BNEF-C40-Citi.pdf (accessed on 10 October 2019).
- Du, Y.; Zhao, Y.; Wang, Q.; Zhang, Y.; Xi, H. Trip-oriented stochastic optimal energy management strategy for plug-in hybrid electric bus. Energy 2016, 115, 1259–1271. [Google Scholar] [CrossRef]
- Emadi, A. (Ed.) Advanced Electric Drive Vehicles (Energy, Power Electronics, and Machines); CRC Press, Taylor & Francis Group, LLC: Boca Raton, FL, USA, 2015; pp. 491–517. [Google Scholar]
- Kumar, L.; Jain, S. Electric propulsion system for electric vehicular technology: A review. Renew. Sustain. Energy Rev. 2014, 29, 924–940. [Google Scholar] [CrossRef]
- Varga, B.O.; Mariașiu, F.; Moldovanu, D.; Iclodean, C. Electric and Plug-In Hybrid Vehicles, Advanced Simulation Methodologies; Springer International Publishing: Cham, Switzerland, 2015; pp. 116–137. [Google Scholar]
- Luin, B.; Petelin, S.; Al-Mansour, F. Microsimulation of electric vehicle energy consumption. Energy 2019, 174, 24–32. [Google Scholar] [CrossRef]
- Li, L.; Zhang, Y.; Yang, C.; Yan, B.; Martinez, C.M. Model predictive control-based efficient energy recovery control strategy for regenerative braking system of hybrid electric bus. Energy Convers. Manag. 2016, 111, 299–314. [Google Scholar] [CrossRef]
- Arriva Meteo în Cluj-Napoca. Available online: https://rp5.ru/Arhiva_meteo_%C3%AEn_Cluj-Napoca (accessed on 1 October 2019).
- Air Density Calculator: Altitude, Temperature, Humidity and Barometric Pressure of Weather Systems and Their Impact on Local Atmospheric Air Density. Available online: https://barani.biz/apps/air-density/ (accessed on 10 October 2019).
- The Engineering ToolBox, Air Psychrometrics. Available online: https://www.engineeringtoolbox.com/air-psychrometrics-properties-t_8.html (accessed on 10 October 2019).
- Delos Reyes, J.R.M.; Parsons, R.V.; Hoemsen, R. Winter Happens: The Effect of Ambient Temperature on the Travel Range of Electric Vehicles. IEEE Trans. Veh. Technol. 2016, 65, 4016–4022. [Google Scholar] [CrossRef]
- Panchal, S.; Dincer, I.; Agelin-Chaab, M.; Fraser, R.; Fowler, M. Thermal modeling and validation of temperature distributions in a prismatic lithium-ion battery at different discharge rates and varying boundary conditions. Appl. Eng. 2016, 96, 190–199. [Google Scholar] [CrossRef]
- Scarinci, R.; Zanarini, A.; Bierlaire, M. Electrification of urban mobility: The case of catenary-free buses. Transp. Policy 2019, 80, 39–48. [Google Scholar] [CrossRef]
- Yuan, X.; Zhang, C.; Hong, G.; Huang, X.; Li, L. Method for evaluating the real-world driving energy consumptions of electric vehicles. Energy 2017, 141, 1955–1968. [Google Scholar] [CrossRef]
- ISO 8714-2002, Electric Road Vehicles—Reference Energy Consumption and Range—Test Procedures for Passenger Cars and Light Commercial Vehicles. Available online: https://www.iso.org/standard/34087.html (accessed on 1 October 2019).
- GB/T 18386-2017, Electric Vehicles—Energy Consumption and Range—Test Procedures. Available online: http://www.gbstandards.org/GB_standards/GB-T%2018386-2017.html (accessed on 1 October 2019).
- Thoreb, CTP Cluj-Napoca. Available online: http://www.thoreb.com/index.php/ro/referinte/31-europe/70-ctp-cluj-napoca (accessed on 1 October 2019).


| Parameters | Unit | Value |
|---|---|---|
| Length/Width/Height | m | 12.00/2.55/3.25 |
| Distance from hitch to front axle | m | 9.30 |
| Wheelbase | m | 5.90 |
| Nominal/Loaded Weight | kg | 13,800/18,000 |
| Number of passenger’s seats/total | - | 23/70 |
| Motor (type) | - | Electric asynchronous |
| Maximum engine power | kW | 160 |
| Maximum engine torque | Nm | 1450 |
| Inverter input voltage | Vcc | 687 |
| Inverter output voltage | Vca | 3 × 380 |
| Batteries (type) | - | Li4Ti5O12 (LTO) |
| Battery capacity | kWh | 210 |
| Battery voltage | Vcc | 687 |
| Energy consumption summer/winter | kWh/km | 1.00/2.00 |
| Autonomy (producer) | km | 105 |
| Autonomy (real) | km | 75–150 |
| Parameters | Unit | Value | |
|---|---|---|---|
| Cells | Nominal cells capacity | Ah | 26 |
| Nominal cells voltage | V | 3.7 | |
| Nominal cells energy | kWh | 0.0962 | |
| Modules | Nominal modules energy | kWh | 6.25 |
| Number of modules | - | 8 | |
| Mass of module | kg | 42 | |
| Pack | Nominal packs capacity | Ah | 58.8 |
| Nominal packs voltage | V | 687 | |
| Nominal packs energy | kWh | 41.22 | |
| Number of modules | - | 3–6 | |
| Mass of pack | kg | 485 |
| Month | µ | SD | Min | Q1 | Med | Q3 | Max |
|---|---|---|---|---|---|---|---|
| July 2018 | 1.13 | 0.07 | 0.98 | 1.09 | 1.13 | 1.18 | 1.27 |
| August 2018 | 1.16 | 0.08 | 1.04 | 1.10 | 1.16 | 1.22 | 1.39 |
| September 2018 | 1.08 | 0.08 | 0.97 | 1.00 | 1.08 | 1.12 | 1.29 |
| October 2018 | 1.16 | 0.11 | 0.94 | 1.07 | 1.16 | 1.23 | 1.42 |
| November 2018 | 1.48 | 0.25 | 1.02 | 1.34 | 1.48 | 1.60 | 1.93 |
| December 2018 | 1.82 | 0.17 | 1.52 | 1.69 | 1.82 | 1.92 | 2.20 |
| January 2019 | 1.91 | 0.19 | 1.56 | 1.76 | 1.89 | 2.02 | 2.26 |
| February 2019 | 1.59 | 0.17 | 1.33 | 1.44 | 1.59 | 1.77 | 1.90 |
| March 2019 | 1.35 | 0.18 | 1.10 | 1.20 | 1.33 | 1.45 | 1.67 |
| April 2019 | 1.34 | 0.10 | 1.16 | 1.27 | 1.34 | 1.41 | 1.47 |
| May 2019 | 1.31 | 0.07 | 1.14 | 1.24 | 1.31 | 1.35 | 1.43 |
| June 2019 | 1.31 | 0.06 | 1.19 | 1.26 | 1.31 | 1.35 | 1.43 |
| Month | µ | SD | Min | Q1 | Med | Q3 | Max |
|---|---|---|---|---|---|---|---|
| July 2018 | 0.43 | 0.05 | 0.35 | 0.38 | 0.42 | 0.46 | 0.53 |
| August 2018 | 0.40 | 0.05 | 0.29 | 0.37 | 0.41 | 0.44 | 0.47 |
| September 2018 | 0.42 | 0.02 | 0.39 | 0.41 | 0.43 | 0.44 | 0.46 |
| October 2018 | 0.43 | 0.03 | 0.36 | 0.41 | 0.44 | 0.45 | 0.49 |
| November 2018 | 0.37 | 0.04 | 0.29 | 0.35 | 0.37 | 0.40 | 0.45 |
| December 2018 | 0.29 | 0.04 | 0.20 | 0.27 | 0.30 | 0.33 | 0.34 |
| January 2019 | 0.29 | 0.03 | 0.22 | 0.26 | 0.29 | 0.31 | 0.35 |
| February 2019 | 0.35 | 0.04 | 0.26 | 0.32 | 0.37 | 0.39 | 0.41 |
| March 2019 | 0.41 | 0.05 | 0.33 | 0.37 | 0.39 | 0.44 | 0.52 |
| April 2019 | 0.48 | 0.05 | 0.34 | 0.44 | 0.48 | 0.53 | 0.57 |
| May 2019 | 0.50 | 0.05 | 0.41 | 0.47 | 0.49 | 0.53 | 0.60 |
| June 2019 | 0.50 | 0.05 | 0.39 | 0.47 | 0.50 | 0.53 | 0.61 |
| Value | 2018 | 2019 | |||||||||||
|---|---|---|---|---|---|---|---|---|---|---|---|---|---|
| July | August | September | October | November | December | January | February | March | April | May | June | ||
| Temperature (°C) | Daily minim | 9.6 | 11.6 | 0.6 | 1.0 | –10.0 | –12.5 | –15.0 | –9 | –4.8 | –0.7 | 2.3 | 11.1 |
| Monthly minim | 15.2 | 19.8 | 8.0 | 5.9 | –7.0 | –7.2 | –10.4 | –4.4 | 3.0 | 7.6 | 4.7 | 16.3 | |
| Average | 21.0 | 23.2 | 18.6 | 13.4 | 5.0 | -0.2 | –8 | 2.2 | 8.2 | 11.8 | 15.1 | 22.8 | |
| Monthly maxim | 24.4 | 25.5 | 23.7 | 19.1 | 17.6 | 3.6 | 2.7 | 8.0 | 12.4 | 18.8 | 20.3 | 26.3 | |
| Daily maxim | 29.7 | 31.9 | 31.2 | 25.2 | 23.6 | 6.0 | 5.5 | 15.5 | 20.4 | 26.3 | 26.6 | 32.0 | |
| Humidity(%) | Daily minim | 35.0 | 31.0 | 27.0 | 25.0 | 14.0 | 62.0 | 59.0 | 34.0 | 27.0 | 21.0 | 34.0 | 28.0 |
| Monthly minim | 55.5 | 55.1 | 54.7 | 52.0 | 47.7 | 78.4 | 71.8 | 58.1 | 46.3 | 37.1 | 61.5 | 51.8 | |
| Average | 75.5 | 68.1 | 66.5 | 69.6 | 84.7 | 95.9 | 94.7 | 80.4 | 62.2 | 59.5 | 78.3 | 68.3 | |
| Monthly maxim | 97.4 | 85.3 | 91.4 | 97.9 | 100.0 | 100.0 | 100.0 | 97.8 | 95.8 | 93.5 | 97.3 | 87.7 | |
| Daily maxim | 100.0 | 100.0 | 100.0 | 100.0 | 100.0 | 100.0 | 100.0 | 100.0 | 100.0 | 100.0 | 100.0 | 100.0 | |
| Atmospheric Pressure (Torr) | Daily minim | 718.3 | 720.6 | 721.0 | 713.8 | 713.5 | 715.6 | 707.2 | 716.5 | 715.8 | 716.5 | 714.8 | 722.8 |
| Monthly minim | 718.8 | 721.6 | 722.5 | 716.0 | 714.4 | 719.1 | 709.6 | 717.8 | 719.0 | 717.3 | 716.3 | 723.7 | |
| Average | 723.8 | 727.3 | 728.7 | 729.0 | 730.3 | 728.7 | 721.5 | 729.8 | 726.2 | 725.2 | 722.2 | 726.9 | |
| Monthly maxim | 726.9 | 731.0 | 740.4 | 735.6 | 738.1 | 733.5 | 731.2 | 739.9 | 737.3 | 733.6 | 728.7 | 732.5 | |
| Daily maxim | 727.7 | 731.8 | 746.5 | 736.8 | 738.9 | 734.4 | 733.9 | 741.4 | 738.4 | 734.8 | 729.5 | 733.7 | |
| Consumption (kWh/km) | Daily minim | 0.87 | 0.88 | 0.83 | 0.80 | 0.88 | 0.91 | 1.20 | 1.00 | 0.90 | 0.79 | 0.83 | 0.95 |
| Monthly minim | 0.87 | 0.88 | 0.83 | 0.80 | 0.88 | 0.91 | 1.20 | 1.00 | 0.90 | 0.79 | 0.83 | 0.95 | |
| Average | 1.13 | 1.16 | 1.07 | 1.16 | 1.45 | 1.78 | 1.90 | 1.60 | 1.30 | 1.30 | 1.28 | 1.33 | |
| Monthly maxim | 1.58 | 1.54 | 1.67 | 1.71 | 2.22 | 2.49 | 2.90 | 2.30 | 2.30 | 2.63 | 2.09 | 1.78 | |
| Daily maxim | 1.58 | 1.54 | 1.67 | 1.71 | 2.22 | 2.49 | 2.90 | 2.30 | 2.30 | 2.63 | 2.09 | 1.78 | |
| Recover (kWh/km) | Daily minim | 0.21 | 0.16 | 0.10 | 0.19 | 0.13 | 0.09 | 0.10 | 0.20 | 0.20 | 0.00 | 0.00 | 0.12 |
| Monthly minim | 0.21 | 0.16 | 0.10 | 0.19 | 0.13 | 0.09 | 0.10 | 0.20 | 0.20 | 0.00 | 0.00 | 0.12 | |
| Average | 0.43 | 0.40 | 0.42 | 0.43 | 0.38 | 0.29 | 0.30 | 0.30 | 0.40 | 0.48 | 0.50 | 0.49 | |
| Monthly maxim | 0.69 | 0.72 | 0.96 | 0.77 | 0.70 | 0.56 | 0.60 | 0.60 | 0.70 | 1.22 | 0.99 | 0.89 | |
| Daily maxim | 0.69 | 0.72 | 0.96 | 0.77 | 0.70 | 0.56 | 0.60 | 0.60 | 0.70 | 1.29 | 0.99 | 0.89 | |
| Energy Consumption (kWh) | Energy Recovery (kWh) | Temperature (°C) | Humidity (%) | Atmospheric Pressure (Torr) | Air Density (kg/m3) |
|---|---|---|---|---|---|
| 1.1384 | 0.4293 | 20.8806 | 74.7451 | 723.4645 | 1.1346 |
| 1.1582 | 0.4024 | 22.9064 | 68.6548 | 727.0193 | 1.1321 |
| 1.0859 | 0.4233 | 17.0466 | 68.9433 | 729.0666 | 1.1620 |
| 1.1645 | 0.4288 | 13.1774 | 70.6838 | 728.8581 | 1.1775 |
| 1.4642 | 0.3844 | 5.9866 | 82.6733 | 730.0066 | 1.2136 |
| 1.7943 | 0.2959 | –0.4645 | 93.0290 | 727.6258 | 1.2367 |
| 1.9076 | 0.2877 | –1.9354 | 93.4451 | 721.3612 | 1.2331 |
| 1.5870 | 0.3532 | 2.2250 | 80.7000 | 729.9035 | 1.2246 |
| 1.3475 | 0.4098 | 7.8096 | 62.1258 | 726.4741 | 1.1979 |
| 1.3383 | 0.4758 | 12.2600 | 61.7166 | 724.9633 | 1.1755 |
| 1.3061 | 0.5018 | 14.6064 | 80.0064 | 722.5193 | 1.1602 |
| 1.2719 | 0.4924 | 22.2733 | 69.4200 | 727.0833 | 1.1351 |
© 2019 by the authors. Licensee MDPI, Basel, Switzerland. This article is an open access article distributed under the terms and conditions of the Creative Commons Attribution (CC BY) license (http://creativecommons.org/licenses/by/4.0/).
Share and Cite
Iclodean, C.; Cordoș, N.; Todoruț, A. Analysis of the Electric Bus Autonomy Depending on the Atmospheric Conditions. Energies 2019, 12, 4535. https://doi.org/10.3390/en12234535
Iclodean C, Cordoș N, Todoruț A. Analysis of the Electric Bus Autonomy Depending on the Atmospheric Conditions. Energies. 2019; 12(23):4535. https://doi.org/10.3390/en12234535
Chicago/Turabian StyleIclodean, Călin, Nicolae Cordoș, and Adrian Todoruț. 2019. "Analysis of the Electric Bus Autonomy Depending on the Atmospheric Conditions" Energies 12, no. 23: 4535. https://doi.org/10.3390/en12234535
APA StyleIclodean, C., Cordoș, N., & Todoruț, A. (2019). Analysis of the Electric Bus Autonomy Depending on the Atmospheric Conditions. Energies, 12(23), 4535. https://doi.org/10.3390/en12234535


