Article

Modelling and Design of a Low-Level Turn-to-Turn Fault Protection Scheme for Extra-High Voltage Magnetically Controlled Shunt Reactor

State Key Laboratory of Alternate Electrical Power System with Renewable Energy Sources, School of Electrical and Electronics Engineering, North China Electric Power University, Beijing 102206, China
*
Author to whom correspondence should be addressed.
Energies 2019, 12(24), 4628; https://doi.org/10.3390/en12244628
Submission received: 27 October 2019 / Revised: 1 December 2019 / Accepted: 3 December 2019 / Published: 5 December 2019
(This article belongs to the Section F: Electrical Engineering)

Abstract

:
The objective of this paper is to model and design a low-level turn-to-turn fault (T2TF) protection scheme for a magnetically controlled shunt reactor (MCSR), during incipient stage under 10% to 100% operating capacity. Due to the structural and functional differences of all the three windings in extra-high voltage (EHV) MCSR, a separate mechanism of detecting a T2TF in each winding is necessary. For this purpose, a detailed mathematical and structural analysis of the model is performed, and a comprehensive protection scheme based on the internal changes in magnetic and electric parameters of the windings is formulated to detect 3% T2TF in power windings (PWs), control windings (CtrWs), compensation windings (CpWs), and to differentiate it from other abnormalities. The main idea of the scheme is to perform the currents magnitude comparison of respective winding with the predefined settings values and decide necessary action. The proposed scheme is also capable of identifying the faulty winding along with faulty phase. The scheme is tested under different operating capacities (10%, 50%, 100%), and other types of unusual conditions, i.e., direct energization, pre-excited energization, power regulation, internal and external faults. The results demonstrate the effectiveness of the proposed scheme. The work of this paper is applicable in the areas of power system transmission and power system protection. The simulations are carried out on MATLAB/Simulink-based models.

1. Introduction

Shunt reactors are flexible alternating current transmission systems (FACTS) devices that are used to compensate for the extra reactive power of long transmission lines. The extra reactive power is generated due to the presence of charging current and the line capacitances, which cause overvoltages. A shunt reactor is an example of inductive load in which the current lags the applied voltage and hence consumes reactive power, contrary to a capacitive load where current leads the applied voltage [1]; although there are strong similarities between shunt reactors and potential transformers in terms of inductive loading. However, in terms of structural design and operational characteristics, they are quite different from each other [2].
The international council on large electric systems (French: CIGRE) report [3] is a comprehensive document covering all the important aspects of shunt reactors regarding monitoring, control, and state of the art protection. The detailed report consists of: the design of shunt reactors, their electrical characteristics, applications to the electrical grid, shunt reactor faults and abnormal conditions, protection, monitoring, control, and the new solutions offered by numerical relays. Protection implementation and setpoint recommendations are also discussed comprehensively. This report also contains a questionnaire on existing practices regarding shunt reactors protection, monitoring, and control from the participating CIGRE countries. Another comprehensive guide on protection of shunt reactors is presented in [4]. The protection of oil-immersed shunt reactors, enhanced turn-to-turn fault (T2TF) protection, and use of microprocessor-based relay protection are discussed. The contents of this document can be categorized as: use of reactor, reactor construction and characteristics, typical reactor protection, dry-type reactor application and protection, oil-immersed reactor application and protection, and summary of the overall shunt reactor protection. The acceptable relay practices applied to the protection of power system shunt reactors are also mentioned.
A patent discussing how to detect T2TFs in one or more windings of various objects is presented in [5]. The protection relay receives a set of current transformer (CT) measurements associated with a transformer and uses these measurements to execute an algorithm for detecting a T2TF in the transformer. The algorithm is dividing a steady-state differential current value by a steady-state voltage value to obtain one or more compensating factors. The process includes determining of a magnetizing current amplitude indicator by multiplying the steady-state voltage value, determining a compensated differential current value. After getting the compensated differential current value, the further process involves mainly three steps: (1) the steady-state differential current value is added with a modifier value (that contains the magnetizing current amplitude indicator); (2) comparing the compensated differential current value against a pre-defined threshold limit; (3) declaring T2TF, if the compensated differential current value exceeds the threshold limit [6].
A magnetically controlled shunt reactor (MCSR) is a kind of flexible alternating current transmission systems (FACTS) device which is used for reactive power control and voltage stabilization in transmission networks. The main advantages of MCSR are simple design similar to the conventional power transformer, technical and economical characteristics, low cost, easy maintenance, and high operational safety. When equipped with series capacitor banks, MCSRs function as static var compensators (SVC) (unlike a standard SVC which consists of an interconnection) [7,8,9,10]. The protection of the MCSR is very important from power system operational and reliability perspective. Therefore, various protective relaying techniques are used for this purpose. Most of these protection schemes are similar to power transformer protection in the broader context. However, due to the structural and functional differences, some unique protection schemes needed to be implemented, especially for T2TFs. The major internal and external failures and their protections are comprehensively presented in [11,12,13,14]. The main issue arises in the protection of windings T2TFs [15,16]. In [9], the authors presented a novel way to detect and protect T2TF in the control windings (CtrW) of the MCSR. However, the T2TF in the power windings (PW) and compensation windings (CpW) is not discussed in this paper.
A mathematical model for MCSR is formulated based upon basic electric and magnetic laws in [7]. The model is mainly based on Kirchhoff current law and Ampere circuital law. The building blocks of the single-phase model is consisting of three multi-windings transformers and two linear transformers. This model is the foundation for this research work where a simulation model in MATLAB/Simulink is built and a low-voltage physical model is developed for further studying different behaviors and designing a suitable protection scheme especially for T2TFs for the proposed MCSR. Low-level T2TF in oil-immersed shunt reactors causes accumulation of gas, increasing the internal temperature, pressure, and change in impedance of the reactor. This type of fault can evolve into a major fault and cause the damage of the whole equipment if not detected earlier at incipient stages. T2TF is the most serious type of failure in MCSR and there is no idealized electrical protection method to detect the fault, isolate the equipment, and also identify the faulty phase and winding of the equipment. Therefore, in this paper we tried to overcome these issues by studying the in-depth mathematical and structural design of MCSR and to devise a complete T2TF protection method.
The work presented so for in [17,18,19] is mainly dealt with fixed/switched shunt reactors or conventional controllable shunt reactors, which have a different design and configuration from MCSR. The work presented for thyristor controlled transformer-type controllable shunt reactor (TCT-CSR) and MCSR in [20,21,22] up till now laid foundation for this research work, however, it also lacks the properties of identifying the faulty-phase, faulty-winding and achieving the lowest level of T2TF protection for MCSR. Therefore, the sole aim of this research work is to overcome the above deficiencies at lowest cost of changing the mechanical design or structural configurations, while achieving the targeted objectives through a low-level sensitive T2TF electrical protection scheme.
The main contributions and advantages of the proposed protection scheme, besides insightful inspection of the existing MCSR model, selecting the four most sensitive parameters for T2TF detection, and selection of very low shorted turns during T2TFs, are: 1) a single protection scheme having capability of detecting T2TFs in all the three windings (i.e., PWs, CtrWs, CpWs) and differentiation from energization conditions and other internal and external faults; 2) identification of faulty phase and faulty winding among the three phases and windings in case of a windings T2TF, which were lacking in the literature; 3) a 3% T2TF can be detected, which has more sensitivity in terms of shorted turns then the schemes presented in previous work for 5% or 10% shorted turns; and 4) the operational logic is very simple which can reduce the total computational time considerably. Moreover, this research work can play an important role for future ultra-high voltage (UHV)MCSR protection methods and is useful for solving the most serious and frequently existed issue of T2TF inside windings.
The rest of the paper is organized as follows: the structure and working principle of an MCSR are discussed in Section 2. In Section 3, mathematical analysis of MCSR under steady-state operating conditions is performed. The analysis of windings T2TFs including PW, CtrWs, and CpWs is carried out, and sensitivity of the currents is given in Section 4. In Section 5, the proposed protection scheme is presented with detail for each winding T2TFs. Performance evaluation of the proposed protection scheme is given in Section 6. The discussion is included in Section 7. Finally, Section 8 concludes the paper.

2. Structure and Working Principle of an MCSR

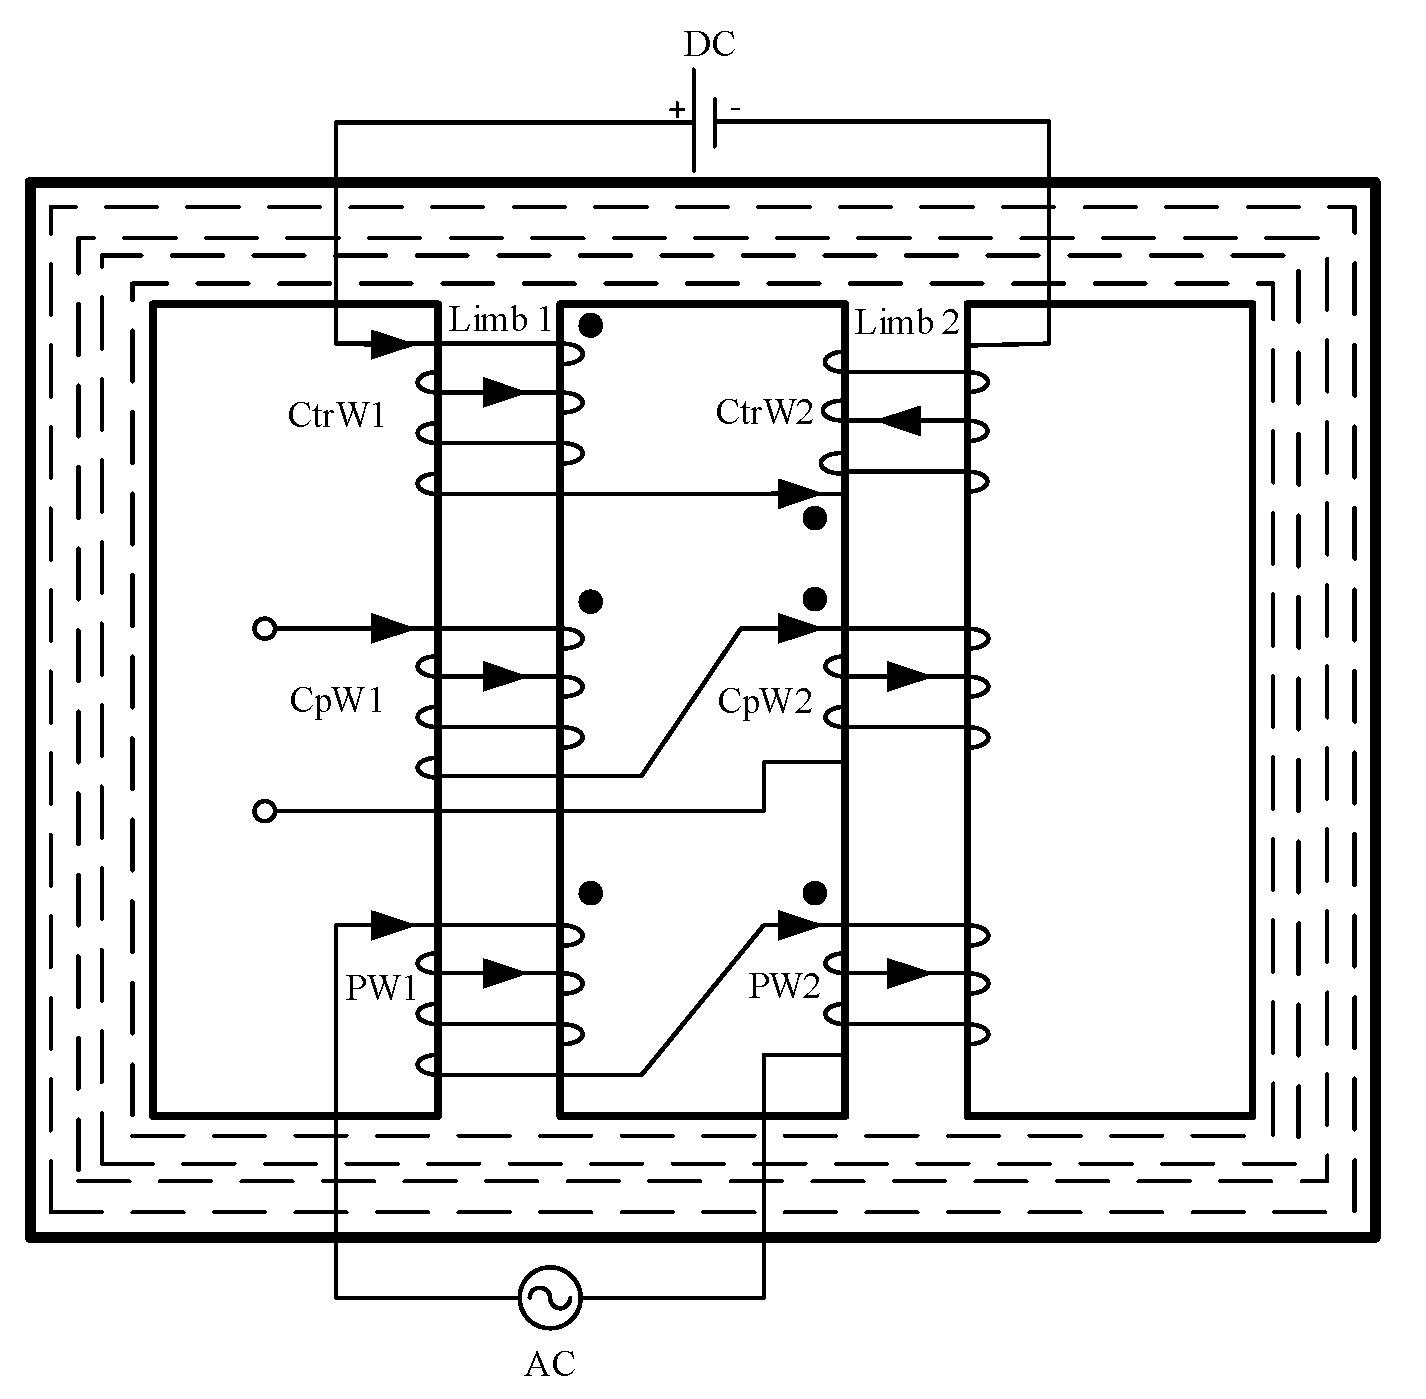
Figure 1 shows the single line diagram (SLD) of an MCSR working in a closed-loop manner connected to the extra-high voltage (EHV) system. The equipment is connected to the AC grid through a three-phase circuit breaker. The CtrWs are connected to the DC excitation source through rectifier transformer, and thyristor converters, which provide the direct current (DC) to change the capacity of MCSR by changing their firing angles. The equipment is working in a closed loop, i.e., measuring the reactive power at EHV bus, feeding the information to control system, and changing the firing angle of the thyristors according to the real-time measurements and hence, changes the mega volt-ampere reactive (MVAr) capacity of the MCSR. The CpWs of the three phases are delta-connected and capturing the harmonic current components of the PWs. The CpWs are connected to the harmonics filter. Figure 2 shows the windings arrangement of a single-phase MCSR. The main core is divided into two limbs, i.e., limb 1, and limb 2. Each limb consists of three windings wounded concentrically one after another. The PWs connect the device directly to EHV bus and hence alternating current (AC) is flowing inside them. Both limbs have electrically series connected PWs. Beneath the PW and above CtrW, CpW is placed. The windings pattern is CtrW–CpW–PW and is repeated across each limb for all the three phases. The purpose of inserting series connected CpWs is to eliminate the effects of harmonics which causes current distortion inside PW. The CtrWs is connected in an inverse-series manner across the limbs to provide magnetization and demagnetization of the core. Rectified DC is flowing inside CtrWs. The detailed single line diagram (SLD) of the winding’s arrangement across the six limbs of a three-phase MCSR and its connectivity is shown in Figure 3. The parameters of the simulation model are given in the Appendix A (Table A1, Table A2 and Table A3).

3. Mathematical Analysis of MCSR under Steady-State Operating Conditions

In this section, detailed mathematical analysis of limb 1 and limb 2 of phase A is carried out. Each limb consists of an iron core wound with three coupled windings. An equivalent electric circuit is built up using the magnetic circuit analogy based on the magnetic circuit decomposition technique presented in [7]. Figure 4 represents the equivalent electric circuit diagram of both the limbs of a single phase of MCSR. Applying KVL across the equivalent electrical circuit of limb 1 and limb 2 given in Figure 4 will result into:
U a c = e R ( P W ) + e L ( P W ) + e N ( P W )
where, e is the induced voltage across the winding. Taking the cumulative resistance and inductance of both PWs, due to its similarity, the above equation can be rewritten as:
R ( P W ) = R 11 + R 21 ,   L ( P W ) = L 11 + L 21 ,   N ( P W ) = N 11 + N 21 ,   ϕ ( P W ) = ϕ 11 + ϕ 21
U m sin ( w t + θ ) = i a c R ( P W ) + L ( P W ) d i a c d t +   N ( P W ) d ϕ ( P W ) d t
The Kirchhoff’s voltage law (KVL) equations for the DC loops of limb 1 and limb 2 having no leakage inductance values can be written as follow:
U d c = e R ( C t r W ) + e N ( C t r W ) or U d c = I d c R ( C t r W )
as, N 12 = N 22 , hence ϕ 12 ϕ 22 = 0 , and R ( C t r W ) = R 12 + R 22 , N ( C t r W ) = N 12 + N 22 .
Similarly, the CpWs forming third loop, can be represented by the following equations:
U a c = e R ( C p W ) + e L ( C p W ) + e N ( C p W ) U C p W = i ( C p W ) R ( C p W ) + L ( C p W ) d i ( C p W ) d t + N ( C p W ) d ϕ ( C p W ) d t
where, R ( C p W ) = R 13 + R 23 , L ( C p W ) = L 13 + L 31 , and N ( C p W ) = N 13 + N 23   .
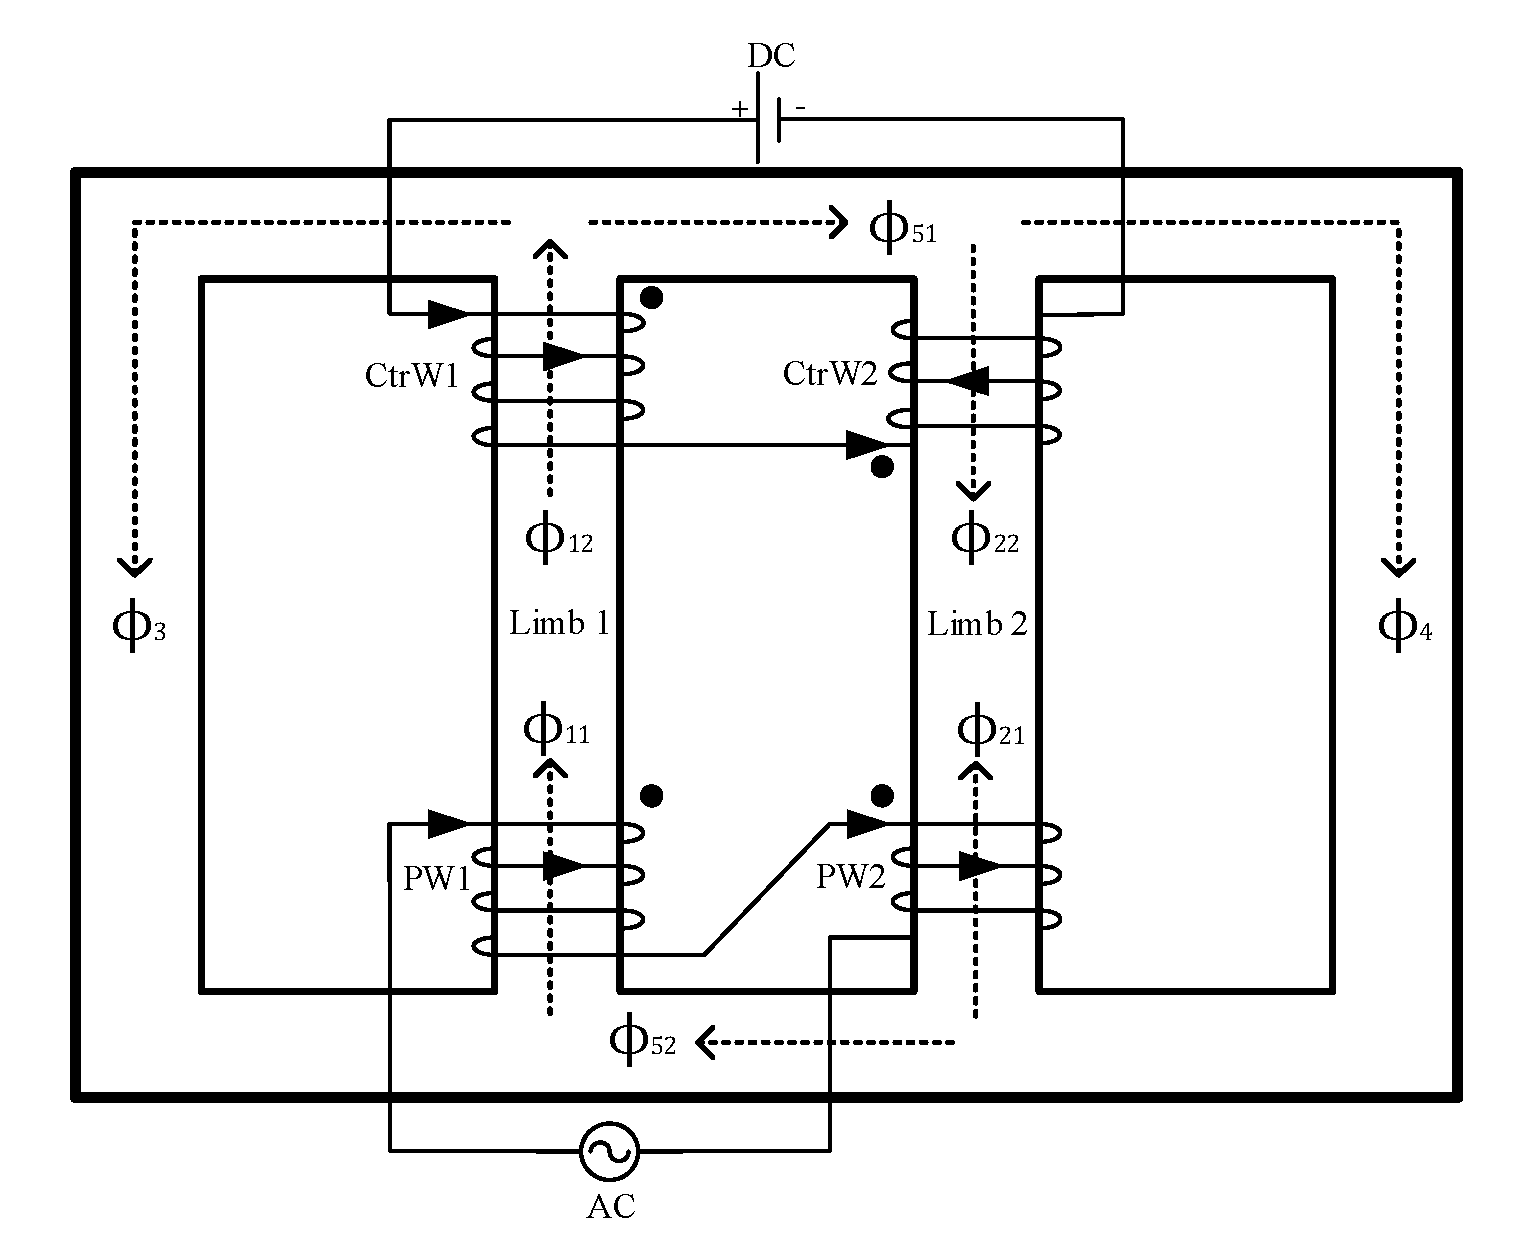
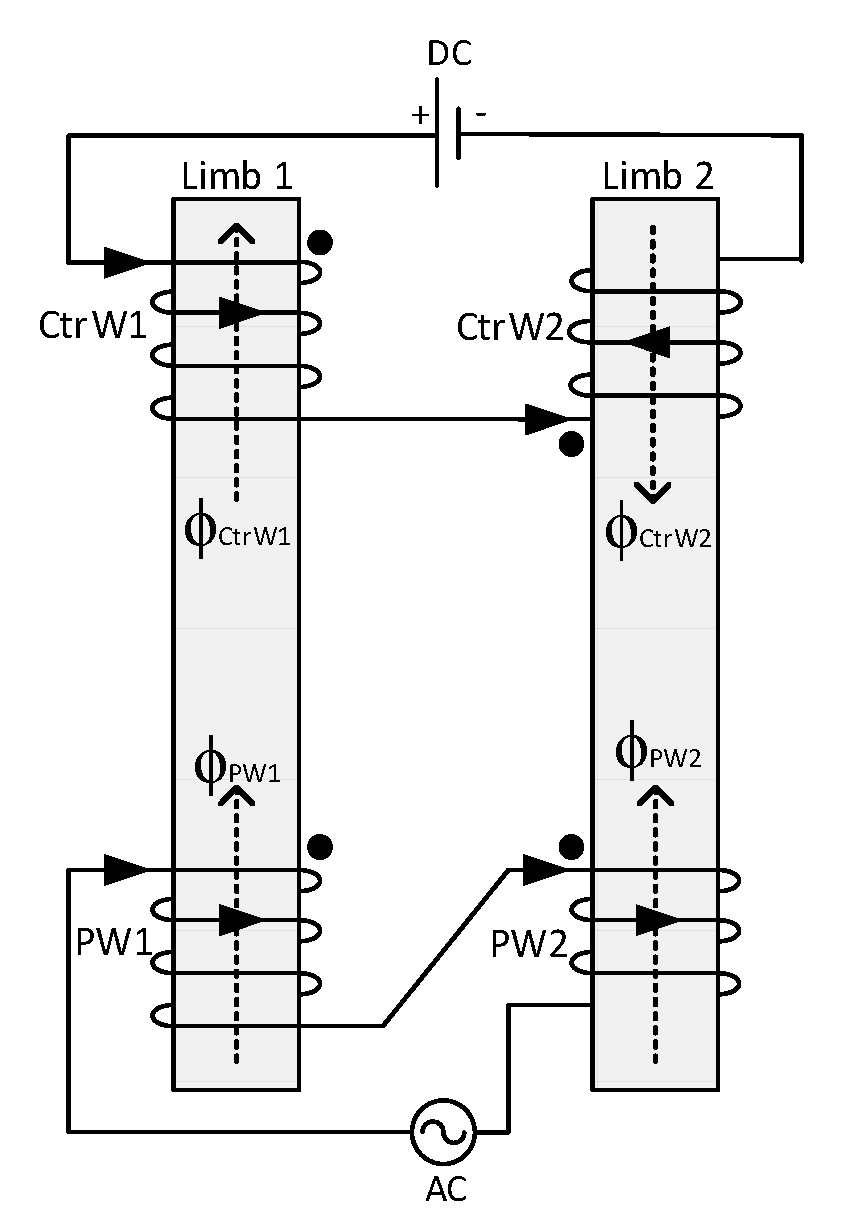
The arrangement of PWs and CtrWs across the limbs of single-phase of a three phase MCSR and their connectivity is shown in Figure 5. The flux representation inside limbs, upper yoke, and lower yoke is shown in Figure 5 by neglecting the effect of CpW. The AC flux due to PWs is represented by ϕ 11 and ϕ 21 , and DC flux of CtrWs is represented by ϕ 12 and ϕ 22 , respectively. The rest of the fluxes indicate left-side yoke ( ϕ 3 ), right-side yoke ( ϕ 4 ), upper yoke ( ϕ 51 ), and lower yoke ( ϕ 52 ), respectively. The two limbs are modelled as two three-winding transformers. Figure 6 shows the main magnetic flux paths of the limbs while ignoring the effect of flux in the yokes. The equivalent electrical circuit diagram of the above configuration is given in Figure 7.
The MATLAB/Simulink blocks of a single phase (i.e., phase A) of an MCSR are shown in Figure 8. The model consists of two three-windings transformers as limb 1 and limb 2, and three linear transformers as upper, lower, and two side yokes based upon the magnetic circuit decomposition method presented in [7]. The leakage inductance, and resistance of the PWs for limb 1 and limb 2 is comparatively higher than the other two windings. The resistance of the upper, lower, and the two side yokes is taken an extremely large. The magnetization resistance and inductance of the main limbs are taken as smaller compared to the upper, lower, and two side yokes due to the higher flux flow. The resistances of the windings are considered negligible and the leakage inductances are also taken as very small. All the transformers used in simulation model have characteristics near to an ideal transformer (i.e., winding resistances and inductances (i.e., R_kx and L_kx), are taken as zero, and the magnetization resistance and inductance (i.e., R_m and L_m) are close to infinity). The resistance and inductance for magnetizing branch of the linear transformers are specified 0.2% of the magnetizing current (resistive and inductive), based on nominal current.
To perform the basic operational analysis of an MCSR, some fundamental concepts are explained in the following section. The applied magnetizing force ( H ) has a great effect on the permeability ( μ ) of the magnetic material used. As the H increases, the μ rises to a maximum in non-saturated/linear region and then decreases until drops to a minimum in the saturated and deep saturated regions, respectively. The flux ( ϕ   ( W b ) ) lines passing through an area A   ( m 2 ) and flux density ( B ) will also increase with the increase in direct current ( I D C ) inside CtrW, which facilitate the effective controlling of an MCSR inductance.
As shown in Figure 8, both AC and DC sources are applied across the same limbs of MCSR through PWs and CtrWs, respectively. Therefore, the magnetic field strength ( H ) of limb 1 and limb 2 of three-phase MCSR phase A can be written as:
H A 1 =   H D C + H A C ,   or   H A 1 =   H D C + H A C sin ω t
and
H A 2 =   H D C + H A C ,   or   H A 2 =   H D C + H A C sin ω t
where H A 1 and H A 2 is the total magnetic field strengths of limb 1 and limb 2 of phase A, respectively. While, H D C and H A C represent the DC and AC magnetic field strengths, respectively. Equations (5) and (6) show that by changing the DC magnetic field strength, the desired saturation level of the limbs can be achieved. From Equations (5) and (6), it is clear that increasing I D C can increase the H D C , which in turn can decrease the μ . By decreasing μ results in the increase of inductive reactance of an MCSR. As a result, the reactive power consumption of an MCSR increases and hence its capacity. The I D C can be varied by changing the firing angle of the thyristor convertor according to real time reactive power measurement from EHV bus and the terminal side of the reactor. The detailed operational closed-loop diagram of an EHV bus-connected MCSR is shown in Figure 1.
If all the magnetic paths are considered, then the flux circulation equations in these paths (as shown in Figure 5 will become:
ϕ 3 = ϕ 1 + ϕ 5 ,   or   ϕ 1 = ϕ 3 ϕ 5
and
ϕ 4 = ϕ 2 + ϕ 5 ,   or   ϕ 2 = ϕ 4 ϕ 5
Applying Ampere circuital law across limb 1 and limb 2 of Figure 5:
m m f R i s e =   m m f D r o p or m = 1 5 N m i m =   m = 1 5 H m l m
across limb 1,
N 11 i 11 +   N 12 I d c =   H 1 l 1 + H 3 l 3
across limb 2,
N 21 i 21 +   N 22 I d c =   H 2 l 2 + H 4 l 4
across upper, lower, and side yokes,
0 =   H 5 l 5 + H 4 l 4 H 3 l 3 ,   or   H 3 l 3 =   H 5 l 5 + H 4 l 4
where N 3 i 11 =   H 3 l 3 , N 4 i 21 =   H 4 l 4 , and N 4 i 21 =   H 5 l 5   .
Now, neglecting the upper, lower, and side yokes, the equation across the two limbs will become:
N 11 i 11 +   N 12 I d c =   H 1 l 1
N 21 i 21   N 22 I d c =   H 2 l 2
Under normal operating conditions,
N 11 = N 21 ,   ϕ 11 = ϕ 21 ,   and   N 21 = N 22 ,   N 31 = N 32
therefore,
ϕ L i m b 1 = ϕ 11 + ϕ 12 ,   and   ϕ L i m b 2 = ϕ 21   ϕ 22
moreover,
ϕ 11 = L 11 i 11 N 11 , ϕ 12 = L 12 I d c N 12 ,   and   ϕ 21 = L 21 i 21 N 21 , ϕ 22 = L 22 I d c N 22
similarly, the induced voltages equations of limb 1 and limb 2 can be written as:
e 11 = e 3 + e 51 ,   and   e 21 = e 4 e 52
The idea of the proposed protection scheme in this paper is based on the magnetic flux continuity property, which states that magnetic fluxes are closed continuous lines, which neither originate nor terminate at a point. The magnetic flux is determined by the applied or induced voltage. When some turns are shorted, the linkage flux in them tends to reduce. In that time, some of the linkage flux changes to leakage flux and closes its path with air or oil. Linkage flux in MSCR passes through all the three windings. This sinusoidal flux induces voltage in any windings according to Faraday’s law.

4. Analysis of Windings T2TFs

Due to the difference among functionalities of the three windings, T2TF of the same percentage in each winding have different fault characteristics. Therefore, separate T2TF analysis of each winding is carried out and discussed below in detail.

4.1. PW T2TF

The magnetizing inductance of the PW winding can be represented as:
L =   N 2 μ A l ,   or   L =   N   d ϕ d i
Due to any change in current, the flux linking the winding will be changed, and will causes a change in the inductance. As the change in current causes different change in the linking flux, therefore, the inductance will also respond accordingly. If the core saturation is operating in the linear region of the magnetization curve, the change in flux will be high, and also the change in inductance as well. However, if the core operating in the saturation region, the change in current will result in a small amount of flux change and therefore, the inductance will change slightly. It means, that larger the inductance of the windings, larger will be the instantaneous change in flux due to instantaneous change in current. To get a relation of induced voltage with the inductance of the winding, we can rewrite Faraday’s law as:
v = N   d ϕ d t = ( N d ϕ d i ) ( d i d t ) ,   or   v = L   d i d t
Equation (19) shows that the magnitude of induced voltage across a winding is directly proportional to the inductance of the winding and instantaneous rate of change of current. In case of a T2TF in N 11 , shortening of few turns will cause the main AC flux ( ϕ 11 and ϕ 21 ) to decrease and the leakage flux will rise. This decrease of main flux A1 and A2 is shown in Figure 9a,b for 3% PW T2TF under 100% operating capacity applied from 22 to 23 seconds of the simulation time. The drop of main AC flux will also cause the AC excitation and magnetization currents to decrease. As, CtrWs and CpWs are also wound on the same limb and having much smaller number of turns than PWs ( N P W k x > N C t r W k x > N C p W k x for k   ( P h a s e ) = A ,   B ,   C and x   ( L i m b ) = 1 ,   2 ), therefore, a small change in the main flux due to T2TF in PW will cause a huge impact on electrical parameters of these windings as shown in Figure 9, Figure 10, Figure 11 and Figure 12. Additionally, a visible change in current at EHV bus can be seen in Figure 13. In case of a PW T2TF, a demagnetizing current will start flowing due to the opposing flux according to Lenz’s law, draw more current and will act as a load.
From Figure 8, it can be observed that:
i 11 =   i 11 + i 11 ,   and   i 21 =   i 21 + i 21
where, i 11 is the current circulating in limb 1, and i 11 is the current of the left-side yoke. Similarly, i 21 is the current of limb 2, and i 21 is the current of the right-side yoke. The change in these currents due to PW T2TF is shown in Figure 14 below.
The summarized results for different scenarios of PW T2TFs carried out using 3% PW shorted turns under 10% and 100% operating capacities are given in Table 1 and Table 2 (   i P W k x i k x ) . A normal PW current ( i k x = i P W k x ) under steady-state and energization condition is mentioned in blue in third column of Table 1 and Table 2 (116.7-306A). In case of a 3% T2TF under any circumstances, these limits will not be further satisfied, and the magnitude of i P W k x remains within 648A to 786.8A. For energization, internal faults, and external faults the behavior of the current completely changed (as shown in red and black in the third column of Table 1 and Table 2) and can be easily distinguished from the rest of the scenarios. Moreover, the phase which faces these violations can be declared is the faulty phase, because the response of the other two healthy phases will be completely different from the faulty phase. Due to the highest number of PWs turns, it is comparatively easy to detect any change under T2TF and differentiate it from the normal and steady-state operations.

4.2. CtrW T2TF

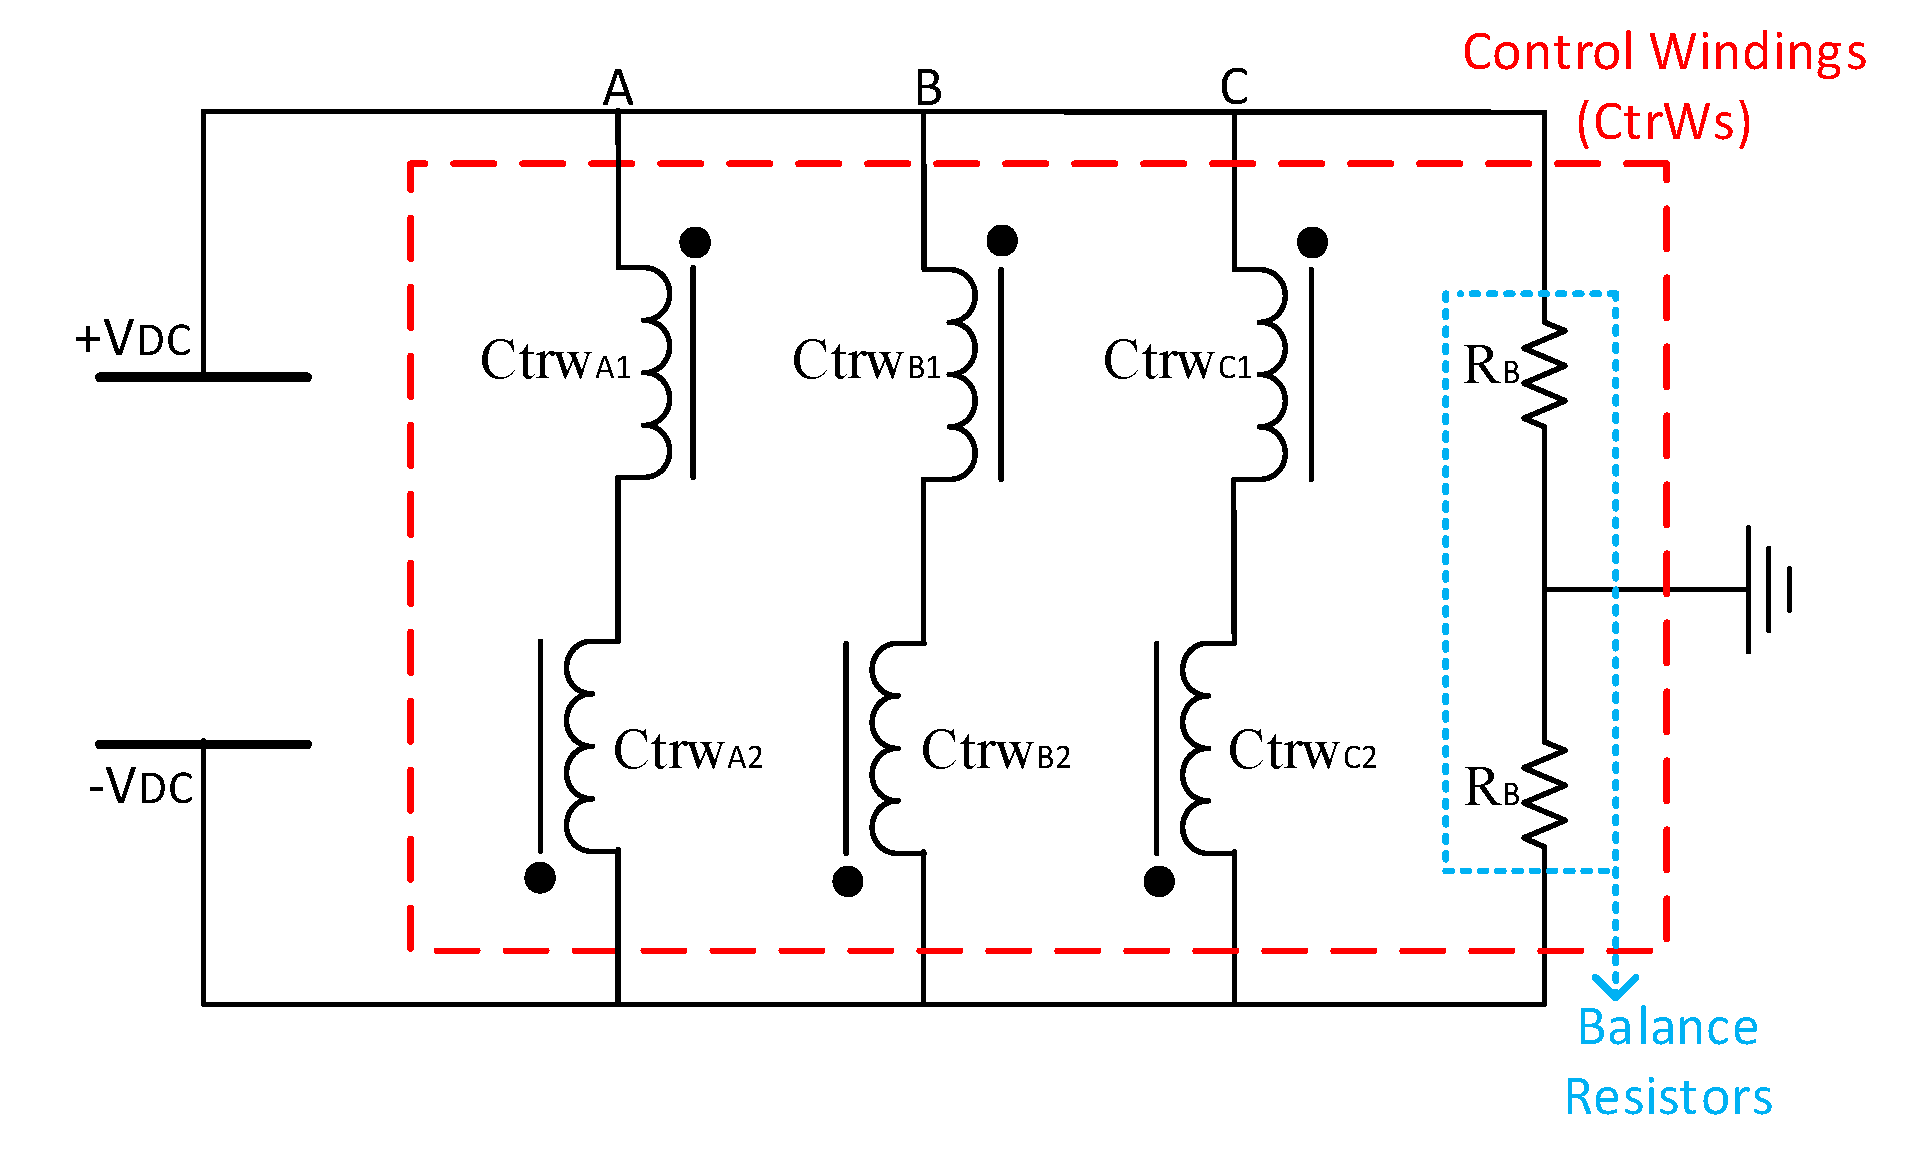
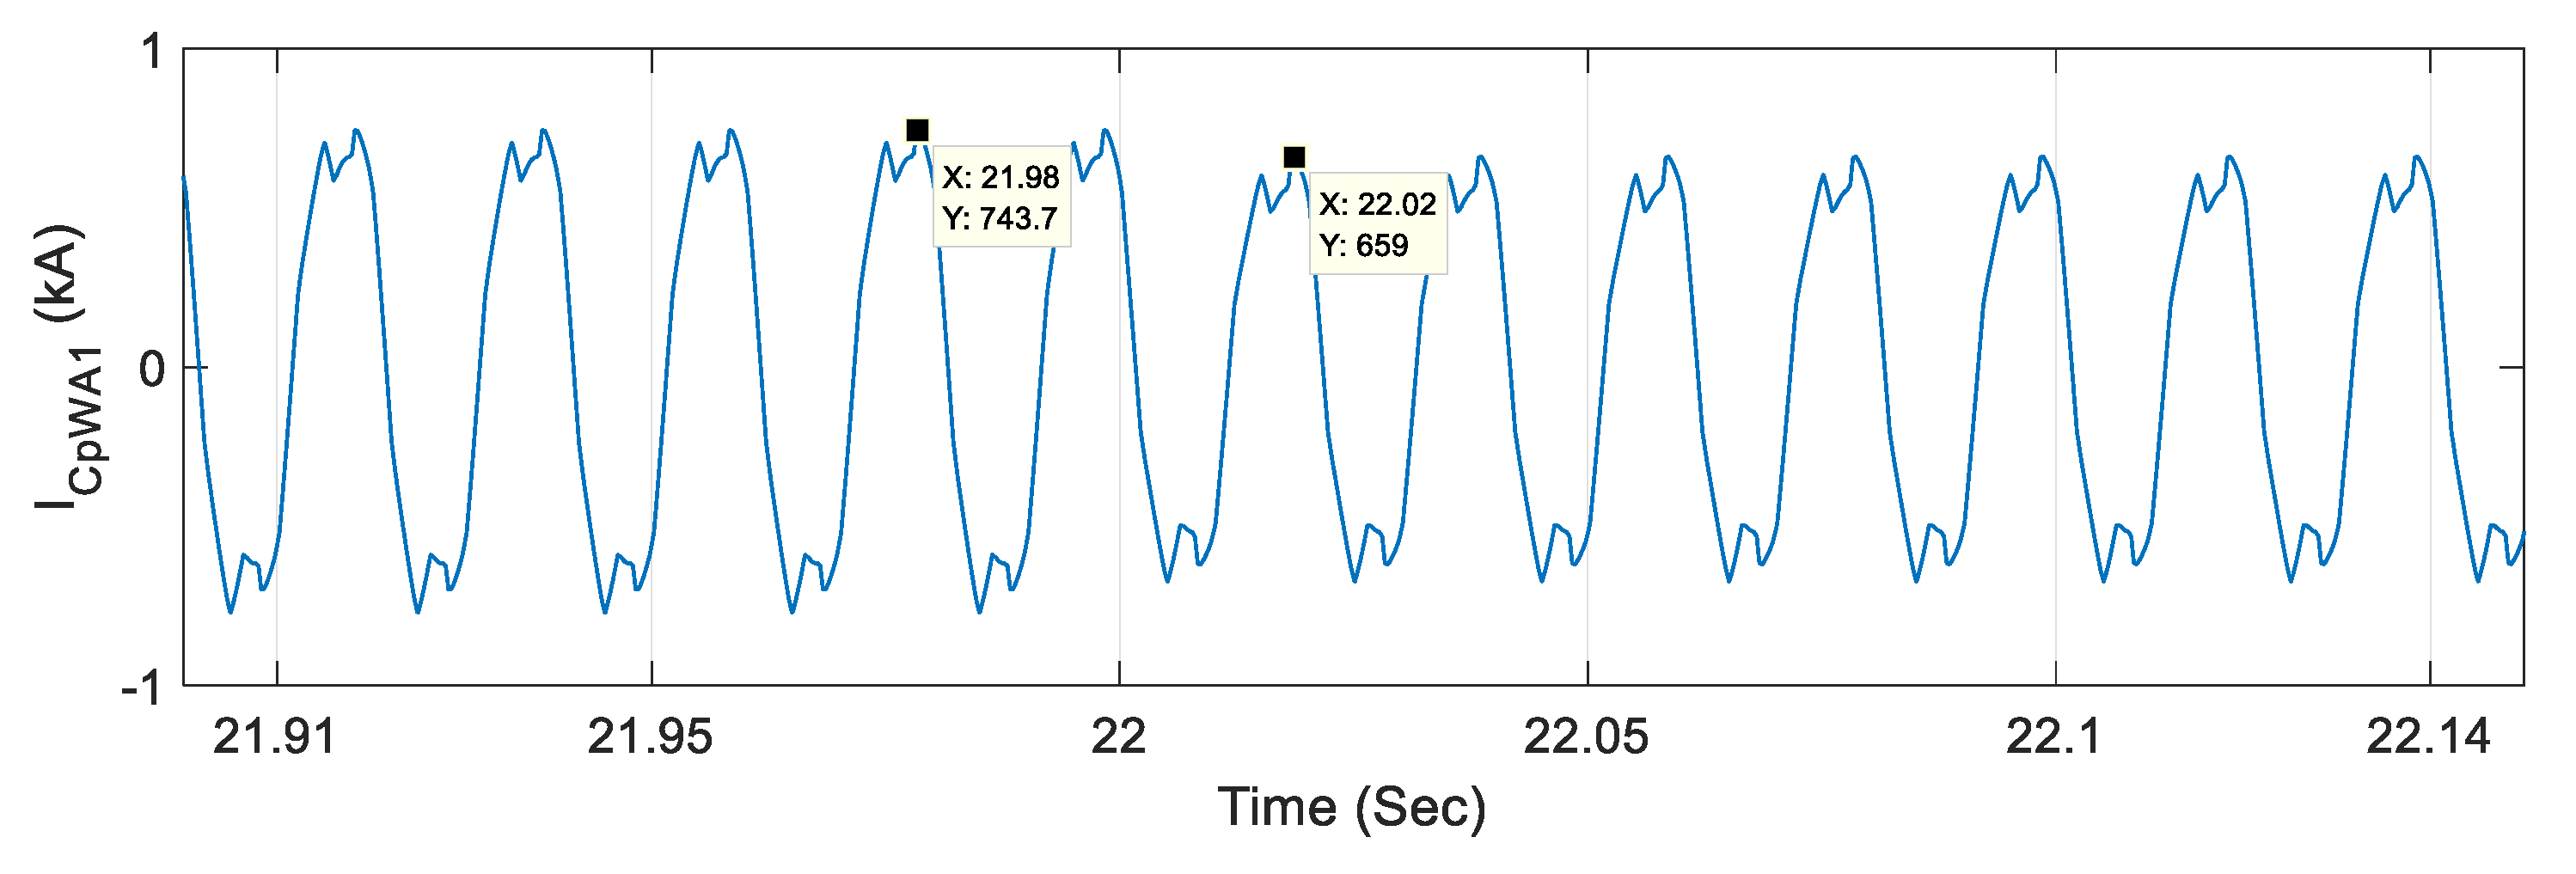
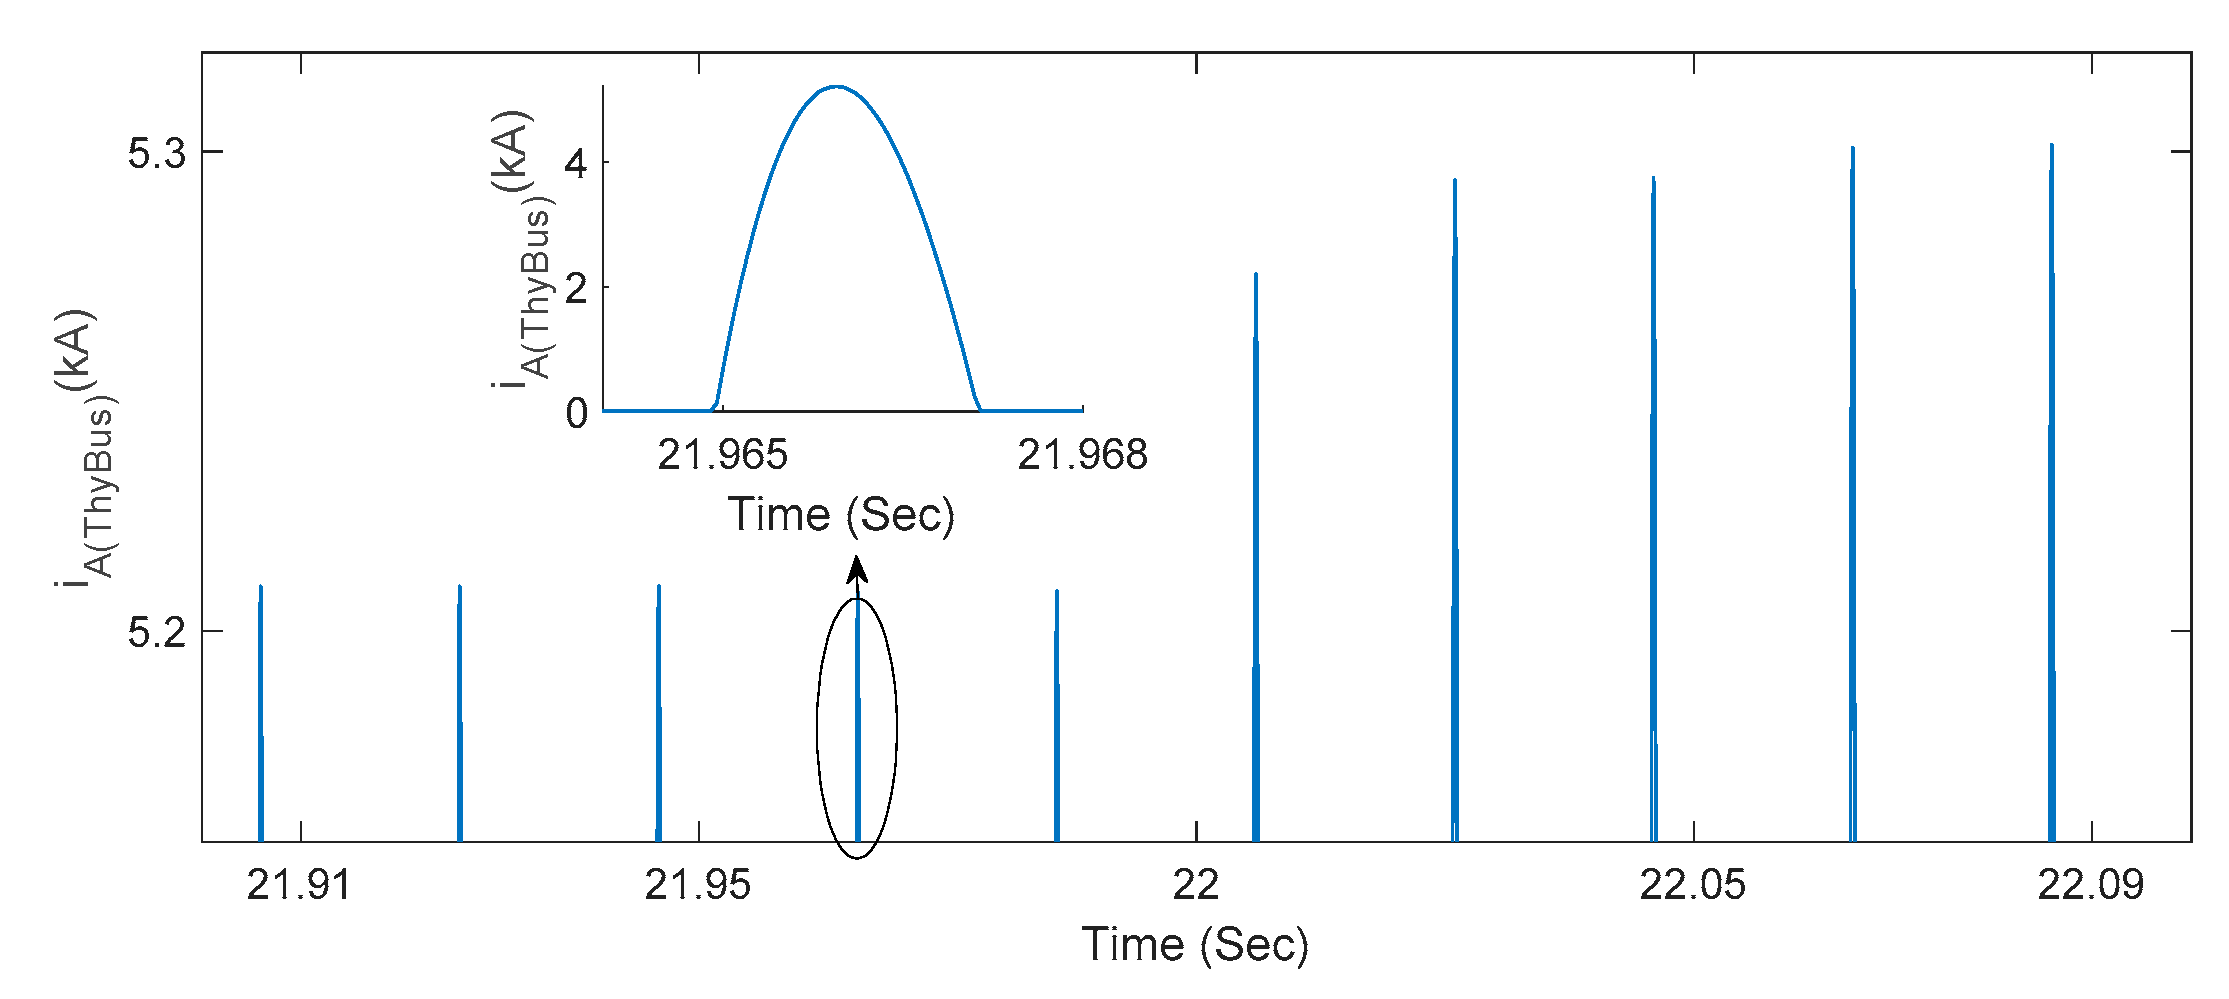
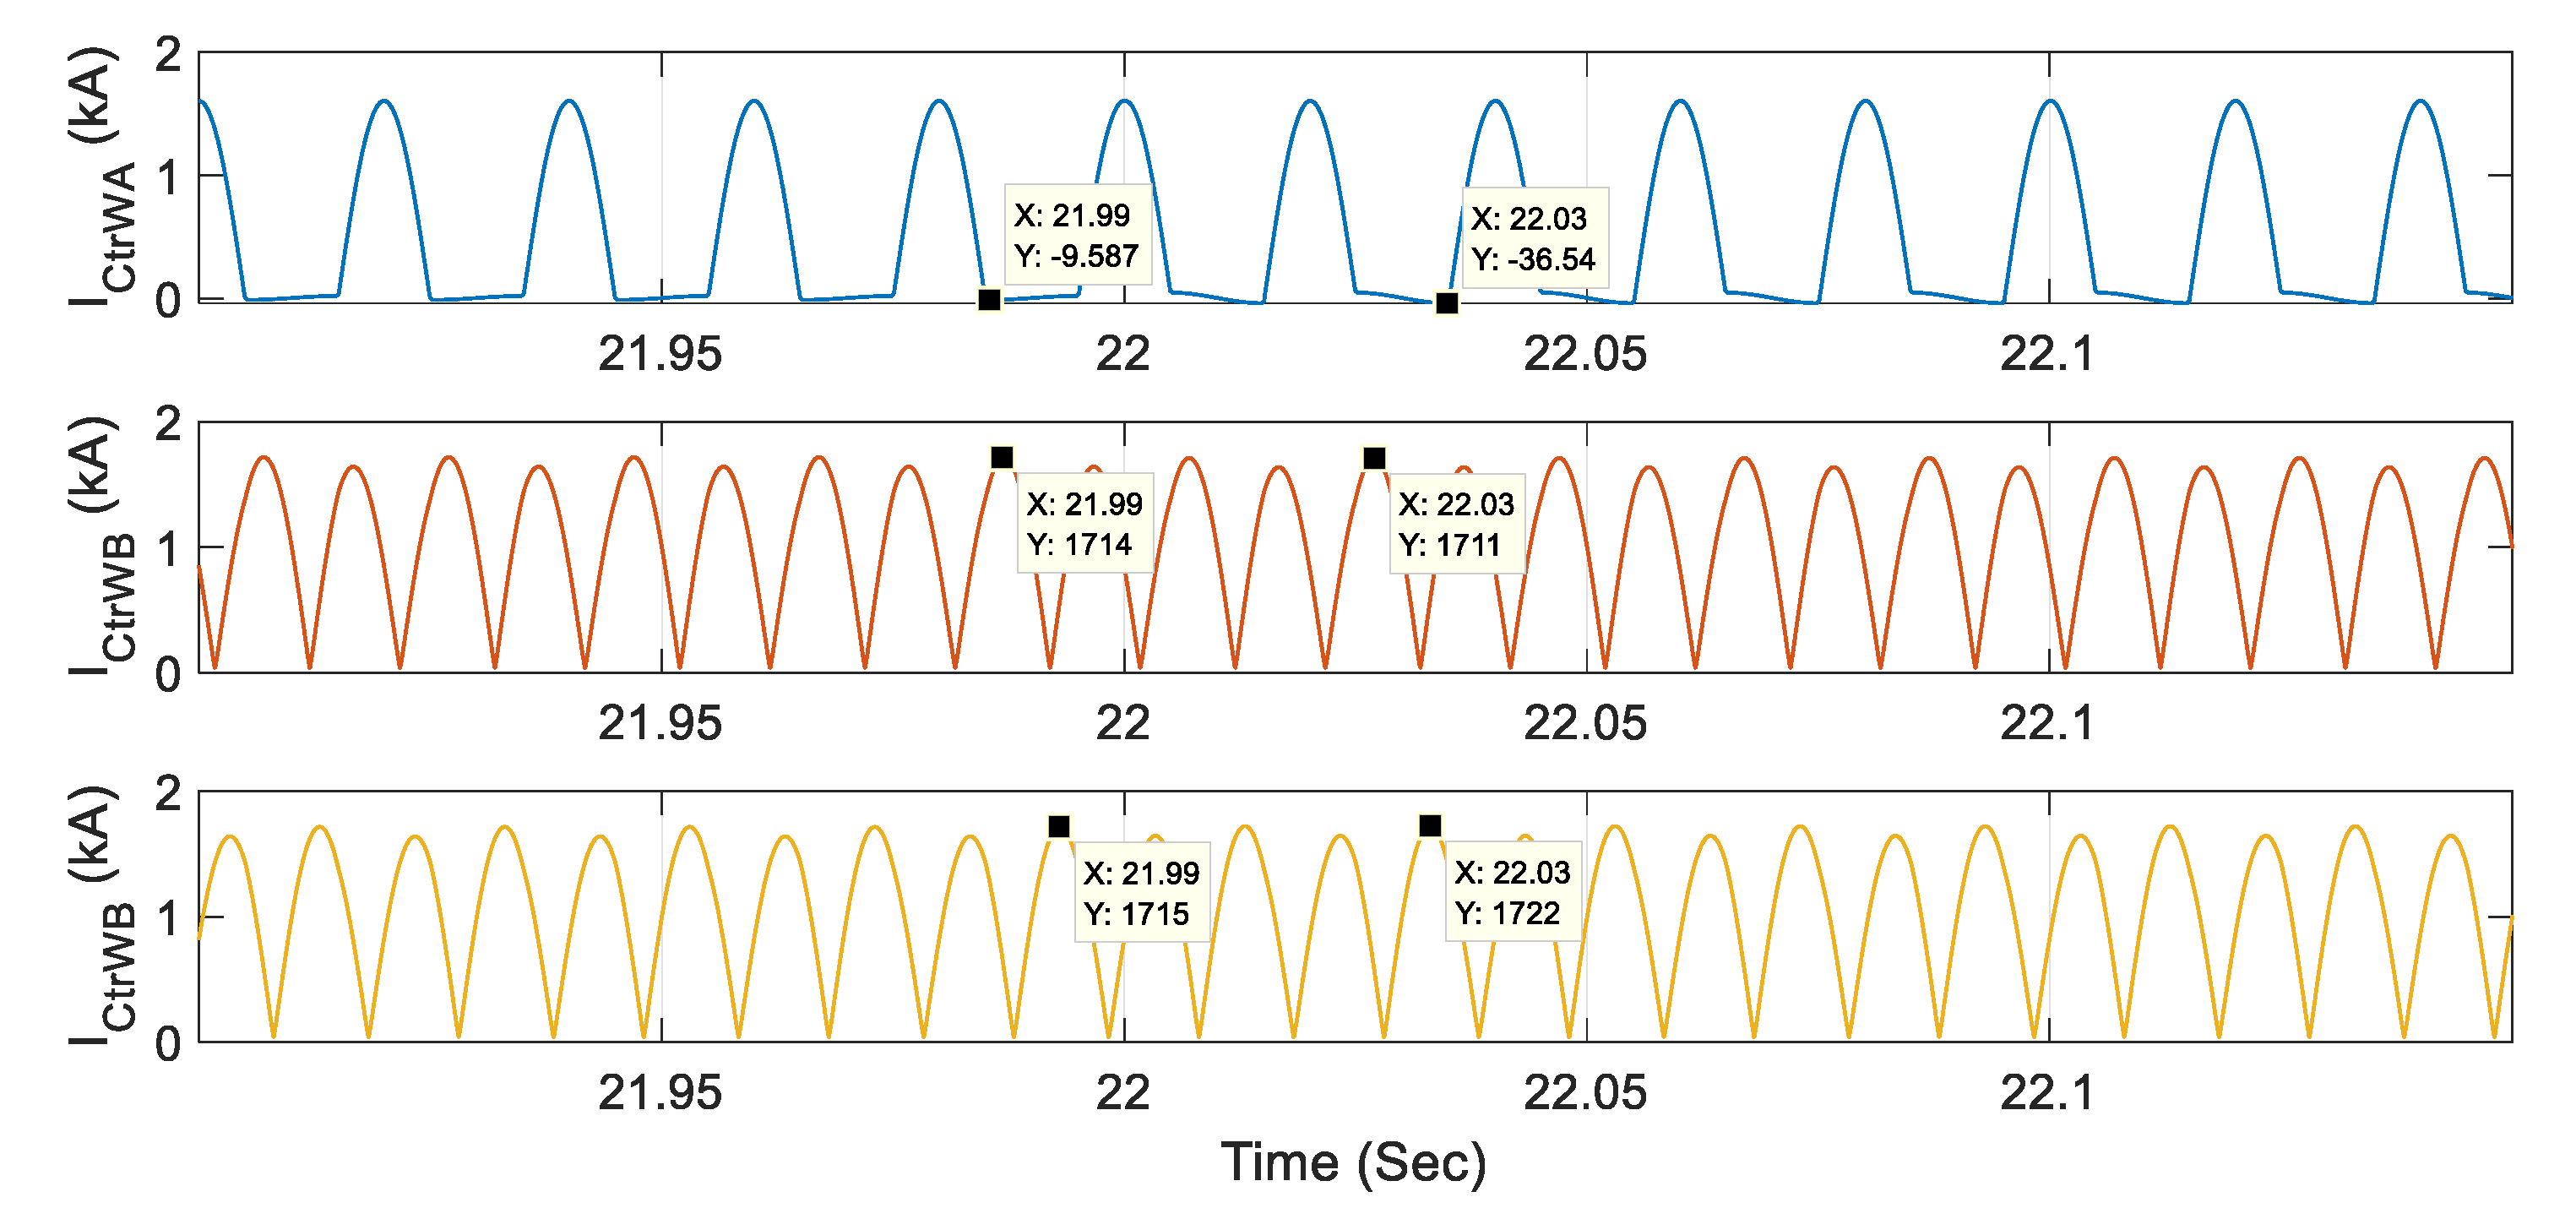
Figure 15 shows the complete module of MCSR CtrW and its DC excitation system for changing the firing angles of thyristors. In Figure 16, the connectivity of the CtrWs with the DC buses and the balance resistors is represented separately. Due to a T2TF in CtrWs, the saturation of the limbs will be affected because, an extra DC current will circulate in the faulted section and therefore, a slight increase in the capacity of MCSR can be noticed due to this extra DC current. Due to the huge difference in number of turns from PWs, there will be no visible effect on PW side current (only 4 Amp increase) for 3% CtrW T2TF under 10% operating capacity. However, under 50% and 100% operating capacities, the change is noticeable. Figure 17 shows the changes in CtrW current ( I C t r W k x ) of each phase when a T2TF of 3% is applied at limb 1 of phase A at 22 Second. The data cursor in the waveforms represents current values before and after the fault occurrence. Due to this fault, a reasonable change in limb 1 of phase A CpW current ( i C p W k x ) is also noted as shown via data cursor in Figure 18. Table 3 and Table 4 show the detailed input currents of all the windings for 3% CtrW T2TF under 10% and 100% operating capacities. However, these changes in PW and CpW is no more detectable when the operating capacity becomes less than 50% and a 3% CtrW T2TF occurs. For this purpose, the only criteria for detecting T2TF is the current at thyristor bus ( i ( T h y B u s ) ). Figure 19 shows this change in current after applying fault at 22 second. For CtrW T2TF detection, power winding current, compensation winding current, and i ( T h y B u s ) are selected due to their sensitivities. When the operating capacity is 50% to 100% and a 3% T2TF occurs, i PWkx and i CpWkx of the affected phase and limb is selected to detect the changes in its magnitude. However, for 10% operating capacity, only i ( T h y B u s ) is sensitive. In both cases (i.e., 50–100%, and 10% capacity), the changes in affected winding is investigated and therefore can be further used for faulty-phase selection. The detailed results of the simulations are given in Table 3 and Table 4. For energization, internal faults, and external faults the behavior of the current completely changed (as shown in Table 3 and Table 4, where normal steady-state condition is represented by blue, energization by black, and T2TF by red color). It is worth noting to mention that, during 3% T2TF at 50% or more capacity, the i P W k x goes on increasing while that of i CpWkx goes on decreasing, respectively. However, in both cases the problem of differentiation between energization condition and that of a T2TF exists. For solving this issue, the detailed simulation study is performed and found that the ratio of steady-state i PWkx to energization condition is up to 59% and disappear after 2.5–3 s. For i C p W k x this ratio reaches up to 75% and the decaying time remains from 3–5 s for 10–100% operating capacity, respectively. During 3% T2TF under 100% capacity, the increase in i PWkx is almost 10A and the decrease in i CpWkx is noted 80A. Using both these criteria, a 3% T2TF can be detected along with its faulty-phase identification. For CtrW to Ground fault, the behavior of both these winding currents reversed, i.e., i P W k x goes on decreasing while that of i C p W k x goes on increasing. Under 10% operating capacity, the only criterion for 3% T2TF detection is i ( T h y B u s ) . The increase in i ( T h y B u s ) under this case is noticed more than 100A, and hence easily detectable. Considering magnitude of i ( T h y B u s ) , T2TF during any circumstance of energization condition is easily distinguishable.

4.3. CpW T2TF

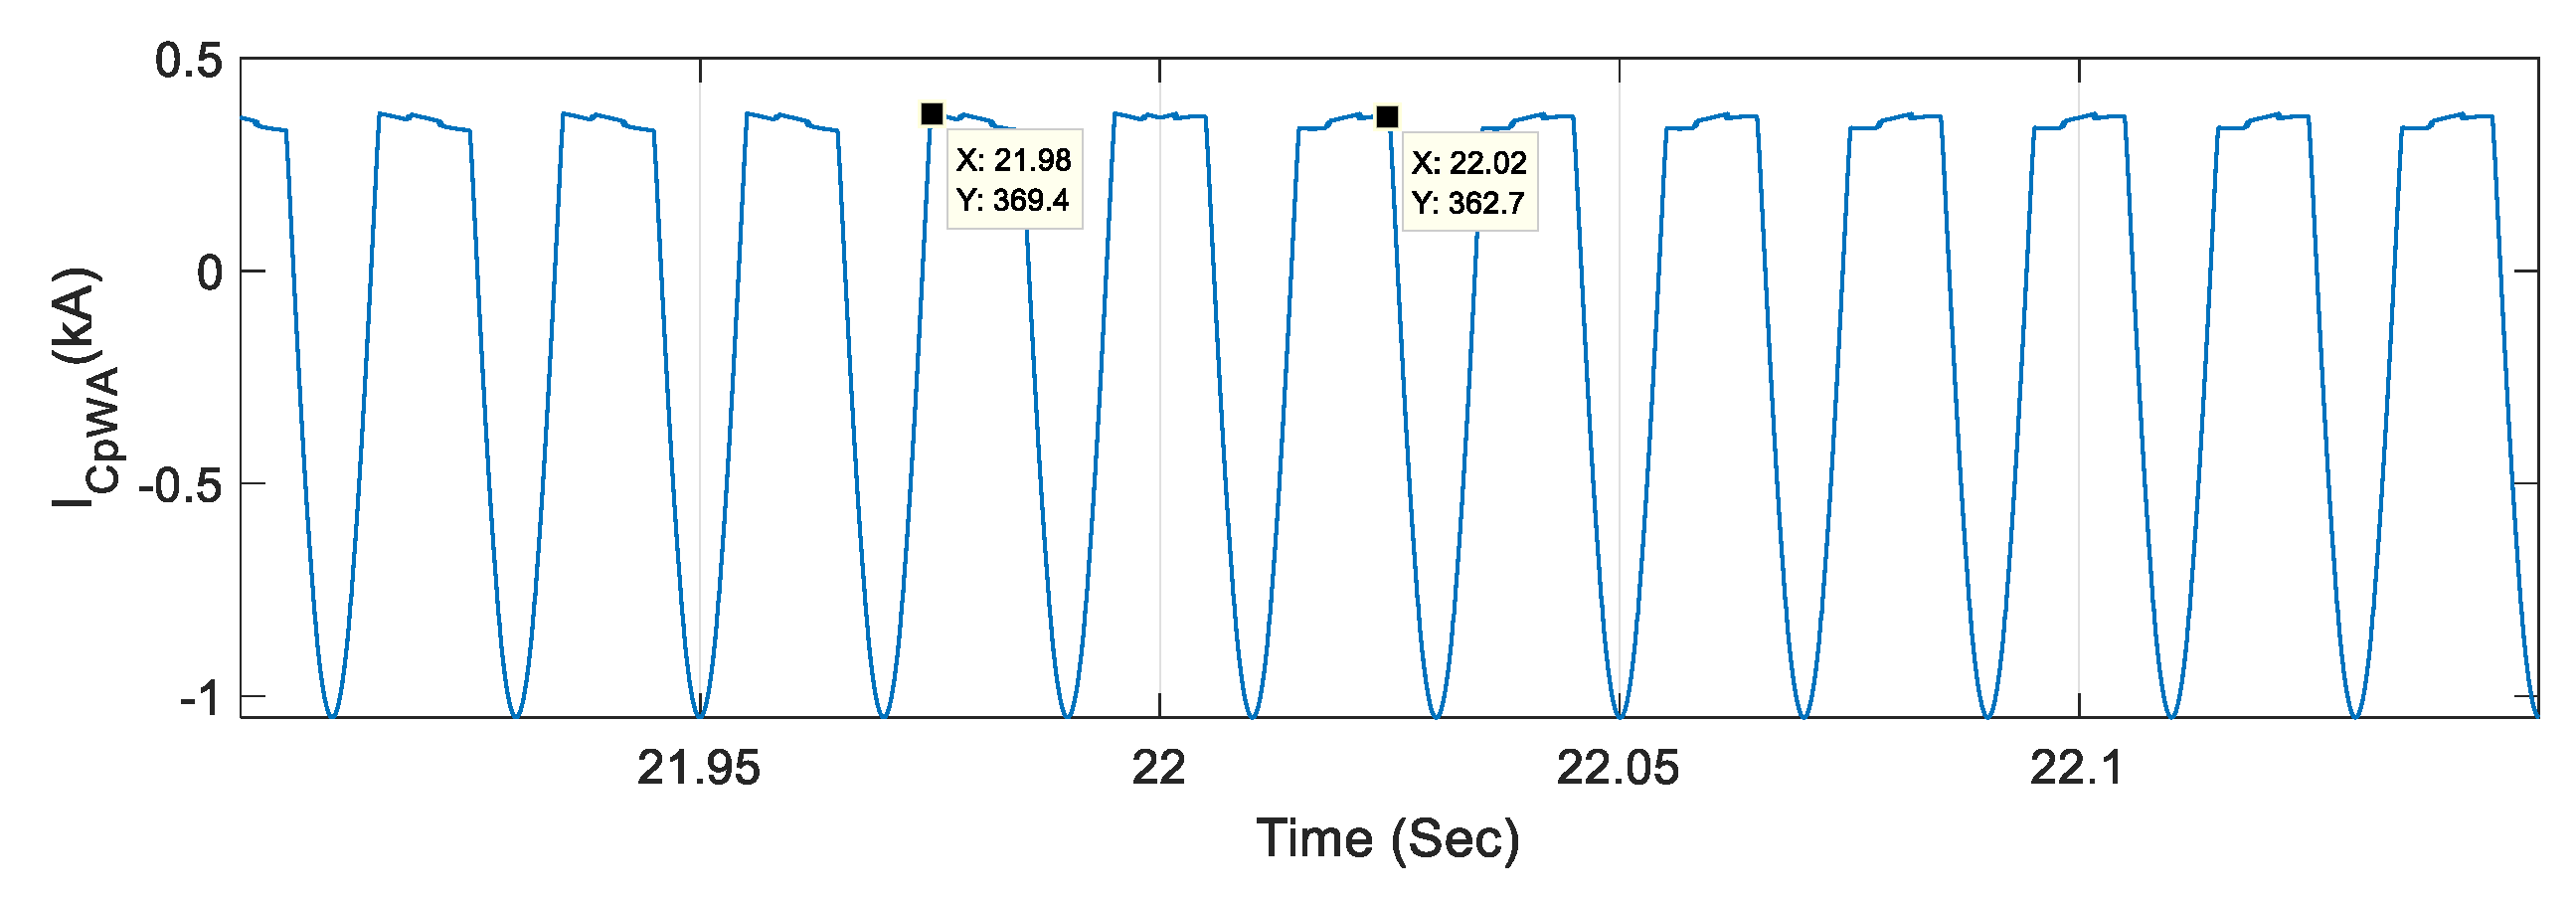
As delta connected CpWs are not connected directly to any kind of power sources, and only the harmonic contents of i P W k x are circulating in it, therefore, the effects of CpW T2TF resemble PW T2TF. Under 3% CpW T2TF, there are small changes occuring in the CtrWs waveforms, as shown by the data cursor in Figure 20, and phase A of CpW as shown in Figure 21. The detailed simulation results of all the input currents for 3% CpW T2TF under 10% and 100% operating capacities are given in Table 5 and Table 6. To detect a 3% T2TF in CpWs under 10–100% operating capacity, I C t r W k x is found sensitive to these kind of faults. During normal and steady-state conditions, the I C t r W k x magnitude remains almost positive (with −12A sinusoidal) while, in case of a 3% T2TF, its magnitude changes to higher negative values (−26A increases in both cases for 10% as well as 100% operating capacity). The higher magnitude values in negative show that either T2TF or energization of the equipment occurred. Now, the issue is to differentiate between T2TF and energization conditions. For this purpose, simulations of all possible energization conditions are carried out, and the results are depicted in Table 5 and Table 6 (where normal steady-state condition is represented by blue, energization by black, and T2TF by red color). From the simulation results, it is evident that during energization the increase in magnitude of CtrW is a fixed percentage (69%) of the original I C t r W k x and is continuously decaying with time, which is easily distinguishable from T2TF. During 10% operating capacity, it will take longer (i.e., 6.5 s) to settle as compared to 100% operating capacity (i.e., 3 s). As these phenomena will only happen in the CtrW of the affected phase, therefore, phase selection is also performed.

5. Proposed Protection Scheme for Each Winding T2TF

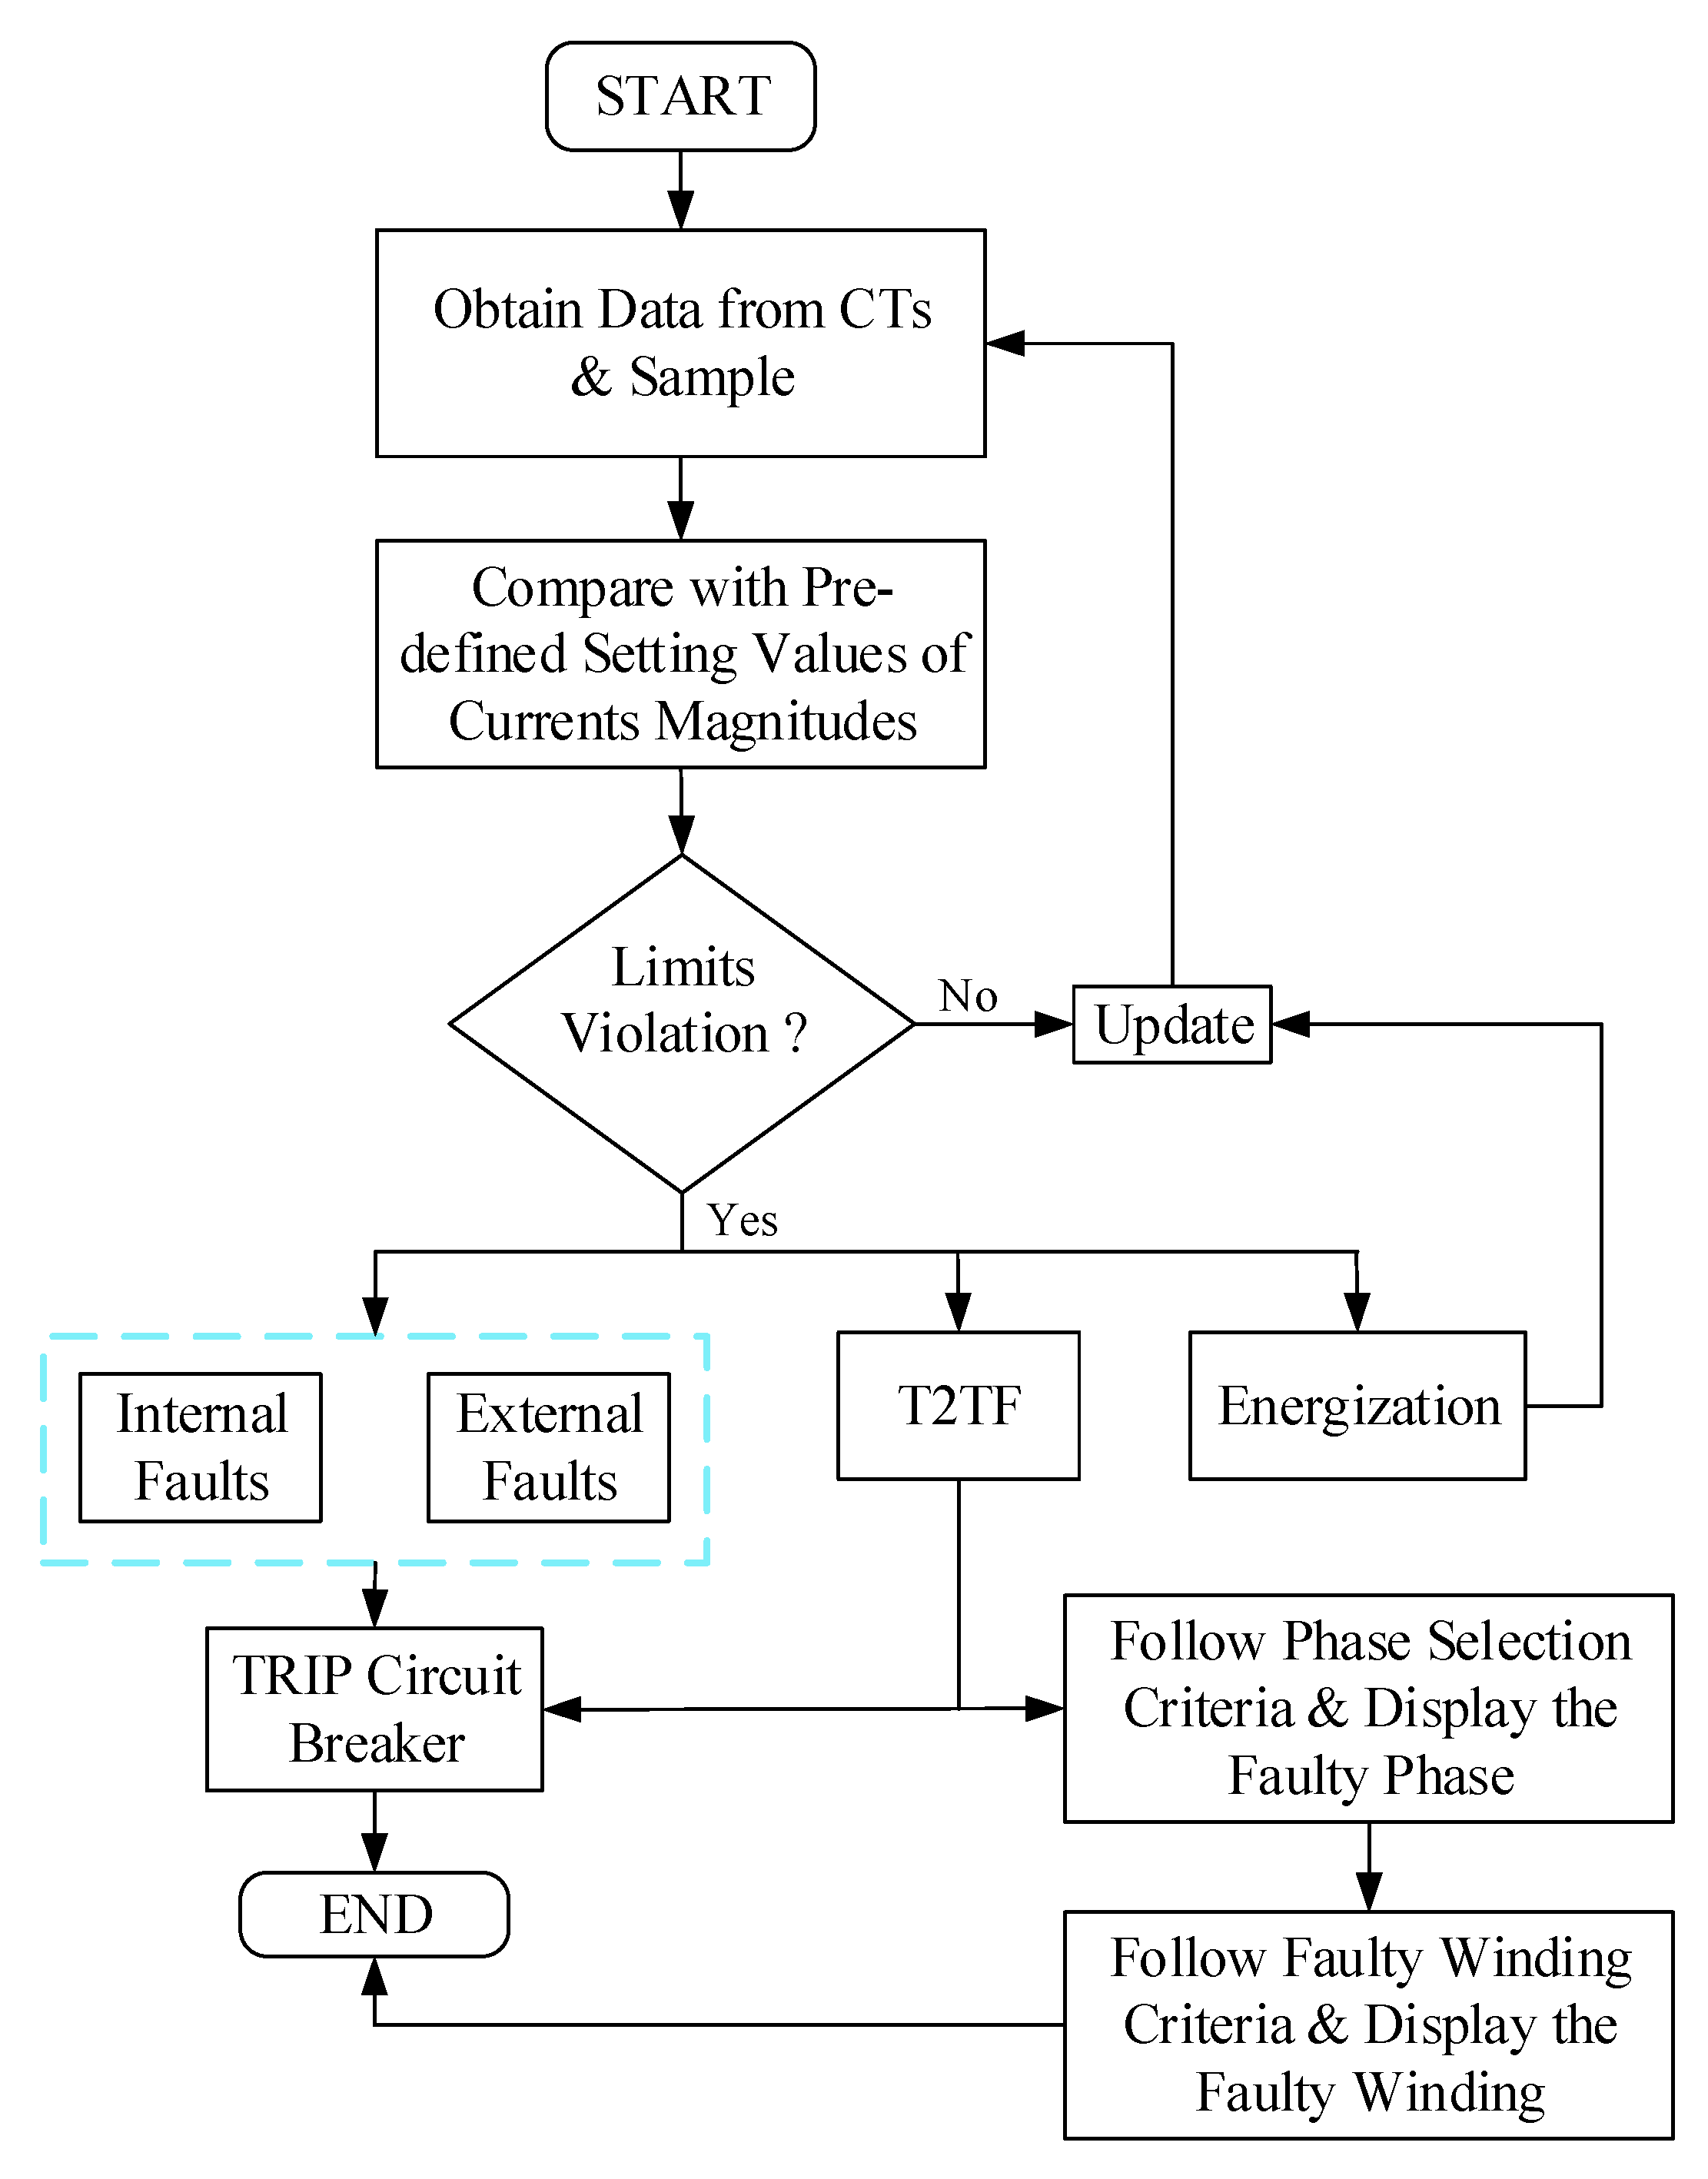
Based on the above analysis, a protection scheme is proposed for each winding keeping in mind their special features and the detectable changes in the magnitude of their respective current during T2TFs. In Figure 22, the flowchart of the proposed protection scheme is shown. After getting the CTs data from input terminal of all the three windings and the thyristor bus, the magnitudes comparison of i P W k x , I C t r W k x , i C p W k x , and   i ( T h y B u s ) is performed. In case of normal operation or energization condition, the memory will be updated without any further action. However, if there is limits violation happened, then it should be differentiated between internal PW-to-ground fault, external phase-to-phase or phase-to-ground, and T2TFs. In all these conditions, the first step will be to operate the relay and trip the circuit breaker to isolate the faulty section. Only in case of a T2TF, the faulty phase and faulty winding criteria will be followed to identify it, based upon the abnormal range values of faulty section.
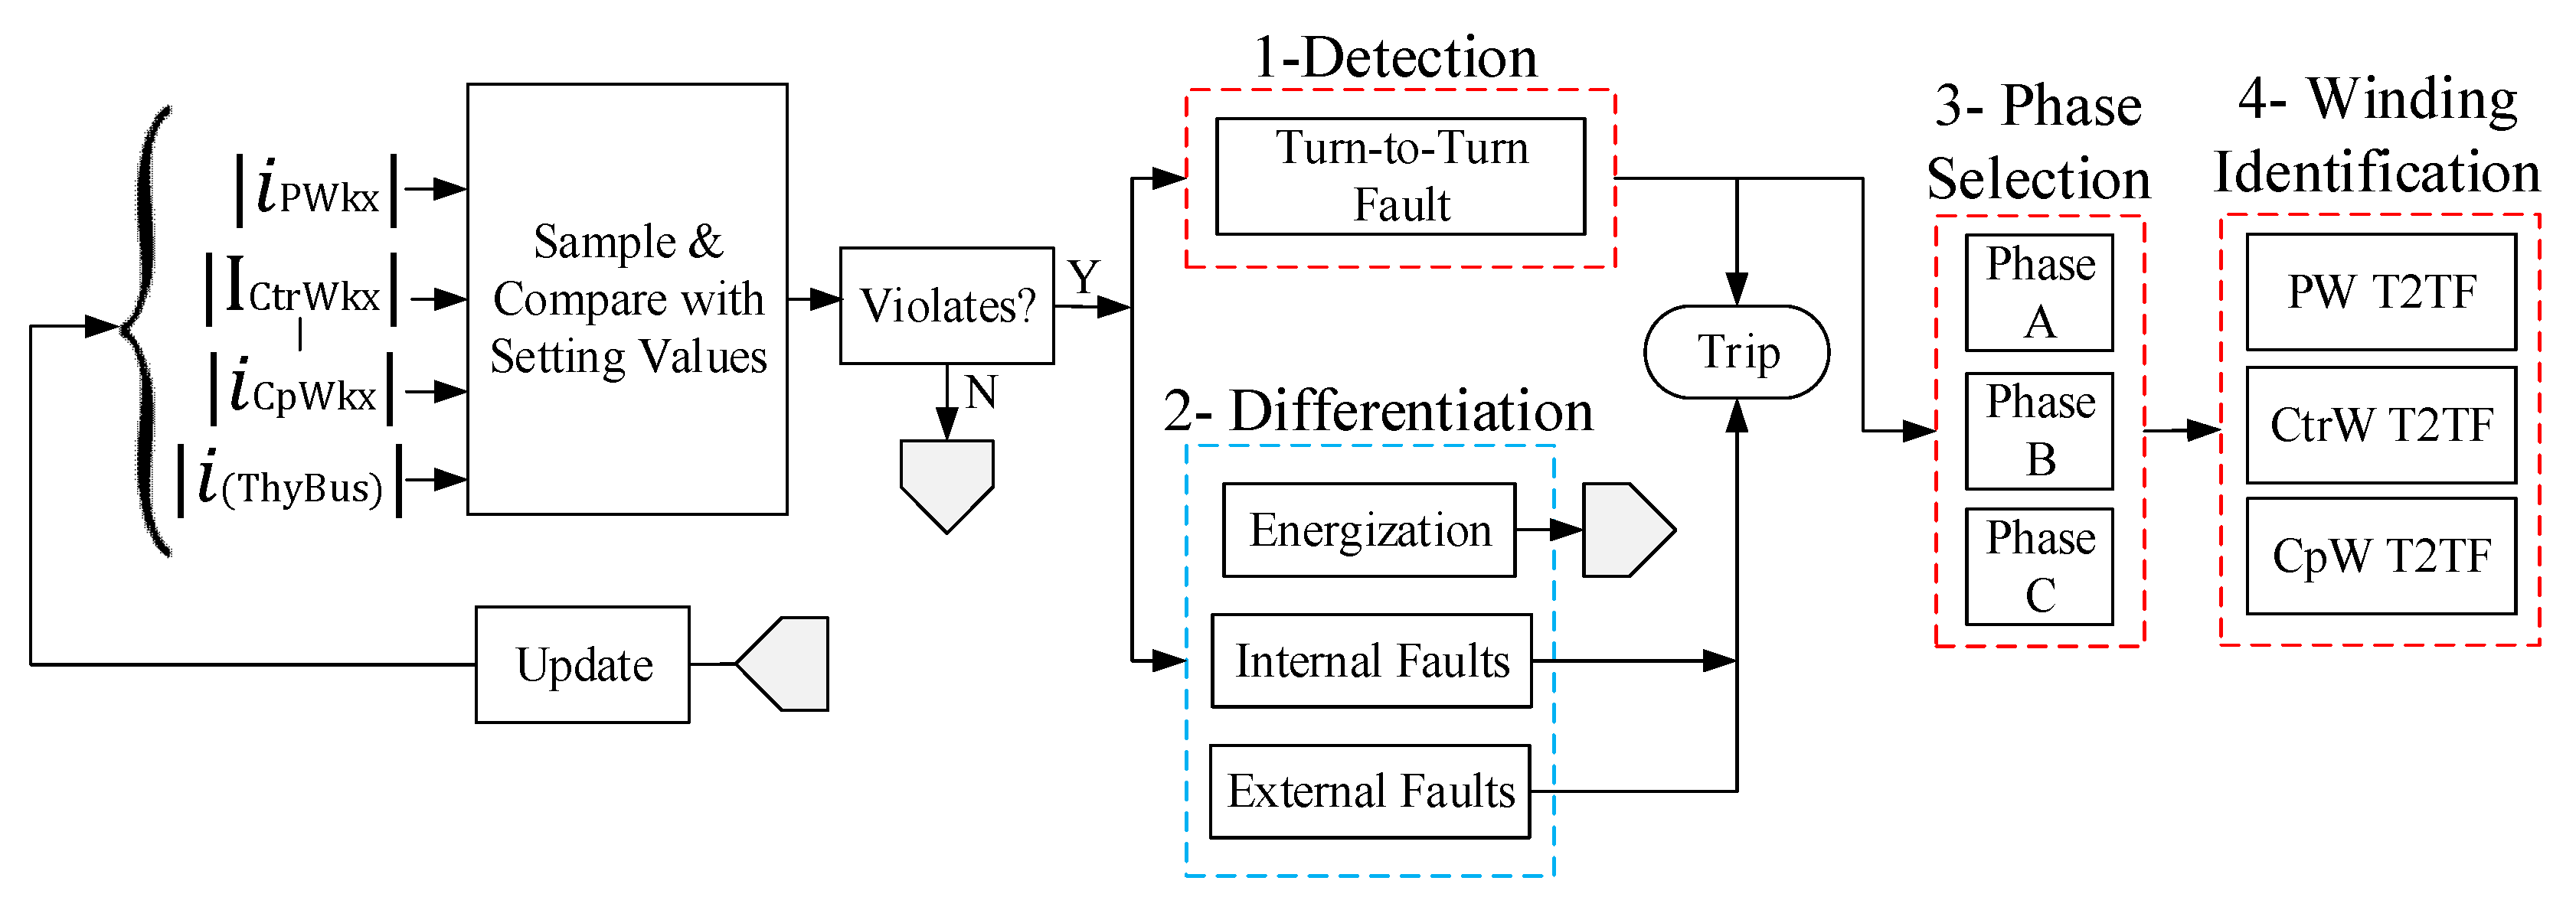
The proposed protection scheme is based on the measured currents magnitudes comparison with normal operational ranges and works in four stage; (1) to detect T2TF, (2) to differentiate it from energization, internal, and external faults, (3) to select the faulty phase among phase A, B, and C, (4) to identify the faulty winding among PW, CtrW, and CpW. All these steps are shown in Figure 23 and discussed in detail below.

5.1. Detection of T2TF Fault

After the relay detects limits violation(s), it simultaneously checks for differentiation along with T2TF detection function in parallel processing mode. After sampling the desired signals as shown in Figure 23, a value comparison of these parameters (magnitudes of the windings current) made with the pre-defined setting values obtained during steady-state and energization condition. In case of violation of these limits, the scheme declares abnormal condition. To further analyze this situation, a pre-defined T2TF criteria based upon the analysis presented in Table 1, Table 2, Table 3, Table 4, Table 5 and Table 6 is tested and if agreed, a tripping signal is generated.

5.2. Differentiation from other Abnormalities

During energization, the current transients remain within specific percentages of the rated current and decrease with time. Therefore, the system will declare energization condition and an update will happen without any tripping. While in the case of a T2TF, both these criteria do not satisfy, because an increase in the transient current remains unchanged until clearance of the fault, and does not follow any specific percentage of the rated current. Moreover, the behavior of all the currents is quite easily distinguishable from internal, external, and PW-Ground faults (as the values shown in Table 1 and Table 2 for reference). Therefore, the main feature of this sub-block is to differentiate among energization, internal fault, and external fault. After following the specific checking criteria, the desired signal is generated either by tripping the main three-phase circuit breaker or just updating the system with the energization condition.

5.3. Selection of Faulty Phase

After the declaration of T2TF and tripping the relay, now the decision is taken about the faulty phase among the three phases. Based upon the analysis performed in the previous sections for individual T2TFs and the simulation results depicted in Table 1, Table 2, Table 3, Table 4, Table 5 and Table 6, it is quite easy to identify the faulty phase due to the huge change in its parameters from the other two healthy windings. Therefore, by comparing the selected parameters values with the pre-defined settings, the effected phase is declared faulty.

5.4. Identification of Faulty Winding

When a T2TF in the respective phase is declared, now the comparison of the two limbs of the faulty phase only need to be analyzed for detection of the faulty winding. Therefore, the comparison window remains very narrow due to the fixed number for limbs and windings, which makes this task easy and simple. By comparing the values for all the three windings of specific phase, and comparing the results with the Table 1, Table 2, Table 3, Table 4, Table 5 and Table 6, the algorithm is able to identify the T2TF effected winding.

6. Performance Evaluation of the Proposed Protection Scheme

The performance of the proposed protection scheme is evaluated, and the results are presented in Table 7. Four decision parameters are chosen to detect T2TF of PW, CtrW, and CpW, and differentiate it from energization, internal fault (PW-G) and external fault (Ph-G). Based upon the selected parameters, the settings values violation is depicted by (✔) and non-violation is represented by (✖) after applying each scenario.

7. Discussion

In this paper, a protection scheme for detecting 3% T2TF of each winding is developed. Previously, the main focus was to design a scheme only for CtrW protection due to its special circuitry and operational characteristics, and was succeeded to detect up to 2% T2TF [9]. However, the findings in this paper may be utilized for actual implementation on a physical model to study its effectiveness before field implementation. Although there is a very rare chance of T2TF during energization because of the continuous operational nature of MCSR, but then its impact is also analyzed. To realize 3% T2TFs, hundreds of winding turns made shorted in simulation, which needs improvement to sense up to 1% T2TF. It is also observed that, besides the mentioned parameters, there is impact of some other parameters such as the magnetic flux of the respective limb, which is inversely proportional to the number of tappings. The relation between number of shorted turns and level of T2TF is also inversely proportional to the flux of the affected limb. If the shorted turns are more, there will be drastic decrease in the magnetic flux. It has been noted that that the thyristor current under same level of T2TF has same behavior for CtrW and CpW, i.e., increasing its magnitude by increasing the capacity. However, for PW T2TF, the current at thyristor bus shows exactly opposite response to that of the other two windings. Additionally, T2TFs is always unsymmetrical and hence, it causes changes in symmetrical components of the system. Moreover, the effect of any kind of abnormality can be easily noticed at the reactive power capacity of the equipment.

8. Conclusions

A 3% T2TF protection scheme based on the internal changes in the magnetic and electric parameters of the windings is presented. After analyzing the mathematical model and basic structure of the equipment, certain parameters are found sensitive enough to detect T2TF in any windings of the model. Based on these parameters, an algorithm is defined for detecting T2TF in PW, CtrW, and CpW, and differentiating it from energization, internal, and external faults. After evaluating the performance of the proposed protection scheme under T2TFs, energization, internal, and external faults, the scheme is found accurate and precise. Moreover, the algorithm has certain flexibilities regarding future work in terms of number of shorted turns, operating capacities of the equipment, and identifying the faulty phase and exact location of the T2TF. As a future work, different time and frequency domain techniques can be utilized along with harmonic contents distortion methods, to identify the fault winding contaminated signals from T2TFs and differentiate it from other abnormalities and energization conditions.

Author Contributions

The simulation model development and validation are performed by T.Z., along with supervision, project administration, and funding acquisition. The conceptualization, methodology, and original draft is prepared by M.A.K.

Funding

The work of MCSR research was supported by The National Natural Science Foundation of China (51677069) and the Key Project of Smart Grid Technology and Equipment of National Key Research and Development Plan of China (2016YFB0900600).

Conflicts of Interest

The authors declare no conflict of interest.

Appendix A

Table A1. Equivalent system parameters for simulation model.
ParameterValue
Voltage750 kV
Positive Sequence Resistance2.9 Ω
Positive Sequence Inductance0.143 H
Zero Sequence Resistance8.7 Ω
Zero Sequence Inductance0.299 H
Frequency50 Hz
Table A2. MCSR core saturation characteristics curve.
Magnetizing Current (p.u.)Flux (p.u.)
00
0.0009260.994
0.0216121.0601
1.9611.8425
Table A3. MCSR simulation model specifications.
ParameterSpecified Value
Rated Capacity3 * (55 * 2) Mvar
Rated Voltage of PW800/√3 kV
Rated Voltage of each CtrW21 kV
Rated Voltage of CpW20 kV
Rated Frequency50 Hz
Rated Current of PW238 A
Reactance under Rated Operating Capacity1941 Ω
Adjustable Range of Operating Capacity10–100%

References

  1. Bryantsev, A.; Dorofeev, V.; Zilberman, M.; Smirnov, A.; Smolovik, S. Magnetically controlled shunt reactor application for AC HV and EHV transmission lines. In Proceedings of the CIGRE, Paris, France, 27 August–1 September 2006; pp. 307–314. [Google Scholar]
  2. Tian, M.; Li, Q.; Li, Q. A Controllable Reactor of Transformer Type. IEEE Trans. Power Deliv. 2004, 19, 1718–1726. [Google Scholar] [CrossRef]
  3. Roxenborg, S.; Naisani, P.; Moraru, G.; Ingebrigtsen, S.; Herrera, J.M.; Chano, S. Protection Monitoring and Control of Shunt Reactors. Cigre B5 2013, 37, 546. [Google Scholar]
  4. IEEE Power Systems Relaying Committee. IEEE Guide for the Protection of Shunt Reactors. ANSI/IEEE C 1988, 37, 109. [Google Scholar]
  5. Zhang, Z.; Das, S.; Sidhu, T.; Zadeh, M.R.D. Systems and Methods for Detecting Turn-to-Turn Faults in Windings. US Patent No. 10,088,516, 2 October 2018. [Google Scholar]
  6. Das, S.; Sidhu, T.S.; Zadeh, M.R.D.; Zhang, Z. A novel hybrid differential algorithm for turn to turn fault detection in shunt reactors. IEEE Trans. Power Deliv. 2017, 32, 2537–2545. [Google Scholar] [CrossRef]
  7. Deng, Z.-F.; Wang, X.; Zhou, F.; Lei, X.; Yu, K.-S.; Qiu, Y.-F. Modeling of extra-high voltage magnetically controlled shunt reactor. Proc. CSEE 2008, 28, 108–113. [Google Scholar]
  8. Gu, X.; Wu, Y.; Qu, T.; Xu, W.; Liu, D. The simulation of the controllable reactor and it’s application in ultra high voltage transmission lines. In Proceedings of the 2011 IEEE International Conference on Advanced Power System Automation and Protection, Beijing, China, 16–20 October 2011; pp. 1833–1837. [Google Scholar]
  9. Zheng, T.; Zhao, Y.J.; Jin, Y.; Chen, P.L.; Zhang, F.F. Design and analysis on the turn-to-turn fault protection scheme for the control winding of a magnetically controlled shunt reactor. IEEE Trans. Power Deliv. 2014, 30, 967–975. [Google Scholar] [CrossRef]
  10. Lyamov, A.; Makarova, M.; Smolovik, S. Controllable shunt reactor deployment effect on power station stability indices. In Proceedings of the 2015 IEEE Eindhoven PowerTech, Eindhoven, The Netherlands, 29 June–2 July 2015; pp. 1–4. [Google Scholar]
  11. Zheng, T.; Zhao, Y. Microprocessor-based protection scheme for high-voltage magnetically controlled shunt reactors. In Proceedings of the 12th International Conference on Developments in Power System Protection (DPSP 2014), Copenhagen, Denmark, 31 March–3 April 2014; pp. 1–5. [Google Scholar]
  12. Khan, M.A.; Tao, Z.; Xiaoxiao, L. Analysis of Faults and Protection Schemes for Magnetically Controlled Shunt Reactor. In Proceedings of the 2018 2nd IEEE Conference on Energy Internet and Energy System Integration (EI2), Beijing, China, 20–22 October 2018; pp. 1–6. [Google Scholar]
  13. Basha, F.K.; Thompson, M. Practical EHV reactor protection. In Proceedings of the 2013 66th IEEE Annual Conference for Protective Relay Engineers, College Station, TX, USA, 8–11 April 2013; pp. 408–419. [Google Scholar]
  14. Gajić, Z.; Hillström, B.; Mekić, F. HV Shunt reactor secrets for protection engineers. In Proceedings of the 30th Western Protective Relaying Conference, Washington, DC, USA, 21–23 October 2003. [Google Scholar]
  15. Wu, Y.; Ma, G. Anti-Interference and Location Performance for Turn-to-Turn Short Circuit Detection in Turbo-Generator Rotor Windings. Energies 2019, 12, 1378. [Google Scholar] [CrossRef] [Green Version]
  16. Nie, H.; Wei, X.; Wang, Y.; Chen, Q. A Study of Electrical Aging of the Turn-to-Turn Oil-Paper Insulation in Transformers with a Step-Stress Method. Energies 2018, 11, 3338. [Google Scholar] [CrossRef] [Green Version]
  17. Carvalho, F.; Fabiano, L.; Lidstrom, S.; Gajic, Z.; Saha, M. Application of numerical relays for HV shunt reactor protection. In Proceedings of the 2004 IEEE/PES Transmision and Distribution Conference and Exposition: Latin America (IEEE Cat. No. 04EX956), Sao Paulo, Brazil, 8–11 November 2004; pp. 587–590. [Google Scholar]
  18. Nishida, S.; Sakaguchi, T. A new algorithm of digital protection for shunt reactors. IEEE Trans. Power Appar. Syst. 1984, 2934–2942. [Google Scholar] [CrossRef]
  19. Songlin, C.; Zhihong, W.; Yuping, Z.; Guorong, S.; Hongyang, Z. Research & development of a new digital shunt reactor protection. Autom. Electr. Power Syst. 2003, 24, 70–73. [Google Scholar]
  20. Zheng, T.; Zhang, F.; Liu, X.; Huang, T.; Khan, M.A. Protection schemes for turn-to-turn faults within control windings of TCT-CSR and impacts of power regulation. Int. J. Electr. Power Energy Syst. 2018, 97, 275–281. [Google Scholar] [CrossRef]
  21. Zheng, T.; Huang, T.; Zhang, F.; Zhao, Y.; Liu, L. Modeling and impacts analysis of energization transient of EHV/UHV magnetically controlled shunt reactor. Int. Trans. Electr. Energy Syst. 2017, 27, e2330. [Google Scholar] [CrossRef]
  22. Zheng, T.; Liu, X.; Wei, J.; Khan, M.A.; Wang, X. Protection scheme for turn-to-turn faults of magnetically controlled shunt reactor based on waveform similarity comparison. Electr. Power Syst. Res. 2019, 177, 105980. [Google Scholar] [CrossRef]
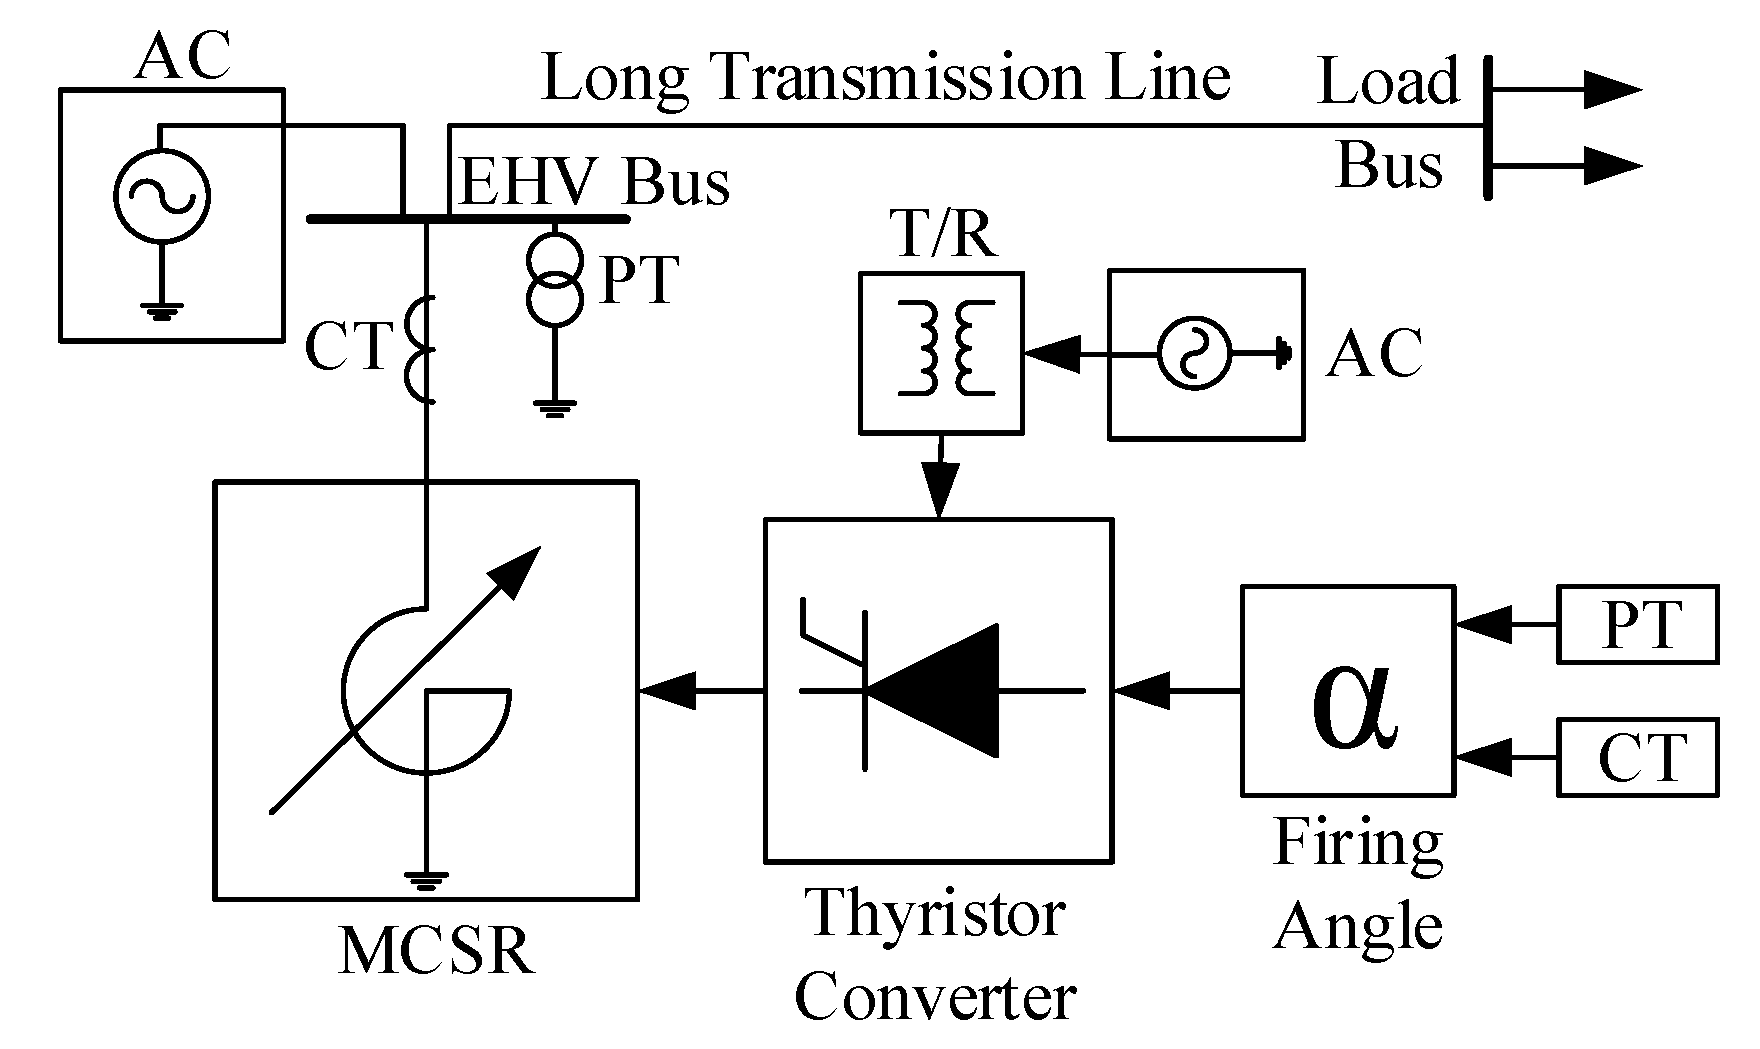
Figure 1. Closed-loop operational diagram of a magnetically controlled shunt reactor (MCSR).
Energies 12 04628 g001
Figure 2. Arrangement of power windings (PWs), control windings (CtrWs), and compensation windings (CpWs) across the two limbs of a single-phase MCSR.
Energies 12 04628 g002
Figure 3. Single line diagram (SLD) of a three-phase extra-high voltage (EHV) MCSR and its connectivity.
Energies 12 04628 g003
Figure 4. An equivalent electric circuit diagram of a single-phase MCSR.
Energies 12 04628 g004
Figure 5. The complete magnetic paths inside iron core of a single-phase MCSR without CpW.
Energies 12 04628 g005
Figure 6. AC flux distribution inside both limbs without CpWs while, ignoring upper, lower, and the two side yokes.
Energies 12 04628 g006
Figure 7. Electric equivalent circuit diagram of a single-phase MCSR without CpWs.
Energies 12 04628 g007
Figure 8. Building blocks of phase A of three-phase MCSR Simulation model with complete magnetic paths representation.
Energies 12 04628 g008
Figure 9. AC flux A1 ( ϕ 11 ) and flux A2 ( ϕ 21 ) during a 3% PW T2TF in limb1 of phase A under (a) 100% capacity; and (b) 10% capacity.
Energies 12 04628 g009
Figure 10. Currents in CtrW and CpW phase A limb 1 during a 3% PW T2TF in limb 1 of phase A under (a) 100% capacity; and (b) 10% capacity.
Energies 12 04628 g010
Figure 11. Currents of CtrW A, B, and C during a 3% PW T2TF capacity in limb 1 of phase A under (a) 100% capacity; and (b) 10% capacity.
Energies 12 04628 g011
Figure 12. Currents of CpW A, B, and C during a 3% PW T2TF in limb 1 of phase A under (a) 100% capacity; and (b) 10% capacity.
Energies 12 04628 g012
Figure 13. 3-Phase current at EHV bus during a 3% PW T2TF in limb 1 of phase A under (a) 100% capacity; and (b) 10% capacity.
Energies 12 04628 g013
Figure 14. Variation of i 11 and i 11 during a 3% PW T2TF in limb 1 of phase A under (a) 100% capacity; and (b) 10% capacity.
Energies 12 04628 g014
Figure 15. Full view of the CtrWs connectivity with DC system through thyristor converters and rectifier transformer for three-phase MCSR.
Energies 12 04628 g015
Figure 16. The CtrWs connection mode of a three-phase MCSR.
Energies 12 04628 g016
Figure 17. Currents of CtrW A, B and C during a 3% CtrW T2TF under 100% capacity in limb 1 of phase A.
Energies 12 04628 g017
Figure 18. Variation of current in CpW A1 during a 3% CtrW T2TF in limb 1 of phase A under 100% capacity.
Energies 12 04628 g018
Figure 19. Phase A current across thyristor bus under 3% CtrW T2TF in limb 1 of phase A under 100% capacity.
Energies 12 04628 g019
Figure 20. Currents of CtrW A, B and C during a 3% CpW T2TF under 100% capacity in limb 1 of phase A.
Energies 12 04628 g020
Figure 21. Variation of current in CpW A1 during a 3% CpW T2TF in limb 1 of phase A under 100% capacity.
Energies 12 04628 g021
Figure 22. Flowchart of the proposed protection scheme.
Energies 12 04628 g022
Figure 23. Operational stages of the proposed protection scheme.
Energies 12 04628 g023
Table 1. Windings currents comparison for 3% PW T2TF under 100% operating capacity.
CaseScenario   i A 1   ( A )   i 11   ( A )   i 11   ( A )   I C t r W A 1   ( A )   i C p W A 1   ( A )
1Normal (SS 1)2992980.71822913
2Normal (E 2)3063051.418911503
33% T2TF6486460.850423280
4Internal PW-G 3333333321.017858622
5External Ph 4 -G Fault−260−2610.0874001834
6External Ph-Ph Fault−71−720.3203428
7T2TF at Direct E7717731.063114222
8T2TF at 50% Pre-Excited E7867851.263344136
9T2TF at PR 5 (100%–10%)7167160.858154109
1 SS―steady-state, 2 E―energization, 4 Ph―phase, 3 G―ground, 5 PR―power regulation.
Table 2. Windings currents comparison for 3% PW T2TF under 10% operating capacity.
CaseScenario   i A 1   ( A )   i 11   ( A )   i 11   ( A )   I C t r W A 1   ( A )   i C p W A 1   ( A )
1Normal (SS)116.7115.61.12898.8620.8
2Normal (E)281.5280.51.4110351567
33% T2TF716.5715.90.8358124106
4Internal PW-G353335330.210378575
5External Ph -G Fault−105−104−0.174791102
6External Ph-Ph Fault−28280.221207427
7T2TF at Direct E782.8781.71.2263734262
8T2TF at 50% Pre-Excited E786.8786.21.2463454170
9T2TF at PR (10%–100%)716.7115.61.12898.8620.8
Table 3. Windings currents comparison for 3% CtrW T2TF under 100% operating capacity.
Case Scenario   i A 1   ( A )   I P W A 1   ( A )   i C p W A 1   ( A )
1Normal (SS)21472147742
2Normal (E)359035891001
33% T2TF21572156662
4T2TF at Direct E35883548887
5T2TF at 50% Pre-Excited E33313330624
6T2TF at PR (100-10%)18301829592
Table 4. Windings currents comparison for 3% CtrW T2TF under 10% operating capacity.
Case Scenario   i A 1   ( A )   i ThyBus   ( A )   I P W A 1   ( A )   i C p W A 1   ( A )
1Normal (SS)21245.2k2123990
2Normal (E)36892.8k36881742
33% T2TF21245.3k2123990
4T2TF at Direct E27973k3548884
5T2TF at 50% Pre-Excited E33334.9k3332624
6T2TF at PR (10–100%)22703.4k35121033
Table 5. Windings currents comparison for 3% CpW T2TF under 100% operating capacity.
CaseScenario   i A 1   ( A )   i 11   ( A )   I C t r W A 1   ( A )   i P W A 1   ( A )
1Normal (SS)943.1159891
2Normal (E)1541.7−1095153
33% T2TF953.2−3192
4T2TF at Direct E1571.6−1436155
5T2TF at 50% Pre-Excited E2661.9−41264
6T2TF at PR (100–10%)782.1−4076
Table 6. Windings currents comparison for 3% CpW T2TF under 10% operating capacity.
CaseScenario   i A 1   ( A )   i 11   ( A )   I C t r W A 1   ( A )   i P W A 1   ( A )
1Normal (SS)501.984149
2Normal (E)1621.7−1225160
33% T2TF572.0−4055
4T2TF at Direct E1591.6−1493165
5T2TF at 50% Pre-Excited E2651.9−41.2263
6T2TF at PR (10–100%)671.8−4165
Table 7. Performance evaluation of the proposed protection scheme.
Relay ActionScenarioCapacity (%)Parameter for Faulty Phase Selection and Winding Identification
  i P W k x     I C t r W k x     i C p W k x     i ( T h y B u s )  
DPW T2TF10
E50
T100
ECtrW T2TF10
C50
T100
ICpW T2TF10
O50
N100
DEnergization10
I100
FInternal Fault10
F100
EExternal Fault10
R.100
DIFFER.–Differentiation.