Abstract
In order to address a series of issues, including energy security, global warming, and environmental protection, China has ranked first in global renewable investment for the seventh consecutive year. However, developing a renewable energy industry requires a significant capital investment. Also, the international oil price fluctuations have an important impact on the stock prices of renewable energy firms. Thus, in order to provide implications for market investment as well as policy recommendations, this paper studied the spillover effect of international oil prices on the stock prices of China’s renewable energy listed companies. We used a Vector Autoregressive (VAR) model with innovations using a Factor-GARCH (Generalized Autoregressive Conditional Heteroskedasticity) process to evaluate the impact of market co-movements and time-varying volatility and correlation between the international oil price and China’s renewable energy market. The results show that the international oil price has a significant price spillover effect on the stock prices of China’s renewable energy listed companies. Moreover, the fluctuations of international oil prices have an influence on the stock price variations of Chinese renewable energy listed companies.
1. Introduction
In recent years, a series of energy security, global warming, and environmental protection issues brought about by burning fossil fuels have prompted governments around the world to shift to developing renewable energy. The renewable energy sector has become one of the fastest-growing sectors in the energy industry. Global total investment in renewable power and fuels reached 288.9 billion USD in 2018, which was seven times higher than the amount in 2004 [1]. In 2018, the total investment in renewable power was almost three times higher than the amount of investment in newly installed gas and coal generators. Specifically, China has ranked first in global renewable investment for the seventh consecutive year, with 91.2 billion USD in 2018 (see Figure 1) [1,2]. In terms of the world’s energy development trend, renewable energy has a progressively essential role to play [3]. According to the International Energy Agency forecast, renewable energy will account for 31% of the global energy supply in 2035 [4]. Among the renewable energy markets, emerging markets will become the core of renewable energy growth. For example, China’s annual renewable generation is expected to approach 2,000 terawatt-hours (TWh) by 2035, surpassing the sum of Europe, the U.S., and Japan [4] combined.
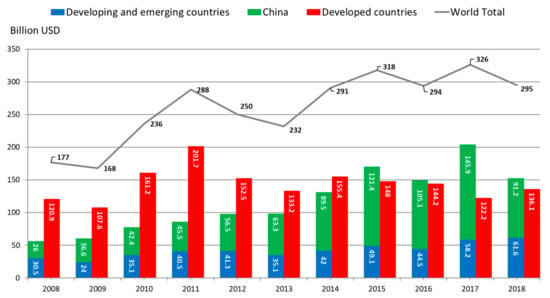
Figure 1.
New investment in renewable energy around the world, 2008–2018 [2].
With the support of various government policies, China’s renewable energy industry is briskly developing and China has been the world’s largest producer of renewable energy since 2013 [3]. The Chinese government has introduced a series of industrial policies, including the Renewable Energy Law [5], the Medium and Long-Term Development Plan for Renewable Energy [6], the 13th Five-Year Plan (FYP) Development Plan for Energy (2016–2020) [7], the 13th FYP Development Plan for Renewable Energy (2016–2020) [8], as well as the 13th Electricity Development Five Year Plan (2016–2020) [9]. The Chinese government has made it clear that by 2020 and 2030, China’s non-fossil energy will account for 15% and 20% of primary energy consumption, respectively [8]. By 2020, the installed capacity of non-fossil energy power generation will reach 770 million kilowatts, which will be an increase of 250 million kilowatts compared with 2015’s level. The proportion of non-fossil energy power generation will increase to 31% [9].
Developing renewable energy industry requires a significant capital investment. It is estimated that the new investment in renewable energy during the “13th Five-Year Plan” period will reach about 2.5 trillion RMB [8]. Compared with the traditional energy industry, renewable energy enterprises have higher requirements for technology research and development, which leads to greater demand for capital investment in the early stages [10]. Since 2009, the stock market has become a popular financing channel for wind power and photovoltaic power developers in China [11]. Other research has also shown that stock market capitalization assumes an essential role in promoting renewable energy projects and clean energy use across both developed countries and emerging economies [12,13,14]. Thus, modeling and forecasting of correlation and volatility are crucial for investors, who want to invest in the renewable sector from the stock market and manage asset pricing and portfolio optimization, as well as risk mitigation and hedging.
Factors affecting the development of China’s renewable energy industry are diverse, including technological advancement, production costs, and national policy support. The existing research on the connection between oil prices and the renewable energy industry is relatively sparse. However, crude oil price fluctuations have an important impact on the stock prices of listed renewable energy companies [15]. As one of the main traditional energy sources, China’s demand for crude oil is increasing. Since 2017, China has become the world’s largest importer of crude oil [16]. According to the theory of commodity demand, renewable energy and traditional energy crude oil are substitutes for each other. When the price of crude oil fluctuates, the cost of using crude oil will also change, thus affecting the demand for clean energy. Therefore, in theory, fluctuations in international crude oil prices will affect the development of the renewable energy industry in China [17]. Moreover, oil has both financial and commodity attributes. In the past few years, international crude oil prices have dramatically fluctuated (see Figure 2).
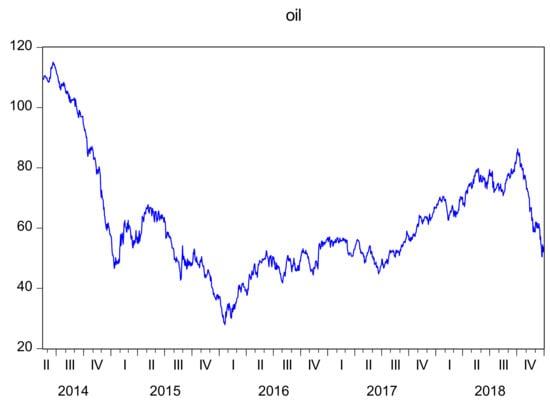
Figure 2.
The closing prices of Brent crude oil futures (USD/barrel).
Consequently, studying the relationship between crude oil prices and renewable energy listed firms can quantitatively assess the impact of international oil price volatility on the development of the renewable energy industry in China. It will not only assist renewable enterprises to effectively respond to the impact of crude oil price fluctuations and formulate timely financing and development strategies, but also aid renewable market investors in understanding market trends, grasping price patterns and market movements, and rationally arranging investment decisions. Equally imperative, the study can provide effective policy support for the government to implement and adjust energy policies, and generate a reference for the government in formulating medium- and long-term plans for renewable energy development in China. This is of great significance for reducing the dependence of national economic development on oil, mitigating the impact of oil prices on China’s energy industries, optimizing energy structure, and developing the renewable energy industry.
In the context of China’s high dependence on crude oil, this paper aimed to provide empirical evidence of the impact of international crude oil prices on the stock price fluctuations of China’s renewable energy listed companies. This paper explored the relationship between the two markets from the perspective of price and volatility, respectively. This study used the Vector Autoregression (VAR) model to evaluate the impact of price and used the Factor-Generalized Autoregressive Conditional Heteroskedasticity (Factor-GARCH) model in order to estimate the connection between the two markets’ volatility. This study took the daily closing price of the CNI New Energy Index and the daily closing price of the London Brent crude oil futures as the key variables, with the sample interval from May 2014 to December 2018. The results show that the international oil price has a significant price spillover effect on the stock prices of China’s renewable energy listed companies. They also indicate that the fluctuation of international oil prices has an influence on the stock price fluctuation of Chinese renewable energy listed firms; that is, there is a volatility contagion effect between the two markets.
The remainder of this paper is organized as follows. In Section 2, we analyze existing related literature and propose the contributions of this paper. In Section 3, we explain our research methods. In Section 4, we describe our research data and discuss the empirical analysis of the spillover effect of international oil price on the stock prices of China’s renewable energy listed companies. We also discuss the empirical analysis of international oil price fluctuation and stock volatility on China’s renewable energy listed companies. In Section 5, we draw conclusions and provide investment recommendations and policy implications for related stakeholders, including investors, renewable enterprises, and administrative policymakers.
2. Literature Review
As an important component of the production factors, oil supply and prices have a strong impact on the macro economies and macroeconomic indicators, including GDP per capita, inflation rates, exchange rates, interest rates, and employment [18,19,20,21,22,23,24]. Moreover, these impacts are ultimately passed to the stock markets of various countries. In early studies, it was reported that oil futures prices have an impact on oil company stock prices in the U.S. stock market [25]. Other studies suggest that international oil prices have different effects on the yields of the U.S. stock market during distinctive economic periods [26]. Moreover, studies have shown the existence of a long-run connection between real oil prices and stock prices of OECD countries. In the long run, the stock market index has reacted negatively to the rise in oil prices [27]. In recent years, researchers also found that there is a negative correlation between stock market yields and international oil prices in most European countries, and stock returns are mainly affected by the impact of crude oil supply [28]. However, contrary results have been found in the research on stock markets in Gulf Cooperation Council countries. The rise in oil prices has had a positive effect on the share prices in these countries as they are the major oil suppliers in the world’s energy market [29].
Existing research also reveals the impact of international crude oil prices on the renewable energy stock market due to a clear substitution effect between crude oil and renewable energy. Oil prices and technology stock prices are the Granger causes, which lead to the variations in stock prices of alternative energy companies [30]. More specifically, there is a positive relationship between oil prices and clean energy prices in the stock market for the period after 2007 [31]. Furthermore, there is a positive relationship between preceding movements in oil prices, stock prices of high-tech companies, as well as interest rates and the variations in renewable energy stocks due to the rise in oil prices and the substitution of alternative energy sources [32]. Alternatively, the volatility of the stock prices of renewable energy companies is also affected by the crude oil price fluctuations. In general, with a short position in the oil futures market, a long position of $1 in renewable energy firms can be hedged for 20 cents [15]. Research on systemic risk has also shown that the dynamics of oil prices significantly contribute to the downside and upside risk of clean energy enterprises by approximately 30% [33]. Renewable energy stock returns are rather sensitive to fluctuations in the crude oil volatility index. The index information can improve the accuracy of the volatility estimates for the renewable energy equity market [34].
As China’s reliance on foreign energy sources has led to an amplified impact on China’s economic performance, the study of the international crude oil prices has become progressively important. However, the literature on the relationship between the international oil prices and the stock prices of China’s renewable energy listed firms is relatively sparse. Existing research covering the relationship between international oil prices and China’s energy-related stock returns has shown that the financial crises have strengthened the effect of international crude oil prices on the valuation of energy-related stocks in China [35]. Other studies have also identified the volatility spillover effect from the international crude oil prices to the stock prices of China’s renewable energy industry [3,17,36,37,38]. Nevertheless, these studies used either the VAR or GARCH models by only considering the price spillover effect or exploring the relationship between the volatility in two markets. Also, these studies overlooked the analysis of market news and current affairs, which may also influence the relationships between oil prices and stock prices of China’s renewable companies. This paper contributes to the existing literature by applying the VAR model with innovation using the factor-GARCH process, which enables analysis of time-varying volatility and correlation between China’s renewable energy and international oil markets. Instead of using the classical approach, we utilized the Bayesian approach for model estimation with the computationally intensive Markov chain Monte Carlo (MCMC) algorithm. Based on the information criteria, the Bayesian VAR model with the factor-GARCH process performed better than another competitive constant conditional correlation (CCC) GARCH model [39]. The advantage of using the factor-GARCH model is that this model can solve the estimation problem due to the positive definiteness restrictions on the covariance matrix from multivariate ARCH and GARCH models, providing a parsimonious parameterization and a positive definite covariance matrix. Moreover, the correlation between China’s renewable energy and international oil returns is dynamic, indicating that the prices of renewable energy and oil prices may exhibit strong co-movement. Thus, the characteristics of these data can be well captured by this model.
3. Methodology
In order to study the impact of oil prices on renewable energy stock prices in China, the vector autoregressive (VAR) model with innovations using a factor- GARCH model [40] was used to capture time-varying volatility and correlation between oil and renewable stock markets. Instead of using the classical approach, a computationally intensive MCMC algorithm was adopted for model parameter estimation.
The VAR model is frequently used to capture the linear interdependencies among multiple time series in a system. VAR models generalize numerous univariate autoregressive models (AR) by allowing for more than one evolving variable. Each variable corresponds to an equation, which explains its evolution based on its own lagged values, the lagged values of the other model variables, and an error term. A VAR model defines the evolution of a set of k variables (namely endogenous variables) over the same sample period ( as a linear function of only their past values. The variables are presented in a matrix of . A pth order VAR, which can be also denoted as , is
where the observation is called the pth lag of , which is distributed as a multivariate normal distribution, is a k-vector of constants, is a time-invariant () matrix, and is a k-vector of error terms.
As the volatility of financial time series appears to change over time, an innovation of the VAR in Equation (1) is to adopt the factor-GARCH model to estimate [40] and this is given by
where is a () vector of constants; is a () factor parameter matrix, which controls the covariances between two markets; is the information set up to time ; is a () vector of factor with elements with ; and is a () diagonal variance–covariance matrix. is given by with
where is the variance of the at time , , , and with . In this case, the are GARCH(1,1) processes. When estimating the factor-GARCH model, dynamic behavior of the parameters, such as covariances and correlations, are required to be estimated. Thus, it is convenient to impose the restriction on the GARCH process, where we assume and in Equation (4).
This model assumes that the vector in Equation (3) follows a conditional multivariate normal distribution. This implies that in the vector that Here
where is a () lower triangular matrix with elements for and for and . In order to decrease the number of parameters in the model, a natural restriction is assumed by for . Here, can be written as
A Bayesian approach was used to estimate the model parameters for the VAR model with innovation using the factor-GARCH process. MCMC methods are used to obtain draws from the posterior distribution required for analysis. For the full-factor multivariate GARCH model in Equations (2) and (3), the log-likelihood function is given by
where , , and . In order to avoid these positivity restrictions, we transformed the positive parameters using the logarithmic transformation, , and .
The VAR model with the factor-GARCH process is estimated by using a numerical optimization algorithm such as a scoring algorithm. Following [40], we computed the maximum likelihood estimates using the Fisher scoring algorithm. The iteration of the algorithm takes the form
where is the estimate of the parameter vector obtained after iterations, is the log-likelihood function, is the expected information matrix computed at , and is the gradient computed at
To estimate the VAR model with the factor-GARCH process, we divided the estimated parameter vector into three blocks. We assumed the first block contained the parameters of the mean equation, that is ; the second block contained the transformed parameters of the variance equation, that is, and the third block contained the parameters in matrix , that is, . The expected information matrix is block diagonal and the three diagonal blocks are estimated by , , and . The first differentiation with respect to the mean parameters is
and the expected information matrix for the mean parameters is given by
where
The first differentiation with respect to the variance parameters is
and the expected information matrix for the variance parameters is given by
where
and the vector is followed as ,,…,.
The first differentiation with respect to the parameters in matrix and with respect to is
and the expected information matrix for the parameters in matrix is given by
4. Results
4.1. Data
To analyze the impact of oil price on renewable stock index, the daily international oil prices (i.e., London Brent crude oil future) were compiled from the Bloomberg database and the renewable energy price index (i.e., the CNI new energy index) from May 16, 2014 to December 31, 2018 was collected from Shenzhen Securities Information Company Limited (SSIC). The selected sample contained a total of 1206 observations. London Brent crude oil future prices are frequently used as an indicator of international oil prices [41].
To analyze the descriptive statistics of oil and renewable energy prices [42], the daily percentage returns for and at time t are calculated as
where and are renewable energy and oil prices at time t, respectively.
4.2. Descriptive Statistics
The descriptive statistics for renewable energy and oil markets are reported in Table 1. The table shows that the average return of China’s renewable sector was 0.015%, while the average return for the oil sector was −0.059%, from 2014 to 2018. In terms of standard deviation, the standard deviation of China’s renewable sector was 1.934, which was marginally lower than that for the oil sector, 2.207, indicating that the oil market exhibited higher risks. As for the third and fourth-order moments, skewness of the energy market was −1.113 and less than 0, indicating that the distribution was negatively skewed, while the distribution of the oil market was skewed to the right. Both markets had high kurtosis that was greater than three (normal distribution), indicating the distribution of the two markets was leptokurtic.

Table 1.
Descriptive statistics of the daily return rates for energy and oil.
4.3. Results of Market Comovements between International Oil and China’s Renewable Energy Markets
In order to inspect the cross-market relationship between oil and renewable markets, the VAR model was used to control for market fundamentals such as cross-market relationships that always exist. The VAR model is
where is a two-dimensional random vector containing the renewable and oil returns data, and lag 1 was selected based on the criteria of the FPE, AIC, and HQ, which are shown in Table 2.

Table 2.
Performance of VAR lag order selection criteria.
The bivariate VAR model with lag one was used to examine the market relationship between oil and the renewable sector. The results are shown in Table 3. According to the results estimated by the VAR (1) model, the average return of the renewable market was 0.017%. In addition, when the renewable returns rose by 1% in the previous period, the energy returns in the current period would be expected to rise by 0.068%, holding everything else equal alternatively, when the oil returns in the previous period rose by 1%, China’s renewable returns in the current period would be expected to rise by 0.056%. The results also suggest a significant positive relationship between the oil and renewable markets. Thus, we concluded that the international oil market has a significant positive relationship with China’s renewable market.

Table 3.
The results of the VAR model.
In terms of the international oil market, the average return on the international oil market was −0.063%. Moreover, for every 1% increase in returns of China’s renewable market in the previous period, international oil market returns will fall by 0.030% in the current period. For every 1% increase in returns of the international oil market in the previous period, the returns of the international oil market will drop by 0.075% in the current period.
4.4. Evidence of Granger Causality between International Oil and China Renewable Markets
The Granger causality test was applied to examine whether the international oil market is useful in forecasting China’s renewable market or the other way around. Table 4 shows the results of Granger causality between international oil and China’s renewable markets. The results suggest that the international oil market is useful in forecasting China’s renewable market at 5% significance level. Considering the results shown in Table 3, it is indicated that there is a positive relationship between oil prices and renewable prices in the stock market in China. This result confirms the substitution effect between oil and renewable energy and is in line with previous findings such as [31]. However, China’s energy market does not provide significant evidence in terms of forecasting the international oil market at 5% significance level.

Table 4.
Results of Granger causality test between international oil and China’s renewable markets.
The impulse responses were analyzed to explore the impact of short-term fluctuation shocks between the two variables. This paper also studied the impulse responses function (IRF) between international oil and China’s renewable markets and the results are shown in Figure 3. The solid line is the reaction of an endogenous variable after receiving shocks from other variables in the system, while the dotted lines on both sides represent the reaction with plus and minus double standard deviations, respectively. The results show that the international oil shock has a negative effect on China’s renewable market in the short term. Meanwhile China’s renewable shock has a positive effect on the international oil market in the short term.
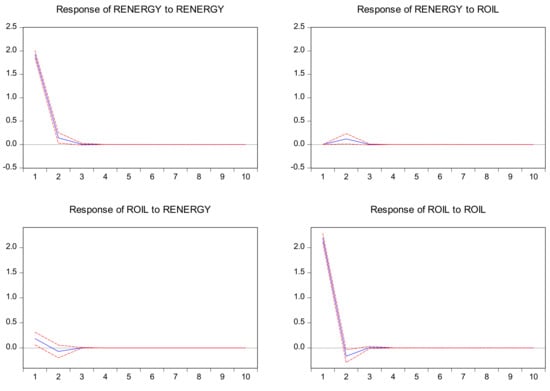
Figure 3.
Impulse responses in bivariate VAR model. Note: The solid line refers to impulse response functions, and dotted lines refer to the response to Cholesky one SD innovations ±2 standard deviations of IRF.
4.5. Evidence of Market Risk
The VAR model with innovation using the factor-GARCH process described in Section 4.2 was applied to estimate the market risk. As the model is estimated based on a Bayesian approach, prior parameters in Equations (2) to (3) were assumed to be known and were set to be , , and . Following [43], the Gibbs sampling was applied to estimate the VAR model with the factor-GARCH process. The first 20,000 draws were discarded to allow the Markov chain to converge to the stationary distribution. In order to reduce sample autocorrelation and avoid biased Monte Carlo standard errors, every 10 draws for the next 200,000 iterations were documented for a total of 20,000 draws used for the posterior summaries. Table 5 presents the estimates (posterior means) of the VAR model with the innovation using the factor-GARCH process. The results show that the mean of unexpected shocks for China’s renewable sector was 0.003%, while the international oil market was −0.066% during the period of 2014 to 2018. In terms of measuring the market risk, the average variance of unexpected shocks for international oil was higher than that for China’s renewable market, signifying that international oil market had a higher risk than China’s renewable market during the period of 2014 to 2018. The average market covariance between China’s renewable market and the international oil market was 0.074 during the period of 2014 to 2018.

Table 5.
Posterior means of the innovation of the VAR model for the mean and covariance for China’s renewable and international oil market.
In order to measure market risk for international oil and China’s renewable markets, the estimation of the VAR model with the Factor-GARCH process was used to plot the time-varying volatility for two markets. To exemplify the market risk, the daily prices of the two markets were analyzed, results of which are shown in Figure 4. The figure illustrates that international oil prices fell sharply from 2014 to 2015, but they rebounded since 2016. China’s renewable market shows different patterns as it started to increase from 2014 to 2015 and the stock index stayed relatively stable during the period of 2016 to 2018. Figure 5 and Figure 6 show the time-varying volatility and returns in China’s renewable market and international oil market, respectively. These figures illustrate that both returns have presented significant fluctuations followed by large fluctuations and small fluctuations followed by small fluctuations, suggesting evidence of the volatility clustering effect. In particular, both series have two peaks between mid-2015 and the end of 2016, meaning that both markets suffered from high risks. However, from the beginning of 2017 to mid-2018, the market risks of both series were below 5, indicating that in this period, both markets were relatively stable with lower market risks.
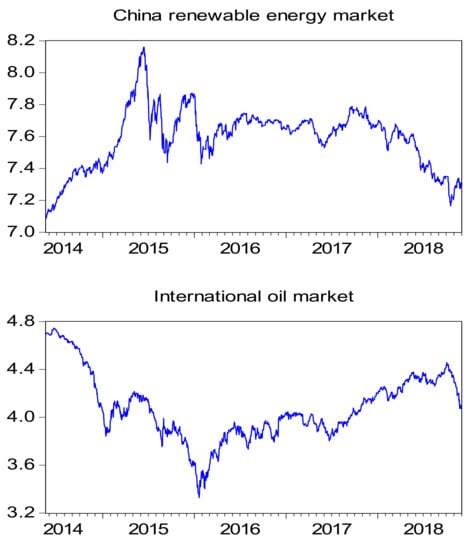
Figure 4.
Daily prices of international oil and China’s renewable markets during the period of 2014 to 2018.
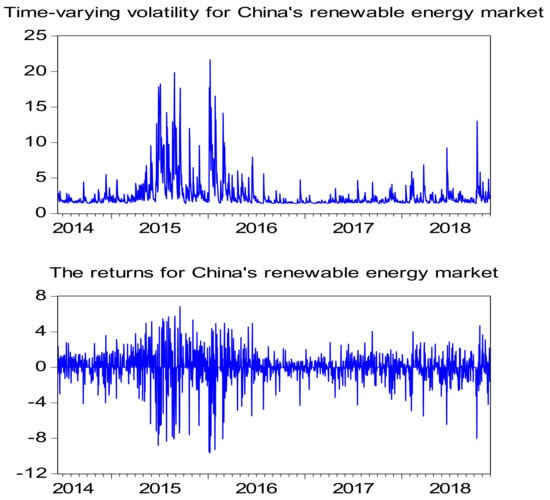
Figure 5.
Time-varying volatility and returns for the China’s renewable market during the period of 2014 to 2018.
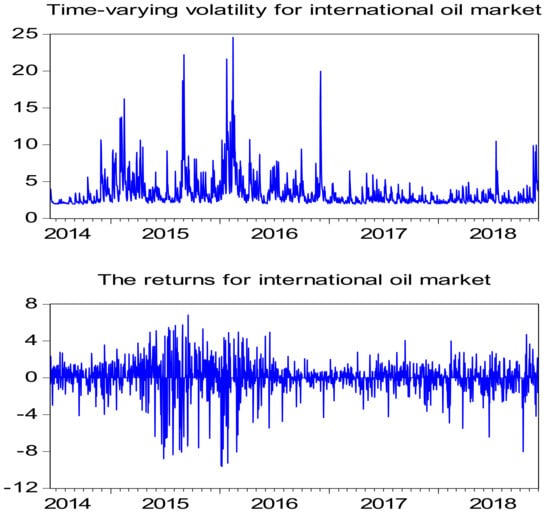
Figure 6.
Time-varying volatility and returns for international oil market during the period of 2014 to 2018.
Figure 7 shows the market correlation between China’s renewable and international oil markets during the period of 2014 to 2018. The figure illuminates that the market correlation between China’s renewable and international oil markets remained high during the period of 2015 to 2016. Overall, the returns for both international oil and China’s renewable markets exhibited the characteristics of time-varying, volatility clustering, and similar motility. They also had a similar trend. From this perspective, the international oil price volatility presents an impact on the stock price volatility of China’s renewable energy stock market. There is a transmission effect in the volatility of international crude oil and renewable energy stocks.
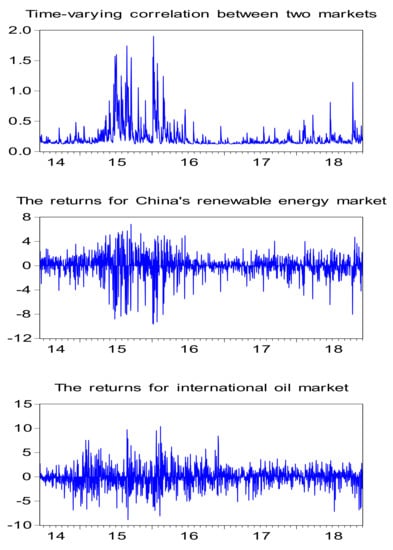
Figure 7.
Time-varying correlation and returns for China’s renewable and international oil markets during the period of 2014 to 2018.
In addition, as shown in Figure 5, the volatility of the yield of the renewable energy stock index peaked on July 15, 2015; September 2, 2015; and February 1, 2016, respectively. These dates corresponded to China’s renewable energy market integration, global stock market crash, and reduction in coal supply in China. This signifies that the volatility of China’s renewable energy stocks might be affected by other driving forces, including the domestic renewable energy market status, global stock market performance, global financial market performance, and traditional energy prices (e.g., coal prices). As shown in Figure 6, larger variances of the crude oil future yield occurred on February 16, 2015; September 2, 2015; February 15, 2016; and December 2, 2016. These dates corresponded to the OPEC oil production reduction, global stock market crash, Syrian crisis, and extension of the Iran Sanctions Act. Given the market correlation between the two markets, these events may also have had an impact on the renewable energy market through the contagion effect brought about by the oil prices. Thus, for both business and policy decisionmakers, oil supply and demand, global financial market turmoil, and international political events are worthy of consideration and they may become the focus of future research.
5. Conclusions
This paper studied the VAR model with the innovation using Factor-GARCH process in order to investigate the time-varying market volatility and correlation between the international oil market and China’s renewable energy market during the period of 2014 to 2018. The Factor-GARCH model represents a significant methodological departure from the existing CCC-GARCH model in the literature by demonstrating a more direct indication of evolution of the market co-movement, where the dynamics of correlation is time dependent. Our key findings are threefold. First, using a VAR model with Granger causality test, we found that the international oil market is useful in forecasting China’s renewable energy market. Moreover, in terms of impulse response function, international oil shock has a negative effect on China’s renewable energy market in the short run. Second, by modelling market risk, it also indicates that the fluctuations of international oil prices have an influence on the stock price fluctuations of Chinese renewable energy listed companies. Finally, the Factor-GARCH model was applied and results showed that the volatility of the yield of the renewable energy stock index peaked on July 15, 2015; September 2, 2015; and February 1, 2016, respectively. The dramatic change in volatility in China’s renewable energy stocks may be affected by other driving forces, including the domestic renewable energy market situation, global stock market performance, global financial market performance, and traditional energy prices. In addition, the correlation for both international oil and China’s renewable markets exhibited the characteristics of time-varying, volatility clustering, and similar motility.
Affected by factors such as transnational politics, global financial markets, and crude oil supply and demand, the international crude oil market is highly volatile. Therefore, the Chinese government pays special attention to the fluctuations of the international crude oil market. The administration may adopt appropriate subsidy measures for China’s renewable energy industry when necessary. This approach might alleviate the impact of the international crude oil market on China’s emerging industries. Moreover, renewable energy companies should also be concerned about their risks and take effective risk prevention measures. While paying attention to international oil prices, renewable energy firms may also consider the impact of the domestic stock market, global financial market, and prices of traditional energies on renewable industry. Confronted with various risks, enterprises need to adjust their development strategies in a timely manner and prepare for technology investment and reserves in the early stage in order to maintain long-term sustainable development. In addition, investors may focus on different investment-related information, including news and current affairs, international politics, and the Chinese and international financial market dynamics. When investing in relevant stocks for the renewable energy sector, considering the price spillover and fluctuation transmission effects, investors should pay attention to the uncertainties of the international oil price fluctuations on the renewable energy stocks. In addition, relevant renewable energy-related policies proposed by the state are also important.
Author Contributions
Data curation, W.L.; formal analysis, C.Y.-L.H. and W.L.; funding acquisition, X.W., N.S., and C.Y.-L.H.; methodology, C.Y.-L.H. and X.W; project administration, X.W. and N.S.; supervision, X.W.; visualization, W.L. and S.L.; writing—original draft, C.Y.-L.H., X.W., and G.Y.; writing—review and editing, X.W. and N.S.
Funding
This work was supported by the Macau Higher Education Fund, Macau Higher Education Bureau under the project of N.o 49/DCCT/DSES/2019, and the Macau University of Science and Technology under the projects FRG-19-007-MSB and FRG-19-008-MSB.
Acknowledgments
In this section you can acknowledge any support given which is not covered by the author contribution or funding sections. This may include administrative and technical support, or donations in kind (e.g., materials used for experiments).
Conflicts of Interest
The authors declare no conflicts of interest.
References
- Sawin, J. Renewable Energy Policy Network for the 21st Century Renewables 2017 Global Status Report; REN21 Secretariat: Paris, France, 2017; pp. 1–302. [Google Scholar]
- Murdock, H.E.; Gibb, D.; André, T.; Appavou, F.; Brown, A.; Epp, B.; Sawin, J.L. Renewables 2019 Global Status Report; REN21: Paris, France, 2019. [Google Scholar]
- Wang, C.; Chen, Y.; Jin, X. Research on the effect of international oil prices pass-through on China’s new energy market. J. Quant. Tech. Econ. 2018, 35, 131–146. (In Chinese) [Google Scholar]
- International Energy Agency. World Energy Outlook 2013; International Energy Agency: Paris, France, 2013. [Google Scholar]
- National People’s Congress (NPC) Standing Committee, China. Renewable Energy Law. Available online: http://www.gov.cn/ziliao/flfg/2005-06/21/content_8275.htm (accessed on 19 September 2019). (In Chinese)
- NDRC, China. Medium and Long-Term Development Plan for Renewable Energy. Available online: http://www.ndrc.gov.cn/zcfb/zcfbghwb/200709/W020140220601800225116.pdf (accessed on 19 September 2019). (In Chinese)
- NDRC, China. 13th FYP Development Plan for Energy. Available online: http://www.ndrc.gov.cn/zcfb/zcfbghwb/201701/W020170117350627940556.pdf (accessed on 19 September 2019). (In Chinese)
- NDRC, China. 13th FYP Development Plan for Renewable Energy. Available online: http://www.ndrc.gov.cn/zcfb/zcfbghwb/201612/W020161216661816762488.pdf (accessed on 19 September 2019). (In Chinese)
- NDRC, China. 13th Electricity Development Five-Year Plan. Available online: http://www.ndrc.gov.cn/zcfb/zcfbghwb/201612/P020161222570036010274.pdf (accessed on 19 September 2019). (In Chinese).
- Xia, L.; Li, Y. Analysis of the status quo and its causes of new energy industry financing. J. Chongqing Univ. Sci. Technol. 2011, 21, 68–69. (In Chinese) [Google Scholar]
- Ming, Z.; Ximei, L.; Yulong, L.; Lilin, P. Review of renewable energy investment and financing in China: Status, mode, issues and countermeasures. Renew. Sustain. Energy Rev. 2014, 31, 23–37. [Google Scholar] [CrossRef]
- Paramati, S.R.; Ummalla, M.; Apergis, N. The effect of foreign direct investment and stock market growth on clean energy use across a panel of emerging market economies. Energy Econ. 2016, 56, 29–41. [Google Scholar] [CrossRef]
- Paramati, S.R.; Apergis, N.; Ummalla, M. Financing clean energy projects through domestic and foreign capital: The role of political cooperation among the EU, the G20 and OECD countries. Energy Econ. 2017, 61, 62–71. [Google Scholar] [CrossRef]
- Kutan, A.M.; Paramati, S.R.; Ummalla, M.; Zakari, A. Financing renewable energy projects in major emerging market economies: Evidence in the perspective of sustainable economic development. Emerg. Mark. Financ. Trade 2018, 54, 1761–1777. [Google Scholar] [CrossRef]
- Sadorsky, P. Correlations and volatility spillovers between oil prices and the stock prices of clean energy and technology companies. Energy Econ. 2012, 34, 248–255. [Google Scholar] [CrossRef]
- Mathews, J.A.; Selden, M. China: The emergence of the Petroyuan and the challenge to US dollar hegemony. Asia Pac. J. Jpn. Focus 2018, 16, 22. [Google Scholar]
- Hu, Q.; Ding, M. Research on the volatility spillover effect of international crude oil price to China’s new energy industry stock price. Account. Financ. 2016, 3, 78–84. (In Chinese) [Google Scholar]
- Rasche, R.H.; Tatom, J.A. Energy Resources and Potential GNP; Federal Reserve Bank of St. Louis: St. Louis, MO, USA, 1977; pp. 10–24. [Google Scholar]
- Hamilton, J.D. Oil and the macroeconomy since World War II. J. Political Econ. 1983, 91, 228–248. [Google Scholar] [CrossRef]
- Hooker, M.A. What happened to the oil price-macroeconomy relationship? J. Monet. Econ. 1996, 38, 195–213. [Google Scholar] [CrossRef]
- Papapetrou, E. Oil price shocks, stock market, economic activity and employment in Greece. Energy Econ. 2001, 23, 511–532. [Google Scholar] [CrossRef]
- Brown, S.P.; Yücel, M.K. Energy prices and aggregate economic activity: An interpretative survey. Q. Rev. Econ. Financ. 2002, 42, 193–208. [Google Scholar] [CrossRef]
- Olomola, P.A.; Adejumo, A.V. Oil price shock and macroeconomic activities in Nigeria. Int. Res. J. Financ. Econ. 2006, 3, 28–34. [Google Scholar]
- Miller, J.I.; Ratti, R.A. Crude oil and stock markets: Stability, instability, and bubbles. Energy Econ. 2009, 31, 559–568. [Google Scholar] [CrossRef]
- Huang, R.D.; Masulis, R.W.; Stoll, H.R. Energy shocks and financial markets. J. Futures Mark. Futures Options Other Deriv. Prod. 1996, 16, 1–27. [Google Scholar] [CrossRef]
- Sadorsky, P. Oil price shocks and stock market activity. Energy Econ. 1999, 21, 449–469. [Google Scholar] [CrossRef]
- Cunado, J.; de Gracia, F.P. Oil price shocks and stock market returns: Evidence for some European countries. Energy Econ. 2014, 42, 365–377. [Google Scholar] [CrossRef]
- Arouri, M.E.H.; Rault, C. Oil prices and stock markets in GCC countries: Empirical evidence from panel analysis. Int. J. Financ. Econ. 2012, 17, 242–253. [Google Scholar] [CrossRef]
- Henriques, I.; Sadorsky, P. Oil prices and the stock prices of alternative energy companies. Energy Econ. 2008, 30, 998–1010. [Google Scholar] [CrossRef]
- Managi, S.; Okimoto, T. Does the price of oil interact with clean energy prices in the stock market? Jpn. World Econ. 2013, 27, 1–9. [Google Scholar] [CrossRef]
- Kumar, S.; Managi, S.; Matsuda, A. Stock prices of clean energy firms, oil and carbon markets: A vector autoregressive analysis. Energy Econ. 2012, 34, 215–226. [Google Scholar] [CrossRef]
- Reboredo, J.C. Is there dependence and systemic risk between oil and renewable energy stock prices? Energy Econ. 2015, 48, 32–45. [Google Scholar] [CrossRef]
- Dutta, A. Oil price uncertainty and clean energy stock returns: New evidence from crude oil volatility index. J. Clean. Prod. 2017, 164, 1157–1166. [Google Scholar] [CrossRef]
- Broadstock, D.C.; Cao, H.; Zhang, D. Oil shocks and their impact on energy-related stocks in China. Energy Econ. 2012, 34, 1888–1895. [Google Scholar] [CrossRef]
- Wang, H.; Ma, X. Research on the impact of international oil price on China’s new energy and high-tech markets. Mod. Bus. 2018, 33, 20–23. (In Chinese) [Google Scholar]
- Wen, X.; Wei, Y.; Huang, D. Volatility spillover and correlations between stock prices of Chinese new energy companies and crude oil prices. Manag. Rev. 2012, 24, 20–30. (In Chinese) [Google Scholar]
- Huang, Z.; Ye, Y.; Huang, G. Research on international crude oil price and China’s new energy stock price fluctuation. Bus. Econ. 2019, 3, 156–158. (In Chinese) [Google Scholar]
- Bollerslev, T. Modelling the coherence in short-run nominal exchange rates: A multivariate generalized arch model. Rev. Econ. Stat. 1990, 72, 498–505. [Google Scholar] [CrossRef]
- Vrontos, I.D.; Dellaportas, P.; Politis, D.N. A full-factor Factor multivariate GARCH model. Econom. J. 2003, 6, 311–333. [Google Scholar] [CrossRef]
- Lin, S.; Tamvakis, M. Effects of NYMEX trading on IPE Brent crude futures markets: A duration analysis. Energy Policy 2004, 32, 77–82. [Google Scholar] [CrossRef]
- Fry-McKibbin, R.; Hsiao, C.Y.; Martin, V.L. Joint tests of contagion with applications. Quant. Financ. 2019, 19, 473–490. [Google Scholar] [CrossRef]
- SSIC, China. An Introduction to the CNI New Energy Index. Available online: http://www.cnindex.com.cn/zstx/jcxl/ztzs/201405/t20140515_5934.htm (accessed on 19 September 2019). (In Chinese).
- Engle, R.F.; Sheppard, K. Theoretical and Empirical Properties of Dynamic Conditional Correlation Multivariate GARCH; Discussion Paper; University of California: San Diego, CA, USA, 2001. [Google Scholar]
© 2019 by the authors. Licensee MDPI, Basel, Switzerland. This article is an open access article distributed under the terms and conditions of the Creative Commons Attribution (CC BY) license (http://creativecommons.org/licenses/by/4.0/).