1. Introduction
Universal access to energy is one of the main challenges of our time. There are approximately 840 million people without access to electricity [
1], most of them located in rural areas of Sub-Saharan Africa. Electricity access is a crucial enabling factor for human development, and the seventh United Nations Sustainable Development Goal for 2030 acknowledge its relevance. Substantial progress is necessary to meet this target [
2].
Making progress in the electrification of developing countries requires the combined efforts of financial, technological, regulatory, sociological, and political-economic factors in this complex problem [
3]. A sound electrification plan must start with a quantitative assessment of needs and the adequate combination of suitable alternatives. The primary purpose of an electrification plan is twofold: It must establish the least-cost electrification mode for the region that meets some minimum standards of service, i.e., which zones in the least-cost electrification solution consists of extending the grid and, conversely, in which areas should mini-grids or standalone systems be built. On the other hand, any electrification plan should provide a reasonable approximation to the overall cost, the necessary bill of materials, and cost-comparisons with alternative electrification solutions and sensitivity analyses to help the planner in the decision-making process.
A comprehensive rural electrification plan needs to be data-driven to achieve the two objectives of electrification planning. Accurate data are indispensable, although there is generally a scarcity of reliable data in the context of developing countries [
4]. For instance, it is usually hard to obtain the demand profiles of consumers. Overestimating their demand could lead to unnecessary extra investment costs, whereas underestimating it would be translated into weaker reliability levels. It is also clear that considering a high level of spatial and temporal granularity leads to better results [
5], although it comes at the expense of a more substantial effort when processing the data and performing the analysis.
Computer software models have been used to support the complex decisions that a comprehensive electrification plan entails [
6]. The calculation of generation designs for off-grid systems is one of such decisions, and accurate solutions are critical for the soundness of the electrification plan. However, most regional planning models calculate the generation capacity for off-grid systems with methods that lack modelling accuracy.
Network Planner [
7] calculates its generation designs with analytical expressions based on rules of thumb. The Open Source Spatial Electrification Tool (OnSSET) [
8,
9] uses analytical expressions to obtain the levelized cost of electricity (LCOE) of off-grid systems. These methods provide valuable first-pass information, but they lack the level of detail required for implementation. For example, they do not model the operation of the system, which is critical in mini-grids [
10]. By doing so, they do not consider the impact of seasonality in renewable energy generation, which could be translated into periods where a significant amount of the demand is not supplied.
On the other hand, the optimization of generation designs is a widely-studied problem from the perspective of an individual off-grid system [
11,
12]. Some of the methods are based on classical optimization techniques such as Mixed-Integer Programming (MIP) [
13], whereas others apply heuristic algorithms [
14], metaheuristic techniques [
15,
16,
17,
18], or artificial intelligence methods [
19]. Most methods minimize the cost of the system, although some methods include other criteria such as minimizing carbon emissions [
20].
Several software tools optimize the generation design of a single off-grid system [
21], with the Hybrid Optimization of Multiple Electric Renewables (HOMER) being the most widely used. HOMER has been thoroughly applied both in developed [
22] and developing countries [
23,
24,
25,
26]. Other relevant tools are the Distributed Energy Resources Customer Adoption Model (DER-CAM) [
27] and the improved Hybrid Optimization by Genetic Algorithms (iHOGA) [
28].
Although some of these methods and tools are based on sophisticated optimization techniques and detailed models, they are not directly applicable to regional planning. It could be necessary to optimize the generation designs of potentially thousands of mini-grids in large-scale planning, and applying a computationally intensive approach for each design is not feasible. Moreover, single-system methods assume that the best solution is an individual mini-grid that electrifies all the consumers of the village or settlement, whereas in regional planning the number of off-grid systems and which consumers are assigned to each off-grid system need to be determined.
This paper describes a method that optimizes the generation designs of off-grid systems, combining a high level of modelling detail (similar to single-village tools) with the massive electrification scope of regional planning tools (which calculate a significant amount of generation designs).
This method is currently implemented in the Reference Electrification Model (REM), developed by the MIT/Comillas Universal Energy Access Lab. The model provides the least-cost electrification solution for a region, including detailed generation designs for off-grid systems and network designs for all mini-grids and grid extensions. REM optimizes generation designs, applying the optimization method described in this paper, and calculates the network layouts by considering electric constraints and the topographic features of the region. REM has already been used in the preparation of master electrification plans in several countries such as Indonesia, Rwanda, and Uganda [
29].
REM works at a high-resolution level, both in geographical (individual buildings) and temporal (hourly) terms. The main feature of REM is its high level of modelling detail, although this comes at the expense of high computation times and the need for extensive input data. Most regional planning tools operate with a lower level of modelling detail, although they provide fast estimations and make use of Geographical Information Systems (GIS) to provide instant access to input databases.
Reference [
30] introduces an early version of REM, and several improvements are presented in [
31]. Reference [
32] describes the current state of REM, and reference [
33] applies REM to study the importance of demand in planning. This paper presents the novel approach to optimize generation designs that was developed for REM. Specifically, the paper discusses the potential problems caused by modelling all the mini-grid components with discrete variables and introduces two methods to overcome such problems.
The rest of this paper is structured as follows.
Section 2 describes the rural electrification problem in more detail and provides some context for our method.
Section 3 describes our algorithm for generation sizing and compares it to a straightforward approach. Results and conclusions are provided in
Section 4 and
Section 5, respectively.
2. The Role of Generation Designs in REM
This section provides a context for generation sizing in the rural electrification problem as implemented in REM, which is described in detail in reference [
32].
The starting data for regional rural electrification planning include the location and demand of consumers, the location, energy cost, and reliability of the existing power grid as well as the network and generation catalogues and some techno-economic parameters such as discount rates and hourly solar irradiance.
REM works at the level of individual buildings, so it needs to group the consumers into mini-grids. Large mini-grids benefit from economies of scale in generation equipment, but they have higher network costs. It is crucial to ponder the trade-offs between generation and network costs when grouping the consumers into mini-grids.
Figure 1 shows the projection onto Google Earth Pro of two groupings of consumers into mini-grids. The minimum-cost grouping depends on the trade-off between the generation cost and the network cost.
REM groups the consumers into mini-grids (this will be referred to as off-grid clustering) in a process that starts with every consumer being an isolated cluster, and then joined with nearby clusters when it results in a lower cost. Specifically, the model calculates the cost of the two configurations below (see
Figure 2).
In configuration 1, the nearby clusters are electrified with separated off-grid systems, with each system having an independent generation site. In configuration 2, the nearby clusters are electrified together with the same mini-grid, locating the shared generation site in the cluster with higher peak demand. Hence, it is necessary to obtain the generation and network costs of three off-grid systems (two separated systems in configuration 1, and the larger mini-grid in configuration 2) each time REM performs a cost-comparison.
The most straightforward approach to calculate the generation costs needed in the off-grid clustering would be to optimize from scratch the generation designs of the off-grid systems that appear in configurations 1 and 2 each time REM performs a cost comparison. However, the number of cost comparisons in a regional planning case is unmanageably large, and this strategy would require an unaffordable computation time. Instead, REM balances accuracy with computation speed by calculating generation designs de novo for only a reduced subset of mini-grids (look-up table), which should be representative of the case study. The generation cost for the remaining mini-grids, if needed in the off-grid clustering, is approximated using multi-linear interpolation or extrapolation.
Each type of load is assigned a demand profile to develop this procedure. This allows expressing each mini-grid as a combination of its types of loads, and the representative mini-grids are the vertices of a rectangular mesh where the interpolation and extrapolation procedures are performed.
Figure 3 shows an example with three types of loads, where the representative mini-grids are obtained as combinations of 0, 300, 700, and 1000 residential consumers, 0, 1, 5, and 10 hospitals, and 0, 1, 5, and 10 schools. REM would calculate generation designs for 4 × 4 x 4 = 64 representative off-grid systems, which correspond to the points in the figure.
A drawback of this approach is that the number of representative mini-grids increases significantly with the number of load types as each load type is associated with an axis of the look-up table, which limits the types of loads that can be included in a case study. A different source of computational problems derives from modelling the capacities of all generation components with discrete variables, as discussed in
Section 3.
3. Efficient Generation Sizing for a Given Mini-grid
The problem of optimizing the generation design of a single mini-grid has been thoroughly studied in the literature [
12] and available software tools [
21]. One of the procedures used to deal with this problem consists of the application of classical optimization modelling techniques such as mixed-integer linear programming [
34]. However, these methods are computationally intense, and may require substantial resources to optimize a significant number of generation designs (which is usually the case when REM’s look-up table has several dimensions). Moreover, a planner would expect that generation designs that meet similar aggregated demands are similar in terms of generation elements and capacities, but the operation of mini-grids is non-linear, which implies that solutions obtained with an optimization method may fail to capture this property. This condition is relevant regarding project implementation, as it would not be reasonable, for example, to perform substantial changes repeatedly in the generation design of a village as demand grows (such as adding a diesel generator when the demand grows slightly only to remove it again when demand grows past a certain point).
REM applies a direct-search method to size the generation of the representative off-grid systems, yielding solutions that are more stable when concerned with demand variations. It also presents a reasonable balance between the accuracy of the design and computation time. The rest of this section introduces a method that calculates the generation design for each representative mini-grid of the look-up table, modelling all the generation components as discrete elements. Then, the potential issues of this approach are discussed, and solutions are proposed to overcome them.
3.1. A Master-Slave Decomposition
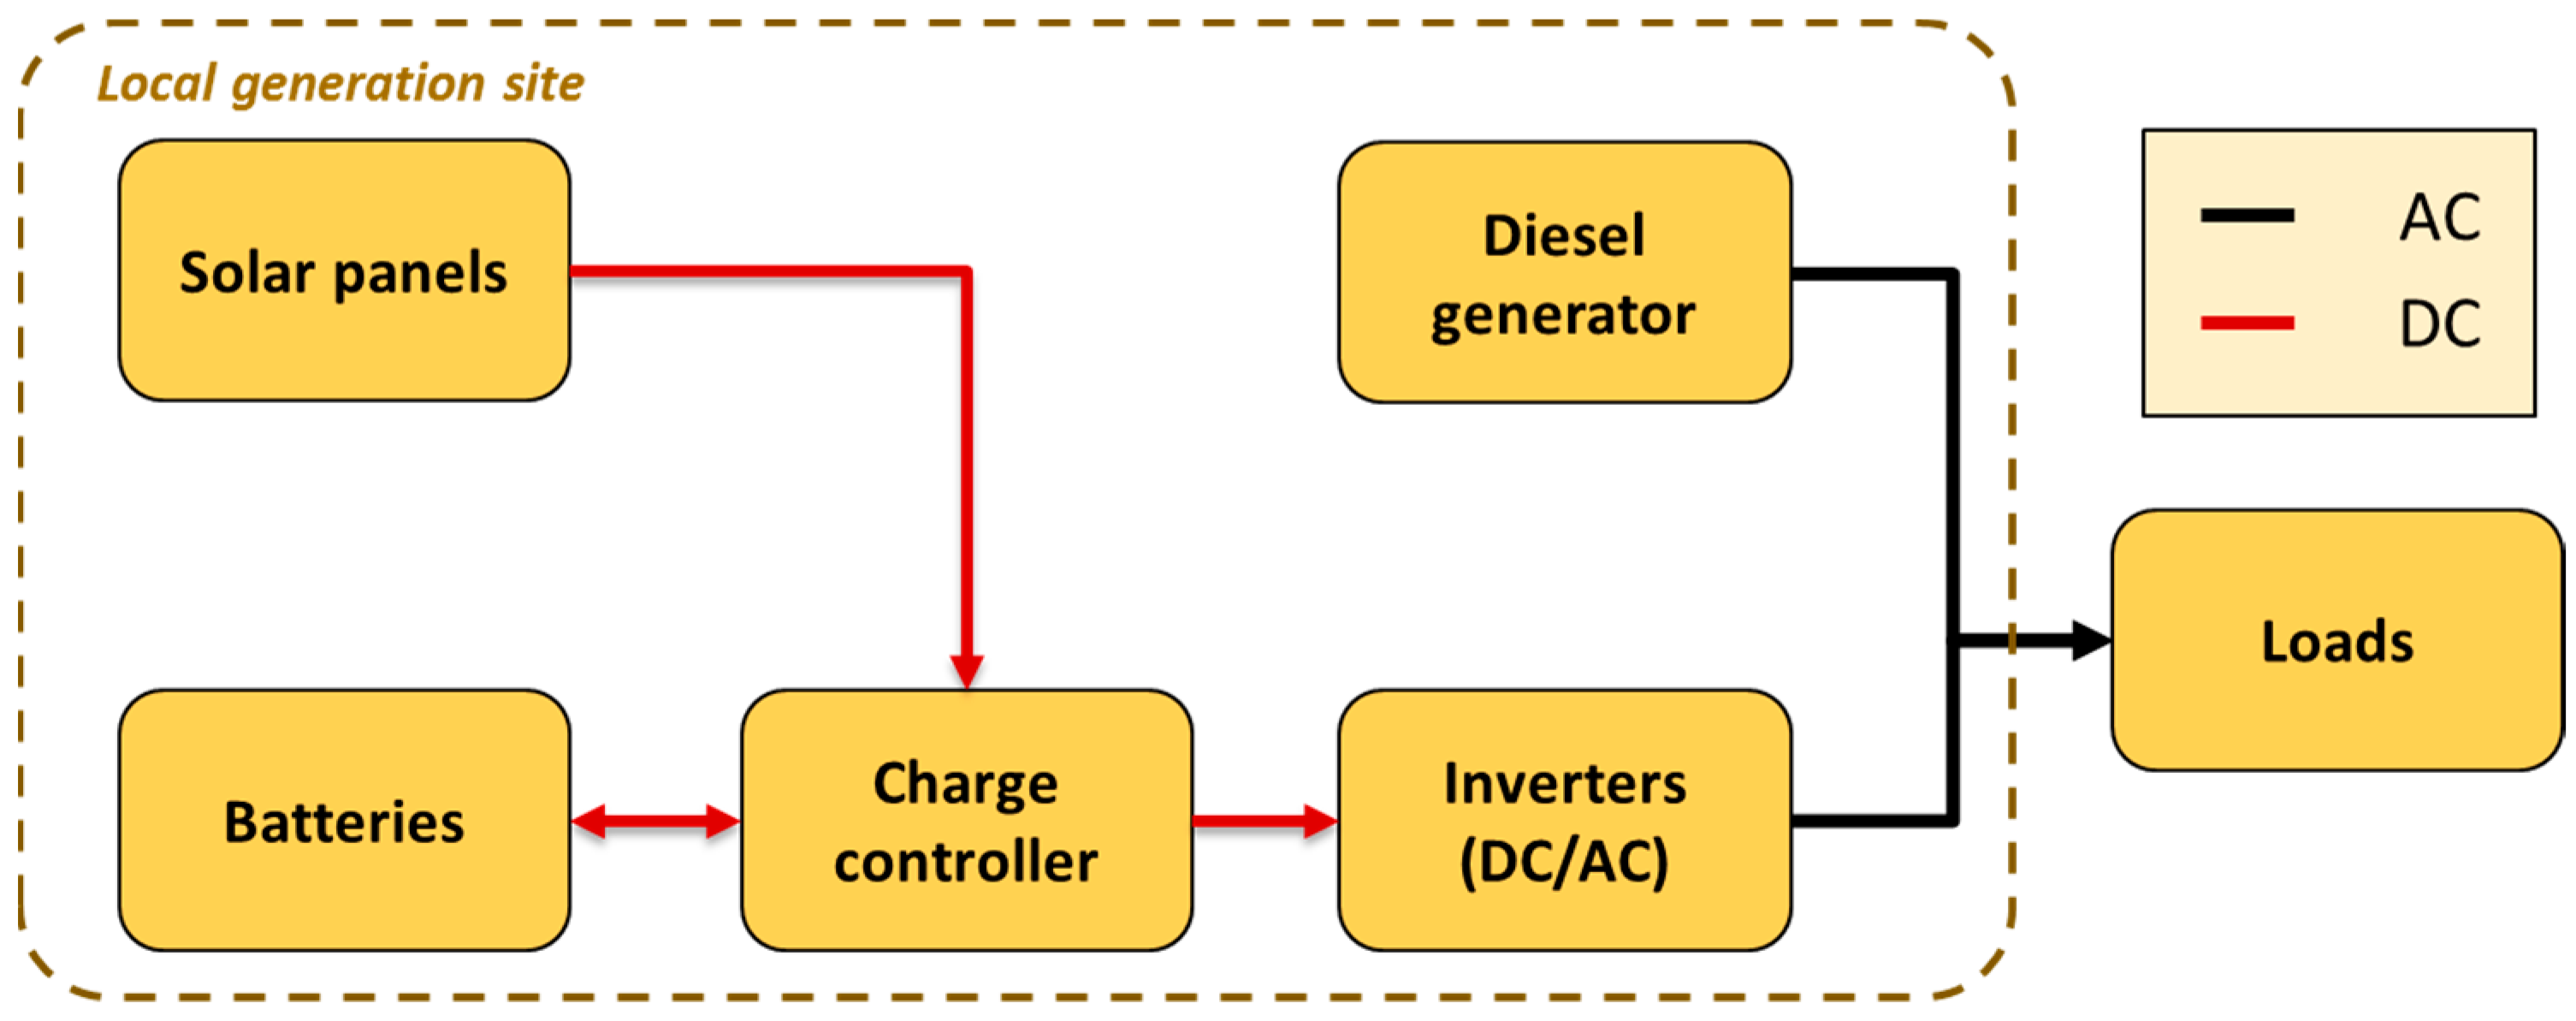
Figure 4 shows the architecture that REM considers for off-grid systems. Note that only solar energy is currently used as a renewable source, but other sources such as wind, mini-hydro, and biomass are under analysis, and they could be integrated similarly in the optimization process.
The algorithm presented in this section considers a tridimensional search space where each axis corresponds to one off-grid technology (solar, diesel, and battery storage), optimizing their respective capacities. The charge controller and the inverter that better suit the design, if needed, are selected afterwards.
There is a significant difference between the diesel generator and the other two off-grid technologies (solar panels and battery). It is possible to combine solar panels on one side and batteries on the other in parallel racks to provide (approximately) any desired capacity. The use of diesel generators in parallel, however, involves a much higher degree of complexity regarding installation and operation, so REM does not allow this possibility.
Therefore, the capacities of solar panels and batteries take values that are multiples of a small solar panel or battery, whereas the available capacities of the diesel generator are limited to the ones provided by the user. REM handles this difference among the off-grid technologies with a master-slave decomposition where the master level controls the diesel capacity, and the slave level explores a solar-battery plane with a fixed diesel capacity, from an adequate starting search point provided by the master level. The strategy of exploiting the structure of an optimization problem with a nested decomposition has been successfully applied to other problems in the literature [
35,
36].
The basic algorithm starts with a 100% renewable solution (no diesel), and the slave problem finds the least-cost design in the no-diesel plane. Then, the master problem increases the diesel capacity to the next diesel generator available on the catalogue, and the slave problem finds the combination of solar and battery that better fits the demand for that diesel generator. This procedure continues until the master problem has considered all diesel generators available in the diesel search space, which includes all diesel generators between the no-diesel solution and the smallest diesel generator that can meet all the demand. The starting search point in terms of solar and battery capacity is the best solution obtained at the previous iteration (for the previous diesel generator).
Figure 5 provides an example with diesel generators of 0, 5, 8, 10, and 15 kW.
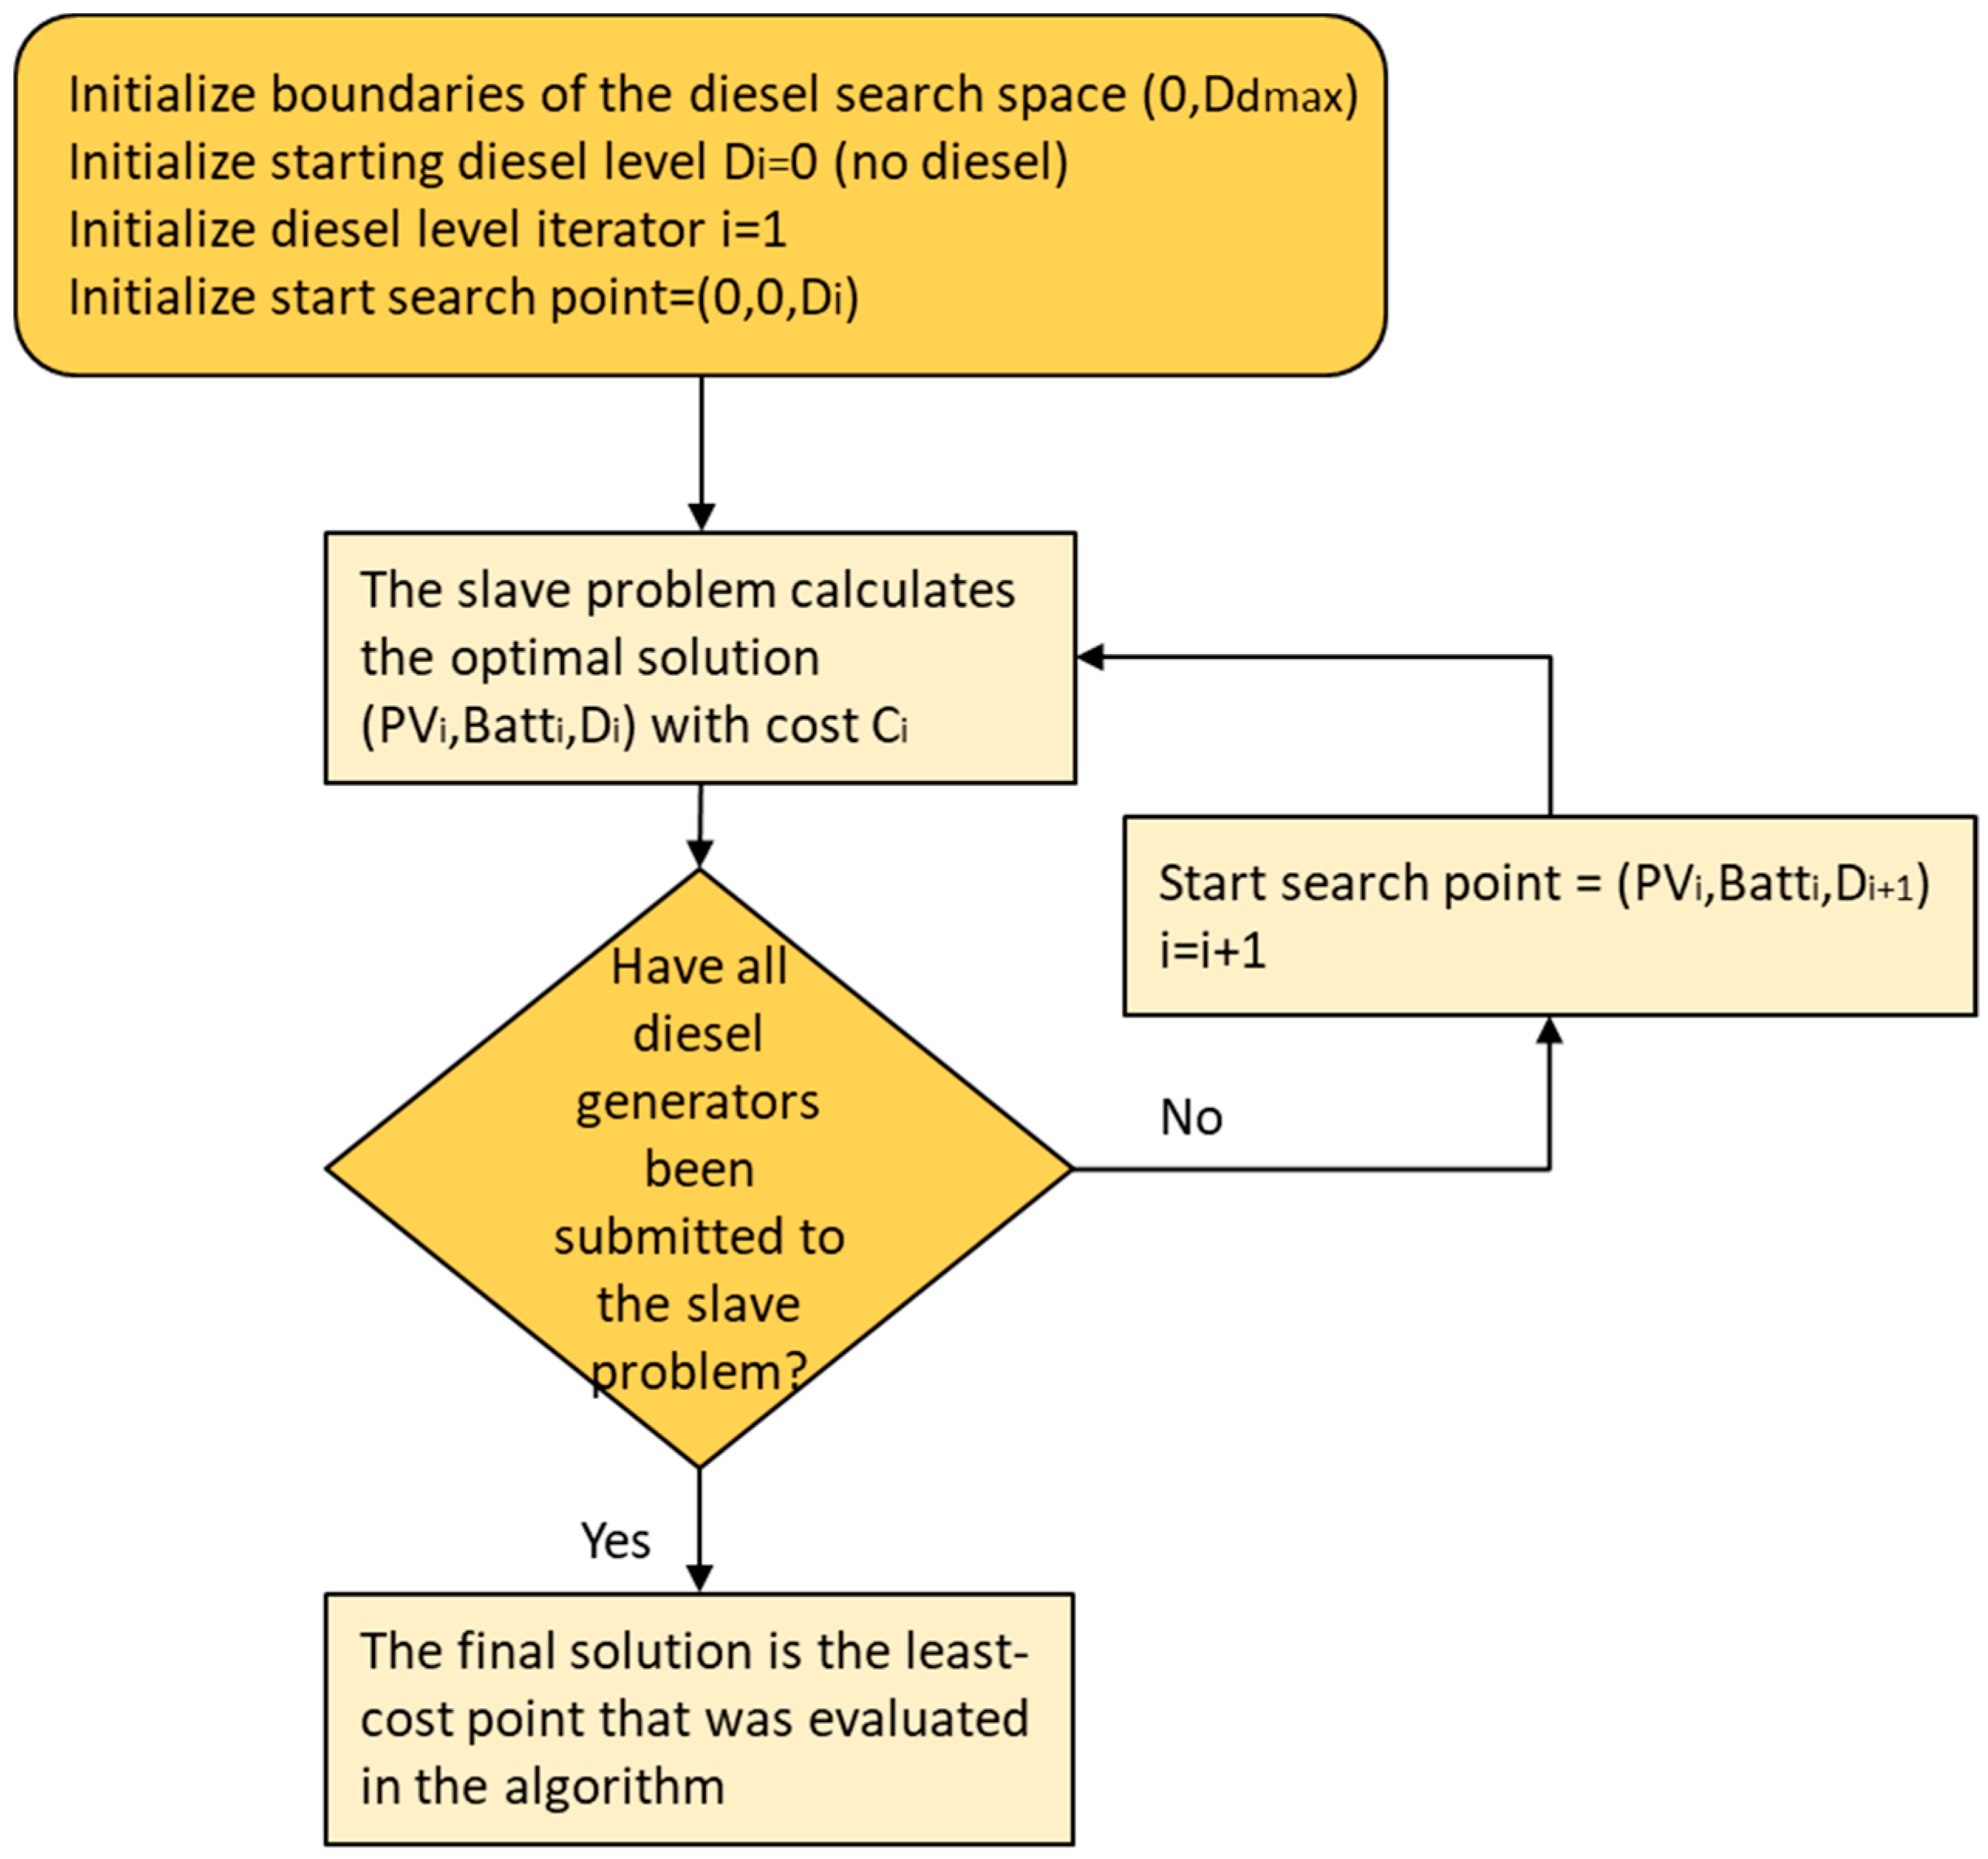
Figure 6 shows the flow diagram of the master problem. The master problem performs an exhaustive search as it goes through all the available diesel generators in the diesel search space, which may consume a significant amount of time.
The slave problem searches in the neighborhood of an initial point provided by the master problem, moving towards the point with minimum cost. If no neighboring point improves the current solution, the algorithm reduces the step size until its value is below a pre-specified threshold.
Figure 7 shows an example of the slave problem, which corresponds to the first iterations for the no-diesel plane shown in
Figure 5.
Figure 8 shows the flow diagram of the slave problem. The slave problem, in practice, behaves as a gradient-descent method with discrete derivatives since it always moves in the lowest-cost direction.
There is another level of embedded optimization in the process since, for each generation mix (size of diesel, solar panels, and batteries), the “best” possible dispatch is found. REM allows the use of alternative dispatch strategies, each one with different trade-offs concerning prediction ability, control strategy, or technical constraints. This is an interesting aspect of REM, but not the subject of this paper. In the cases presented in this paper, REM applies a load-following dispatch strategy [
37] when computing the total cost of a generation design. In the load-following strategy, the order of components used to meet demand is solar panels, batteries, and the diesel generator (in that order). If there is enough solar power to meet all the demand at a specific hour, then the remaining solar energy is used to charge the battery (if possible) in that hour. The diesel generator is not used to charge the battery in the load-following dispatch strategy. REM simulates the hourly operation of the system for the whole year for each candidate generation design following this strategy, which allows the model to deal with photovoltaic seasonalities. Since REM penalizes the non-served energy, the optimal generation design should use either batteries or a diesel generator to ensure that there is not a significant drop in the amount of demand served in periods of lower solar production.
3.2. A First Approach to Detailed Regional Planning
When operating at a high level of spatial granularity (consumer-by-consumer) in regional planning, it is necessary to group consumers into mini-grids. The best grouping of consumers depends on the trade-offs between the costs involved, the generation cost being one of them. If the estimations of the generation costs used to group consumers into mini-grids fail to capture the economies of scale in generation equipment, the resulting combination of consumers into mini-grids may be far from optimal.
We now provide an illustrative example with one load type (residential) that shows the limitations of the method presented in
Section 3.1 for regional planning. Any tool or method that aims at optimizing the generation design with discrete generation components, such as those that deal with a single mini-grid or village, would present the same limitations. The problems found, the solutions proposed, and the overall conclusions are fully applicable to cases with more types of loads, but they are not used here for the sake of simplicity.
There are two diesel generators available with capacities of 10 kW and 100 kW, and the representative mini-grids correspond to 1, 5, 10, 50, 100, 150, 200, 250, 300, and 500 residential consumers. Although the number of available diesel generators may seem low, it is realistic. The logistics of dealing with an extensive catalogue of diesel generators in a regional planning project complicates the implementation phase, and some planners prefer to limit the available diesel options, purchase specific generators in bulk, and benefit from volume discount pricing.
Figure 9 shows the minimum cost per consumer for these representative combinations of residential consumers, showing the partial optima obtained for the three diesel options (0, 10, and 100 kW) and the minimum cost curve (i.e., the minimum-cost design for each point).
This case illustrates the two main undesirable effects of having discrete diesel options. The first one is the instability of the generation mix concerning the demand. In this case, mini-grids with less than 50 consumers do not include a diesel generator and mini-grids with a range of consumers that lay between 50 and 100 consumers include a 10 kW diesel generator. However, mini-grids between 100 and 150 consumers do not include the diesel generator, because the 10 kW diesel generator is too small, while the 100 kW diesel generator is too big and expensive in this particular range of consumers. For mini-grids larger than 150 consumers, the generation solution includes the 100 kW diesel generator.
The second effect is that the unitary generation cost is not a monotonically decreasing function of the number of residential consumers, which is something expected due to the economies of scale in generation. This second effect causes issues in REM’s bottom-up clustering algorithm. When trying to join two clusters into a larger one, the algorithm considers the trade-off between the additional network cost and the generation savings (due to economies of scale). Hence, if the generation cost per consumer starts increasing at some point, the algorithm would not find the best solution. In the case shown in
Figure 9, the algorithm would stop at sizes of about 50 households, missing the economies of scale that happen beyond 150 households.
To overcome this difficulty, we can smooth the generation-cost curve by adjusting the coefficients of a family of curves that guarantee monotonic behavior, so that the generation cost per consumer always decreases when the number of consumers increases. Equation (1) defines this family of curves.
where x is the number of residential consumers; α, β, γ are non-negative parameters that REM adjusts, and P
α,β,γ(x) is the approximated unitary generation cost for x residential consumers. Each curve of the form P
α,β,γ(x) is a decreasing convex function. Note that the smooth curves must be replaced by smooth hypersurfaces in cases with more types of loads.
It is important to stress that the model uses the smooth curve only to determine the candidate mini-grids for a given case, and never to compute the final generation cost of the off-grid systems in the final electrification solution. REM always calculates the latter in an exact manner.
3.3. The Continuous-Component Implementation
Smoothing the cost values has some limitations. It may be difficult to smooth generation costs if we are working on a case with several types of loads. For example, it is debatable whether all types of loads should have equal importance when smoothing their generation costs. Residential loads are more frequent, but productive loads have a substantial impact on the final electrification solution.
It can be concluded from
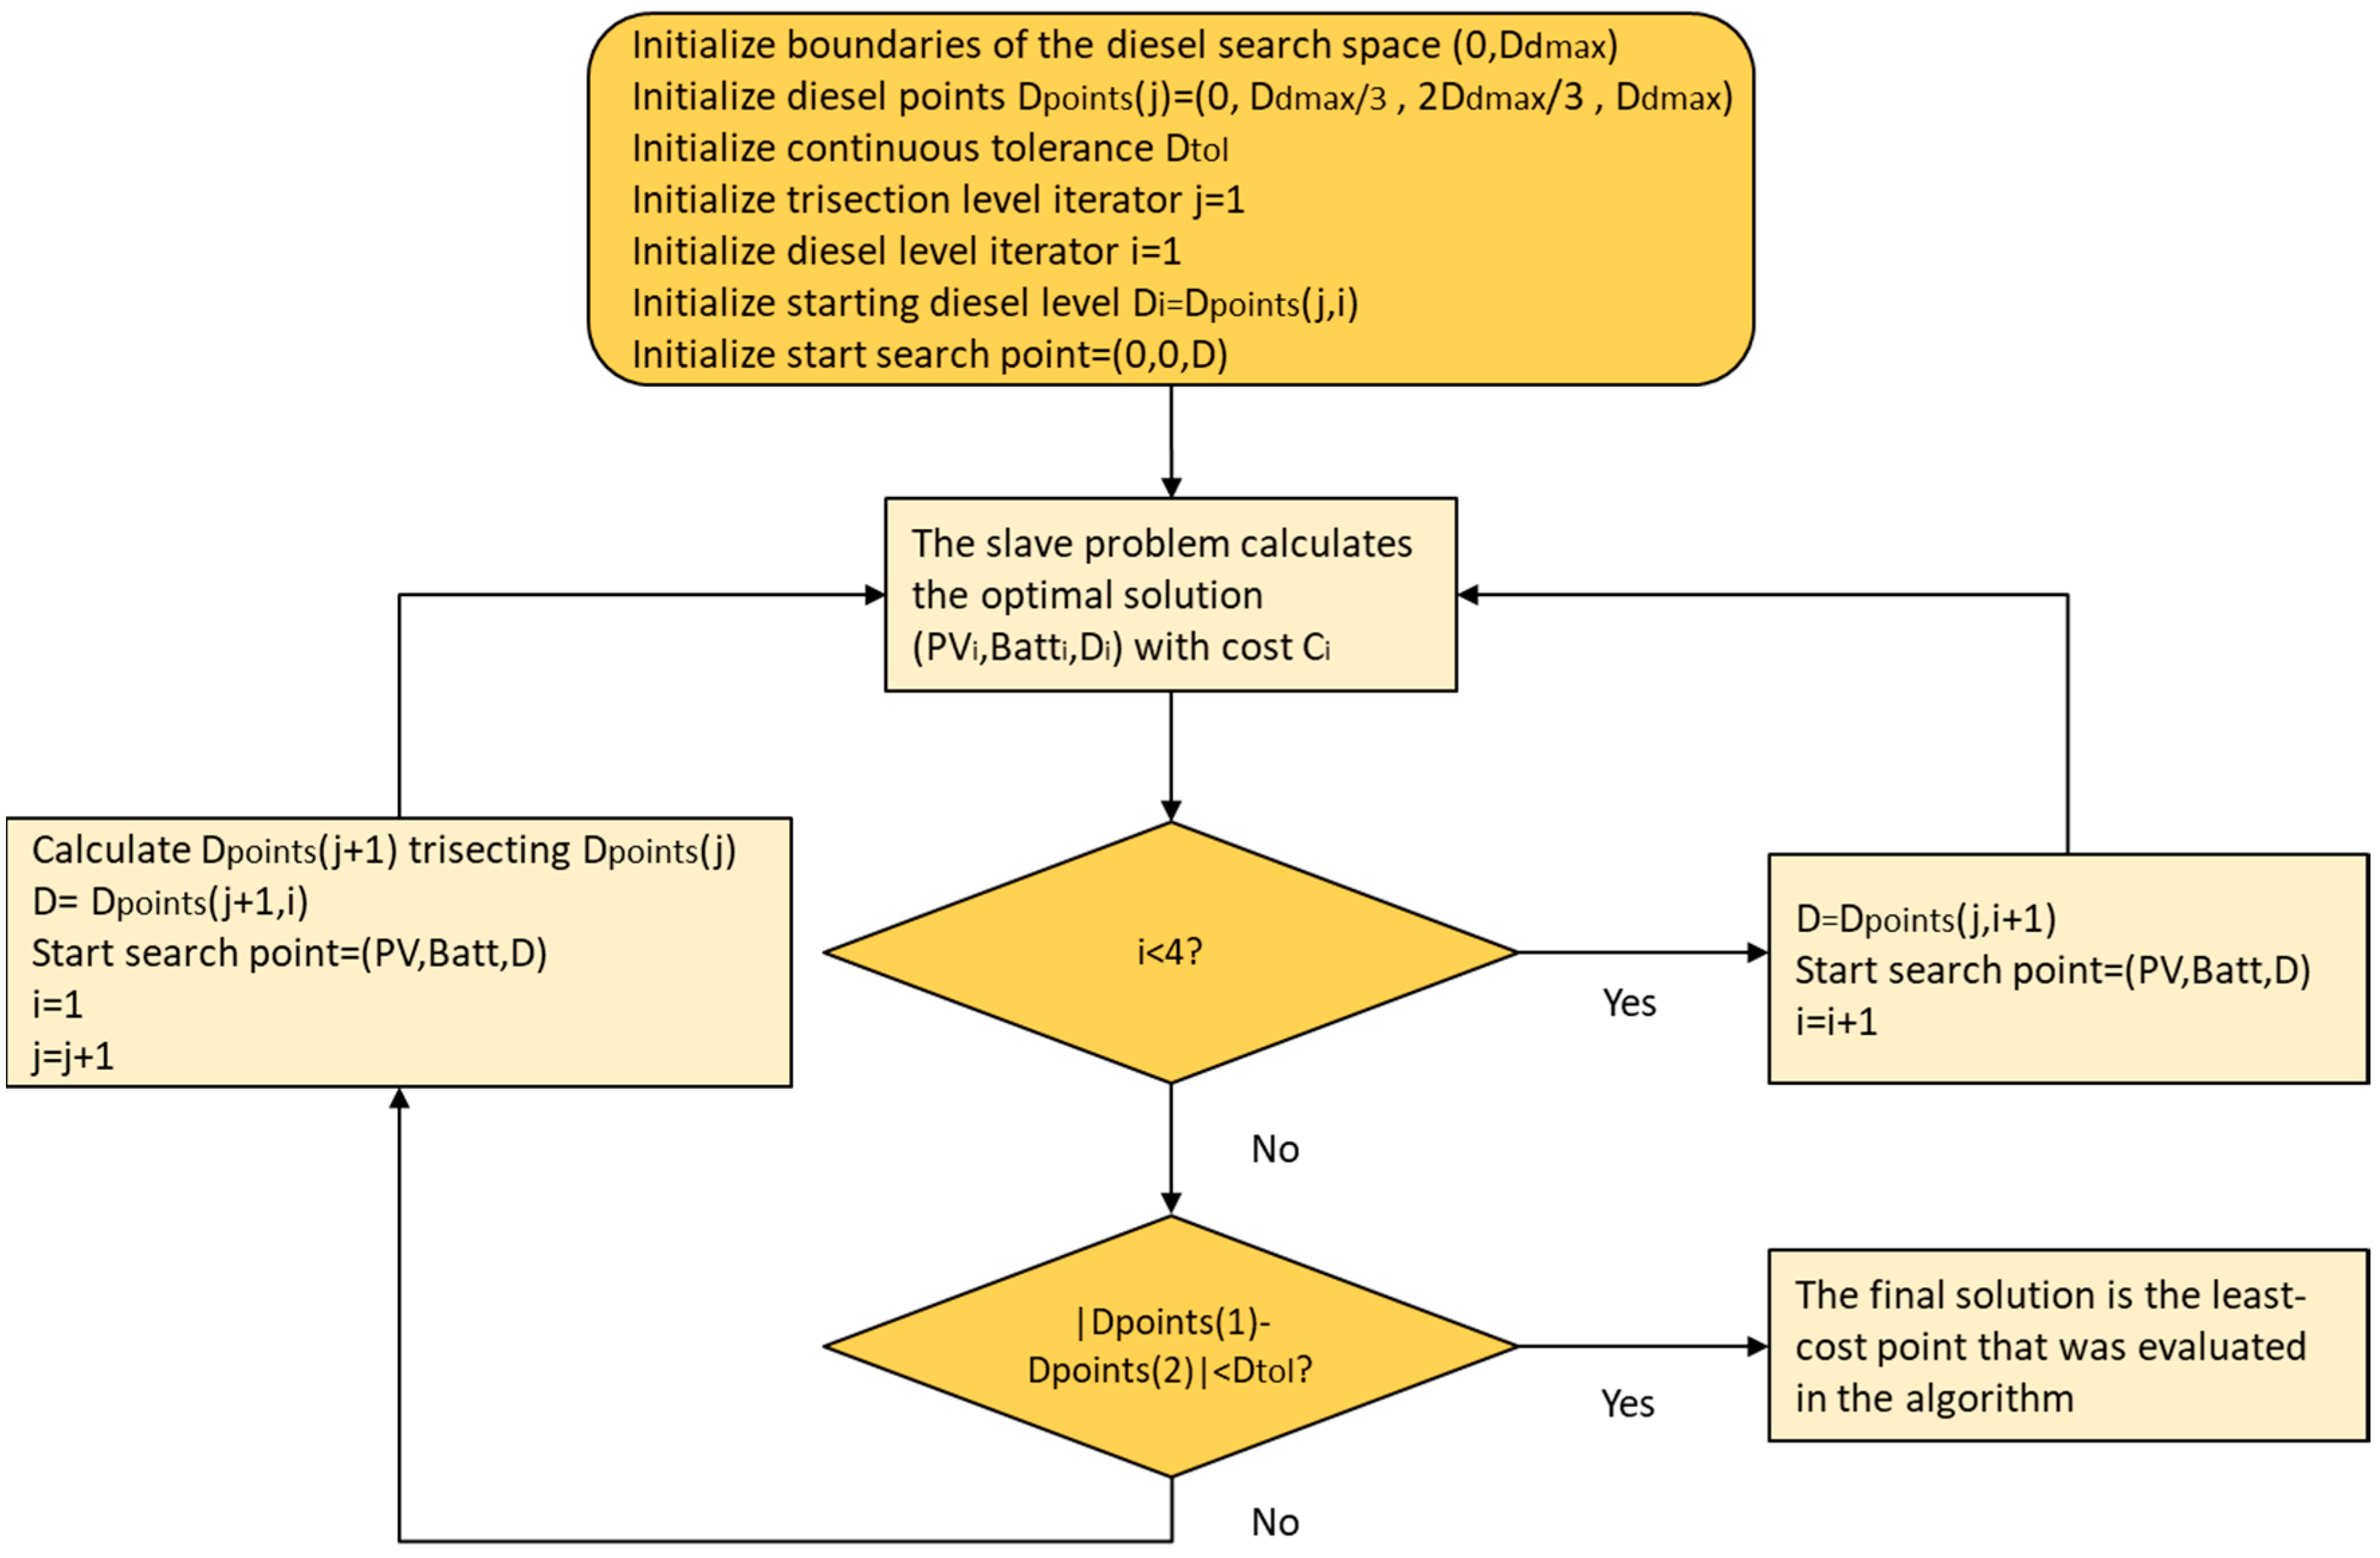
Section 3.2 that the use of discrete diesel generators in the master problem is problematic, and the computation time that the master problem needs to go through all the generators in the diesel space may be excessive for large mini-grids. Hence, we propose a new logic for the master problem that treats the diesel capacity as a continuous variable. The search is performed by trisecting an interval (i.e., dividing an interval into three segments of the same length with four points), which is shortened, discarding the diesel capacity that is further from the current best design and trisected again. The process continues until the length of the interval is lower than a pre-specified tolerance. The slave problem presented in
Section 3.2 has performed well so far, so it has not been necessary to modify it.
It is clear that, when the diesel capacity is treated as a continuous variable, the results of the master problem are not so heavily influenced by the diesel generators available as the algorithm can interpolate among them to obtain a diesel generator of any desired capacity. Moreover, the number of diesel generators that the master level considers when calculating a generation design depends only on the demand of the representative mini-grid and the pre-specified tolerance considered to stop trisecting intervals on the master level. Therefore, the computation time needed is not conditioned to the number of diesel generators available, as opposed to the master logic described in
Section 3.1, which requires all the generators in the diesel search space to be gone through.
A similar trisection procedure is applied in [
38] to determine the optimal point of the I-V and P-V characteristics of a solar panel. It is essential to highlight that the continuous diesel generators are only considered to estimate the generation costs used to group the consumers into mini-grids, but they are not used to calculate the generation costs included in the final electrification solution.
We present an illustrative example in
Figure 10. In this case, we assume that the pre-specified tolerance is 2 kW and the minimum capacity that meets the aggregated demand is 12 kW, so the boundaries of the diesel capacity are (0 kW, 12 kW). The first set of points is evaluated by trisecting this interval, which yields the 4 kW and 8 kW generators, and we assume that the lowest-cost point corresponds to the 4 kW diesel generator. Hence, the highest-capacity generator (12 kW) is discarded and the second set of points is obtained trisecting the interval (0 kW, 8 kW), which yields the 2.67 kW and 5.34 kW generators, and we assume that the lowest-cost solution for the second set of points corresponds to the 5.34 kW diesel generator. The lowest-capacity generator (0 kW) is therefore discarded, and the interval (2.67 kW, 8 kW) is trisected to obtain the third set of points, yielding the 4.45 kW and 6.22 kW generators. The lowest-cost point of the third set of points is the 4.45 kW generator, which is the final solution provided by the algorithm since |4.45 - 2.67| < 2.
The slave problem only needs to calculate generation designs for two different diesel capacities for each iteration, since the first and the last points of the
i-th set of points also belong to the
(i-1)-th set of points.
Figure 11 shows the flow diagram of the master problem presented in this section.
4. Case Application
The method presented in
Section 3 was applied to a case study located in the region of Cajamarca, in Northern Peru. This region has an area of approximately 400 km
2, around 6700 buildings, and several potential connection points to the projected network of 11 kV. The Ministry of Energy and Mines approved the National Plan for Rural Electrification in Peru, which has the goal of achieving universal access by the end of 2022.
The location of the buildings was obtained by manual identification using images from Google Earth (see
Figure 12), and the location of the projected network of 11 kV comes from the National Rural Electrification Plan of Cajamarca, although we do not consider the possibility of extending the power grid for this case study. The network catalogue is based on [
39], where a similar case was analyzed using REM. All the consumers have the demand profile shown in
Figure 13 (also used in the previous example in
Section 3), which was estimated dividing the aggregated demand profile presented in reference [
40] by the corresponding total number of consumers.
The capacities of diesel generators available are 10 kW, 100 kW (as in the previous example in
Section 3), 200 kW, 600 kW, and 1500 kW (we included more capacities to cover the possibility of having mini-grids with more than 500 consumers). The generation designs calculated correspond to 1, 5, 10, 50, 100, 150, 200, 250, 300, 500 (as in the previous example in
Section 3), 1000, 3000, and 7500 residential consumers.
Table 1 and
Table 2 show the look-up table obtained with discrete and continuous diesel capacities, respectively. As shown in
Table 1 and
Figure 9, using discrete capacities is translated into non-monotonic behavior in the size of diesel generators in the range from 50 to 200 households. In contrast, the diesel capacity increases consistently with the number of residential consumers when handled as a continuous variable.
Figure 14 shows the minimum cost design curve (obtained with the algorithm described in
Section 3.1 and performing linear interpolation), the smoothed curve (obtained applying the procedure described in
Section 3.2 to the minimum cost design curve), and the continuous results (obtained with the method presented in
Section 3.3 and performing linear interpolation). The continuous implementation better captures the trend of economies of scale in generation.
Figure 15 and
Figure 16 show the cost breakdown of the generation designs obtained with discrete and continuous diesel capacities, respectively. As expected, designs that included a diesel generator had an OPEX that accounted for a much more significant amount of the generation cost. This effect especially stands out in
Figure 15 as the design for 50 consumers includes a 10 kW diesel generator but designs for 100 and 150 residential consumers do not include a diesel generator.
Figure 17 shows the sizes of candidate mini-grids obtained with discrete diesel capacities, the corresponding smooth curve, and continuous diesel capacities. The candidate mini-grids obtained with the smooth curve and continuous generators are similar, but they are significantly different when generation costs are estimated directly from a look-up table calculated with discrete diesel capacities.
All candidate mini-grids had less than 100 consumers when generation designs obtained with discrete diesel capacities. In the discrete-diesel-capacities case, the generation design for 100 residential consumers had a higher cost per consumer than the generation design for 50 consumers, which caused the clustering algorithm to reach a local optimum and larger mini-grids with lower unitary generation costs were never created. This issue, however, did not happen when the smoothed curve or continuous diesel capacities were used. Indeed, there were a few candidate mini-grids with almost 1000 residential consumers in those cases (beyond this point, the economies of scale in generation are negligible).
The candidate mini-grids that the clustering algorithm provides heavily influence results.
Figure 18 shows the electrification solutions obtained when the generation costs considered in the calculation of candidate mini-grids were obtained with discrete capacities, the smoothed curve, and continuous capacities. All the solutions used mini-grids to electrify the vast majority of the consumers, but their sizes were significantly smaller when discrete diesel capacities were considered to group the consumers into mini-grids.
Table 3 shows the electrification costs obtained with the methods described in
Section 3. The generation costs used to compute the final cost of the mini-grids that appear in
Figure 18 always correspond to the discrete diesel capacities shown in
Table 1 (linear interpolations is used among these designs if needed), and the smoothed curve and continuous diesel capacities are used only to group consumers into mini-grids.
As expected, the final electrification cost was higher when REM grouped consumers into mini-grids, considering discrete diesel capacities, and it was lower when REM grouped consumers into mini-grids, considering continuous diesel capacities. Although the exact numbers depend on the network or generation catalogue, the crucial point is to notice that grouping the consumers into mini-grids using generation costs based on a model with only discrete generation components may be problematic.
5. Conclusions
Access to electricity is one of the most significant challenges of our time, and the consideration of off-grid systems as an alternative to the traditional grid extensions is crucial in rural electrification planning. Several methodologies and software tools deal with the problem of optimizing the generation design of a single off-grid system, but they cannot be easily applied to regional planning as opposed to the smaller scopes for which they were developed (i.e., village-based). On the other hand, most regional planning tools estimate the generation cost of off-grid systems with rules of thumb or analytic expressions that lack the accuracy needed for in-the-field implementation.
Closing the gap between the first-pass estimations that the majority of regional planning tools provide and an implementable rural electrification plan requires working at a higher level of temporal and spatial granularity. When a model operates at the consumer level, it needs to group the consumers into mini-grids. Larger mini-grids usually benefit from economies of scale in generation components at the expense of having a more substantial network cost, so the best way of grouping consumers into mini-grids emerges from the trade-offs between these two costs.
As the range of feasible sizes (understanding size as a combination consumer numbers and aggregated load) for off-grid systems can be enormous in a large-scale project (i.e., we could have isolated consumers but also mini-grids of thousands of consumers), it could be necessary to estimate the generation cost of many off-grid systems to properly group consumers into candidate mini-grids.
This paper presented a method that calculated the generation cost of any potential off-grid system in a large-scale rural electrification planning case, balancing accuracy with computation speed. The method optimized the generation design of a reduced set of representative off-grid systems, and the generation cost of the remaining ones was obtained by performing interpolation. The generation costs that the method estimated were later used to group the consumers into mini-grids, so it was essential to capture the savings resulting from the economies of scale in generation equipment.
Some mini-grids components such as solar panels and batteries behave in a quasi-continuous manner, and any desired capacity can be approximated with a parallel rack of elements available in the catalogue. Other components such as diesel generators have a more discrete behavior since their parallel operation involves a high degree of complexity, which implies that some capacities may not be approximated with the elements available in the catalogue. It is critical to apply a master-slave decomposition that deals with the different nature of components. It can be concluded that components with discrete behavior could distort economies of scale in generation, which hinders grouping the consumers into mini-grids.
The paper introduced two procedures that mitigated the impact of components with discrete behavior on economies of scale. The first one approximated the generation costs with a smooth curve, and the second one modelled the capacity of elements that could alter the economies of scale with continuous variables. Both methods ensured that larger mini-grids benefited from economies of scale in generation when grouping the consumers into mini-grids, but the method based on continuous variables was directly applicable to cases with several types of loads.
The case study shows that a straightforward application of any model based only on discrete components (such as single-system methods or tools) could lead to suboptimal solutions when the consumers are grouped into mini-grids. It could be concluded that the two procedures introduced in this paper led to the better grouping of consumers into mini-grids.
Regarding future research, the method presented in the paper has two significant limitations. Firstly, the number of generation technologies was limited to solar panels and diesel generators, and renewable energies such as wind or hydro should be included in future developments. However, the addition of generation technologies involves dealing with more dimensions when optimizing the generation design of an off-grid system from scratch, which would increase the computation time. Secondly, demand profiles are considered deterministic input parameters, whereas there is much uncertainty about demand in developing countries. Hence, future research should aim at developing a more robust method that can deal with uncertainties.
Author Contributions
Conceptualization, F.d.C.; methodology, P.C. and F.d.C.; software, P.C.; validation, P.C.; investigation, P.C.; data curation, P.C.; writing—original draft preparation, P.C.; writing—review and editing, F.d.C. and S.L.; visualization, P.C.; supervision, F.d.C. and S.L.; project administration, F.d.C. and S.L.
Funding
This research was developed within the Research and Development framework of the Universal Access Lab, which has received funding from the MIT Tata Center for Technology and Design, the Enel Foundation, Iberdrola, the World Bank, the Spanish National Plan of Research, Development and Innovation, General Electric, Shell, the Shell Foundation, and the German Corporation for International Cooperation GmbH (GIZ).
Acknowledgments
The authors would like to express their gratitude to Ignacio Perez Arriaga, who provided valuable comments and reviewed a preliminary version of this paper.
Conflicts of Interest
The authors declare no conflict of interest.
References
- International Energy Agency; International Renewable Energy Agency; United Nations Statistics Division; World Bank; World Health Organization. Tracking SDG7: The Energy Progress Report 2019; World Bank Publications: Washington, DC, USA, 2019; Available online: https://trackingsdg7.esmap.org/data/files/download-documents/2019-Tracking%20SDG7-Full%20Report.pdf (accessed on 10 August 2019).
- United Nations. The Sustainable Development Goals Report 2018; United Nations: New York, NY, USA, 2018. [Google Scholar]
- González-García, A.; Pérez-Arriaga, I. Sistemas integrados de suministro eléctrico aislado conectado a la red: Innovación y gobernanza organizativa para el acceso universal. In Economía Industrial; Ministry of Industry, Trade and Tourism: Madrid, Spain, 2018; pp. 101–112. [Google Scholar]
- Cader, C.; Pelz, S.; Radu, A.; Blechinger, P. Overcoming data scarcity for energy access planning with open data—The example of Tanzania. ISPRS Int. Arch. Photogramm. Remote Sens. Spat. Inf. Sci. 2018, XLII-4/W8, 23–26. [Google Scholar] [CrossRef] [Green Version]
- International Energy Agency. World Energy Outlook 2018; International Energy Agency: Paris, France, 2018. [Google Scholar]
- Moner-Girona, M.; Puig, D.; Mulugetta, Y.; Kougias, I.; AbdulRahman, J.; Szabó, S. Next generation interactive tool as a backbone for universal access to electricity. Wiley Interdiscip. Rev. Energy Environ. 2018, 7, e305. [Google Scholar] [CrossRef] [Green Version]
- Kemausuor, F.; Adkins, E.; Adu-Poku, I.; Brew-Hammond, A.; Modi, V. Electrification planning using Network Planner tool: The case of Ghana. Energy Sustain. Dev. 2014, 19, 92–101. [Google Scholar] [CrossRef]
- Mentis, D.; Howells, M.; Rogner, H.; Korkovelos, A.; Arderne, C.; Zepeda, E.; Siyal, S.; Taliotis, C.; Bazilian, M.; de Roo, A.; et al. Lighting the World: The first application of an open source, spatial electrification tool (OnSSET) on Sub-Saharan Africa. Environ. Res. Lett. 2017, 12, 085003. [Google Scholar] [CrossRef]
- Korkovelos, A.; Khavari, B.; Sahlberg, A.; Howells, M.; Arderne, C. The Role of Open Access Data in Geospatial Electrification Planning and the Achievement of SDG7. An OnSSET-Based Case Study for Malawi. Energies 2019, 12, 1395. [Google Scholar] [CrossRef] [Green Version]
- Zia, M.F.; Elbouchikhi, E.; Benbouzid, M. Microgrids energy management systems: A critical review on methods, solutions, and prospects. Appl. Energy 2018, 222, 1033–1055. [Google Scholar] [CrossRef]
- Upadhyay, S.; Sharma, M.P. A review on configurations, control and sizing methodologies of hybrid energy systems. Renew. Sustain. Energy Rev. 2014, 38, 47–63. [Google Scholar] [CrossRef]
- Luna-Rubio, R.; Trejo-Perea, M.; Vargas-Vázquez, D.; Ríos-Moreno, G.J. Optimal sizing of renewable hybrids energy systems: A review of methodologies. Sol. Energy 2012, 86, 1077–1088. [Google Scholar] [CrossRef]
- Domenech, B.; Ranaboldo, M.; Ferrer-Martí, L.; Pastor, R.; Flynn, D. Local and regional microgrid models to optimise the design of isolated electrification projects. Renew. Energy 2018, 119, 795–808. [Google Scholar] [CrossRef]
- Brivio, C.; Moncecchi, M.; Mandelli, S.; Merlo, M. A novel software package for the robust design of off-grid power systems. J. Clean. Prod. 2017, 166, 668–679. [Google Scholar] [CrossRef]
- Merei, G.; Berger, C.; Sauer, D.U. Optimization of an off-grid hybrid PV–Wind–Diesel system with different battery technologies using genetic algorithm. Sol. Energy 2013, 97, 460–473. [Google Scholar] [CrossRef]
- Borhanazad, H.; Mekhilef, S.; Gounder Ganapathy, V.; Modiri-Delshad, M.; Mirtaheri, A. Optimization of micro-grid system using MOPSO. Renew. Energy 2014, 71, 295–306. [Google Scholar] [CrossRef]
- Maleki, A.; Askarzadeh, A. Artificial bee swarm optimization for optimum sizing of a stand-alone PV/WT/FC hybrid system considering LPSP concept. Sol. Energy 2014, 107, 227–235. [Google Scholar] [CrossRef]
- Mohammed, O.; Amirat, Y.; Benbouzid, M. Economical Evaluation and Optimal Energy Management of a Stand-Alone Hybrid Energy System Handling in Genetic Algorithm Strategies. Electronics 2018, 7, 233. [Google Scholar] [CrossRef] [Green Version]
- Lujano-Rojas, J.M.; Dufo-López, R.; Bernal-Agustín, J.L. Probabilistic modelling and analysis of stand-alone hybrid power systems. Energy 2013, 63, 19–27. [Google Scholar] [CrossRef]
- Tawil, T.E.; Charpentier, J.F.; Benbouzid, M. Sizing and rough optimization of a hybrid renewable-based farm in a stand-alone marine context. Renew. Energy 2018, 115, 1134–1143. [Google Scholar] [CrossRef]
- Sinha, S.; Chandel, S.S. Review of software tools for hybrid renewable energy systems. Renew. Sustain. Energy Rev. 2014, 32, 192–205. [Google Scholar] [CrossRef]
- Rahman, M.M.; Khan, M.M.-U.-H.; Ullah, M.A.; Zhang, X.; Kumar, A. A hybrid renewable energy system for a North American off-grid community. Energy 2016, 97, 151–160. [Google Scholar] [CrossRef]
- Sen, R.; Bhattacharyya, S.C. Off-grid electricity generation with renewable energy technologies in India: An application of HOMER. Renew. Energy 2014, 62, 388–398. [Google Scholar] [CrossRef]
- Al-Rubaye, R.T.A.; Al-Rubaye, A.T.A.; Al-Khuzaie, M.M. Optimal Design of Hybrid Renewable Energy System off grid in Al-Diwaniyah, Iraq. IOP Conf. Ser. Mater. Sci. Eng. 2018, 454, 012103. [Google Scholar] [CrossRef]
- Gebrehiwot, K.; Mondal, M.A.H.; Ringler, C.; Gebremeskel, A.G. Optimization and cost-benefit assessment of hybrid power systems for off-grid rural electrification in Ethiopia. Energy 2019, 177, 234–246. [Google Scholar] [CrossRef]
- Micangeli, A.; Del Citto, R.; Kiva, I.; Santori, S.; Gambino, V.; Kiplagat, J.; Viganò, D.; Fioriti, D.; Poli, D. Energy Production Analysis and Optimization of Mini-Grid in Remote Areas: The Case Study of Habaswein, Kenya. Energies 2017, 10, 2041. [Google Scholar] [CrossRef] [Green Version]
- Hartvigsson, E.; Stadler, M.; Cardoso, G. Rural electrification and capacity expansion with an integrated modeling approach. Renew. Energy 2018, 115, 509–520. [Google Scholar] [CrossRef] [Green Version]
- Ganguly, P.; Kalam, A.; Zayegh, A. Design an optimum standalone hybrid renewable energy system for a small town at Portland, Victoria using iHOGA. In Proceedings of the 2017 Australasian Universities Power Engineering Conference (AUPEC), Melbourne, Australia, 19–22 November 2017; pp. 1–6. [Google Scholar]
- Universal Energy Access Laboratory—MIT & IIT-Comillas. Available online: http://universalaccess.mit.edu/ (accessed on 5 January 2019).
- Ellman, D. The Reference Electrification Model: A Computer Model for Planning Rural Electricity Access. Master’s Thesis, Massachusetts Institute of Technology, Engineering Systems Division, Cambridge, MA, USA, 2015. [Google Scholar]
- Ciller Cutillas, P. Clustering-Related Improvements in the Reference Electrification Model. Master’s Thesis, School of Engineering, Universidad Pontificia Comillas, Madrid, Spain, 2016. [Google Scholar]
- Ciller, P.; Ellman, D.; Vergara, C.; Gonzalez-Garcia, A.; Lee, S.J.; Drouin, C.; Brusnahan, M.; Borofsky, Y.; Mateo, C.; Amatya, R.; et al. Optimal Electrification Planning Incorporating On- and Off-Grid Technologies: The Reference Electrification Model (REM). Proc. IEEE 2019, 107, 1872–1905. [Google Scholar] [CrossRef]
- Lee, S.J.; Sanchez, E.; Gonzalez-Garcıa, A.; Ciller, P.; Duenas, P.; Taneja, J.; de Cuadra García, F.; Lumbreras, J.; Daly, H.; Stoner, R.; et al. Investigating the Necessity of Demand Characterization and Stimulation for Geospatial Electrification Planning in Developing Countries Working paper. 2019. Available online: http://universalaccess.mit.edu/#/publications (accessed on 29 November 2019).
- Moretti, L.; Astolfi, M.; Vergara, C.; Macchi, E.; Pérez-Arriaga, J.I.; Manzolini, G. A design and dispatch optimization algorithm based on mixed integer linear programming for rural electrification. Appl. Energy 2019, 233–234, 1104–1121. [Google Scholar] [CrossRef]
- Liu, X.; Zhang, Z. A hybrid reliability approach for structure optimisation based on probability and ellipsoidal convex models. J. Eng. Des. 2014, 25, 238–258. [Google Scholar] [CrossRef]
- Prada y Nogueira, I. Aerodynamic Design Optimization Based on Multi-Attribute Structured Hybrid DirectSearch. Application to Industrial Problems. Ph.D. Thesis, School of Engineering, Universidad Pontificia Comillas, Madrid, Spain, 2017. (In Spanish). [Google Scholar]
- Barley, C.D.; Winn, C.B. Optimal dispatch strategy in remote hybrid power systems. Sol. Energy 1996, 58, 165–179. [Google Scholar] [CrossRef]
- Kong, K.C.; Muzathik, A.M. New Approach on Mathematical Modeling of Photovoltaic Solar Panel. Appl. Math. Sci. 2012, 6, 21. [Google Scholar]
- Gonzalez-Garcia, A.; Amatya, R.; Stoner, R.; Perez-Arriaga, J.I. Evaluation of Universal Access to Modern Energy Services in Peru. Case Study of Scenarios for Electricity Access in Cajamarca; Working paper. Enel Foundation: Rome, Italy, 2016. Available online: http://universalaccess.mit.edu/#/publications (accessed on 28 April 2018).
- Villanueva Saberbein, K.S.; Aye, L. Technical and Financial Feasibility of a Stand-alone Photovoltaic System for Rural Electrification in the Andean South Region of Peru. J. Sustain. Dev. 2012, 5, 32–45. [Google Scholar] [CrossRef]
Figure 1.
Consumers grouped in (a) one, and (b) five mini-grids. The network designs of the mini-grids were calculated with Reference Electrification Model (REM). Map data: Google, CNES/Airbus.
Figure 1.
Consumers grouped in (a) one, and (b) five mini-grids. The network designs of the mini-grids were calculated with Reference Electrification Model (REM). Map data: Google, CNES/Airbus.
Figure 2.
Off-grid clustering configurations. © 2019 IEEE. Reprinted, with permission, from [
32].
Figure 2.
Off-grid clustering configurations. © 2019 IEEE. Reprinted, with permission, from [
32].
Figure 3.
Example of representative mini-grids whose generation designs are calculated.
Figure 3.
Example of representative mini-grids whose generation designs are calculated.
Figure 4.
Architecture of off-grid systems in REM. © 2019 IEEE. Reprinted, with permission, from [
32].
Figure 4.
Architecture of off-grid systems in REM. © 2019 IEEE. Reprinted, with permission, from [
32].
Figure 5.
Candidate generation designs that the algorithm considers. As the diesel capacity increases, candidate designs have fewer solar panels and batteries.
Figure 5.
Candidate generation designs that the algorithm considers. As the diesel capacity increases, candidate designs have fewer solar panels and batteries.
Figure 6.
Flow diagram of the master problem. Ddmax is defined as the smallest diesel generator that can meet the demand of the system.
Figure 6.
Flow diagram of the master problem. Ddmax is defined as the smallest diesel generator that can meet the demand of the system.
Figure 7.
Slave problem example. The algorithm moves two times to a neighbor point with lower cost, reduces the step length, and moves another time.
Figure 7.
Slave problem example. The algorithm moves two times to a neighbor point with lower cost, reduces the step length, and moves another time.
Figure 8.
Flow diagram of the slave problem. The upper boundaries of the solar and battery search spaces are defined as ten times the average demand.
Figure 8.
Flow diagram of the slave problem. The upper boundaries of the solar and battery search spaces are defined as ten times the average demand.
Figure 9.
Generation cost per consumer obtained with the discrete algorithm.
Figure 9.
Generation cost per consumer obtained with the discrete algorithm.
Figure 10.
Example of the continuous algorithm. The best solution for each set of points is marked with a triangle of a wider boundary, and a circle surrounds the final solution that the algorithm provides.
Figure 10.
Example of the continuous algorithm. The best solution for each set of points is marked with a triangle of a wider boundary, and a circle surrounds the final solution that the algorithm provides.
Figure 11.
Flow diagram of the master (continuous) problem.
Figure 11.
Flow diagram of the master (continuous) problem.
Figure 12.
Location of the consumers for the case study. Map data: Google, CNES/Airbus, Landsat/Copernicus.
Figure 12.
Location of the consumers for the case study. Map data: Google, CNES/Airbus, Landsat/Copernicus.
Figure 13.
Residential demand profile.
Figure 13.
Residential demand profile.
Figure 14.
Generation cost obtained with the methods described in
Section 3.
Figure 14.
Generation cost obtained with the methods described in
Section 3.
Figure 15.
Generation costs obtained with the discrete algorithm.
Figure 15.
Generation costs obtained with the discrete algorithm.
Figure 16.
Generation costs obtained with the continuous algorithm.
Figure 16.
Generation costs obtained with the continuous algorithm.
Figure 17.
Histogram that shows the number of clusters for each cluster size obtained with the different generation algorithms. There are also 14 clusters with more than 100 consumers in the smoothed case (the biggest one has 965 consumers) and 12 clusters with more than 100 consumers in the continuous case (the biggest one has 813 consumers), which are not shown for the sake of clarity.
Figure 18.
Electrification solutions where candidate mini-grids are calculated with (a) discrete diesel capacities, (b) the smoothed curve, and (c) continuous diesel capacities.
Figure 18.
Electrification solutions where candidate mini-grids are calculated with (a) discrete diesel capacities, (b) the smoothed curve, and (c) continuous diesel capacities.
Table 1.
Designs with discrete diesel capacities.
Table 1.
Designs with discrete diesel capacities.
| Residential Consumers | Solar Capacity (kWp) | Battery Capacity (kWh) | Generator Capacity (kW) | Fraction of Demand Served (p.u.) | Fraction of Demand Served with Diesel (p.u.) | Total Cost Per Consumer ($/yr) |
|---|
| 1 | 0.29 | 2.22 | 0 | 1 | 0 | 273.48 |
| 5 | 1.37 | 11.10 | 0 | 0.99 | 0 | 140.07 |
| 10 | 2.73 | 24.42 | 0 | 1 | 0 | 124.68 |
| 50 | 5.36 | 4.44 | 10 | 1 | 0.70 | 105.14 |
| 100 | 27.30 | 233.10 | 0 | 1 | 0 | 109.67 |
| 150 | 40.95 | 310.80 | 0 | 0.99 | 0 | 108.39 |
| 200 | 19.50 | 66.60 | 100 | 1 | 0.60 | 99.44 |
| 250 | 21.94 | 53.28 | 100 | 1 | 0.67 | 88.90 |
| 300 | 28.28 | 46.62 | 100 | 1 | 0.67 | 81.53 |
| 500 | 47.78 | 73.26 | 100 | 1 | 0.68 | 67.82 |
| 1000 | 94.58 | 139.86 | 200 | 1 | 0.68 | 65.99 |
| 3000 | 282.75 | 419.58 | 600 | 1 | 0.68 | 64.98 |
| 7500 | 706.88 | 1052.28 | 1500 | 1 | 0.68 | 64.83 |
Table 2.
Designs with continuous diesel capacities.
Table 2.
Designs with continuous diesel capacities.
| Residential Consumers | Solar Capacity (kWp) | Battery Capacity (kWh) | Generator Capacity (kW) | Fraction of Demand Served (p.u.) | Fraction of Demand Served with Diesel (p.u.) | Total Cost Per Consumer ($/yr) |
|---|
| 1 | 0.29 | 2.22 | 0 | 1 | 0 | 273.48 |
| 5 | 1.37 | 11.10 | 0 | 0.99 | 0 | 140.07 |
| 10 | 2.73 | 24.42 | 0 | 1 | 0 | 124.68 |
| 50 | 5.36 | 4.44 | 8.9 | 1 | 0.70 | 100.97 |
| 100 | 9.75 | 13.32 | 18.8 | 1 | 0.68 | 87.76 |
| 150 | 14.63 | 17.76 | 26.8 | 1 | 0.69 | 81.87 |
| 200 | 19.50 | 22.20 | 35.7 | 1 | 0.69 | 79.08 |
| 250 | 24.38 | 26.64 | 44.7 | 1 | 0.70 | 76.97 |
| 300 | 28.28 | 31.08 | 53.6 | 1 | 0.70 | 74.96 |
| 500 | 47.78 | 73.26 | 99.1 | 1 | 0.68 | 67.84 |
| 1000 | 85.12 | 139.86 | 178.2 | 1 | 0.69 | 64.70 |
| 3000 | 254.48 | 419.58 | 534.6 | 1 | 0.69 | 63.83 |
| 7500 | 636.19 | 1052.28 | 1336.2 | 1 | 0.69 | 63.63 |
Table 3.
Electrification solution summary for the three different generation algorithms. Capital Expenditures (CAPEX) account for the investment costs, and Operational Expenditures (OPEX) account for the operation and maintenance costs.
Table 3.
Electrification solution summary for the three different generation algorithms. Capital Expenditures (CAPEX) account for the investment costs, and Operational Expenditures (OPEX) account for the operation and maintenance costs.
| | Consumers Grouped Considering Discrete Diesel Capacities | Consumers Grouped Considering the Smoothed Curve | Consumers Grouped Considering Continuous Diesel Capacities |
|---|
| | Mini-Grids | Isolated | All | Mini-Grids | Isolated | All | Mini-Grids | Isolated | All |
|---|
| Number of customers | 6629 | 59 | 6688 | 6674 | 14 | 6688 | 6644 | 44 | 6688 |
| Fraction of customers | 0.99 | 0.01 | 1 | 1 | 0 | 1 | 0.99 | 0.01 | 1 |
| CAPEX per customer ($/yr) | 76.28 | 108.24 | 76.56 | 77.35 | 108.24 | 77.41 | 74.26 | 108.24 | 74.48 |
| OPEX per customer ($/yr) | 54.89 | 167.46 | 55.89 | 47.72 | 167.46 | 47.97 | 48.78 | 167.46 | 49.56 |
| Non-served energy cost per customer ($/yr) | 0.97 | 0.85 | 0.97 | 0.63 | 0.85 | 0.63 | 0.57 | 0.85 | 0.57 |
| Final Cost per customer ($/yr) | 132.15 | 273.48 | 133.39 | 125.70 | 273.48 | 126.01 | 123.61 | 273.48 | 124.60 |
| Total CAPEX ($/yr) | 505,677 | 6386 | 512,063 | 516,232 | 1515 | 517,747 | 493,385 | 4762 | 498,147 |
| Total OPEX ($/yr) | 363,886 | 9880 | 373,766 | 318,479 | 2344 | 320,823 | 324,096 | 7368 | 331,465 |
| Total non-served energy cost ($/yr) | 6444 | 50 | 6494 | 4210 | 12 | 4222 | 3799 | 37 | 3837 |
| Final cost ($/yr) | 876,006 | 16,135 | 892,141 | 838,920 | 3829 | 842,749 | 821,281 | 12,033 | 833,313 |
| Fraction of demand served (p.u.) | 0.998 | 0.998 | 0.998 | 0.999 | 0.998 | 0.999 | 0.999 | 0.998 | 0.999 |
| Cost per kWh of demand served ($/kWh) | 0.387 | 0.804 | 0.391 | 0.369 | 0.804 | 0.37 | 0.363 | 0.804 | 0.366 |
© 2019 by the authors. Licensee MDPI, Basel, Switzerland. This article is an open access article distributed under the terms and conditions of the Creative Commons Attribution (CC BY) license (http://creativecommons.org/licenses/by/4.0/).


