Article

Achieving a Flexible and Sustainable Energy System: The Case of Kosovo

by
Njomza Ibrahimi
1,2,3,
Alemayehu Gebremedhin
2,* and
Alketa Sahiti
1,2
1
Department of Electric Power Engineering of University of Pristina “Hasan Prishtina”, 10000 Pristina, Kosovo
2
Department of Manufacturing and Civil Engineering of Norwegian University of Science and Technology, Teknologivegen 22, 2815 Gjøvik, Norway
3
Universite de Pau et des Pays de l’Adour, SIAME, E2S UPPA Pau, France
*
Author to whom correspondence should be addressed.
Energies 2019, 12(24), 4753; https://doi.org/10.3390/en12244753
Submission received: 4 November 2019 / Revised: 22 November 2019 / Accepted: 29 November 2019 / Published: 13 December 2019
(This article belongs to the Section A: Sustainable Energy)

Abstract

:
In today’s energy system, the diffusion of renewable-based technologies is accelerating rapidly. Development of mechanisms that support the large-scale deployment of renewables towards global warming and climate change mitigation continues to remain an issue of utter importance. The most important challenges the energy system of Kosovo faces today is the difficulty to meet all the demand for electricity, low operating efficiency and high release of greenhouse gas emissions, but specifically a large source of carbon dioxide (CO2). Consequently, this influences not only the stability of the system but the society as a whole. This paper addresses several possibilities for designing an adaptable energy system in Kosovo with the ability to balance electricity supply and demand which will meet the requirements for a more efficient, reliable and secure system. A new way of energy generating through integration of new renewable and non-renewable technologies is developed using the EnergyPLAN model. The system is based on available technologies: existing hydro, wind, photovoltaic (PV), combined heat and power (CHP) and new solar thermal, heat pumps and biomass. The baseline scenario 2015 was expanded by four additional scenarios, two for the year 2030 and two for the year 2050. The contribution of renewable sources in the primary energy supply (PES) in the performed scenarios was 14.8%, 34.1%, 38.4%, 69.7% and 68.3% respectively. Further, a very important component of this paper is the investigation of integrating carbon capture and sequestration (CCS) technology in the coal-based power plant as part of the analysis in the second scenario for 2050. The shift to zero-carbon energy system in Kosovo requires additional research and assessment in order to identify the untapped potential of renewable sources. However, from the results obtained it can be concluded that the goal of a secure, competitive and sustainable energy system in Kosovo state which will meet its long-term energy needs can be certainly achieved.

1. Introduction

Clean energy as one of the most important goals of sustainable development, remains a crucial objective that has to be fulfilled by many developed and developing countries [1]. The primary energy supply (PES) in Kosovo is the same today as it was before the first oil crises in the early 70s. Due to the high reserves of lignite, 97% of Kosovo’s electricity generation comes from coal power plants [2]. This way of energy generating leads to approximately 5.8 million tons of carbon dioxide (CO2)/year to be released in the atmosphere during the combustion process in coal power plants [3]. Regarding CO2 emissions, one can clearly see that the SEE region which consists of Albania, Bosnia and Herzegovina, Bulgaria, Croatia, Greece, Macedonia, Montenegro, Romania, Serbia, Slovenia and Kosovo is represented by a high value. In 2015, the energy consumption by different sectors in Kosovo was as follows: 3.4 TWh (industry sector), 6.1 TWh (household sector), 1.7 TWh (services sector), 1.9 TWh (agriculture sector) and 4.3 TWh (transport sector) [4]. Indeed, the household sector was by far the biggest consumer of energy in Kosovo in 2015.
In March 2007 the EU defined the ’20-20-20′ climate and energy target for the year 2020 [5]. In addition, a target of 20% renewable energy for the year 2020 has been proposed by Kosovo’s Government in the National Renewable Energy Action Plan (NREAP) 2011–2020 [6] carried out by Ministry of Economic Development. Based on this long-term strategy it was planned that by the year 2020, 25.64% of gross final consumption of electricity to be covered from renewable energy sources, respectively by construction of new 240 MW small hydropower plants, a 305 MW hydropower plant, 150 MW wind power plants, 14 MW biomass power plants and 10 MW photovoltaic systems [6]. On the other hand, the latest EU directive [7] calls for at least 27% overall renewable energy penetration until 2030 for its member states. Kosovo has adopted the ’20-20-20′ EU directive and will work towards fulfilling this target. Achieving this renewable energy penetration share is both an opportunity and a challenge for Kosovo.
The coal power plants which are currently covering the majority of the electricity demand are planned to be decommissioned or will be getting a major makeover in the coming years, meaning that there will be an unmet need for the load. Seeking for renewable energy sources is both a technology and an economic challenge. The use of conventional sources of energy has many adverse consequences in the environment such as acid rain, ozone layer depletion, forest destruction and the greenhouse effect [8]. Renewable sources are constantly replenished and clean and they do not release any harmful emissions into the atmosphere [9,10,11]. Exploitation of renewable energy sources for greenhouse gas emissions displacement, off-grid operations and improvement of operational issues such as continuity of supply, reliability and security of the system is worthy of further research. Authors in [12] concluded that a transition to environmentally sustainable energy use in Kosovo while introducing new technologies in electrical power production and transportation with emission reduction policies as part of the overall strategy is not only possible but feasible also. However, the assessment of real potential of renewable energy sources in Kosovo and their integration in a well-developed energy system scheme still remains to be one of the biggest challenges for many energy planners and policy makers.
Renewable energy systems have been reviewed comprehensively in many studies worldwide. The authors in [13] aimed to review a considerable number of energy models in order to create a clearer and easier path for those who deal with planning, investigation and development of the future energy modeling schemes. The energy generation, demand, CO2 emissions, renewable sources, and optimization were highlighted as the main parameters towards a proper promoting of reliable and efficient energy systems. This research is limited to a more detailed and comprehensive analysis of the security of the supply, cost investment, geographic location and social aspects of the diffusion of renewable energy sources.
Another review of renewable energy systems was conducted by authors in [14]. Basically, this research was focused on the performance assessment of hybrid power systems composed of wind, solar and diesel-based power plants. A detailed description of the steady-state and dynamic models making use of both electrical and mechanical features as well as their regulation techniques is clearly given for better understanding of the operation of such systems. Furthermore, the benefits of introducing advance smart algorithms such as ‘genetic algorithm’, ‘neural network’ and ‘fuzzy logic’ methods to extract the optimal power from these systems are included in this review.
The authors in paper [15] analyze the power system planning of a regional-scale using a copula-based stochastic fuzzy-credibility programming (CSFP) method. A detailed step-by-step model of a joint planning for a regional-scale electric power system of a region in China is given. This planning investigates a new way of the power system planning and includes the shift from fossil fuels to the integration of renewable sources, and proposes proper solutions to electricity import strategies when there is a lack of electricity produced from gas-fired or renewable sources. For a successful operation and implementation of the power system stimulating policies towards emission reduction and renewable energy integration an advanced development of the current transmission system is required. The results of this model show a decrease in electricity shortage and reduced costs-related issues. The integration of renewable energy in the power system is closely related and depends on the way how they are connected to the grid. Authors in [16] used the phase-locked loop technique and they investigated the relation and impact that the power system dynamics has on the performance of the latter which functions following the voltage-phase tracking algorithm. To satisfy the goal introduced which is to determine the performance of the phase-locked loop technique, the authors considered to use power system dynamics rather than a three-phase voltage source. Moreover, they claim that the proposed method is very efficient, simple and the study can be carried out more simply and efficiently compared to traditional power system simulation-based techniques.
Authors in [17] used the interval-parameter credibility constrained programming (ICCP) technique for a proper optimization of the power system planning considering the reduction of greenhouse gases emission. They included various parameters such as the energy generation pattern and the future expansion of the grid, as well as other economic and risk constraints which are indeed very helpful for energy policy makers under high uncertainty.
The article [18] presents a study of the electric power system of the city of Qingdao with the goal of cost minimization and environment emission reduction. This analysis is done using the multistage inexact-factorial fuzzy-probability programming (MIFP) method in order to optimize the operation of the energy system under some specific uncertainties. Taking into consideration elements as the cost for electricity production, electricity demand, emission reduction, and the price of fuel, the authors have realized that a better energy system can be achieved, especially with the increase of renewable energy production. The growth of renewable energy will bring many positive effects as the reduced energy import, and the reduced need for fossil fuel production and carbon emission. The analysis also shows an optimal and cost-effective operation of the electric power system.
On the other hand, over the last few years, many studies have been performed by researchers in several places around the world in the area of energy system analysis with the focus on renewable energy and the possible potential of integrating them into their current energy systems. The main findings from some of the following studies conducted for South East Europe [19], Macedonia [20], Denmark [21], Portugal [22], Hungary [23], Ireland [24], Croatia [25] and Australia [26] were summarized in Table 1. Installed generation capacity of each renewable and non-renewable technologies, PES, total electricity generation, electricity demand, renewable energy share (RES) in total installed capacity and CO2 emissions for baseline and future scenarios were the main parameters that were extracted from the papers and presented in the table for clearer understanding and observation of the energy system topology of each of these countries. A comparative analysis regarding the type of renewable energy used by each country is also given in this section. In the studies for Denmark, Macedonia and SEE an analysis of 50% and 100% renewable energy system by the year 2030 and 2050 was investigated.
EnergyPLAN and H2RES as energy planning software for optimization of microgrid components sizing were the most-used tools for performing this kind of research. The electricity demand of SEE, Macedonia, Portugal, Ireland, and Croatia is mainly supplied by thermal power plants. This form of electricity generation has covered around 60% of the total generation capacity in SEE in 2008. On the other hand, in Australia, electrical energy is mainly generated by hydropower plants. Furthermore, countries like Portugal, SEE, Ireland, and Australia due to the great hydropower potential are planning to invest mostly in this type of technology in the future. An approximately double increase of hydropower installed generation capacity is planned in the future scenarios in Portugal. In addition, Portugal’s energy policy is directed at the additional increase of PV generation as well, due to the high potential of solar radiation and its favorable climatic condition for the implementation of this technology [27].
On the other hand, Denmark is leading regarding the increase in installed capacity of wind power plants for the future scenarios, followed by Australia and SEE. Even though investment in wave power is quite rare in most of the countries, Denmark, Portugal, and Ireland approach towards 100% renewable energy system, which also contain a great amount of wave power. Denmark’s policy towards 50% and 100% renewable energy system includes 500 MW and 100 MW new installed capacities in wave power for the year 2030 and 2050 respectively. From all the study that were performed, Denmark has the most realistic strategy which is supported by the Danish Government towards a zero-emission energy system by the year 2050 based on its renewable source potential. However, additional research should be conducted to examine the real renewable sources potential of Macedonia towards implementation of 100% renewable energy by the year 2050.
Previous works have tended to focus more on analyzing the benefits of increasing the RES in the overall installed generation capacity. Few researchers have addressed the effective ways of mitigating the problem of the great amount of CO2 emission that is released into the atmosphere during the combustion process in coal power plants. Very little is known about the carbon capture and sequestration (CCS) technology and identification of its possible development and implementation in places with different geologic features. Some research work in reviewing CCS technology has been conducted by several authors with the focus in the type of technology that is used in such systems and their performance [28,29,30,31,32,33,34,35,36,37,38]. From the study findings, the CCS technology has proven the capability of capturing up to 90% of the carbon released into the atmosphere from coal power plants. In addition, the stored carbon can be used for oil recovery afterwards.
The authors in [39] have been widely reviewing and comparing the CCS technology with renewable energy based on the geographic analysis of the particular location. Development of a model which finds the optimal point on which the system will operate efficiently was the main target of this paper. From the results obtained CCS technology can be applied to an existing or new coal power plant if the current location is known for its richness and vast availability of the underground saline aquifers. But financially, renewable energy implementation leads to lower cost investment than CCS technology. A general summary of basic concepts and key terms of the functionality of different types of the CCS technology is conducted by authors in [40]. Every phase of the processes involved in this technology was well-explained and analyzed. The type of technology that is used for capturing the CO2 is strongly dependent on the type of the fuel that is used by the power plant. The two main technologies that were most developed include the capture and sequestration.
An assessment of CO2 storage potential in Europe was conducted by European Commission [41]. Kosovo, together with Montenegro was studied as part of the geographic surface of Serbia. From the results obtained, Serbia and Montenegro have two storage units for implementing this technology on their geological surface. Applying all the mentioned characteristics of this technology to the power plants will have noticeable effects on the environment and society also.
It is worth pointing out that this technology reduces the amount of energy that is produced by the power plant, due to its energy needs during the carbon capture process. A fundamental major shortcoming of introducing the CCS technology in current and new fossil-fuel based power plants is the high cost of investment [42]. The high cost of investments in CCS can be supported by any source of subsidy, but this will cause a decrease in the market price of CO2 [43]. Therefore, we have considered this technology in the 2050 scenario only. However, in the countries with high potential of fossil fuels which prove to have a good geologic position, the implementation of this technology can indeed bring satisfactory results. Furthermore, considering that Kosovo is ranked the fifth country in the world with the highest reserves of lignite (14.7 million tons), the research in CCS technology is significant and influential [44].
Kosovo energy strategy is not directed towards 100% renewable energy system, but the design of a flexible energy system in Kosovo has been seen as economically and technically possible. The current paper deals with building a new energy system in Kosovo with high penetration of renewable sources. Also, it seeks to maintain the stability of the system, reduce CO2 emissions and have a secure and reliable energy supply. Since the heat and electricity generation in Kosovo is mainly dominated by fossil fuel, integration of renewable energy for heating and electricity has the main role in the overall strategy. The transport and industry sectors have been also included in the long-term analysis in this study case.
To our knowledge, this is the first study to analyze the current energy system of Kosovo including electricity, heat, transport, and industry sectors by taking 2015 as reference year and then building realistic approaches for the upcoming years 2030 and 2050 using the EnergyPLAN tool. Moreover, in this paper, the future scenarios were explicitly developed by carefully taking into consideration the up-to-date strategies proposed by the Government of Kosovo. Even though our system aims at increasing the proportion of renewable energy sources for the upcoming years 2030 and 2050, however, our objective aims at developing realistic approaches rather than presenting overall energy system analysis of a 100% renewable energy system, an approach taken by other studies like for the state of Macedonia [20] and for SEE [19].
The paper is organized as follows: The first section gives a broad introduction presenting general information about the importance of integrating renewable energy sources in the energy systems of today; it gives a brief explanation of the current energy system under study as well as presents a related literature study for strategies towards future renewable energy systems developed by various countries worldwide. Section 2 describes the tool used to perform the current analysis, objectives and data collection methodology. A description of the Kosovo energy system and the elaboration of baseline and future scenarios are given in Section 3. Section 4 gives the concluding results from this work accompanied by a discussion of the main findings. Conclusions are provided in Section 5. Future work arising from the current study is addressed in Section 6.

2. Methodology

2.1. EnergyPLAN Tool

A techno-economic assessment and an environmental investigation of the existing and future strategies for the development and further enhancement of Kosovo’s energy system were conducted using the EnergyPLAN model. Various tools for energy system analysis were investigated before the adequate tool for this kind of analysis was identified [45]. The EnergyPLAN is an energy-system analysis tool developed by researchers at Aalborg University in Denmark [46]. Through this tool both technical, economic, investment cost and environmental based models at national or regional level can be created and validated considering electricity, heat and transport as main sectors. EnergyPLAN was chosen for this study, because compared to the many other tools that exists, it offers the opportunity to make calculations in hourly distributed data. This is a vast advantage especially when the system is comprising a large part of renewable energy sources and knowing that their production has significant variation during different times of the year [47]. In this paper, the EnergyPLAN 12.3 version was used. The model is based on input-output data, where the main inputs are power plant capacities, hourly values of electricity production, electricity and heat demand, electricity imports and exports and investment as well as operation and maintenance (O&M) cost of each component in the system. The outputs are PES, share of renewable energy sources (RES), CO2 emissions, import/export electricity imbalance, fuel consumption and critical excess electricity production (CEEP). As a simulation tool EnergyPLAN offers the opportunity to model and analyze an energy system through different scenarios showing their advantages and weaknesses, depending of the input parameters as type of energy sources, emission factors, costs etc [48].
Towards optimization of energy system both technical and market regulation strategies can be performed as are available in the friendly-user interface of EnergyPLAN. While the technical simulation strategy aims to reduce the electricity imports and exports as well as find an optimal state of the system in respect to low fuel consumption, the market-economic regulation strategy optimizes the system considering the cost as the main constraint. Consequently, its main objective is to create an energy system model which operates at a minimum cost.
In view of the difficulties encountered by the energy system in Kosovo, for example, the difficulty of meeting all the demand for electricity, the very low operational efficiency and the large amounts of greenhouse gases released by the system, this study has given priority to operational flexibility enhancement and increase of the proportion of renewable energy. Therefore, the technical regulation was used for further analysis and investigation in this paper. The technical regulation strategy is divided into 4 sub-categories as follows:
  • Balancing hourly heat demand only.
  • Balancing both electricity and heat demand.
  • Balancing both heat and electricity demands by reducing combined heat and power (CHP) in order to have grid stabilization.
  • Balancing heat demands by using triple tariff.
From the above regulation strategies, technical strategy-balancing both heat and electricity demands (Reducing CHP also when partly needed for grid stabilization), has been used in the analysis of Kosovo energy system both for the baseline scenario for the year 2015 and also for future scenarios for the year 2030 and 2050 respectively. This strategy enables the balance of electricity and heat demand by reducing CHP units for grid stabilization in order to improve the efficiency of the system. In Figure 1 is shown the schematic diagram and illustration of the EnergyPLAN 12.3 version.

2.2. Key Objectives Towards a Sustainable Energy System in Kosovo

Three main objectives were set for the 2030 and 2050 scenarios for Kosovo’s energy system as follows:
  • Operational flexibility enhancement through a comprehensive strategy for balancing electricity and supply in a secure and efficient manner.
  • Cutting CO2 emissions by 50% in the year 2050.
  • Reduce the coal share in the PES in both 2030 and 2050 scenarios.
The first one refers to the difficulties that Kosovo’s Energy System is facing to fulfill the demand for electricity. Considering this issue as an urgent case to be solved, in 2017 an American Company ContourGlobal has signed the agreement for the construction of new coal power plant in Kosovo [49]. The process was planned to start by the end of 2018 or in early 2019. The second objective is one of the most important and discussed topics of these times. From some measurements conducted by international organizations, Kosovo has been one of the world leader countries in regard to air pollution during winter months of 2017–2018 [50]. CO2 emissions affect not only the health of human beings and the environment, but the society as a whole [50]. Considering the above-raised issues, a well-planned and comprehensive framework for the reduction of greenhouse gases is seen as of utter importance. The third target of this study is related to the EU directives for renewable energy as one of the main obligations that have to be fulfilled by EU, EU candidates and potential countries.

2.3. Data Collection

The energy consumption by each sector in Kosovo in 2015 is shown in Table 2. Installed capacity, annual electricity generation from condensing power plant, CHP, hydro, wind and PV power plants on hourly basis were obtained from Ref. [4]. The major part of the country uses coal, wood and electricity for heating. Only 5% of country’s heat demand is met from cogeneration which actually comes from the existing CHP plant [51]. The annual heat production from cogeneration was obtained from [51].
The annual hourly electricity demand and fixed import/export distribution data for the baseline year were created based on the hourly data obtained from Kosovo Transmission System and Market Operator (KOSTT) [52]. The distribution data for the annual generation of hydro, wind and solar PV power plants in hourly basis were created based on the data obtained from Kosovo Electricity Distribution and Supply Company (KEDS) [53]. Investment cost, fixed operation & maintenance cost and lifetime for each of technologies used for electricity and heating are shown in Table 3. For both baseline and future scenarios, fuel prices for coal, diesel, petrol/JP, and biomass were assumed 0.42 Euro/GJ, 2.02 Euro/GJ, 2.16 Euro/GJ, 0.98 Euro/GJ respectively, which were obtained from Ref. [54] and for liquid petroleum gas equal to 2.88 Euro/GJ from Ref. [21]. The average price for import for the year 2015 was 51.76 Euro/MWh, while the average price for export was 33.31 Euro/MWh. The data for the average price for import/export electricity was taken from [55].

3. Kosovo Energy System

3.1. Baseline Scenario for the Year 2015

Many countries around the world have started to implement smart policies to increase the share of renewable energy, as part of the worldwide response to global warming and climate change [21]. In this study, the energy system of Kosovo was first analyzed and interpreted for the year 2015 and then the future energy systems schemes were developed using EnergyPLAN tool. The main focus of the developed strategies is to improve the functionality, reliability and adaptability in Kosovo Energy System. The electricity generation data of each power plant (condensing power plant, CHP and hydropower plant, all connected to the transmission grid) in hourly basis and also the hourly demand, and hourly import and export for the baseline year 2015 were obtained from KOSTT for the year 2015 [52]. The electricity generation data from small power plants (Hydro, Wind and Solar) connected to the distribution network was taken from KEDS [53].
The hourly electricity demand of Kosovo for 2015 is shown in Figure 2. The electricity demand for 2015 was 5.67 TWh/year. Its peak value equal to 1129 MW was recorded in 31.12.2015 at 08:00 PM. The individual electric heating demand was equal to 1.84 TWh/year, considering that around 5.98% of heating demand in Kosovo is covered from electricity [4]. Fixed import/export was –0.0689 TWh/year. It should be noted that Kosovo energy system is not fully optimized to meet the demand at every moment of time. As a result of this, the country has to import considerable amount of electricity every year.
In Figure 3 are shown the curves for total metered import/export for three different periods of the year, winter, spring and autumn. Three typically weeks of January, May and October 2015 have been selected. The negative net value of an hour represents that import surpassed export in that hour, or if the net is positive, it means that in that hour the export was higher than the import of energy for that specific amount. It can be seen that the highest negative value of the net import/export was –405 MW which was registered on January 1st 2015 h19, while the highest positive value of the net import/export was 448 MW which was registered on May 19th 2015 h4.
The major part of the electricity generation is covered by CHP plant with an installed capacity of 678 MW and the condensing power plant with an installed capacity of 610 MW [50]. The heat demand in Kosovo which is covered from cogeneration makes up 5% of the total value and in terms of energy is estimated to be 201.08 GWh. Furthermore, 0.68 TWh/year of heat demand is covered from individual coal boilers, and 2.9 TWh/year is the amount of heat that is produced from wood boilers. The total heat demand is equal to 4.02 TWh/year. Industry consumes around 3.4 TWh/year which is covered by individual coal boilers. The total transport demand in 2015 was estimated to be 4.33 TWh, from which 0.04 TWh/year was consumed by jet fuel, 3.41 TWh/year by diesel fuel, 0.75 TWh/year from petrol fuel and 0.11 TWh/year from liquid petroleum gas [4]. The CHP operates with an installed capacity of 286 MW and an electric efficiency of 37.3% [66]. The actual wind installed capacity is 1.35 MW and the estimated capacity factor is 0.02, while the installed capacity of photovoltaic systems is 0.102 MW and the estimated capacity factor is 0.13. A hydropower plant in Kosovo with an installed capacity of 35 MW is connected to the transmission network [55]. In addition, hydropower plants connected in the distribution network together make 17.98 MW installed capacity.
Considering that 97% of electricity generation in Kosovo comes from coal power plants, wind, hydro and solar power does not play such a significant role in the baseline scenario 2015. In this study, an interest rate of 3% was used as it is preferred when EnergyPLAN analyses are being performed [66]. The estimated weekly power production from all power plants together with the electricity imports and exports values for 2015 are shown in Figure 4. One can clearly see that the majority of power production was coming from fossil fuels followed by a very low percentage of hydro, solar and wind sources. A comparison of the monthly average demand value between the data extracted from KOSTT with the results obtained from modeling our system in the EnergyPLAN software is shown in Table 4. Very small differences in electricity demand data during some months of 2015 indeed represent the accuracy of the model developed in EnergyPLAN.

3.2. Energy System Scenarios for 2030 and 2050

Two scenarios were developed for 2030 and two scenarios for the year 2050 by expanding the baseline scenario 2015 and the 2020 scenario from [6] considering the increase of electricity [52] and heating [4] demand. The main focus of the future scenarios was related to the increase of RES in the total PES while introducing new technologies such as wind, solar, hydro, biodiesel and biopetrol plants and new CHP. The definition and proper management of the CEEP regulation strategy is essential for the stability and security maintenance in the system. If the latest not managed properly, the export electricity rates can overpass the transmission line capacity leading to fundamental damages in power system such as the breakdown in electricity supply. According to [52] Kosovo electricity demand is expected to increase from 5.67 TWh in 2015 to 6.8 TWh in 2030 and to 8.68 TWh in 2050 equal to an average annual rise of 1.04%. The total heat demand based on [4] will increase to 4.84 TWh in 2030 and to 6.2 TWh in 2050. In 2030, 1.16 TWh will be covered from biomass boilers, 2.30 TWh from biomass micro CHP, 0.01 TWh from heat pumps, 0.28 TWh from electric heating, 0.10 TWh from solar thermal and 0.96 TWh from cogeneration. The corresponding values for 2050 are 0.595, 4.72, 0.02, 0.14, 0.21 and 0.49 TWh. The values are in accordance with the simulation results extracted from EnergyPLAN. The distribution data files for the future scenarios were taken the same as in the baseline case, except those for solar PV and wind. The distribution data for district heating were provided from EnergyPLAN.
The proposals made for scenarios 2030 and 2050 are presented in Table 5.
Scenario 2 for 2030 is the same as scenario 1 for 2030, apart from one different proposal:
  • One unit of CHP plant with 339 MW installed capacity was substituted with a hydropower plant of the same capacity.
Scenario 2 for 2050 introduces CCS technology as part of the coal-based power plant. Other values used to create the model of the energy system of Kosovo in the year 2050 do not differ from the first scenario.

4. Results and Discussion

4.1. Technical Analysis

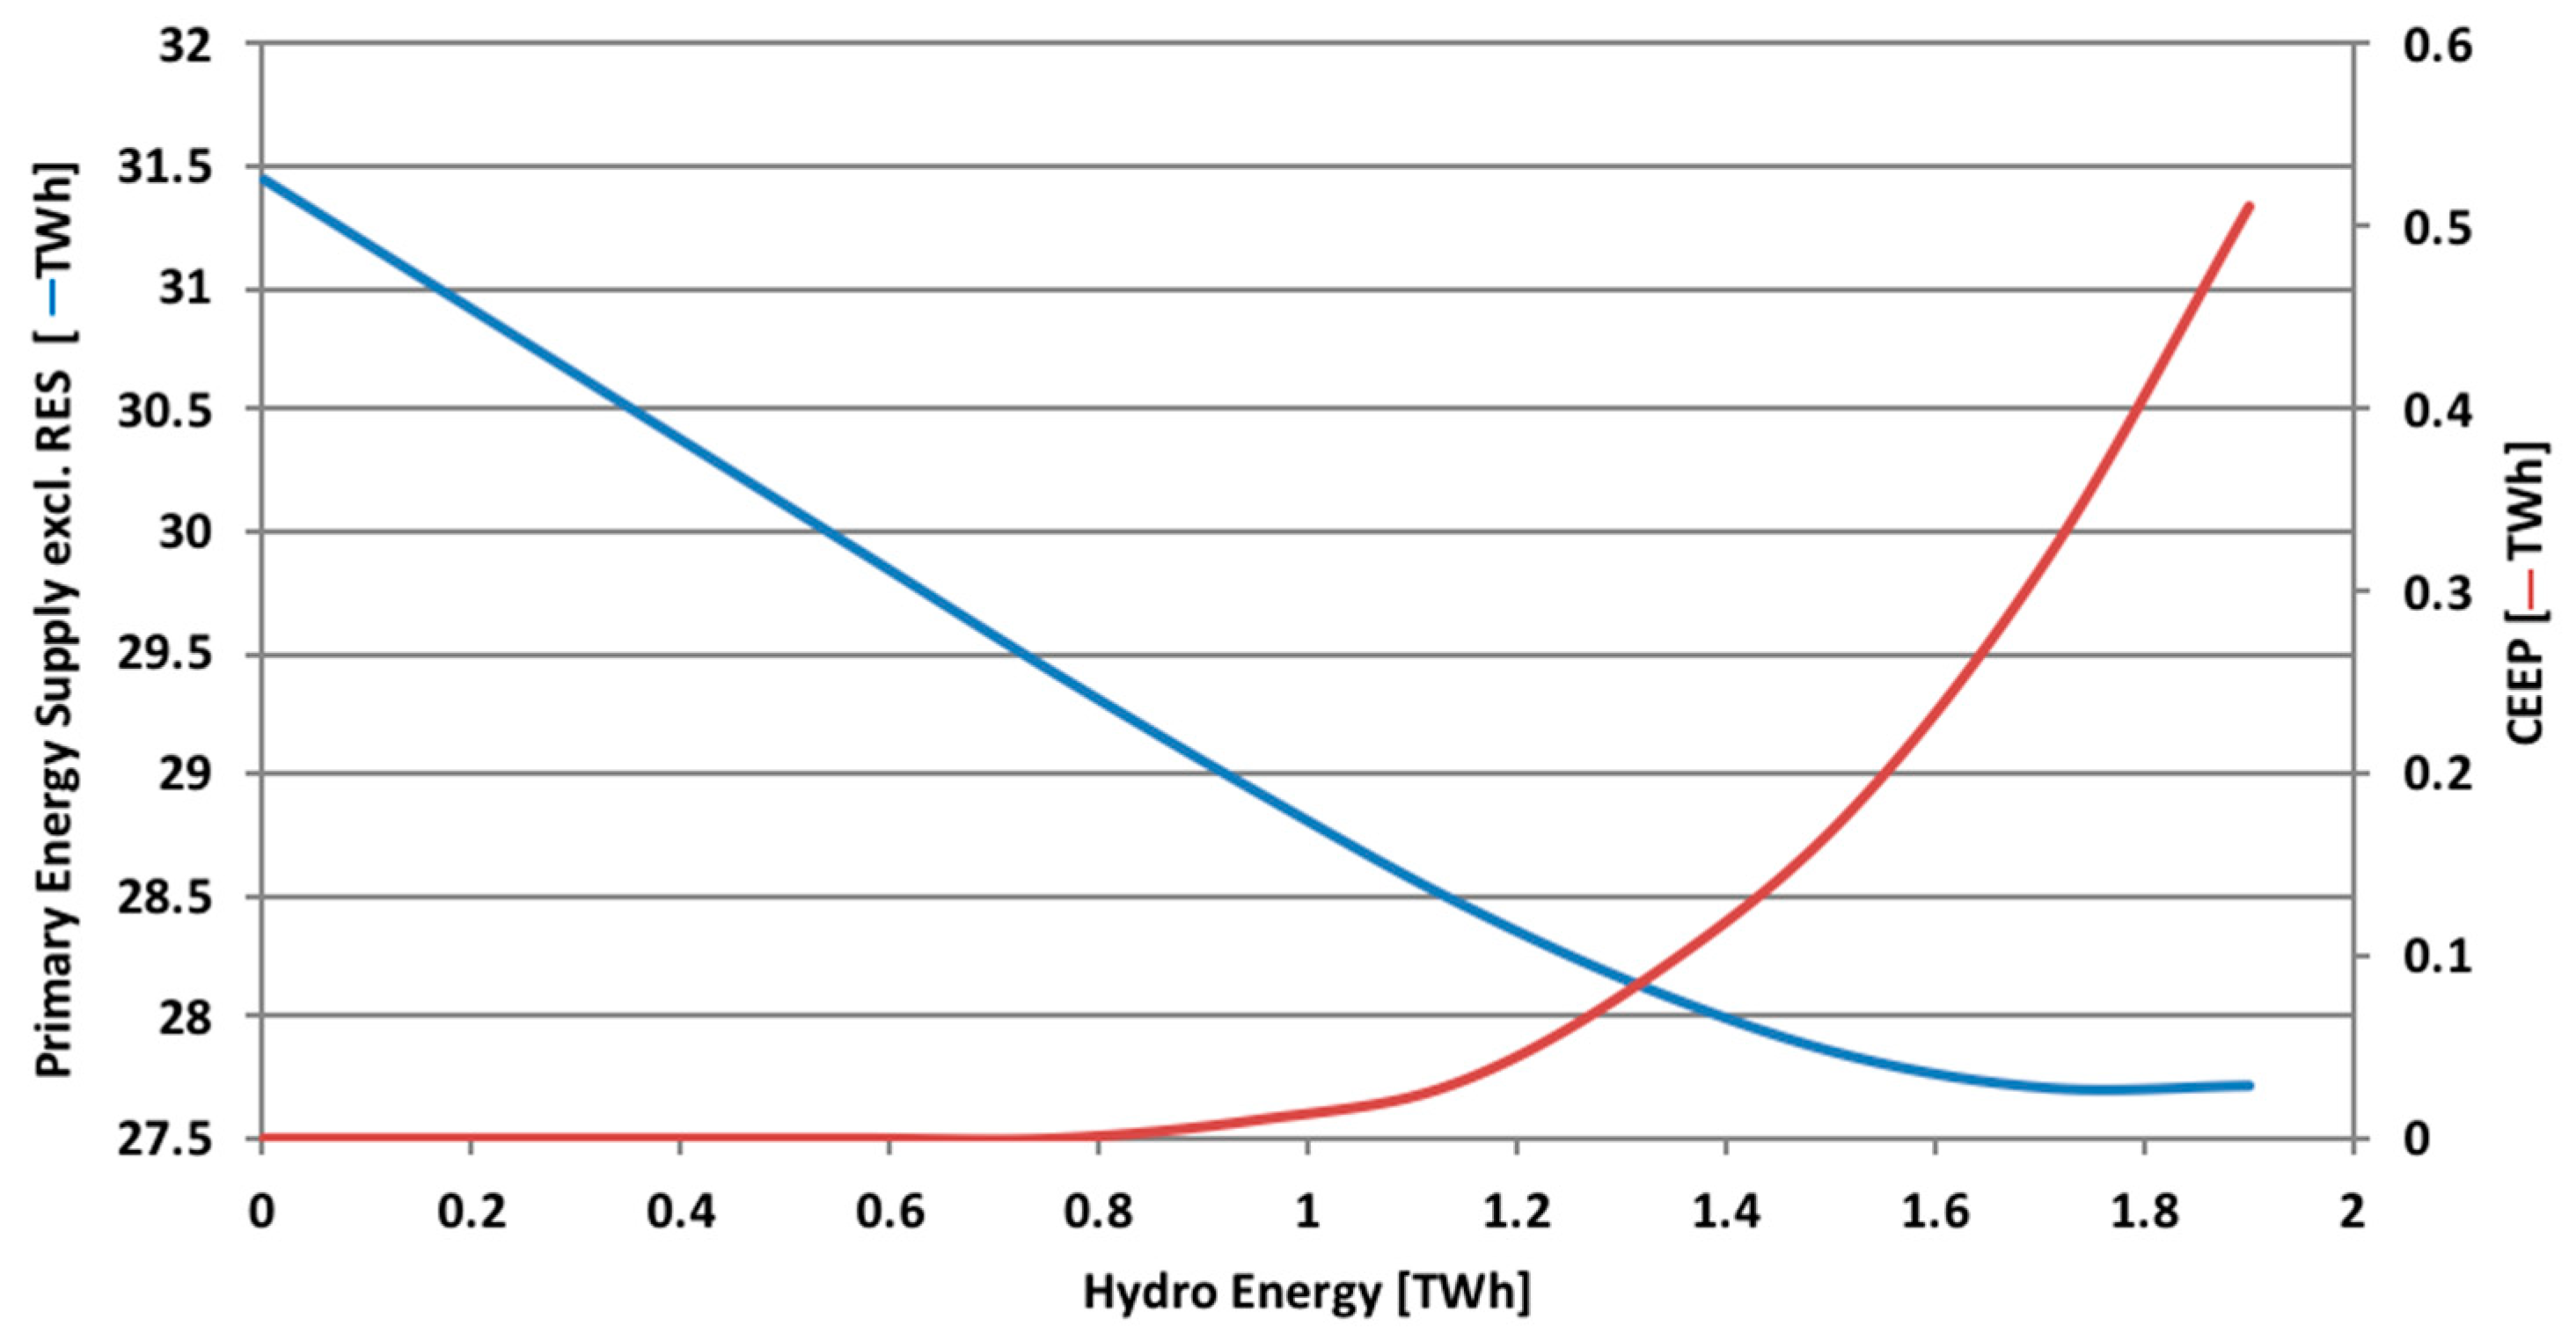
In the year 2030, total energy generated from all available power plants was estimated to be 7.86 TWh in the first scenario and 8.39 TWh in the second scenario. Further, the electricity demand is expected to rise to 6.8 TWh in 2030, consequently leading to an imbalance between electricity supply and demand with a spotlight initiative to an increase of excess electricity. The CEEP is not allowed to reach higher values than capacities of transmission lines. In order to avoid that, proper technical regulation strategies are applied in this study. Based on the renewable source potential of Kosovo and in the [6], the optimal solution towards a feasible and sustainable energy system in Kosovo is to increase the investments in hydropower technology. However, due to the great potential of solar energy in Kosovo [67,68], exploration of photovoltaics and solar thermal technologies was also considered in this paper. In the scenario for 2030 hydropower plays the main role in the renewable energy supply. Therefore, simulations were run by varying its production from 0 to 1.9 TWh in steps of 0.19 TWh as it can be seen in the Figure 5. Then data for CEEP, electricity import, and PES were analyzed and interpreted. It can be observed that with the increase of electricity production from hydropower plants, there will be a decrease in the value of PES, leading to the occurrence of CEEP equal to 0.09 TWh. The reason behind the decrease of PES is the exclusion of renewable energy sources from its total value. The curves of PES and CEEP meet each other in the point where hydro energy is estimated to be 1.33 TWh, which is sufficient to replace the energy produced from PES. Furthermore with the continuing increase of hydro energy to a value greater than 1.6 TWh, the PES remains constant due to its technical minimum limitations, while CEEP revealed a further increase. This analysis was performed considering a closed energy system. Practically, Kosovo has transmission line capacity of 1250 MW, which allows this electricity surplus to be exported [69].
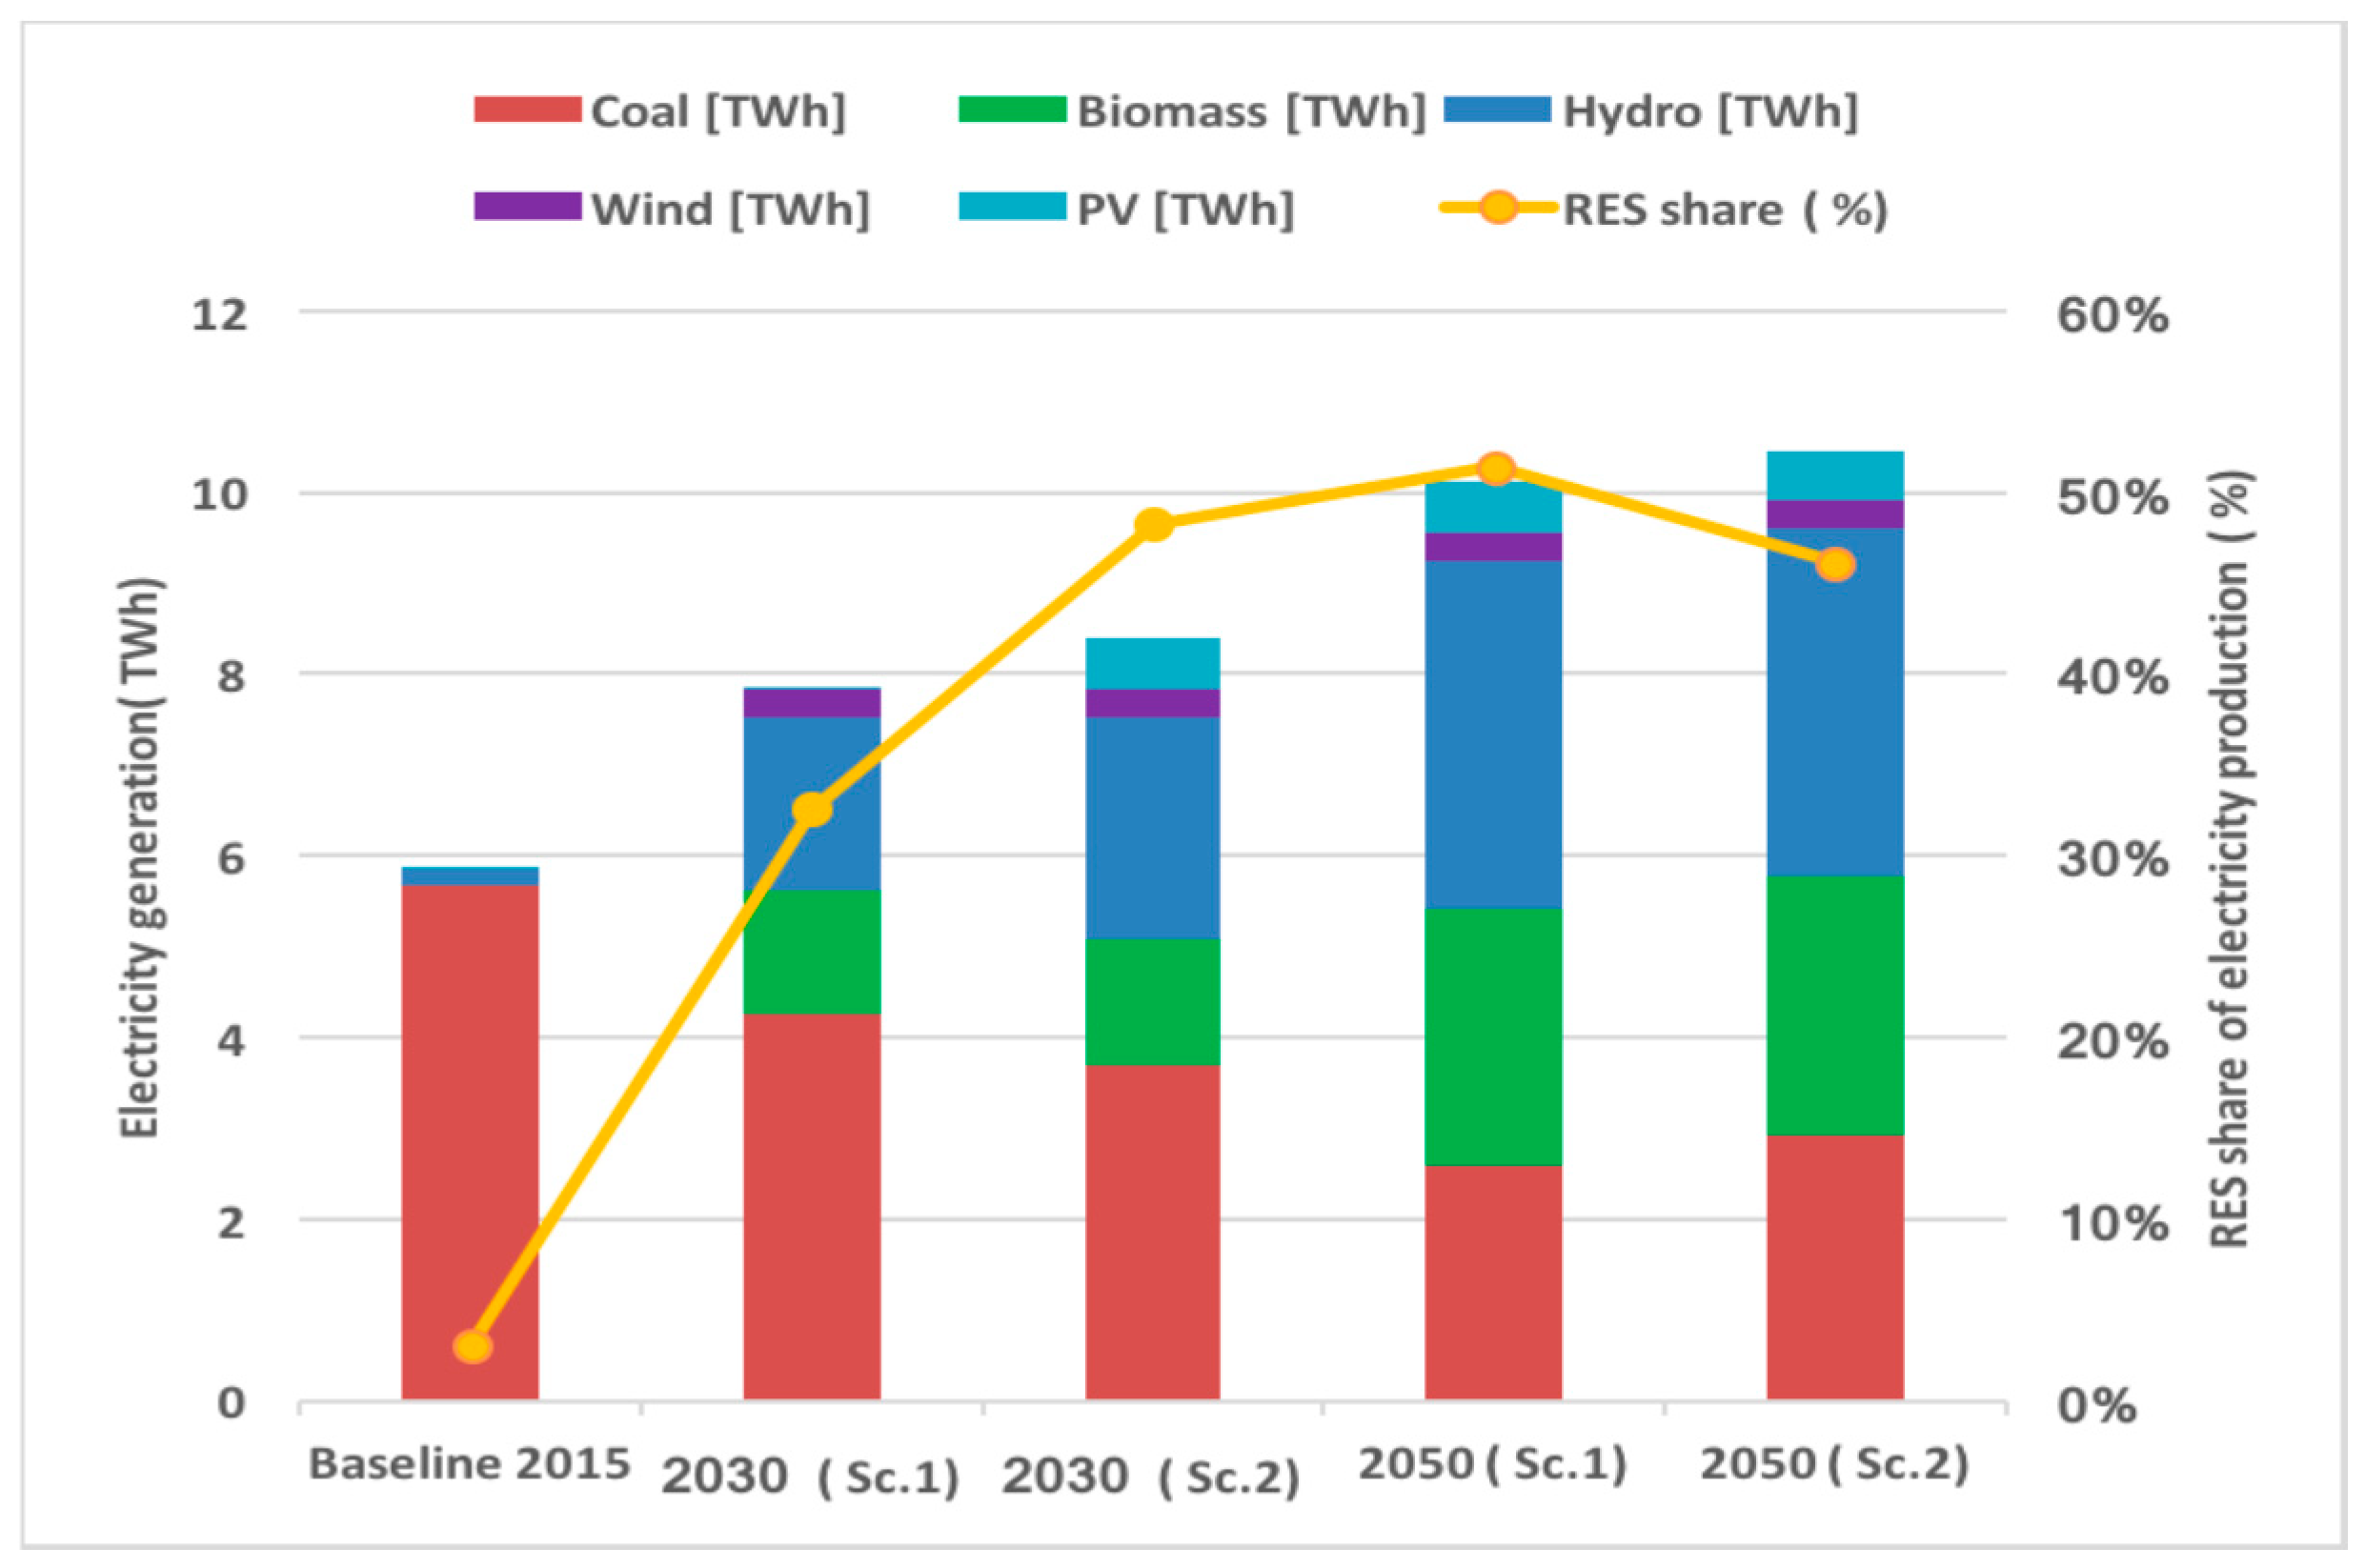
The contribution of each renewable and non-renewable based technology used for electricity generation purposes such as hydro, wind, PV and coal in the baseline scenario 2015 and for scenarios for 2030 and 2050 are shown in Figure 6. In the year 2015 coal was by far the biggest source used for generation of electricity with 5.68 TWh, followed by hydro with 0.17 TWh, wind with 0.071 GWh and 0.109 GWh from PV which actually had the smallest impact on electricity generation. Fixed import/export is estimated to be –0.07 TWh. It should be noted that Kosovo exports a considerable amount of electricity during night hours in the spring season. However, this amount of electricity is exported at very low prices due to the period when it is exported and market-related issues.
Regarding the cases for 2030, the production mix differs from 2015. Based on obtained results, coal is still the main source for power production but its share decreases from 97% in 2015 to 54% in 2030 (case 1) and 47% in 2030 (case 2). Production from hydro and biomass are the main cause for reduced share of coal. The electricity generation from coal, biomass, hydro, wind and PV in the scenario 1 for 2030 was 4.25, 1.38, 1.9, 0.31 and 0.02 TWh respectively. In the scenario 2 for 2030, hydropower generation was increased to 2.45 TWh and a decrease to 3.69 TWh electricity generated from coal power plants was observed.
The above corresponding values for the first scenario 2050 were 2.59, 2.83, 3.83, 0.31 and 0.56 TWh respectively. The integration of CCS technology in the model of the second scenario for 2050 with the ability to capture 3 Mt CO2 with an electricity consumption factor (per unit) of 0.37 MWh/t CO2 has led to a reduction of CO2 emissions from 3.72 Mt to 1.02 Mt in 2050. Furthermore, the electricity demand was increased from 8.69 to 9.79 TWh while the energy generated from the coal-based power plant was increased from 2.59 to 2.93 TWh, considering that CCS technology requires additional energy during the carbon capture process. The energy generated from other power plants remains the same in both scenarios for 2050. The renewable sources have contributed with 3%, 32.5%, 48.2%, 51.4% and 46.1% in total electricity generation, in baseline and future scenarios.
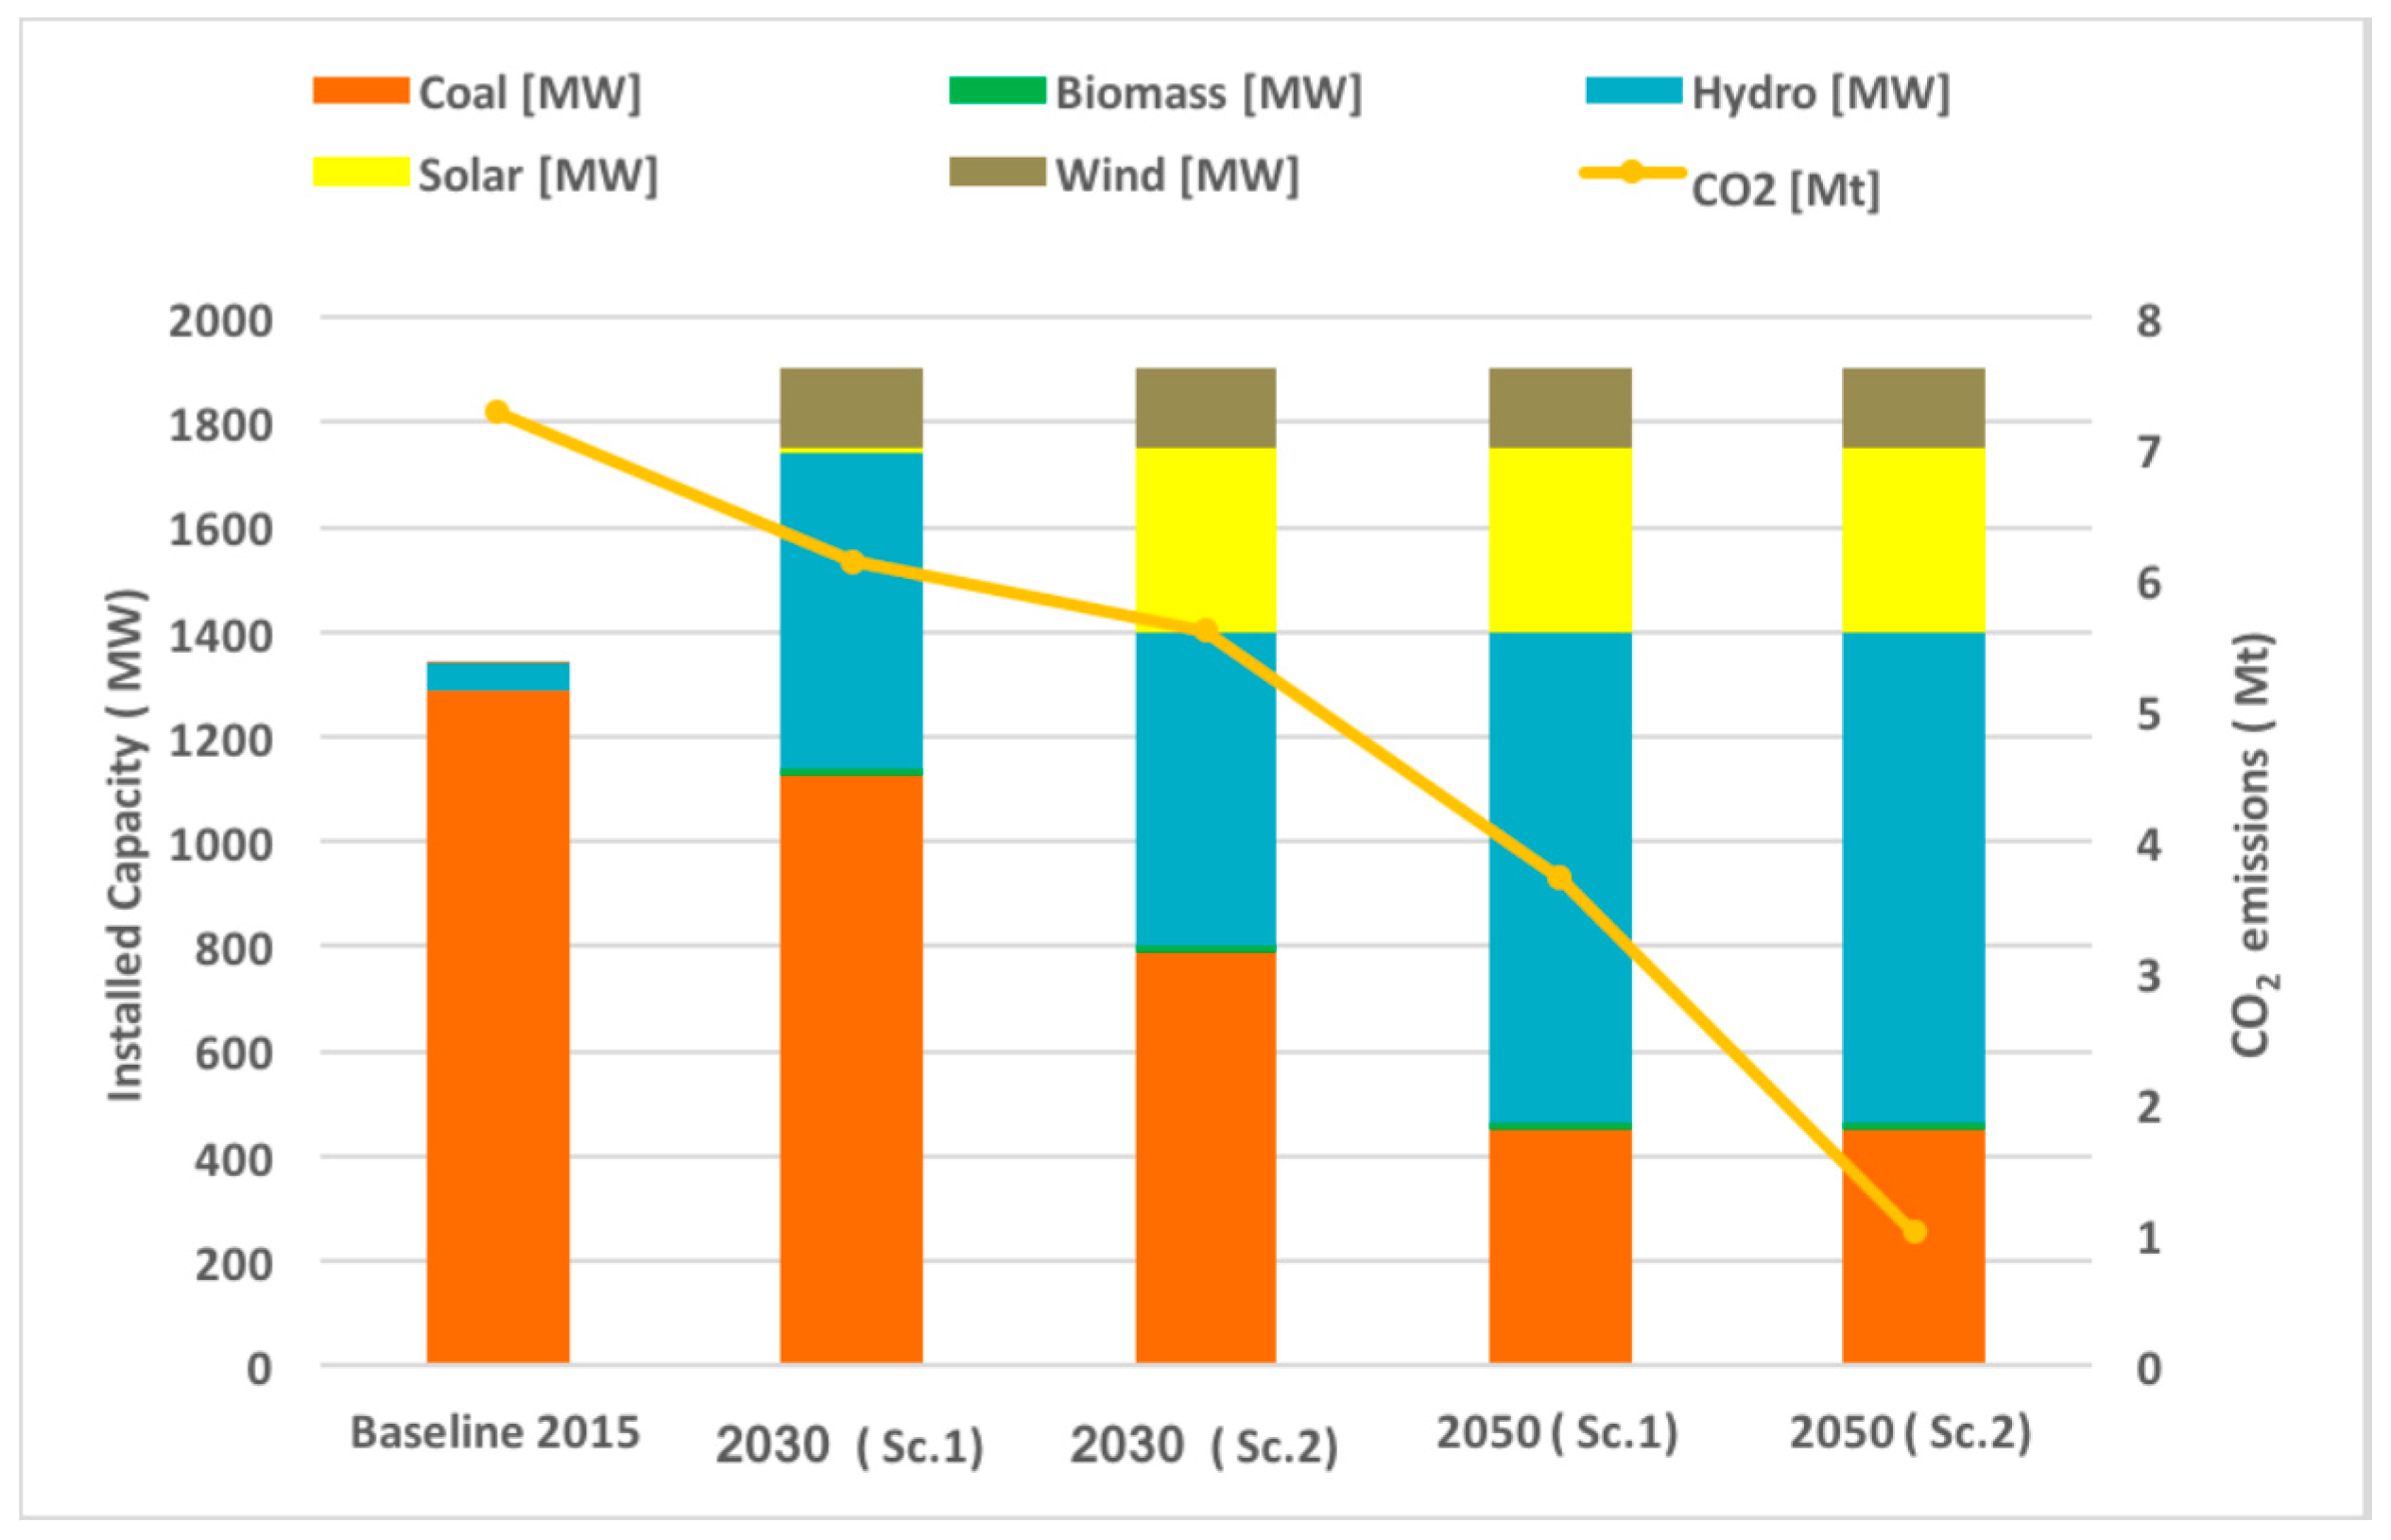
The installed capacity of all power plants and CO2 emission rates throughout the studied years are presented in Figure 7. It can be observed that the share of coal in the PES has been notably reduced from 2015 to 2050 after the decommissioning of coal power plants Kosova A in 2030 and Kosova B in 2050, which have basically over passed the limited lifetime by the time when they are retired. Hydropower development was given priority. Consequently, hydropower overtakes coal, in this way leading as the largest source of power generation with a total 936 MW installed capacity in 2050. The goal of 349 MW of installed PV capacity was set for 2050. The installed onshore wind capacity in 2050 remains the same from 2030, due to its weak potential in Kosovo.
The values of heat and transport demand supplied by various existing and new technologies integrated into the energy system of Kosovo is shown in Figure 8.
In 2015 biomass boilers were the most used technology for heat generation resulting in 2.95 TWh generated heat. In scenarios, for 2030 and 2050 biomass micro CHP contributed with 2.3 and 4.72 TWh respectively. 80% of heat demand was covered by renewable sources in 2050. Heat pumps are less impactful both in 2030 and 2050 scenarios. Electric heating was reduced as well from 2030 to 2050. The decrease in the installed capacity of CHP from 2030 to 2050 was reflected in the reduction of cogeneration heat values. Considering the harmful environmental impact of coal boilers, they have been replaced with other technologies in both 2030 and 2050 scenarios. Regarding the transport sector, no renewable source was used in this sector in 2015. In 2030, we aimed to have 20% of transport demand covered by renewables (biodiesel and bioethanol). In 2050, a strategy towards 50% renewable energy in the transport sector, with the largest share of biodiesel production was developed. Furthermore, 5% increase in electric cars in the future scenarios was carefully investigated. In order to provide a clearer representation, the scenario 2 for 2030 and 2050 was not presented as part of the graph, since the participation of technologies for heat and transport demand supply are the same in both first and second scenarios for 2030 and 2050.
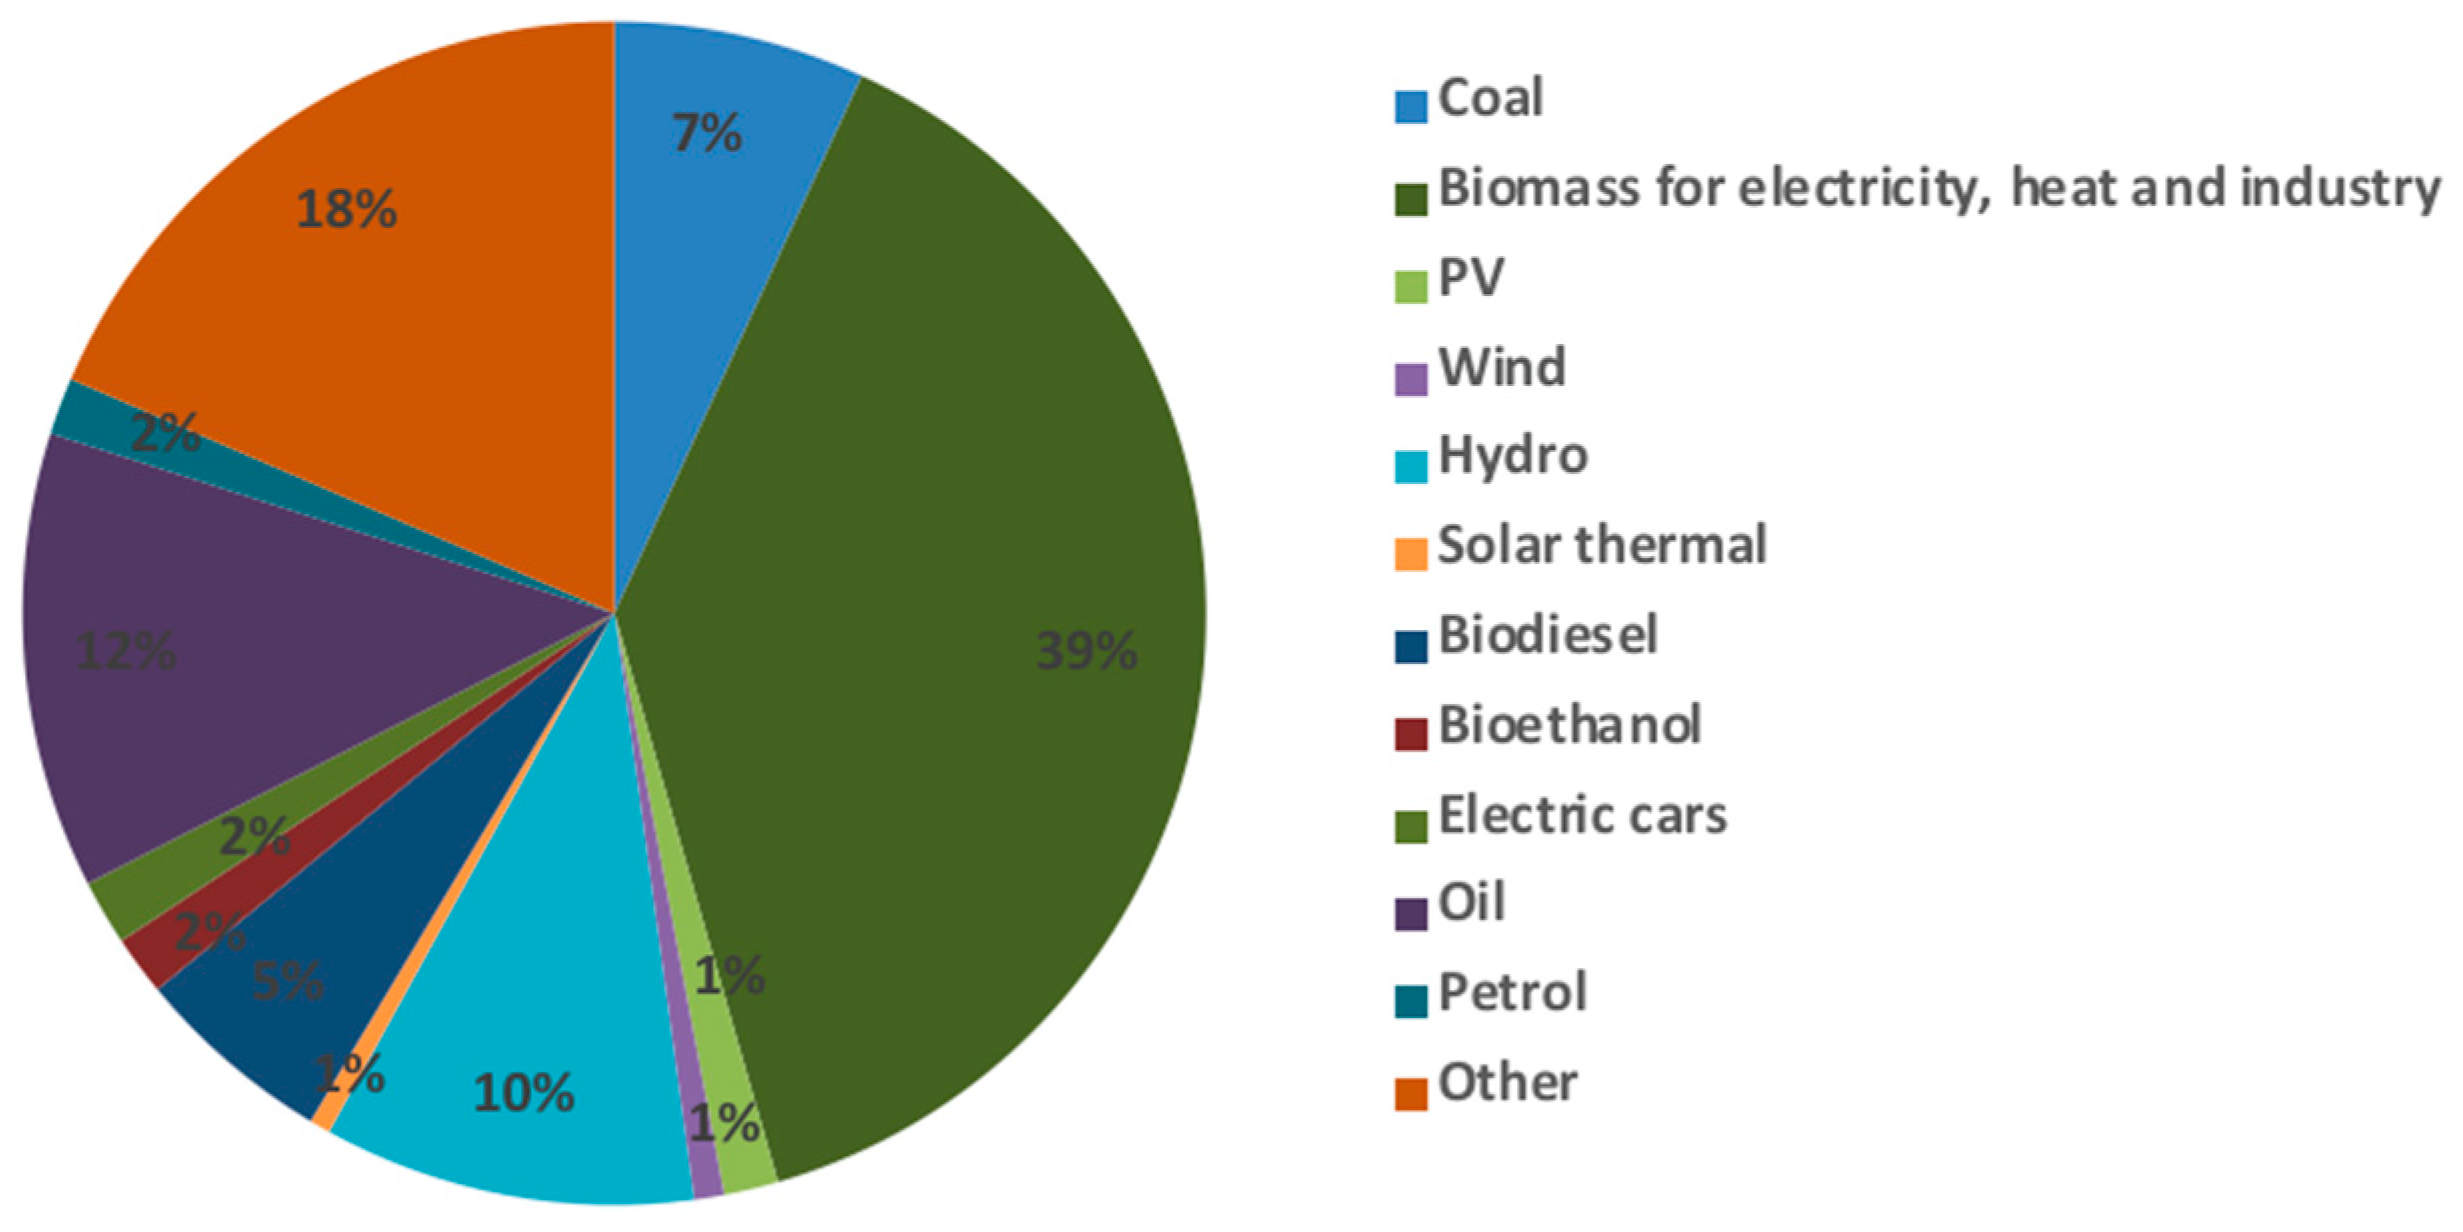
The contribution of each technology in fulfilling the electricity, heat, transport and industry demand in the year 2050 is presented in the Figure 9. Primary energy consumption is expected to increase from 63.45 PJ in 2015 to 88.42 and 135.65 PJ in 2030 and 2050. Biomass, hydro and oil are the most used energy sources in electricity, heat, transport and industry sectors in the year 2050. Biomass covers 39% of electricity, heat and industry demand. The oil fuels and hydropower share in PES is 12% and 10% respectively.

4.2. Environmental Analysis

The CO2 emissions in 2015, 2030, 2030 (1), 2050 and 2050 (1) were 7.2, 6.1, 5.6, 3.7 and 1 Mt as it can be observed from Figure 7 (Section 4.1). It should be noted that the decommission of coal power plant Kosova B and investments in renewable technologies has led to a decrease of CO2 emissions from around 7 Mt to less than 4 Mt CO2 and 1 Mt CO2 (if CCS technology is applied) from 2015 to 2050. Special attention in future scenarios was given to hydro and solar-based technologies as the main contributors to the decline of CO2 emissions.
Considering that Kosovo is ranked the fifth country in the world with the highest reserves of lignite, an investigation of CCS technology and its possible implementation in the new coal power plant in Kosovo was conducted in the second scenario for 2050. Two simulation case studies were performed with and without CCS technology implemented in coal power plant in 2050. From the Figure 10 we can observe that with the continuing increase of the amount of electricity generated from hydropower plants, the RES is continually increased. Further, CO2 emissions are reduced with the increase of renewable energy share. CO2 emission are double reduced in the case when the CCS is implemented. It is worth pointing out that, the integration of CCS technology had led to a decrease of RES in total electricity production from 51.4% to 46.1%.

4.3. Cost Analysis

The total investment, fixed O&M cost and annual investment of each technology are shown in Figure 11. The below costs in scenarios for 2030 and 2050 are higher compared to the values in the baseline case, due to additional investment in renewable energy systems and also in the construction of new CHP. The corresponding values are even higher in the second scenario for 2030 and 2050 due to the integration of new hydropower units and other renewable energy technologies. Indeed, the increase of RES percentage is accompanied with higher annual investment cost, due to the additional integration of new technologies in electricity, heat and transport sectors. The annual cost of designing and maintaining a 70% renewable energy system in the state of Kosovo by the year 2050 is approximately 1 Billion Euros. Further, the total annual cost in 2050 is increased from 999 to 1033 million euros if CCS technology is implemented as part of the coal-based power plant. Therefore, due to the high cost of investment, the CCS technology was considered as part of 2050 scenario. The decline in the price of RES technologies indeed has an impact on the fall of the cost of energy generated from these sources. The remarkable fall of the cost of renewable-based power production especially recorded in the last years has become a key factor why renewable power is becoming very competitive to meet the energy needs of future generations. In addition, the improvement of manufacturing efficiency has attributed to this decline by lowering the cost of producing the latter technologies.

4.4. Comparative Analysis

A comparative analysis of the scenarios developed under this study is given in this section. Four strategies were developed aiming to create a comprehensive roadmap of the future energy system of Kosovo by the year 2030 and 2050. Future scenarios were modeled taking into consideration technical, environmental and cost constraints. Two scenarios performed for 2030 were based on available strategies developed by Government of Kosovo and other institutions considering Kosovo’s renewable energy potential. Nevertheless, in the upcoming years, the technical potential of renewables in Kosovo will be further exploited, putting the 2050 strategy to work. On the other hand, the first scenario for the year 2030 can be realistically designed and well-implemented. The second one for 2030 lacks of providing a documented potential of hydro availability, which is reflected in the 2050 strategy as well. The 100% renewable energy system was not investigated in this study, considering that a new coal-based power plant in Kosovo will be constructed, in this way making not realistic for Kosovo to run entirely in renewable energy. However, opportunities will not close for Kosovo to run in nearly zero-carbon energy system by the year 2050, if introducing CCS technology as it was conducted in the second scenario for 2050. Adverse environmental impacts of coal reflected in the people’s health highlights the importance of the second scenario for 2050 compared to the first one, to be considered and addressed carefully for future possible implementation. Alternatively, the first scenario of 2050 can be implemented if cost or availability of natural sources required for the development of CCS technology are viewed as a strong barrier to progress. Even though, the total annual cost is not notably increased when introducing CCS. All scenarios represent approaches for the planning of the future energy system in Kosovo which have to be further evaluated considering the future exploitation of renewable and financial sources. Notwithstanding the above issues and their possible effect which can be reflected in small variations within scenarios, the goal of a flexible and sustainable energy system in Kosovo can be certainly achieved and implemented successfully.

5. Conclusions

A step by step realistic approach for energy planners and policymakers considering both technical, environmental and cost analysis towards sustainability enhancement and strategic energy management framework within the future energy system in Kosovo was developed in this paper. The baseline energy system of Kosovo in the year 2015 was first analyzed and then four scenarios were developed, two for the year 2030 and two for the year 2050. The assessment was conducted using EnergyPLAN simulation tool. A systematic investigation of alternative strategies for future energy system was carried out considering the raise of energy demand in electricity, heat, industry and transport sectors. To perform this study, we were based on the current strategies developed by the Government of Kosovo, other institutions within and outside the country as well as in European Renewable Energy Directives. Energy generated from renewable sources was 14.8%, 34.1%, 38.4%, 69.7% and 68.3% in scenarios for the years 2015, 2030 and 2050 respectively. Indeed, introducing renewable based technologies such as wind, hydro, solar, biomass covers not only the security of supply related issues but the environmental and societal aspects as well. A comprehensive strategy to design a secure, flexible and environmentally-friendly energy system through reduction of CO2 emissions from 7 Mt CO2 to less than 4 Mt CO2 and 1 Mt (if CCS technology is applied) from 2015 to 2050 has been realistically proposed and designed through detailed modeling and simulations in the EnergyPLAN tool. The overall estimated annual cost of designing, developing and maintaining a 70% renewable energy system by the year 2050 is around 1 billion euros. Since 97% of electricity generation in Kosovo comes from coal power plants, the modeling of an energy system with high penetration of renewable energy sources to replace the base load coal with alternative base load sources is seen as crucial for a reliable operation of the system and the health of society. Moreover, the results obtained with respect to the methodology used for the development of scenarios for the years to come (2030 and 2050) are completely novel compared to the existing literature and at the same time open a new path for energy policy makers as well as for researchers who work on the institutions for energy transition and sustainability.

6. Future Work

The future work arising from the current study will deal with market-economic simulation analysis. The transition approach of the Kosovo Transmission System and Market Operator (KOSTT) to join European Network of Transmission System Operators for Electricity (ENTSOE) is strong related to the electricity market issues which indeed have to be analyzed and investigated in order to fully optimize and further enhance the power transmission network of Kosovo.

Author Contributions

Author N.I. has conceived and designed the analysis, collected the data, worked on the analysis tool and wrote the paper. Author A.G. has supervised the work, proposed the methodology and reviewed the paper. Author A.S. has conceived and designed the analysis, collected the data, worked on the analysis tool by mainly performing simulations and give feedback on the written part of the paper. Authors N.I., A.S. and A.G. have improved the paper based on the comments of the reviewers to whom we are indeed very thankful.

Funding

The APC was funded by NTNU.

Acknowledgments

The authors would like to acknowledge the KOSTT, KEDS, ERO and other companies for providing the necessary data without which this work would not have been made possible.

Conflicts of Interest

The authors declare no conflict of interest.

Abbreviations

The following abbreviations are used in this manuscript:
CCSCarbon Capture and Sequestration
PESPrimary Energy Supply
CEEPCritical Excess Electricity Production
RESRenewable Energy Share
KOSTTKosovo Transmission System and Market Operator
KEDSKosovo Electricity Distribution and Supply Company
EROEnergy Regulatory Office
ENTSOEEuropean Network of Transmission System Operators for Electricity
EUEuropean Union
CHPCombined heat and power
SEESouth East Europe (The SEE region consists of Albania, Bosnia and Herzegovina, Bulgaria, Croatia, Greece, Macedonia, Montenegro, Romania, Serbia, Slovenia and Kosovo)
H2RESEnergy planning software for optimization of microgrid components sizing

References

  1. Nations, U. Annual assessment of progress towards the sustainable development goals. In The Sustainable Development Goals Report 2016; Department of Economic and Social Affairs of the United Nations, United Nations Publications: New York, NY, USA, 2016. [Google Scholar]
  2. Kittner, N.; Dimco, H.; Azemi, V.; Tairyan, E.; Kammen, D.M. Sustainable Energy Pathways for Kosovo; Technical report. Kosovo Civil Society Consortium for Sustainable Development, 2014. Available online: https://www.kosid.org/file/repository/Sustainable_Energy_for_Kosovo_Energy_Policy_kosid.pdf (accessed on 26 August 2019).
  3. International Energy Agency. CO2 Emissions from Fuel Combustion Highlights; Technical Report; International Energy Agency, Office of Management and Administration International Energy Agency: Paris, France, 2016. [Google Scholar]
  4. Ministry of Economic Development, Republic of Kosovo. Annual Energy Balance of Republic of Kosovo for the Year 2016; Annual Report; Ministry of Economic Development, Republic of Kosovo, Ministry of Economic Development: Pristina, Kosovo, 2015. [Google Scholar]
  5. House of Lords, European Union Committee. The EU’s Target for Renewable Energy: 20% By 2020; Technical Report; House of Lords, European Union Committee: London, UK, 2012. [Google Scholar]
  6. National Renewable Energy Action Plan (NREAP) 2011–2020; Technical Report; Ministry of Economic Development: Pristina, Republic of Kosovo, 2013.
  7. European Commission. A Policy Framework for Climate and Energy in the Period from 2020 to 2030; Technical Report; European Commission: Brussels, Belgium, 2014. [Google Scholar]
  8. Dincer, I. Renewable energy and sustainable development: A crucial review. Renew. Sustain. Energy Rev. 2000, 4, 157–175. [Google Scholar] [CrossRef]
  9. Buran, B.; Butler, L.; Currano, A.; Smith, E.; Tung, W.; Cleveland, K.; Buxton, C.; Lam, D.; Obler, T.; Rais-Bahrami, S.; et al. Environmental benefits of implementing alternative energy technologies in developing countries. Appl. Energy 2003, 76, 89–100. [Google Scholar] [CrossRef]
  10. Leaman, C. The benefits of solar energy. Renew. Energy Focus 2015, 16, 113–115. [Google Scholar] [CrossRef]
  11. Mohtasham, J. Review Article-Renewable Energies. Energy Procedia 2015, 74, 1289–1297. [Google Scholar] [CrossRef] [Green Version]
  12. Kabashi, S.; Bekteshi, S.; Ahmetaj, S.; Kabashi, G.; Najdovski, D.; Zidanaiek, A.; Alaus, I. Effects of Kosovo’s energy use scenarios and associated gas emissions on its climate change and sustainable development. Appl. Energy 2011, 88, 473–478. [Google Scholar] [CrossRef]
  13. Jebaraj, S.; Iniyan, S. A review of energy models. Renew. Sustain. Energy Rev. 2006, 10, 281–311. [Google Scholar] [CrossRef]
  14. Jebaselvi, G.A.; Paramasivam, S. Analysis on renewable energy systems. Renew. Sustain. Energy Rev. 2013, 28, 625–634. [Google Scholar] [CrossRef]
  15. Yu, L.; Li, Y.P.; Huang, G.H.; Fan, Y.R.; Yin, S. Planning regional-scale electric power systems under uncertainty: A case study of Jing-Jin-Ji region, China. Appl. Energy 2017. [Google Scholar] [CrossRef]
  16. Du, W.J.; Chen, X.; Wang, H.F. PLL Performance Evaluation Considering Power System Dynamics for Grid Connection of Renewable Power Generation. J. Environ. Inf. 2018, 32, 55–62. [Google Scholar] [CrossRef] [Green Version]
  17. Li, W.; Bao, Z.; Huang, G.H.; Xie, Y.L. An Inexact Credibility Chance-Constrained Integer Programming for Greenhouse Gas Mitigation Management in Regional Electric Power System under Uncertainty. J. Environ. Inf. 2017, 35, 111–122. [Google Scholar] [CrossRef]
  18. Nie, S.; Huang, Z.C.; Huang, G.H.; Yu, L.; Liu, J. Optimization of electric power systems with cost minimization and environmental-impact mitigation under multiple uncertainties. Appl. Energy 2018, 221, 249–267. [Google Scholar] [CrossRef]
  19. Cosic, B.; Krajacic, G.; Markovska, N.; Bjelić, I.B.; Rajaković, N.; Duić, N. 100% Renewable Energy Solutions for Regions: the Case of South East Europe. In Proceedings of the XXIX medjunarodno savjetovanje ENERGETIKA, Zlatibor, Serbia, 26–29 March 2013. [Google Scholar]
  20. Cosic, B.; Krajacic, G.; Duic, N. A 100% renewable energy system in the year 2050: The case of Macedonia. Energy 2012, 48, 80–87. [Google Scholar] [CrossRef] [Green Version]
  21. Lund, H.; Mathiesen, B. Energy system analysis of 100% renewable energy systems—The case of Denmark in years 2030 and 2050. Energy 2009, 34, 524–531. [Google Scholar] [CrossRef]
  22. Krajacic, G.; Duic, N.; da Graca Carvalho, M. How to achieve a 100% RES electricity supply for Portugal? Appl. Energy 2011, 88, 508–517. [Google Scholar] [CrossRef]
  23. Safian, F. Modelling the Hungarian energy system-The first step towards sustainable energy planning. Energy 2014, 69, 58–66. [Google Scholar] [CrossRef]
  24. Connolly, D.; Lund, H.; Mathiesen, B.; Leahy, M. Modelling the existing Irish energy-system to identify future energy costs and the maximum wind penetration feasible. Energy 2010, 35, 2164–2173. [Google Scholar] [CrossRef]
  25. Krajacic, G.; Duic, N.; Zmijarevic, Z.; Mathiesen, B.V.; Vucinic, A.A.; da Graca Carvalho, M. Planning for a 100% independent energy system based on smart energy storage for integration of renewables and CO2 emissions reduction. Appl. Therm. Eng. 2011, 31, 2073–2083. [Google Scholar] [CrossRef] [Green Version]
  26. Elliston, B.; Diesendorf, M.; MacGill, I. Simulations of scenarios with 100% renewable electricity in the Australian National Electricity Market. Energy Policy 2012, 45, 606–613. [Google Scholar] [CrossRef]
  27. Suri, M.; Huld, T.A.; Dunlop, E.D.; Ossenbrink, H.A. Potential of solar electricity generation in the European Union member states and candidate countries. Sol. Energy 2007, 81, 1295–1305. [Google Scholar] [CrossRef]
  28. McFarland, J.R.; Herzog, H.J. Incorporating carbon capture and storage technologies in integrated assessment models. Energy Econ. 2006, 28, 632–652. [Google Scholar] [CrossRef] [Green Version]
  29. Siefert, N.S.; Chang, B.Y.; Litster, S. Exergy and economic analysis a CaO-looping gasifier for IGFC-CCS and IGCC-CCS. Appl. Energy 2014, 128, 230–245. [Google Scholar] [CrossRef]
  30. Olateju, B.; Kumar, A. Techno-economic assessment of hydrogen production from underground coal gasification (UCG) in Western Canada with carbon capture and sequestration (CCS) for upgrading bitumen from oil sands. Appl. Energy 2013, 111, 428–440. [Google Scholar] [CrossRef]
  31. Zhou, W.; Zhu, B.; Fuss, S.; Szolgayovai, J.; Obersteiner, M.; Fei, W. Uncertainty modeling of CCS investment strategy in China’s power sector. Appl. Energy 2010, 87, 2392–2400. [Google Scholar] [CrossRef]
  32. Zhu, L.; Fan, Y. A real options-based CCS investment evaluation model: Case study of China’s power generation sector. Appl. Energy 2011, 88, 4320–4333. [Google Scholar] [CrossRef]
  33. Li, M.; Rao, A.D.; Samuelsen, G.S. Performance and costs of advanced sustainable central power plants with CCS and H2 co-production. Appl. Energy 2012, 91, 43–50. [Google Scholar] [CrossRef] [Green Version]
  34. Viebahn, P.; Daniel, V.; Samuel, H. Integrated assessment of carbon capture and storage (CCS) in the German power sector and comparison with the deployment of renewable energies. Appl. Energy 2012, 97, 238–248. [Google Scholar] [CrossRef] [Green Version]
  35. Pettinau, A.; Ferrara, F.; Amorino, C. Techno-economic comparison between different technologies for a CCS power generation plant integrated with a sub-bituminous coal mine in Italy. Appl. Energy 2012, 99, 32–39. [Google Scholar] [CrossRef]
  36. Duan, H.B.; Fan, Y.; Zhu, L. What’s the most cost-effective policy of CO2 targeted reduction: An application of aggregated economic technological model with CCS? Appl. Energy 2013, 112, 866–875. [Google Scholar] [CrossRef]
  37. Li, H.; Yan, J. Impacts of equations of state (EOS) and impurities on the volume calculation of CO2 mixtures in the applications of CO2 capture and storage (CCS) processes. Appl. Energy 2009, 86, 2760–2770. [Google Scholar] [CrossRef]
  38. Liang, X.; Reiner, D.; Li, J. Perceptions of opinion leaders towards CCS demonstration projects in China. Appl. Energy 2011, 88, 1873–1885. [Google Scholar] [CrossRef]
  39. Arnette, A.N. Renewable energy and carbon capture and sequestration for a reduced carbon energy plan: An optimization model. Renew. Sustain. Energy Rev. 2017, 70, 254–265. [Google Scholar] [CrossRef]
  40. Leung, D.Y.; Caramanna, G.; Maroto-Valer, M.M. An overview of current status of carbon dioxide capture and storage technologies. Renew. Sustain. Energy Rev. 2014, 39, 426–443. [Google Scholar] [CrossRef] [Green Version]
  41. Assessment of CO2 Storage Potential in Europe. Available online: https://ec.europa.eu/energy/sites/ener/files/documents/56-2014%20Final%20report.pdf (accessed on 21 May 2019).
  42. Voll, D.; Wauschkuhn, A.; Hartel, R.; Genoese, M.; Fichtner, W. Cost Estimation of Fossil Power Plants with Carbon Dioxide Capture and Storage. Energy Procedia 2012, 23, 333–342. [Google Scholar] [CrossRef] [Green Version]
  43. Kozlova, M.; Yeomans, J.S. Multi-Variable Simulation Decomposition in Environmental Planning: An Application to Carbon Capture and Storage. J. Environ. Inf. Lett. 2019, 1, 20–26. [Google Scholar] [CrossRef] [Green Version]
  44. Republic of Kosovo, Ministry of Foreign Affairs. Mining and Energy in Kosovo. Available online: http://www.mfa-ks.net/?page=2,197,2266, 2015 (accessed on 11 March 2018).
  45. Connolly, D.; Lund, H.; Mathiesen, B.; Leahy, M. A review of computer tools for analysing the integration of renewable energy into various energy systems. Appl. Energy 2010, 87, 1059–1082. [Google Scholar] [CrossRef]
  46. Lund, H. EnergyPLAN Advanced Energy Systems Analysis Computer Model; Documentation Version 12; Sustainable Energy Planning Research Group, Aalborg University: Aalborg, Denmark, 2015. [Google Scholar]
  47. Porubova, J.; Bazbauers, G. Analysis of long-term plan for energy supply system for Latvia that is 100% based on the use of local energy resources. Sci. J. Riga Tech. Univ. Environ. Clim. Technol. 2010, 4, 82–90. [Google Scholar] [CrossRef] [Green Version]
  48. Child, M.; Nordling, A.; Breyer, C. The impacts of high V2G participation in a 100% renewable Åland energy system. Energies 2018, 11, 2206. [Google Scholar] [CrossRef] [Green Version]
  49. Reuters. Kosovo, ContourGlobal Sign Deal to Build 500 MW Coal-Fired Power Plant. Available online: https://uk.reuters.com/article/kosovo-energy/kosovo-contourglobal-sign-deal-to-build-500-mw-coalfired-power-plant-idUKL8N1OK2SI, 2018 (accessed on 11 March 2018).
  50. Kittner, N.; Fadadu, R.P.; Buckley, H.L.; Schwarzman, M.R.; Kammen, D.M. Trace Metal Content of Coal Exacerbates Air-Pollution-Related Health Risks: The Case of Lignite Coal in Kosovo. Environ. Sci. Technol. 2018, 52, 2359–2367. [Google Scholar] [CrossRef] [Green Version]
  51. Draft Energy Strategy of Republic of Kosovo 2016–2025 Report; Ministry of Economic Development, Republic of Kosovo, Ministry of Economic Development: Pristina, Kosovo, 2016.
  52. Kosovo Transmission System and Market Operator. Available online: https://kostt.com/ (accessed on 1 November 2016).
  53. Kosovo Electricity Distribution and Supply Company. Available online: https://www.keds-energy.com/en/about.asp (accessed on 1 November 2016).
  54. EnergyPLAN: Advanced energy system analysis computer tool, A.U.E. Available online: http://www.energyplan.eu. (accessed on 1 November 2018).
  55. Kosovo Energy Regulatory Office. Annual Report 2015; Kosovo Energy Regulatory Office: Pristina, Kosovo, 2015. [Google Scholar]
  56. Projected Costs of Generating Electricity, Executive Summary; Technical Report; International Energy Agency: Paris, France, 2015; Available online: https://www.oecd-nea.org/ndd/pubs/2015/7279-proj-costs-electricity-2015-es.pdf (accessed on 31 October 2018).
  57. Paul, L.; Giorgio Simbolotti, G.T. ETSAP Energy Technology Systems Analysis Programme; Technical Report; IEA Energy Technology: Network, NY, USA, 2010. [Google Scholar]
  58. International Energy Agency. Next Generation Wind and Solar Power, From Cost to Value; Clean Energy Ministerial, Accelerating Global Clean Energy Transition, International Energy Agency, 9 rue de la Federation: Paris, France, 2016. [Google Scholar]
  59. International Energy Agency. Technology Roadmap, Wind Energy; Technical Report; International Energy Agency, IEA Publications, 9 rue de la Federation: Paris, France, 2010. [Google Scholar]
  60. Mathew, S. Wind Energy Fundamentals, Resource Analysis and Economics; Springer: Berlin/Heidelberg, Germany; New York, NY, USA, 2006. [Google Scholar]
  61. World Energy Council. World Energy Perspective Cost of Energy Technologies; Technical Report 4184478; World Energy Council, World Energy Council, Regency House: London, UK, 2013. [Google Scholar]
  62. National Renewable Energy Laboratory. Distributed Generation Renewable Energy Estimate of Costs; Technical Report; National Renewable Energy Laboratory: Denver, CO, USA, 2016. [Google Scholar]
  63. International Renewable Energy Agency. Renewable Energy Technologies: Cost Analysis Series, Hydropower; Technical Report; International Renewable Energy Agency: Abu Dhabi, UAE, 2012. [Google Scholar]
  64. Connolly, D. Finding and Inputting Data into Energy PLAN Version 5; Documentation Version 5; Aalborg University: Aalborg, Denmark, 2015. [Google Scholar]
  65. International Energy Agency. Renewable Energy Essentials: Hydropower; Technical Report. International Energy Agency, 2010. Available online: https://webstore.iea.org/renewable-energy-essentials-hydropower (accessed on 18 March 2019).
  66. Energi Styrelsen. Technology Data for Energy Plants, Generation of Electricity and District Heating, Energy Storage and Energy Carrier Generation and Conversion; Technical Report; Energi Styrelsen: Esbjerg, Denmark, 2012. [Google Scholar]
  67. Komoni, V.; Gebremedhin, A.; Ibrahimi, N. A comparison of the performance of mono-Si and poly-Si photovoltaic modules operating under Kosovo climate condition. J. Renew. Sustain. Energy 2018. [Google Scholar] [CrossRef] [Green Version]
  68. Ekkehart Naumann, M.P. Identification of Potential for Application of Solar Energy Technology in the Municipality of Dragash; Technical Report. United Nations Development Programme, 2012. Available online: https://www.undp.org/content/dam/kosovo/docs/dragash/Identifiaction%20of%20potential%20for%20renewable%20solar%20energy%20application%20in%20the%20Municiaplity%20of%20Dragash_02042012-Eng.pdf (accessed on 21 November 2018).
  69. Kosovo Transmission System and Market Operator, Long-term Planning Department. List of New Transmission Capacities and Interconnection Lines (2011–2020); Technical Report; Kosovo Transmission System and Market Operator: Pristina, Kosovo, 2010. [Google Scholar]
Figure 1. The schematic diagram and illustration of the EnergyPLAN 12.3 version [46].
Energies 12 04753 g001
Figure 2. Kosovo hourly electricity demand in 2015.
Energies 12 04753 g002
Figure 3. Import-export variation throughout three different weeks of the year 2015.
Energies 12 04753 g003
Figure 4. Weekly power production in 2015.
Energies 12 04753 g004
Figure 5. CEEP (red) and PES (blue) for different hydropower production in the Kosovo energy system 2030.
Energies 12 04753 g005
Figure 6. Electricity generation from all power plants and RES share of electricity production (%) in baseline and future scenarios.
Energies 12 04753 g006
Figure 7. Installed capacity of all power plants in terms of MW and CO2 emissions in baseline and future scenarios.
Energies 12 04753 g007
Figure 8. Contribution of various technologies for heat and transport demand supply.
Energies 12 04753 g008
Figure 9. The contribution of each technology in fulfilling the electricity, heat, transport and industry demand in the year 2050 (%).
Energies 12 04753 g009
Figure 10. The role of CCS technology in RES and CO2 emissions in 2050.
Energies 12 04753 g010
Figure 11. An overview of investment costs of each technology in different scenarios.
Energies 12 04753 g011
Table 1. Comparison of literature on some studies carried out in the field of energy system analysis using EnergyPLAN or H2RES.
ScenarioSoftwareInstalled Generation Capacity (MW)PES (PJ)Total elec. gen (TWh/year)Elec. Demand (TWh/year)RES (%)CO2 Emissions (Mt/year)Ref.
ThermalHydroBiomassWindHeat pumps PV
Ref. (2008)EnergyPLAN41,43123,1256961149 105312277.4 360[19]
Alt. (2020)51,55534,312253917,474 38346000350 21370
Alt. (2030) 42,612313234,00050016,0005190410 50200
Alt. (2050) 150,0004000100,53060060,0003397520 10010
Ref. (2008)EnergyPLAN 300 10012097.68 9[20]
Alt. (2030)1375800 1500 11001051212.37504
Alt. (2050) 2760 5016008015 1000
Ref. (2004)EnergyPLAN 3000 850 [21]
Alt. (2030) 6000450700970 33.225054
Alt. (2050) 1500420 30.21000
Ref. (2006)H2RES58514965477.21600 3.4 4949.17632.9 [22]
Alt. (2020) 7000 8500 1500 54 81
Alt. 34547509970 4500 100
Ref. (2007)EnergyPLAN2139508 724 655.427.1928.5 46.8[24]
Alt. (2020) 20
Ref. (2008)EnergyPLAN, H2RES 22.14[25]
Alt. (2020)2400300851200 386.84 106.782021.34
Alt. (2020) 200 172100
Table 2. Kosovo Energy consumption by sector in 2015 in TWh.
Fuel TypeHouseholdServiceIndustryTransportAgricultureTotalRef.
Biomass2.720.080.14 0.0062.95[4]
Oil0.230.481.833.410.166.12[4]
Coal0.160.310.21 0.0070.63[4]
Electricity-applicants2.90.821.22 0.024.96[4]
Table 3. Cost of electric power plants, heating and transport technologies.
TechnologyInvestment (MEuro/MW)Fixed O&M (% of Inv.)Lifetime (years)Ref.
Electricity
CHP1.42.525[56,57]
Onshore wind power1.91.520[58,59,60]
PV1.9133[61,62]
River of hydro22.550[63,64]
Heating
Ind. Bio-heat boiler0.68120[65]
Electric heating0.8130[66]
Solar thermal4.50.530[66]
Ind. Heat pumps0.91.520[65]
Transport
Biodiesel plant1.893.0120[25]
Biopetrol plant0.447.6820[25]
Table 4. Comparison of Kosovo 2015 average monthly electricity demand [MW] with the result from EnergyPLAN simulation.
Moth KOSTTEnergyPLANDifference
Jan8148140
Feb7687662
Mar7277270
Apr6516447
May5255250
Jun5185180
Jul545547−2
Aug5445440
Sep543545−2
Oct614616−2
Nov687689−2
Dec8218192
Table 5. Proposals for scenarios 2030 and 2050.
SectorScenario 1 for 2030Scenario 1 for 2050
ElectricityIncrease in solar PV from 0.102 MW to 10.102 MWIntroduce 339 MW hydropower
Increase in wind power from 1.35 MW to 151.35 MWIntroduce 339 MW PV
Increase in hydropower from 52.98 MW to 597.87 MWIntroduce 14 MW of biomass CHP for electricity
Construction of new CHP with 450 MW installed capacity based on coal and biomassDecommission of condensing power plant Kosova B
Technical minimum of total CHP plants to be equal to 580 MW
HeatingReplacement of coal boilers with cogeneration and heat pumps80% of heat demand to be covered by renewable sources
20% of total heat demand to be covered by cogeneration from CHPSupply 72.32% of heat demand with biomass micro CHP
Supply 3.84% of heat demand with solar thermal and heat pumps
50% of heat demand to be covered by renewable sourcesHeating will count 2.39% of total heat demand
Electric heating will remain the same accounting 5.98% of total heat demand9.61% of heat demand will be covered by biomass boilers
Solid biomass will count with 47.6%Supply 8% of heat demand by cogeneration
Supply 45.2% of heat demand by biomass micro CHP
Supply 10% of heat demand by cogeneration
Supply 2.5% of heat demand by individual heat pumps
TransportReplacement of 20% of fuels (petrol, diesel, LPG and jet fuel) in transport with biofuels (bioethanol and biodiesel)50% of transport demand to be based on renewable sources (bioethanol and biodiesel)
Introducing electric cars in transportation with 5% in the overall fuel consumptionIncrease the share of electric cars for 5% share from 2030 scenario in transport sector