1. Introduction
Kaplan turbines are widely used in low-head hydropower stations, because of their high specific-speed, large discharge capacity, and broad performance zone. The setting-elevations of Kaplan turbines are normally lower due to relative larger cavitation coefficient, which results in larger upward tailwater pressure. During load rejection transient process, which is an emergent shut-down with rapid closure of guide-vanes due to grid or generator problems, the runner lifting-up (RLU) accident might happen if the upward axial water force is larger than the weight of the rotating parts of the turbine-generator unit.
RLU accidents about Kaplan turbines were frequently reported, in which serious damage and property losses were accompanied [
1,
2,
3,
4,
5,
6]. In Kahovskaya Hydroelectric Plant, Russia, a RLU accident happened and the runner blades were damaged due to the large rejoining force after water column separation during a shut-down transient process [
1]. Similar RLU accidents that were caused by reverse water hammer also occurred in Stuguns and Akkats power stations [
2], Sweden, in which whole shaft lifting and blades breaking were reported. In China, the Kaplan turbines in Hejiatan [
3], Mantianxing [
4], and Xiacheng [
5] hydropower stations encountered several RLU accidents during load rejection transient processes, which resulted in the destruction of the bearings. Twenty-four RLUs were recorded within the past ten years in Tishrin hydropower station, Syria, causing great damage to the units [
6].
RLUs occur in transient processes, especially the load rejection transient process, during which fast guide-vane closing can cause large water hammer fluctuations in the draft-tube of Kaplan turbines. Many researches on the load rejection transient process of the Kaplan turbines and RLU reasons have been conducted. Chang [
7] theoretically analyzed the control mode of Kaplan turbines in transient processes and proposed closing guide-vanes in stages and turn blades to the maximum angle before reaching the maximum speed after load rejection, which has been proven to be reliable and effective to improving stability of transient processes by field practice. Cai et al. [
8] theoretically analyzed the RLU reasons of Kaplan turbines, classified the RLU problems into lifting-up by reverse water hammer and by the pumping effect, and put forward several measures to prevent the RLU problems. Yang et al. [
9] reported two RLU problems that are caused by the reverse water hammer and pumping effect, respectively, and then analyzed the changing rules of macro-parameters. The reverse water hammer that caused RLU can be described, as follows: during the load rejection transient process, the rapid closure of guide-vanes causes pressure drop in the draft-tube; the water column can be separated if the pressure at the runner outlet reaches at the cavitation pressure [
10]; the rejoining of the separated water columns results in an impact on the runner [
11]. On the other hand, the pumping effect that caused RLU can be described, as follows: without reverse water hammer during the load rejection transient process, the rotational speed increases while the discharge decreases; the turbine will work in a special mode in which the runner propels water downstream if a high rotational speed encounters a low discharge; if the reaction force of water is large enough the runner can be lifted up. Pejovic [
12] gave a formula for predicting water column separation in draft-tube, which considered guide-vane closing time, discharge, tailrace tunnel length, and suction head. Yang et al. [
9] investigated the RLU process of a Kaplan turbine, combining theoretical analysis with engineering tests, and proposed a formula for estimating the lifting force of pumping effect, which is related to the diameter and rotational speed of the Kaplan turbine. Min [
6] analyzed the causes of RLU of a Kaplan turbine, and solved the problem of RLUs while using the methods, which had not been solved in the power station for nearly ten years. The above studies provided many valuable data and measures, however the in-depth analysis of RLU mechanism of Kaplan turbines is still absent.
Theoretical analysis, engineering tests, and numerical simulations are all useful tools in studying the RLUs of Kaplan turbines. Apart from the aforementioned theoretical and simple simulations, engineering tests have achieved good results in practical projects [
1,
2,
3,
4,
5,
6,
7,
8,
9]. However, prototype tests are not recommended because of being dangerous and consuming many resources. With the rapid development of computational fluid dynamics (CFD), three-dimensional (3D) CFD simulation becomes a powerful tool to solve turbine flow and unstable problems [
13]. Čarija et al. [
14] and Drtina et al. [
15] validated the accuracy of CFD simulations of Kaplan turbines and found that the differences between the simulations and measurements are almost negligible. Liu et al. [
16] used CFD to study the steady operating conditions of a Kaplan turbine and compared the numerical results with experimental data. Regarding transient process simulations by CFD, Liu et al. [
17] simulated the runaway transient process of a Kaplan turbine, Yang et al. [
18] simulated the load rejection transient process of a bulb tubular turbine, and Chen et al. [
19] simulated the load rejection transient process of a Kaplan turbine while considering the double regulations. These works tell us that 3D CFD is reliable and it can be applied to studying turbine transient processes.
The RLU phenomenon with a fixed-blade Kaplan turbine during load rejection transient process was simulated while using the latest 3D CFD in this study to reveal the mechanism of RLUs and find proper solutions. We attributed the reason of the short-term uprush of axial water force to the downstream pumping effect by investigating into the varying trends of macro parameters and detailed flow patterns. Based on the mechanism, we proposed and verified a specific designed piecewise closing rule to solve the RLU problem. The detailed methods, discussions, and verifications will be presented in the following sections.
3. Load Rejection Transients with Linear Guide-Vanes Closing Rule
When load rejection is detected, the governor will drive the guide-vanes to close following a given rule. During the closing process, water hammer waves will be generated due to discharge decrease, with positive value ahead of the guide-vanes and the negative value behind them. The rotational speed will increase first due to the absence of the resistance moment Mg, and then decrease due to the decrease and sign reversing of the driving moment M from negative to positive, as in Equation (1). The phenomena composed of load rejection action, guide-vane closure, discharge decrease, water hammer generation, transmission and reflection, and speed increase and decrease, are generally called the load rejection transients.
We first simulated the load rejection transients with a linear guide-vane closing rule in this study.
3.1. Variations of Macro Parameters
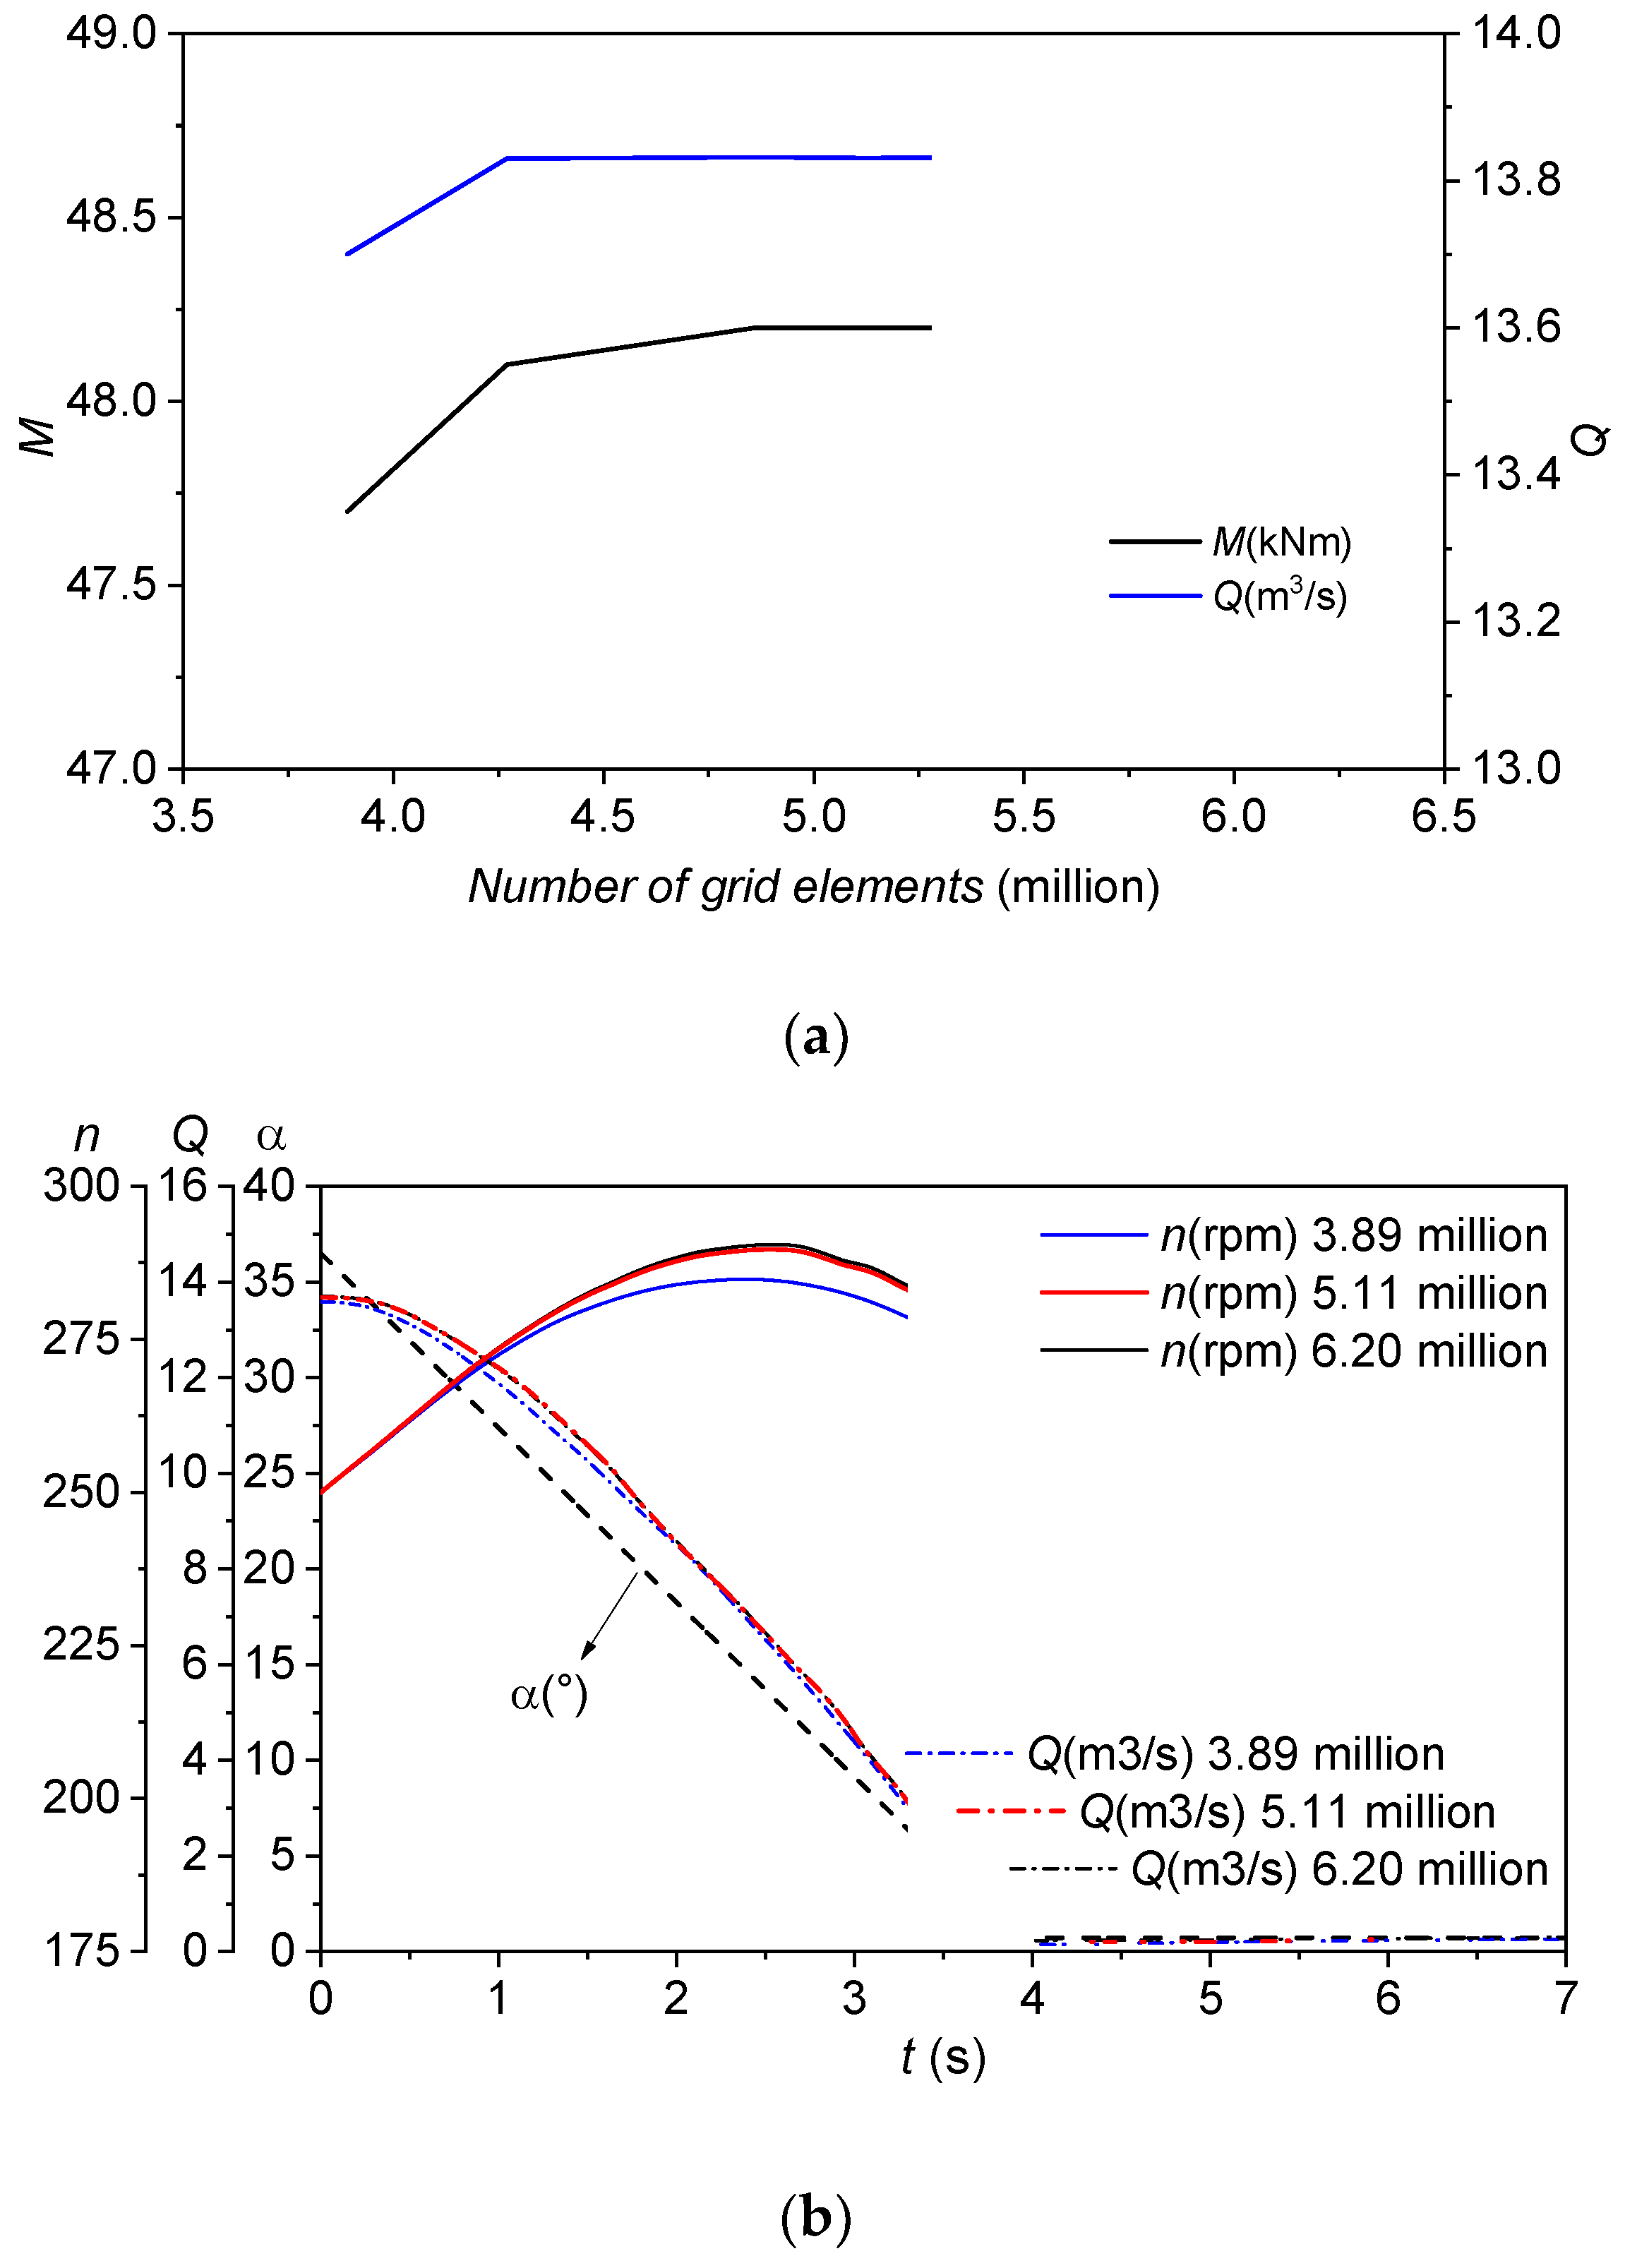
We obtained the macro parameters from the 3D CFD simulation, given the linear closing time of guide-vanes
Ts = 4.0 s, and
Figure 7 shows the history curves of the key parameters. When the guide-vane opening
α changes from 36 degree to 0.73 degree linearly, the discharge decreases from 13.8 m
3/s to 0.2 m
3/s with first slow and then fast rate. The rotational speed
n increases during
t = 0 s to 2.52 s and then decreases. The maximum rotational speed reaches 289.7 rpm at
tnmax = 2.52 s, with a maximum speed rise ratio of 15.88%. After
tnmax = 2.52 s the turbine enters the turbine braking mode, in which the moment becomes positive, which leads to the decrease of speed. During the whole process, the axial water force on the runner
Fz experiences great fluctuations. At the beginning of load rejection,
Fz is negative (vertically downward) with a value of −79.4 kN.
Fz increases and it changes from negative to positive at
t = 2.13 s. The continuous increase of
Fz is accompanied by the increase of rotational speed
n and the decrease of discharge.
Fz still increases for a short period after the guide-vane closing stops at
t = 3.92 s (0.73 degree opening). At
t = 4.04 s,
Fz reaches at its maximum 195.8 kN, which exceeds the unit’s weight
W = 140 kN by 39.9%. The period of the upward axial water force being larger than the weight of the rotating parts is from
t1(Fz > W) = 3.57 s to
t2(Fz > W) = 6.13 s, yielding the unbalance time
TF > W =
t2(Fz > W) −
t1(Fz > W) = 2.56 s. It is known from the authors’ experience that this time is enough for a RLU accident.
3.2. Variations of Pressures at Monitoring Points
Figure 8 shows the pressure fluctuation histories at P1, P2,…, and P6. During the process of guide-vane closure, the pressure at P1 increases gradually, while the pressures at P2 and P3 gradually decrease, indicating water hammer characteristics. The pressure rise ratio at P1 is 39.18%, matching the requirement of less than 50% in
Design code for small hydropower station in China [
23]. The pressure at P3 drops to its minimum −66.68 kPa, which is consistent with the results of reference [
24]. When compared with the vaporization pressure value of −99.659 kPa at room temperature, there is a safety margin of 32.98 kPa, so no water column separation occurs during the load rejection process. The pressure at these points is greatly affected by the runner blades because P3 is near the inlet of runner blades, while P4 and P5 are near the outlet of runner blades (
Figure 6). The high-frequency pressure pulsations at P3, P4 and P5 are displayed in
Figure 8, which is consistent with the blades passing frequency of the runner. The reason of strong pulsations at P4 is because its location close to the draft-tube wall, where the blades interact with the wall with high rotational speed [
25]. The low-frequency components in the curves are the signs of the draft-tube vortices and they will be discussed later. After guide-vane closing is finished, the average pressure at P4 becomes obvious higher than those at P5 and P6, reflecting that they are the main regions of the pumping effect.
4. Mechanism Analysis of RLU
4.1. Variation of Forces on Runner
The red curve in
Figure 7 is the history curve of the axial water force on the runner,
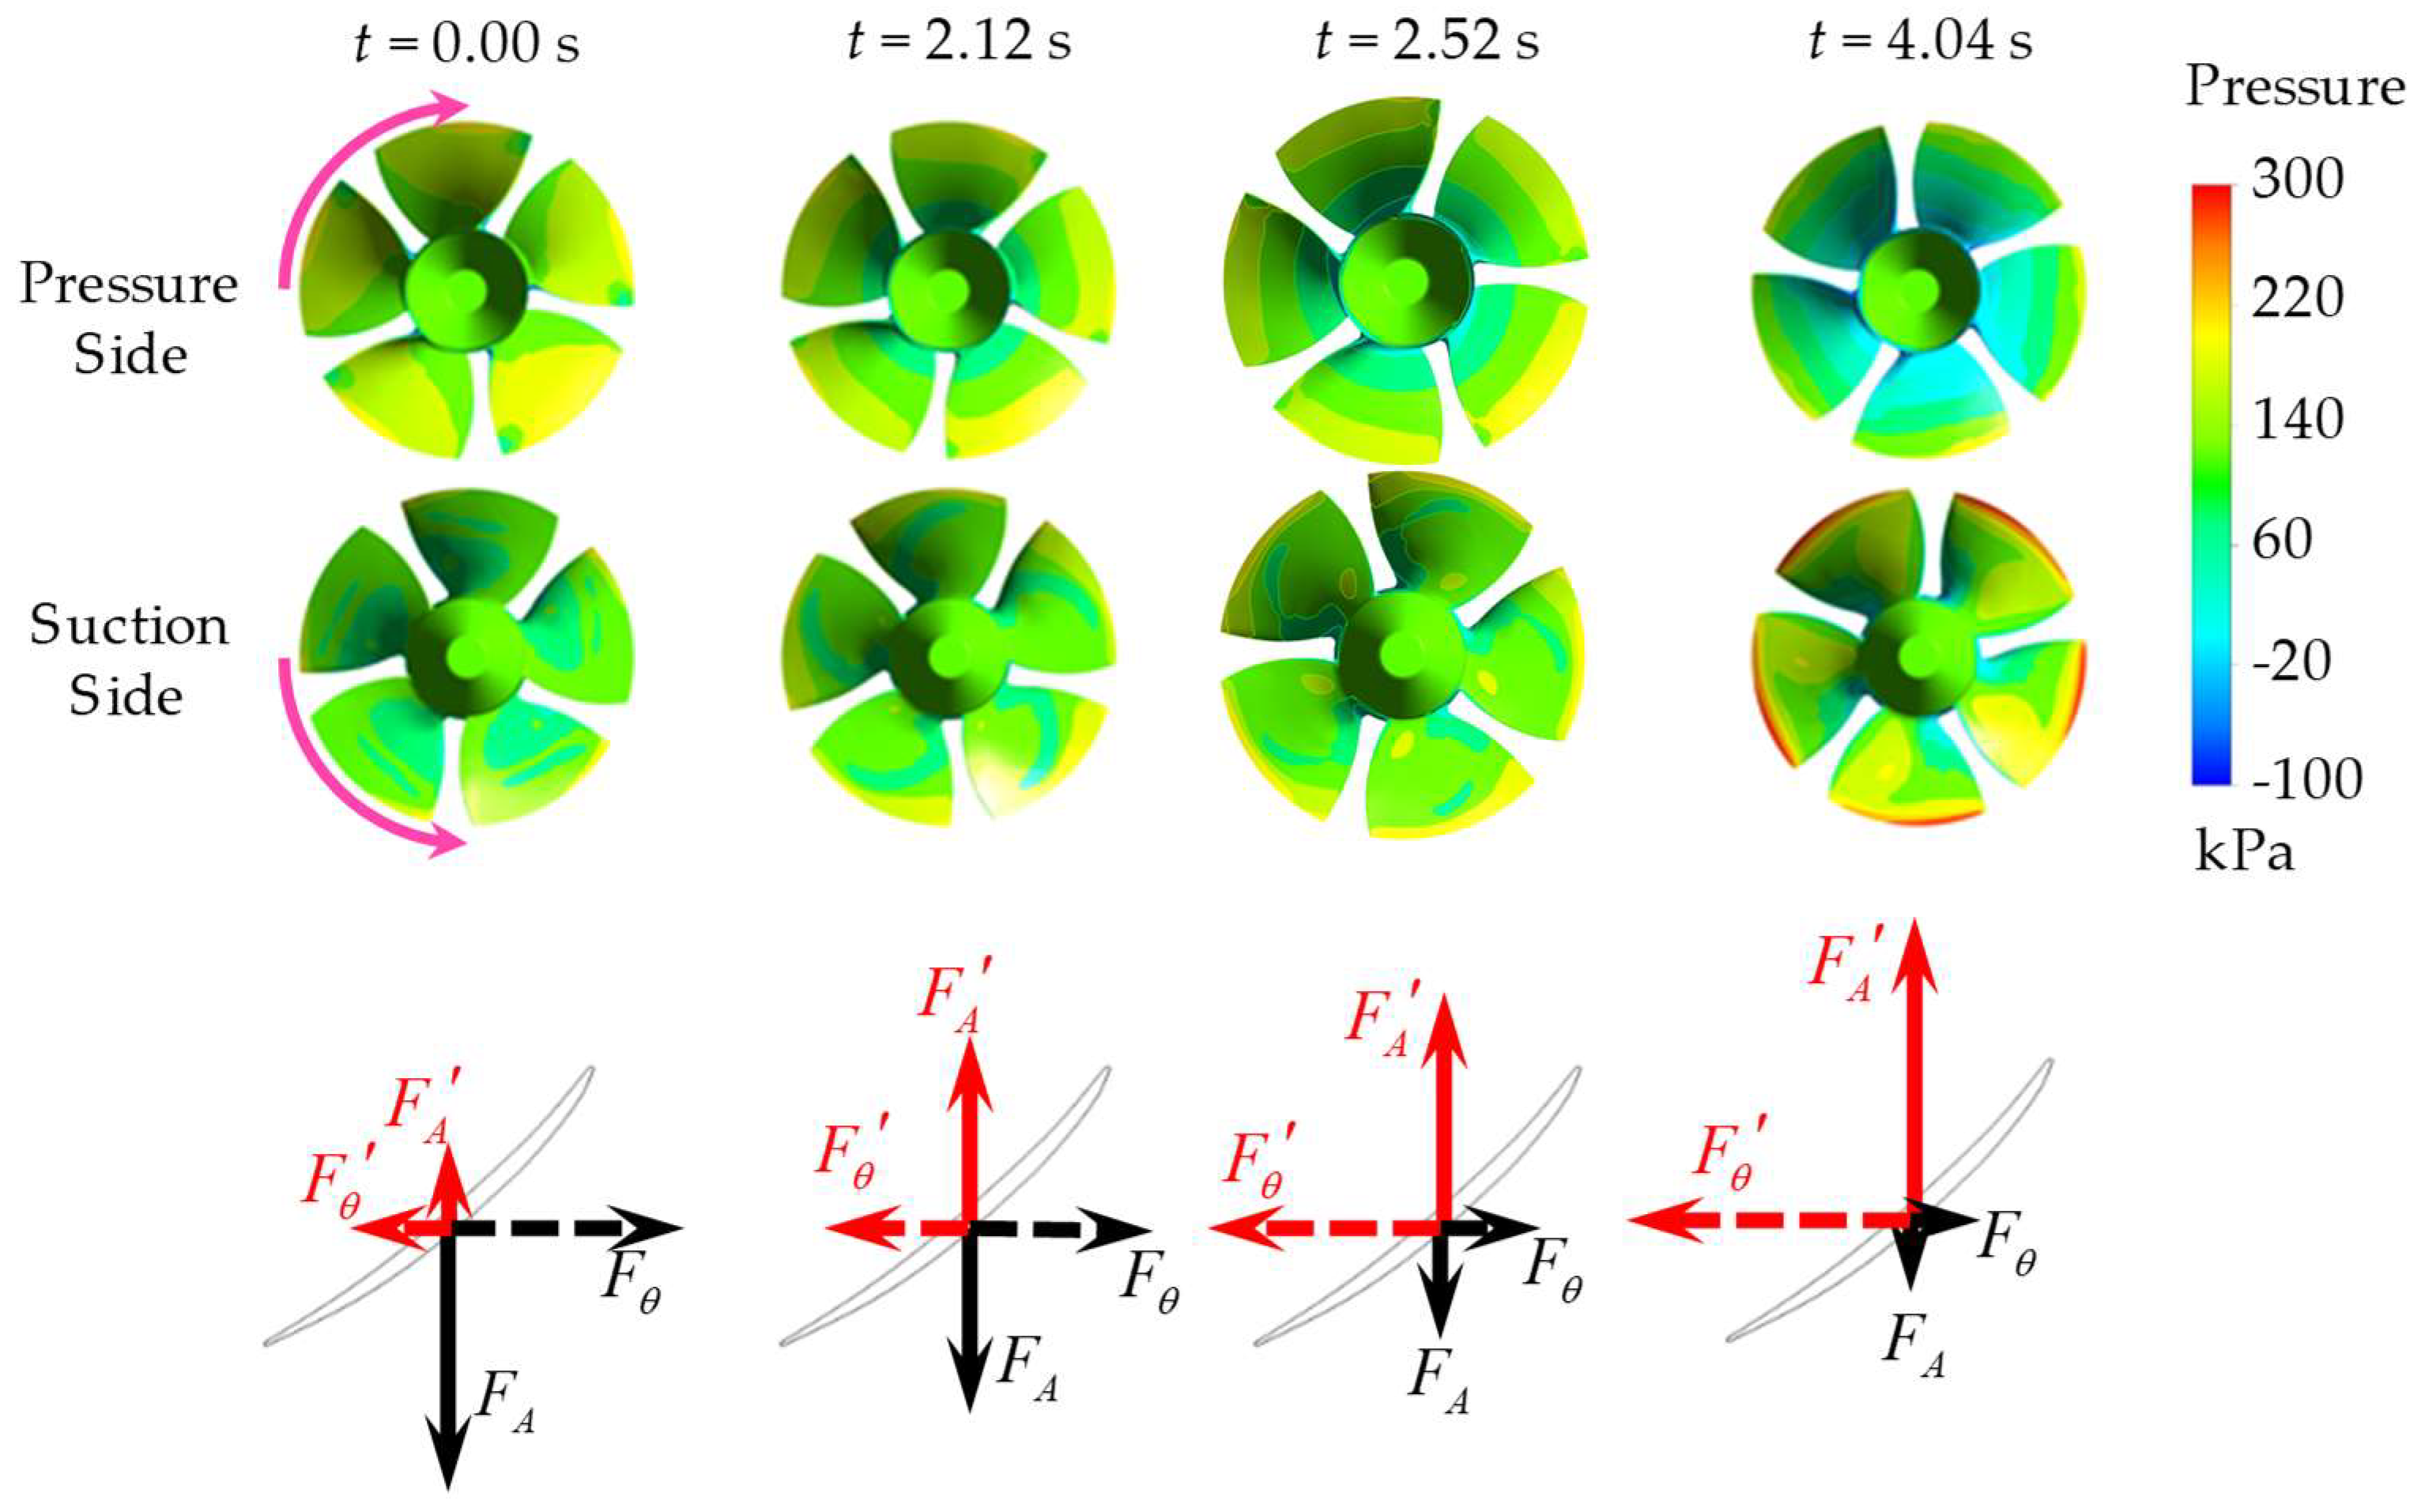
Fz, which is the integrated force on the whole runner. The forces that are generated by the blades are the dominant part. Four typical time instants in the process of the load rejection are selected to analyze the force characteristics on blades. The instants
t = 0.00 s, 2.12 s, 2.52 s, and 4.04 s are corresponding to the beginning of the process, the zero axial force time, the time of maximum rotational speed (
tnmax), and the maximum axial force time, respectively.
Figure 9 shows the pressure distributions on blade surfaces and the decomposed forces, in which,
and
stand for the horizontal circumferential tangential force that is generated on the pressure side and the suction side, respectively;
and
stand for the axial downward force that is generated on the pressure side and the suction side, respectively.
At t = 0.00 s, the discharge of turbine is at its rated, the overall pressures on the pressure side are greater than those on the suction side, and the total axial force on the runner is negative. With the closing of guide-vanes, the discharge gradually decreases, and the pressures on the pressure side decrease, leading to the decrease of . As the discharge decreases, the effect of upward force become stronger, the pressure on suction side increases gradually, so the increases. The decreases and the increases directly cause the axial force to turn from negative to positive. When the discharge decreases, the water force on the runner turns from negative to positive, which is why the decreases and increases. As a result, the moment of runner turns from output to input.
The downstream pumping effect is produced due to blades begin to propel water downstream when the rotational speed reaches the maximum at t = 2.52 s in the processes of speed increase and discharge decrease. After that, the runner begins to work in braking mode, in which the rotating kinetic energy of the runner is consumed and the speed decreases. The runner pumps the water downstream, and water reaction forces make the axial force Fz more rapidly increase. When the discharge approaches to zero, the downstream pumping effect becomes strong and Fz reaches it summit at t = 4.04 s. The high pressure regions on the blade suction side concentrate to the blade tips (t = 3.56 s and 4.04 s), while the low pressure regions on the blade pressure side become apparent in the root regions because of the strong propelling and centrifugal effects.
4.2. Variation of Flow Patterns in Runner and Draft-Tube
During the load rejection transients, the vortices inside the runner mainly cause turbine energy dissipation. The Q criterion with level value of 0.08 is used to monitor the vortex patterns in the runner region, as shown in
Figure 10.
When the load is just rejected at
t = 0.00 s, the turbine is in a high efficiency operating point, showing smooth flow patterns. Small striking vortices are generated near the inlet of blade suction side because the attack angle at the runner inlet is not the best angle (
Figure 10). At the runner outlet, the flow is vertical with no rotational component, and the flow in draft-tube region is smooth (
Figure 11).
At
t = 2.12 s, discharge is reduced to 59.2% of the rated value, and the runner moment approaches zero. A large number of tubular vortices are generated in the runner (indicated by the pink arrow,
Figure 10), which gather to the blade tips, indicating the increase of resistant moment. Under the influence of the runner, the flow in the center region of draft-tube goes up and rotates with a smaller velocity (indicated by the red arrow,
Figure 11), while the flow near the wall region goes down and then rotates with a higher velocity (indicated by the blue arrow,
Figure 11). The rotational directions of the flows are the same as that of the runner (
Figure 11).
At
t = 3.56 s, the discharge decreases to 14.4% of the rated value, and the axial force on the runner becomes larger than the weight of the rotating parts of unit (
Fz >
W), which indicates a possibility of RLU. The tubular vortices are obviously smaller than those at
t = 2.12 s because of lower discharge. The planar vortices totally cover the suction side of blades (indicated by the red circle,
Figure 10), and emerge some vortices at the leading edge (indicated by the pink circle,
Figure 10). The planar vortices on the suction side and the vortices at leading edge indicate that the resistant moment become stronger.
At
t = 4.04 s, the guide-vanes are completely closed, and the discharge approaches to zero. The vortices continue to increase, especially at the inlet edges of the runner (
Figure 10). At this time, the rotational speed decreases to 105% of the rated value. The flow velocity in the draft-tube decreases due to the decrease of rotational speed; however, the flow rotation in the draft-tube is stronger than that at
t = 3.56 s, because the rotating kinetic energy of the runner convers to the rotating kinetic energy of water (
Figure 11).
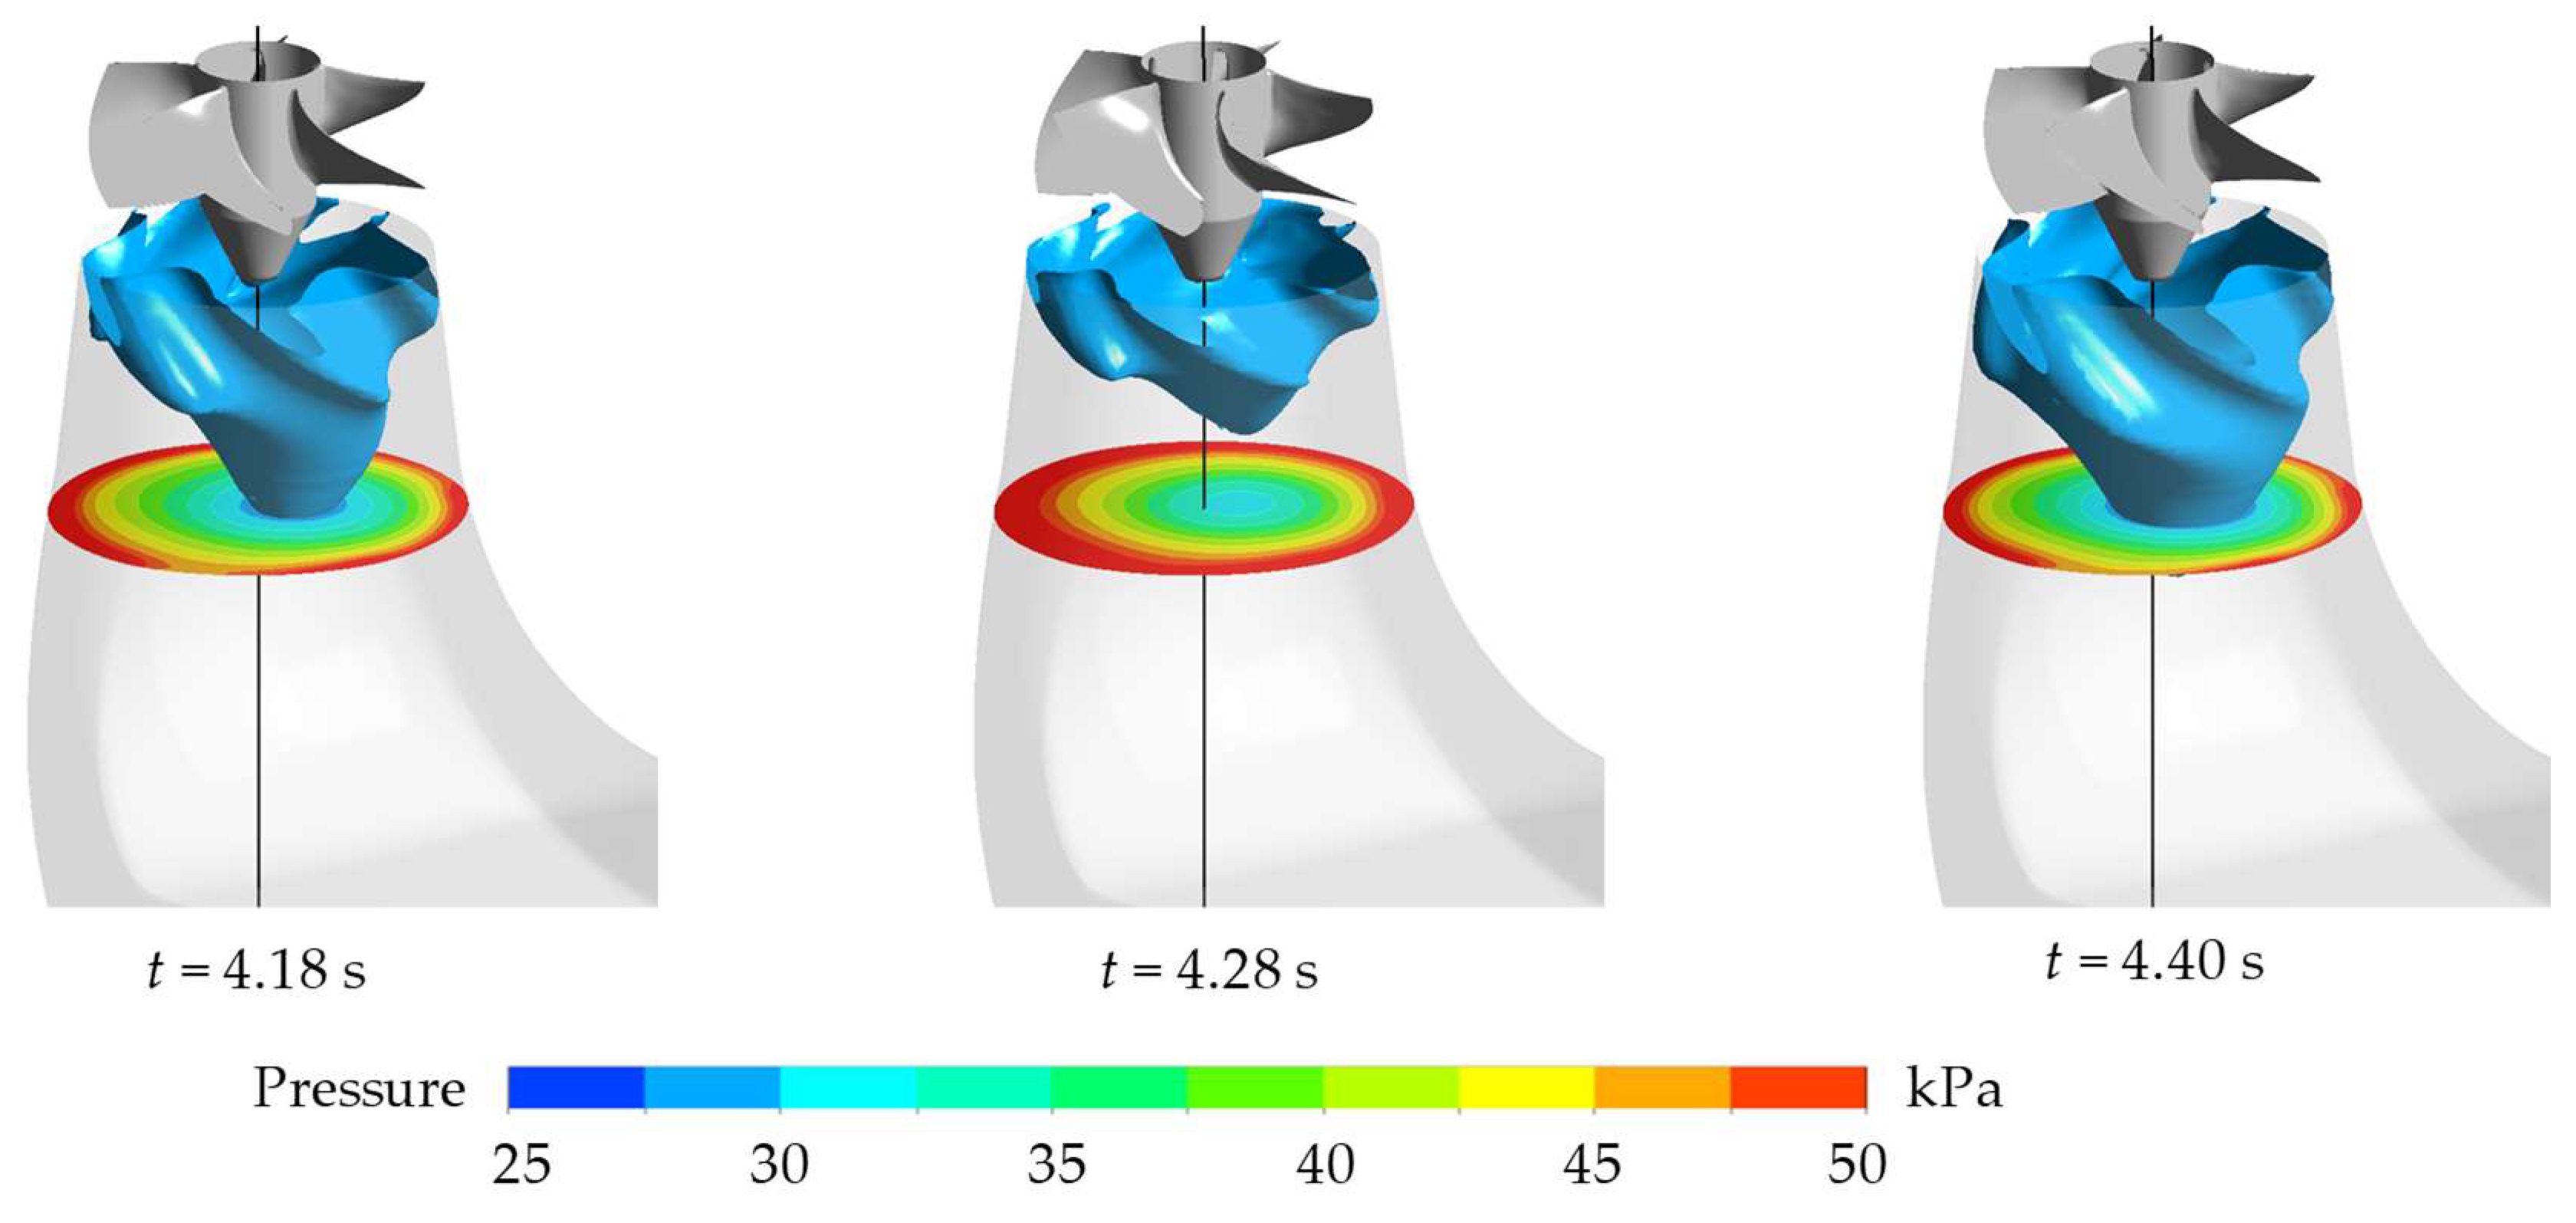
The pumping effect is the fundamental reason for the increase of axial force
Fz, which is related to the complex flow patterns in the draft-tube.
Figure 12 shows the pressure distribution on Span 0.1, 0.5, and 0.9 of the runner. From Span 0.1 to Span 0.9, the blade inclination changes from steep to gentle because of the geometric structure of Kaplan turbine. The steep blade angle can lead to large resistance, while the gentle blade angle can lead to a strong pump effect. That is why the pressure and velocity on Span 0.1 are smaller than those of Span 0.9. These pressure and velocity distributions, along with the small discharge, make the flow patterns under the runner demonstrate center-upward surrounding-downward recirculating characteristics (
Figure 11).
4.3. Mechanism of RLU
We might describe the mechanism of RLU while synthesizing the rules in macro parameters, flow patterns, and pressure distribution, as follows. During the load rejection transients, with the closing of guide-vanes, the discharge of turbine decreases, and the rotational speed rises first and then decreases. The runner will enter the downstream pumping mode, in which the runner propels water downstream, because of the low discharge and high speed. The pressure on the pressure side of runner blades become lower, while the pressure on the suction side become higher, which produces a larger upward axial force Fz. Fz rapidly increases as discharge decreases sharply to a very low value or even to zero. The RLU might occur if Fz exceeds the weight of rotating parts W. The maximal Fz happens after discharge approaches to zero, because the pumping effect becomes larger with smallest discharge and relative higher speed. After the summit, Fz decreases as the speed falls. When speed falls to a certain value, Fz will become smaller than W, which indicates the ending of RLU. The simultaneous occurrence of low discharge and high speed is the reason of the pumping effect, which is also the reason for RLU. In the downstream pumping mode, the flow in the draft-tube demonstrates center-upward surrounding-downward recirculating characteristics, and the vortices in the runner shows complex structures.
6. Conclusions
In this study, the runner lifting-up (RLU) problem of a fixed-blade Kaplan turbine during load rejection transient process in a practical hydropower station was investigated by using 3D CFD transient simulations. The mechanism of the upward boosting of the axial water force on the runner was revealed based on evidence in parameter histories and flow structures. We proposed a modified guide-vane closing rule to avoid RLU while understanding the physics. Moreover, this means was successfully verified. The conclusions are as follows:
(1) The RLU problems during the load rejection transients of Kaplan turbines may be caused by two reasons: reverse water hammer and downstream pumping effect. In the case of this study, there is no reverse water hammer, because the smallest pressure at the runner inlet during the guide-vane closing process is always higher than the cavitation pressure. The downstream pumping effect is the cause of the upward boosting of the axial water force on the runner. This axial water force has been larger than the weight of rotating parts of the unit for a certain time, which indicates the possibility of RLU.
(2) The pumping effect can appear when a high rotational speed meets a low discharge. The guide-vanes begin to close after the load is rejected. During this process, the increase of rotational speed and the decrease of discharge happen simultaneously. The high speed makes the runner strongly propelling water downstream, and the low discharge make the flow in the draft-tube strongly recirculating, flowing downstream near the drat-tube wall and flowing back in the center to balance the overall discharge. The axial water force is the reacting force of the propelling force.
(3) The simultaneous occurrence of high rotational speed and low discharge cannot be avoided by only adjusting the guide-vane closing time. However, one can use a piecewise closing rule that has a suspending period in the middle reach. This opening unchanged period is used to reduce the rotational speed by the braking effect in the turbine-braking mode. A suitable starting instant and duration of the suspending are the keys in decelerating the speed and, hence, controlling the upward axial water force. The effectiveness of the piecewise closing rule is successfully verified.
(4) The above conclusions on the mechanism and solution of RLU are evident for fixed-blade Kaplan turbines, and their validity for adjusting-blade Kaplan turbines should be further studied. One of the main differences that the downstream pumping effect can be kept at a low level by adjusting the blade angle should be focused on.


