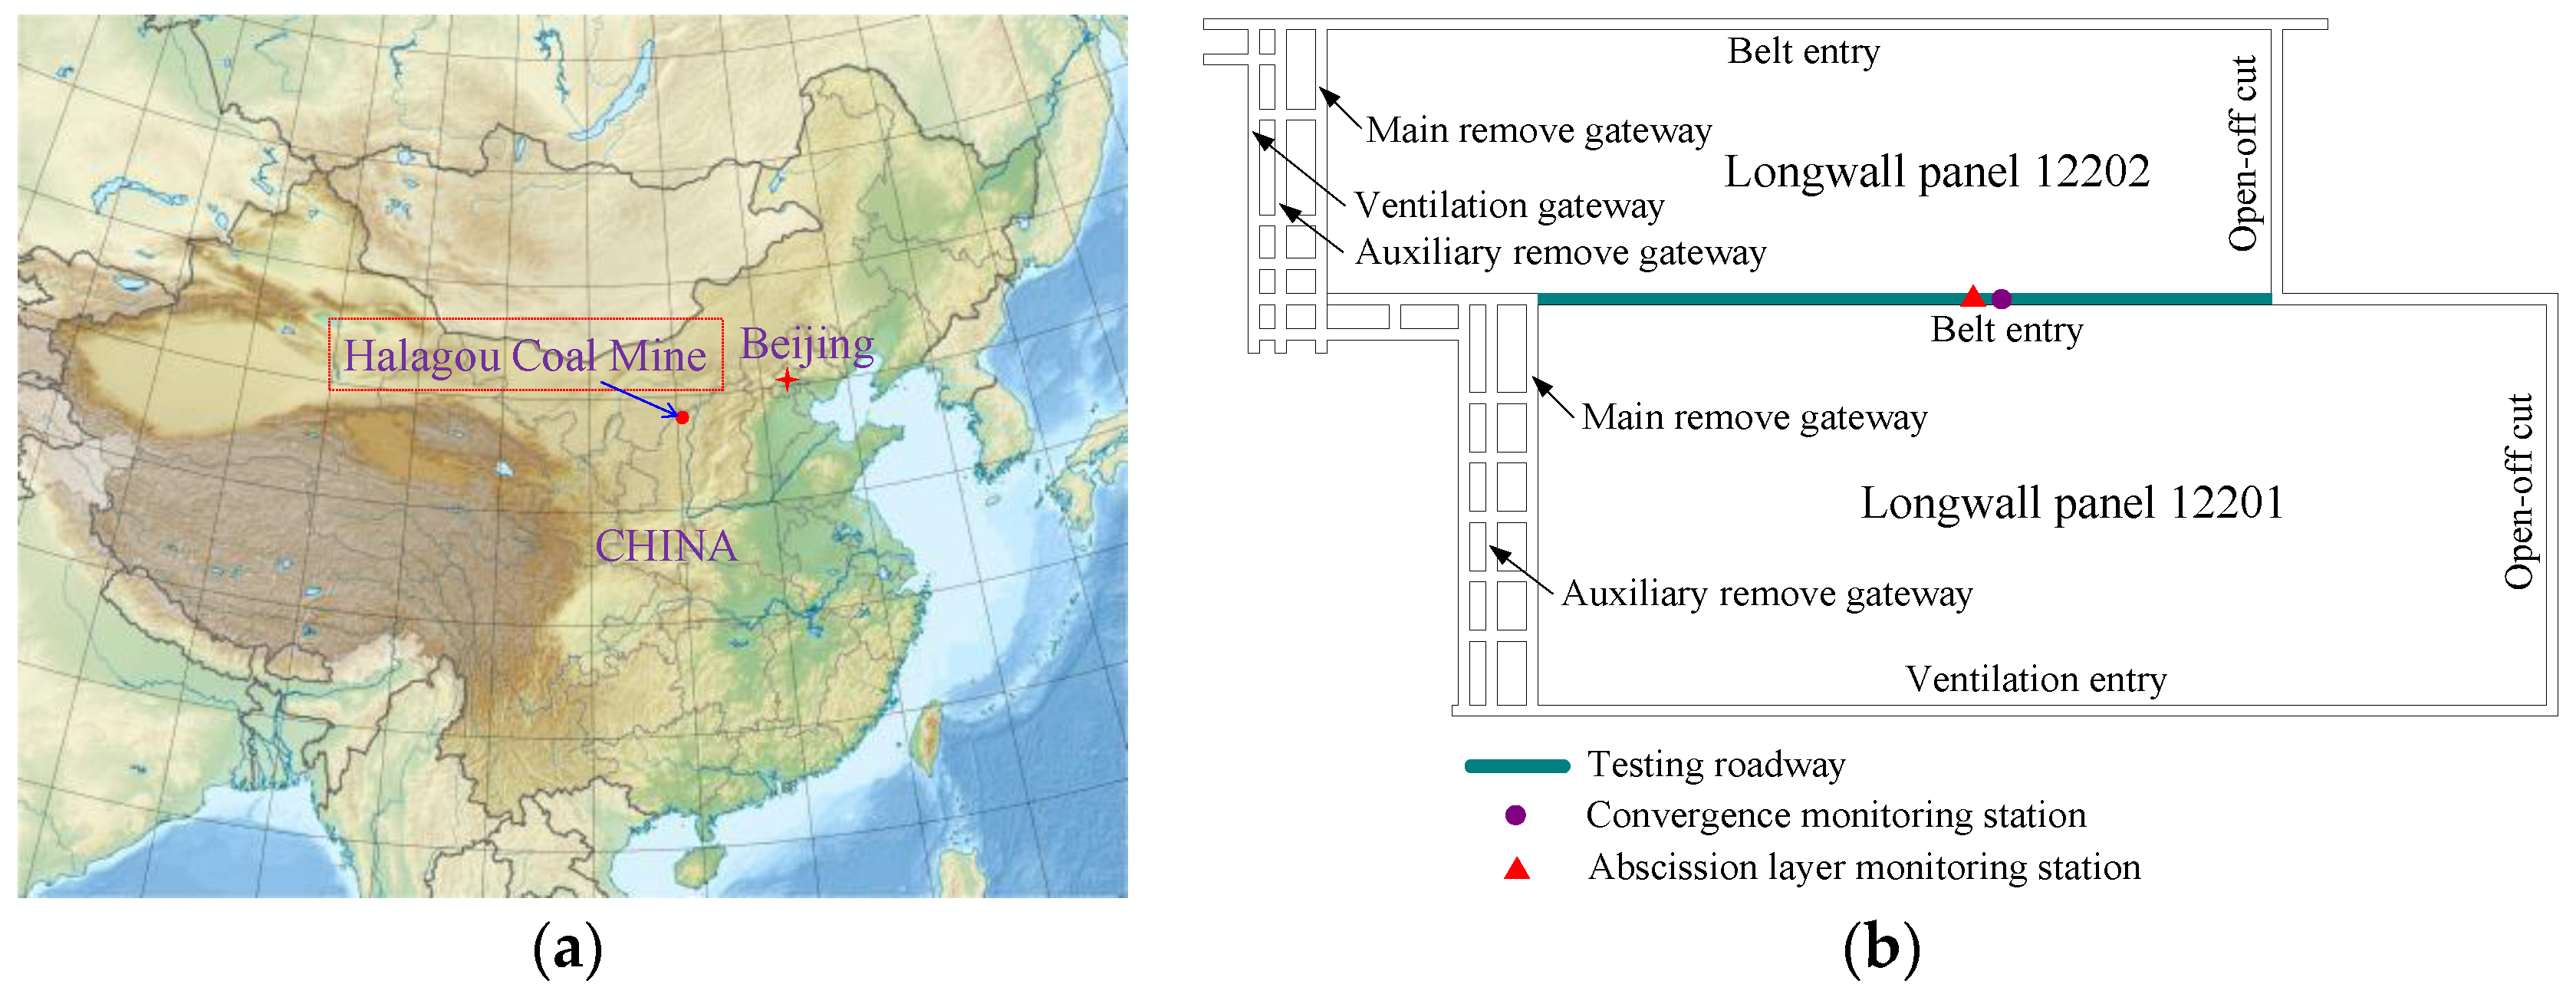
Figure 1.
(a) The location of the Halagou coal mine, Shanxi, China; (b) Plane layout of the mining panel.
Figure 1.
(a) The location of the Halagou coal mine, Shanxi, China; (b) Plane layout of the mining panel.
Figure 2.
Stratum column and geological description of the mining panel.
Figure 2.
Stratum column and geological description of the mining panel.
Figure 3.
Structural model cross-section of non-pillar mining.
Figure 3.
Structural model cross-section of non-pillar mining.
Figure 4.
Numerical model of non-pillar longwall mining.
Figure 4.
Numerical model of non-pillar longwall mining.
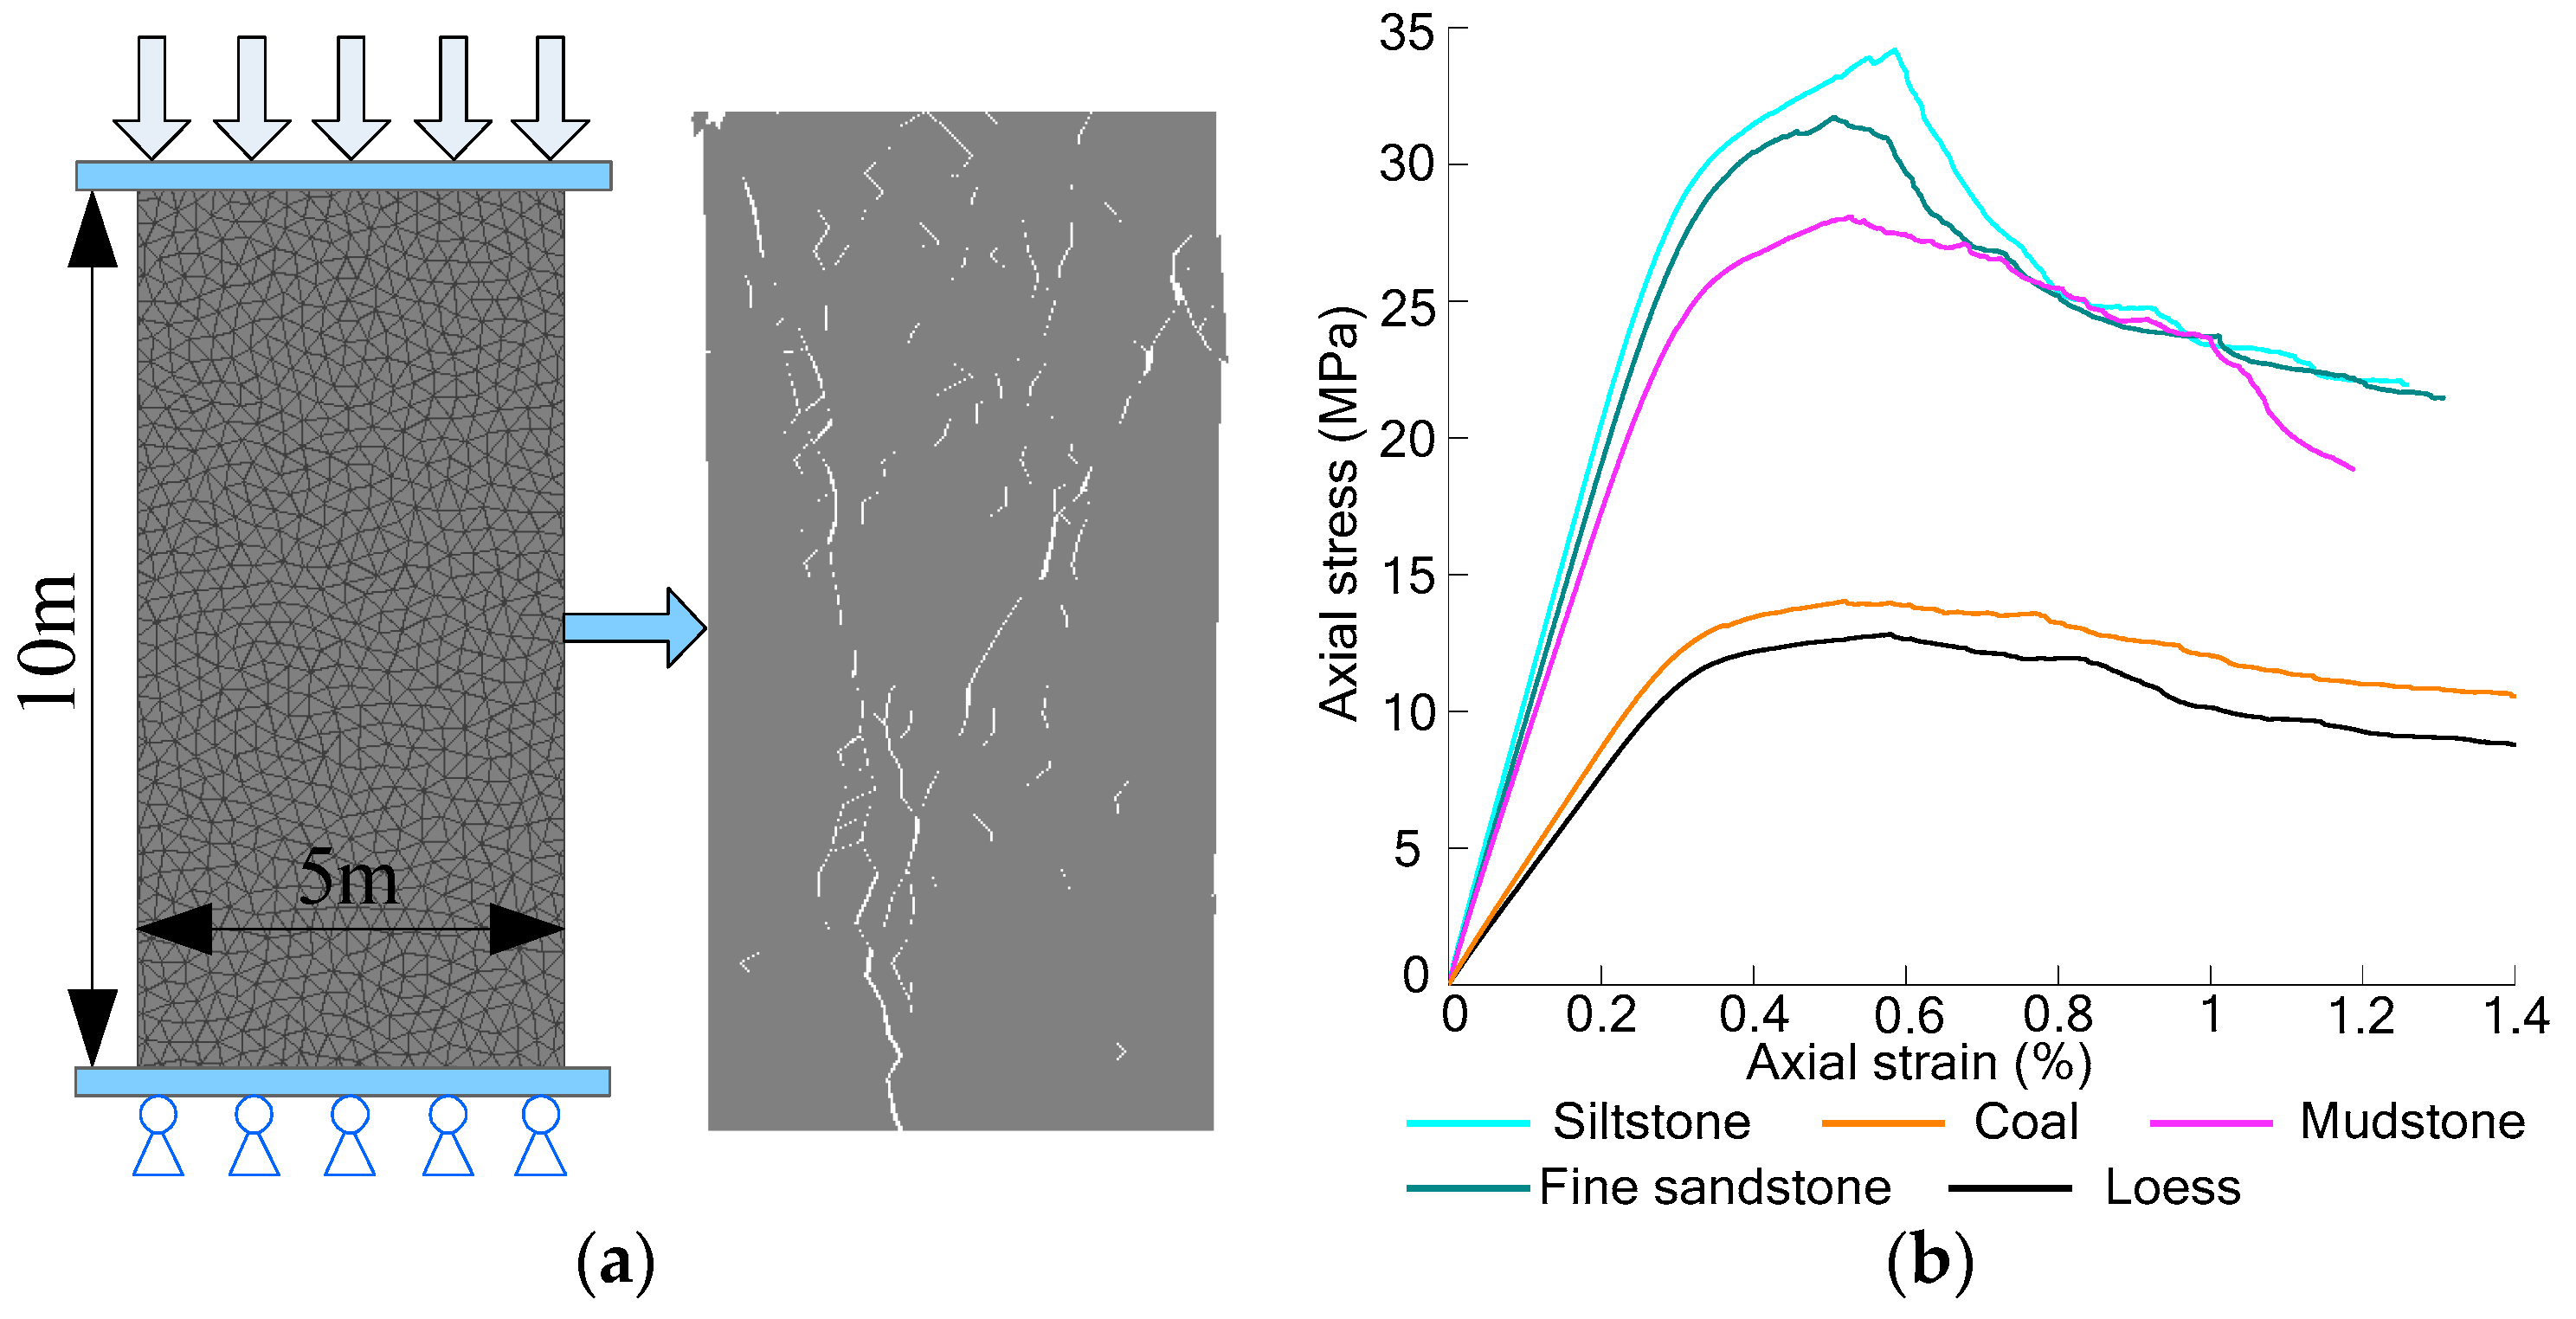
Figure 5.
Simulated unconfined compression tests and obtained optimal axial stress–axial strain curves: (a) Unconfined compression tests; (b) stress–axial strain curves.
Figure 5.
Simulated unconfined compression tests and obtained optimal axial stress–axial strain curves: (a) Unconfined compression tests; (b) stress–axial strain curves.
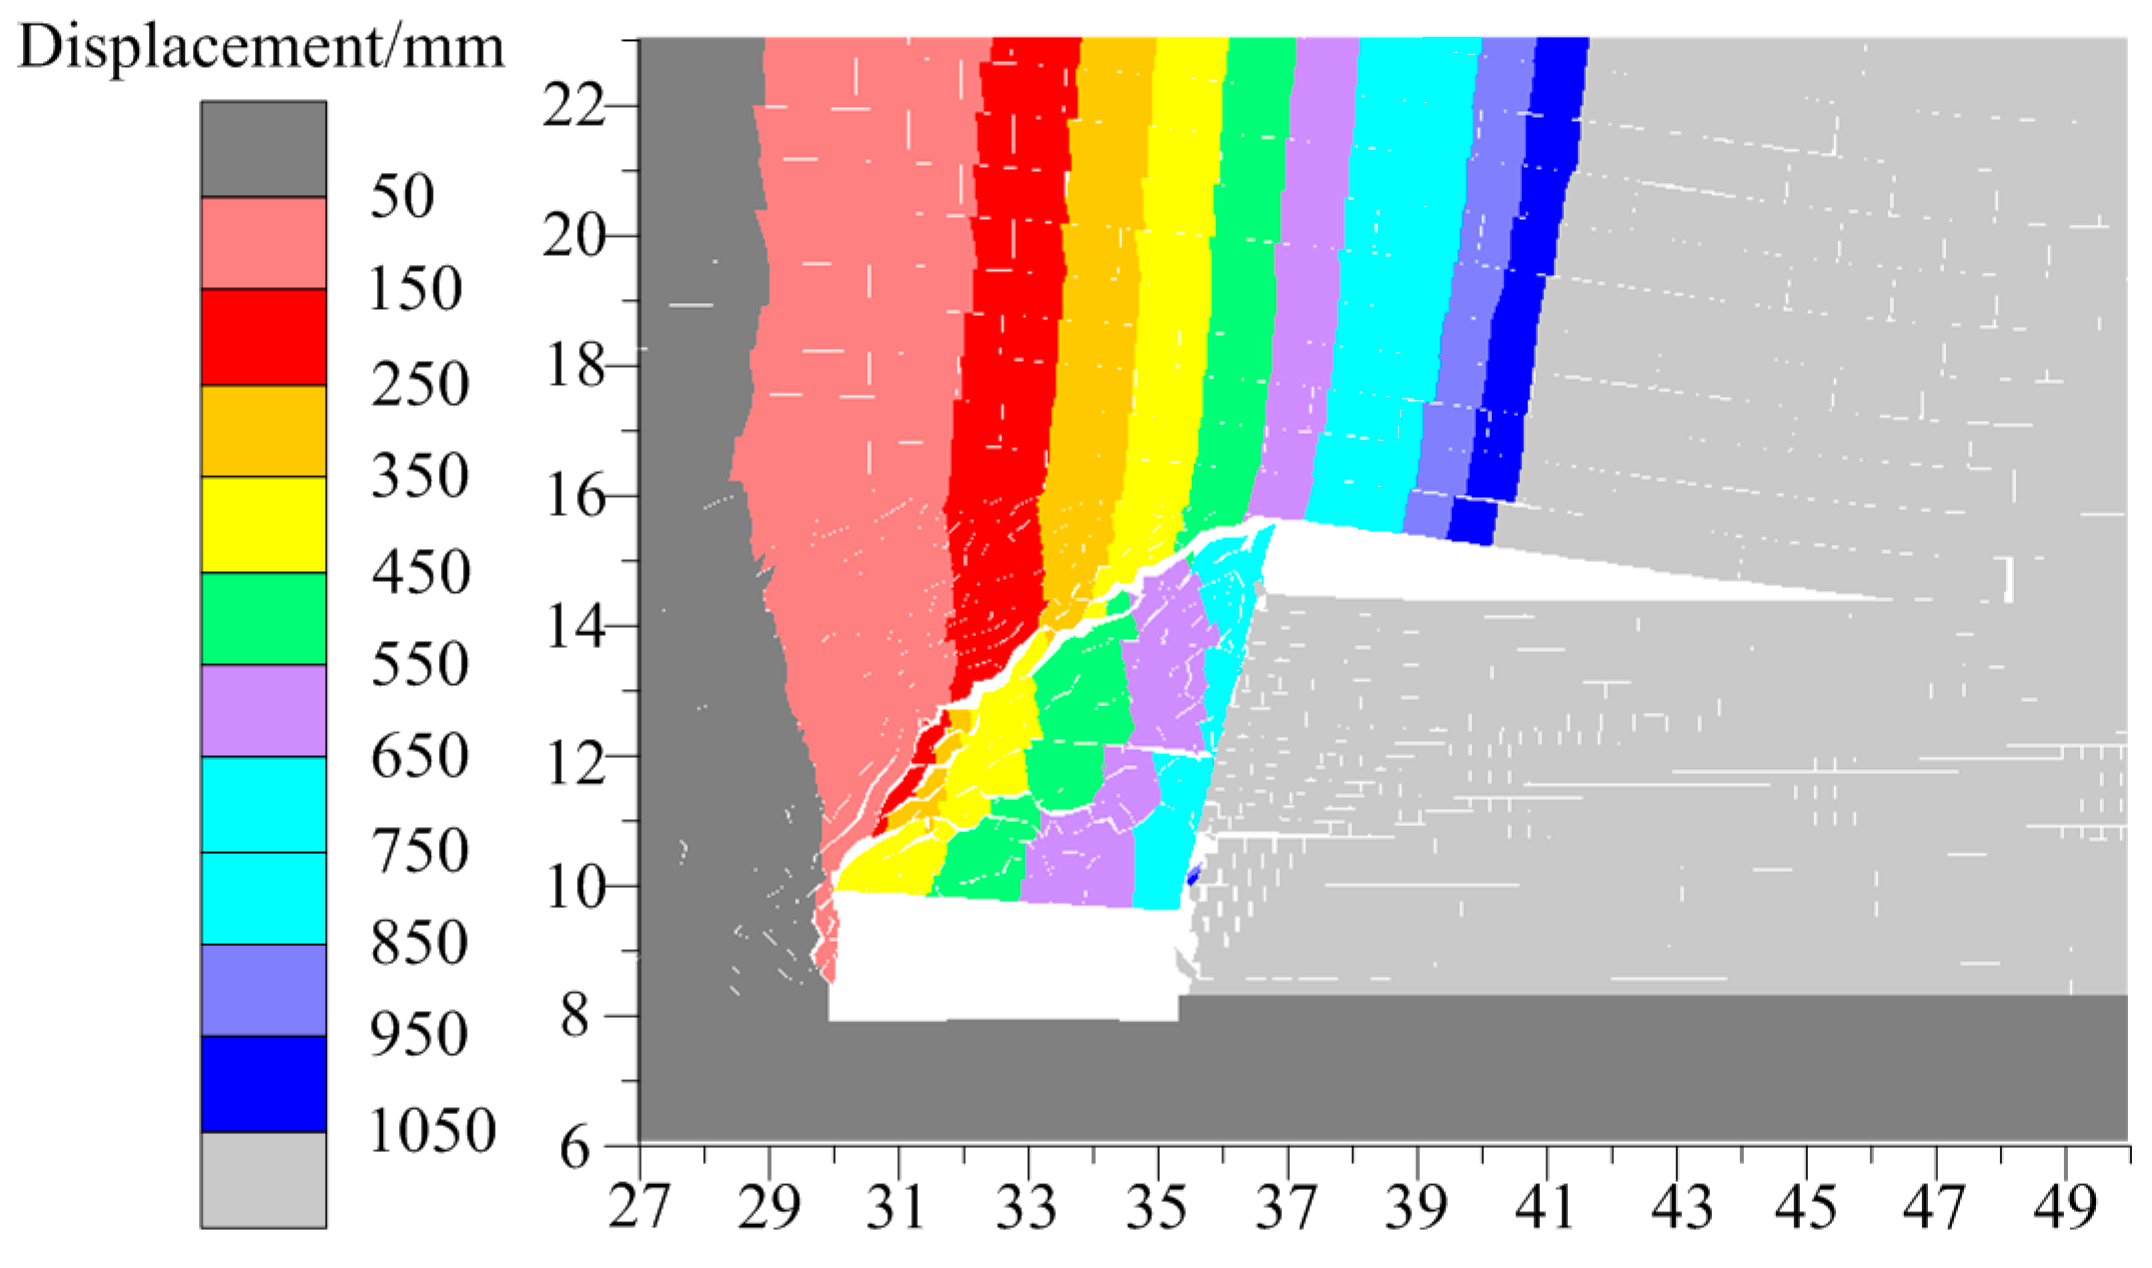
Figure 6.
Simulated displacement map in the entry-surrounding rock.
Figure 6.
Simulated displacement map in the entry-surrounding rock.
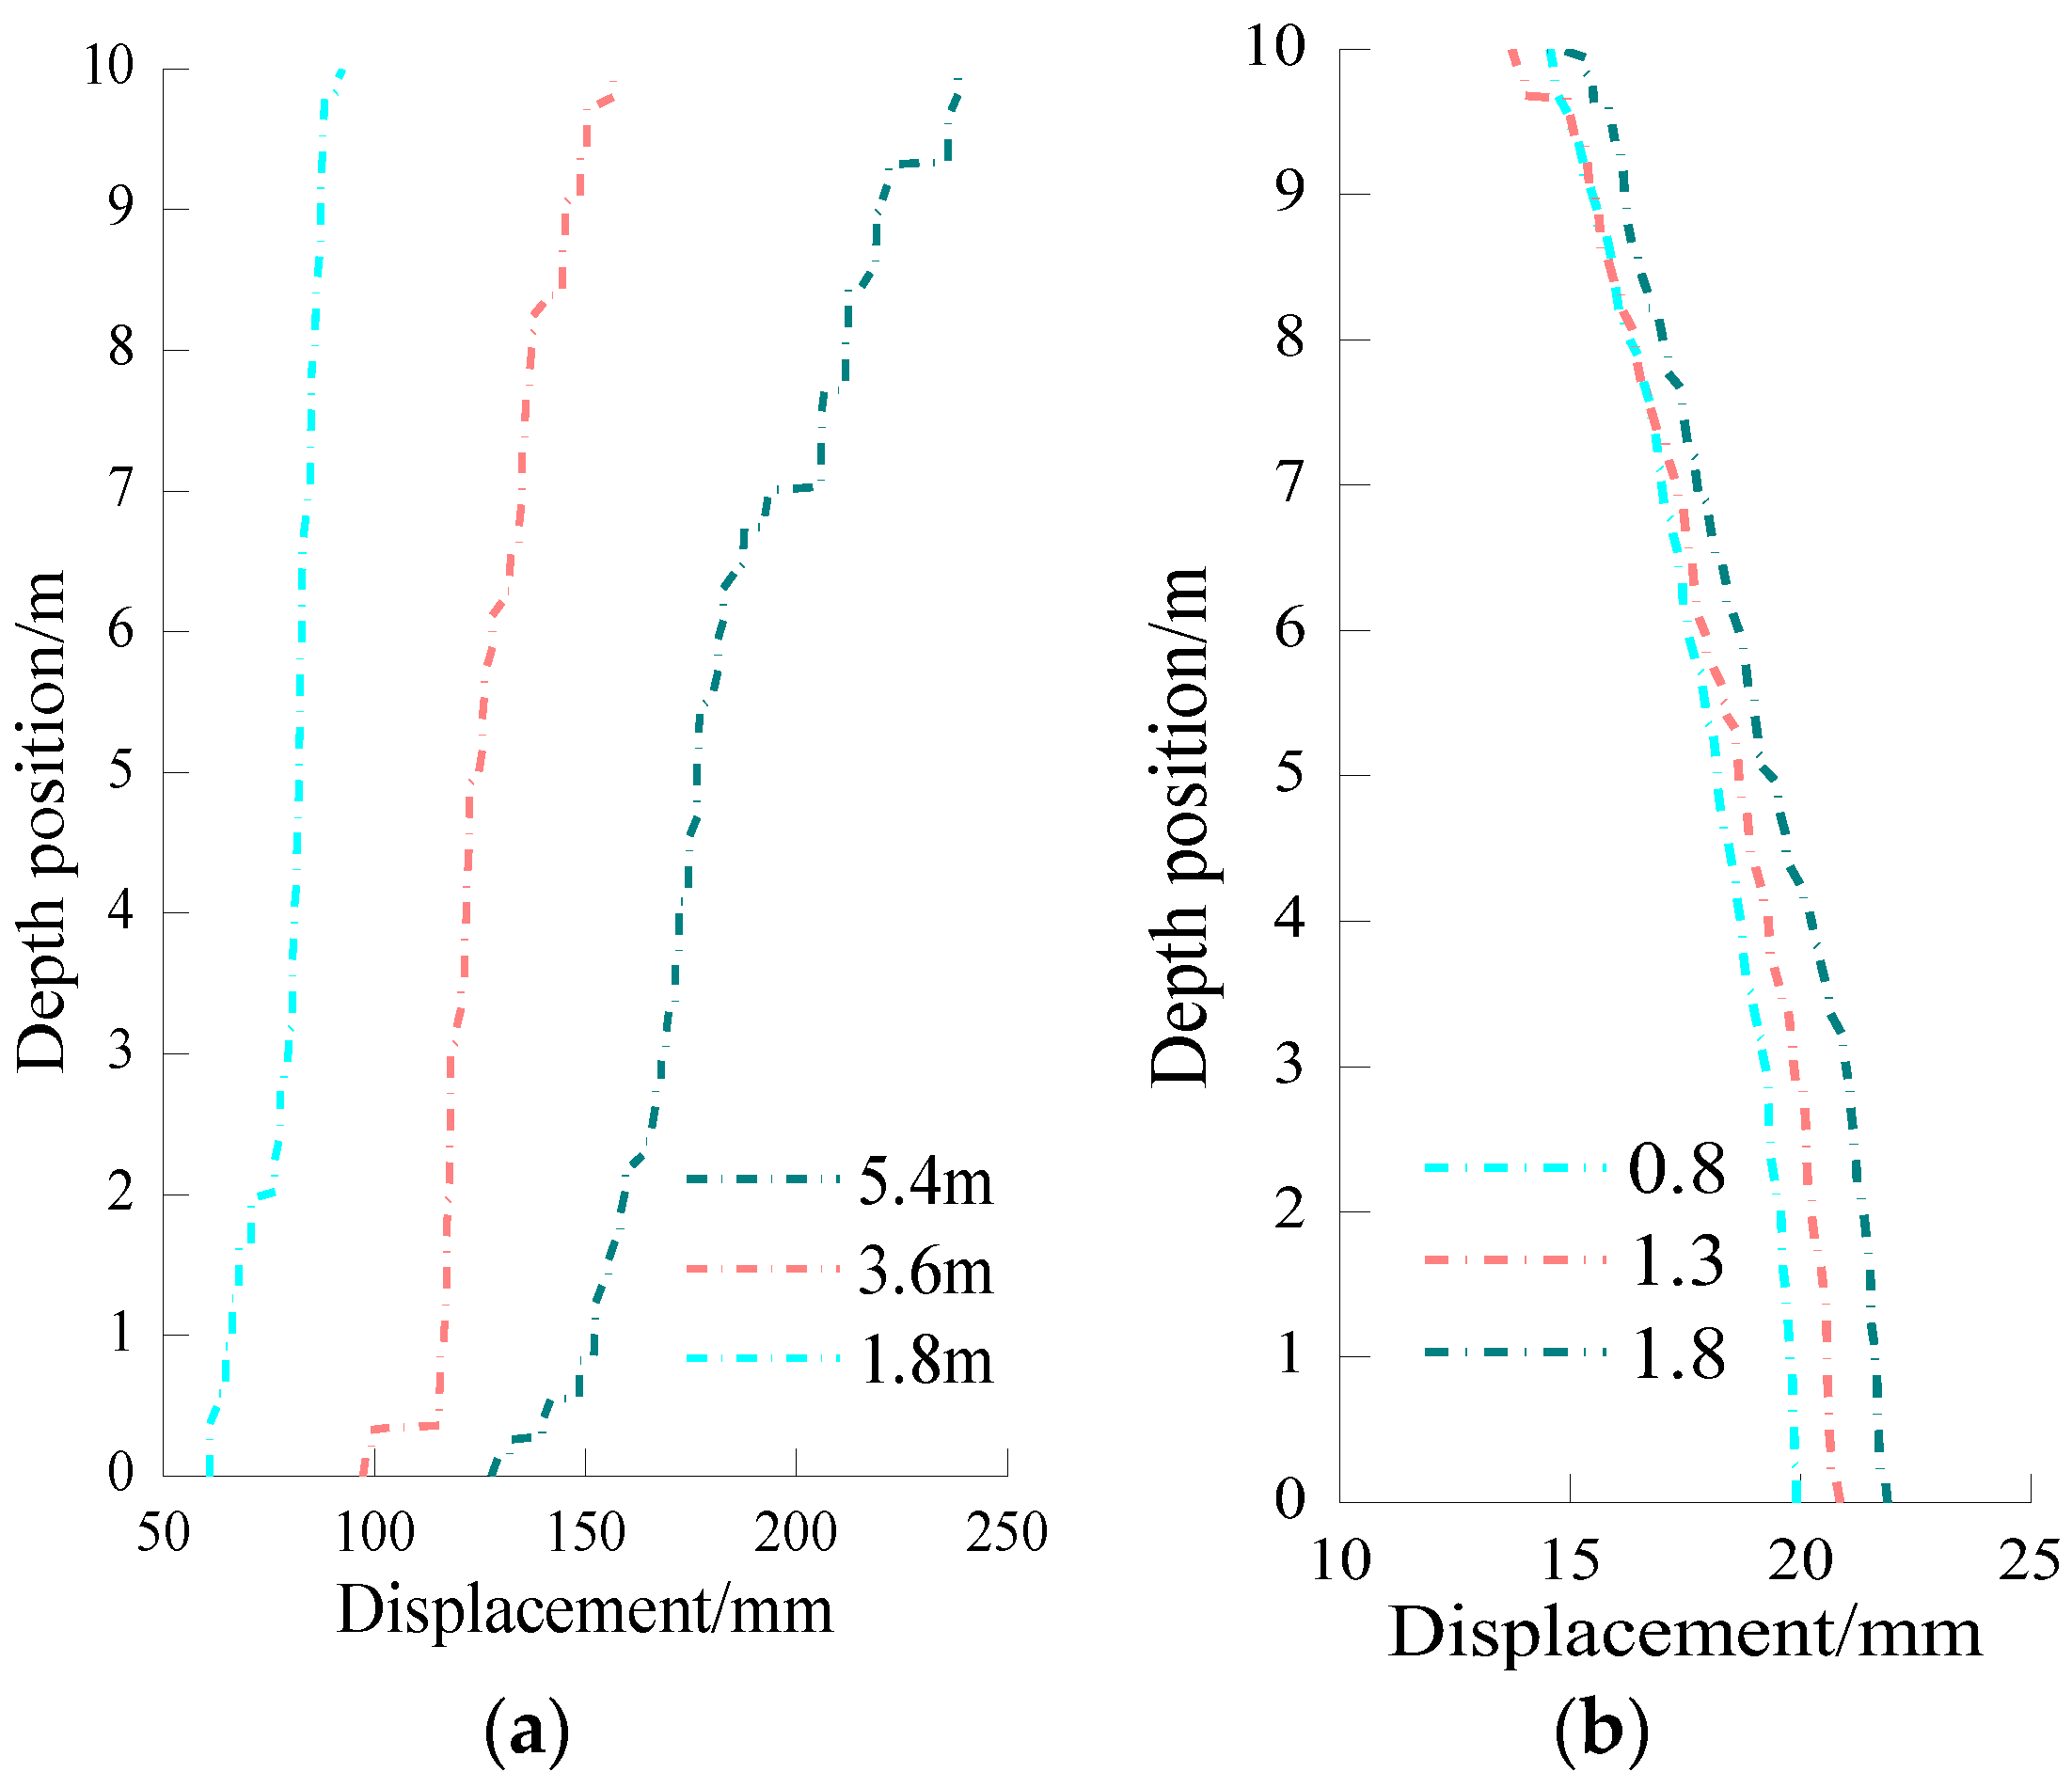
Figure 7.
Simulated displacement curve of the surrounding rock: (a) Roof; (b) coal rib.
Figure 7.
Simulated displacement curve of the surrounding rock: (a) Roof; (b) coal rib.
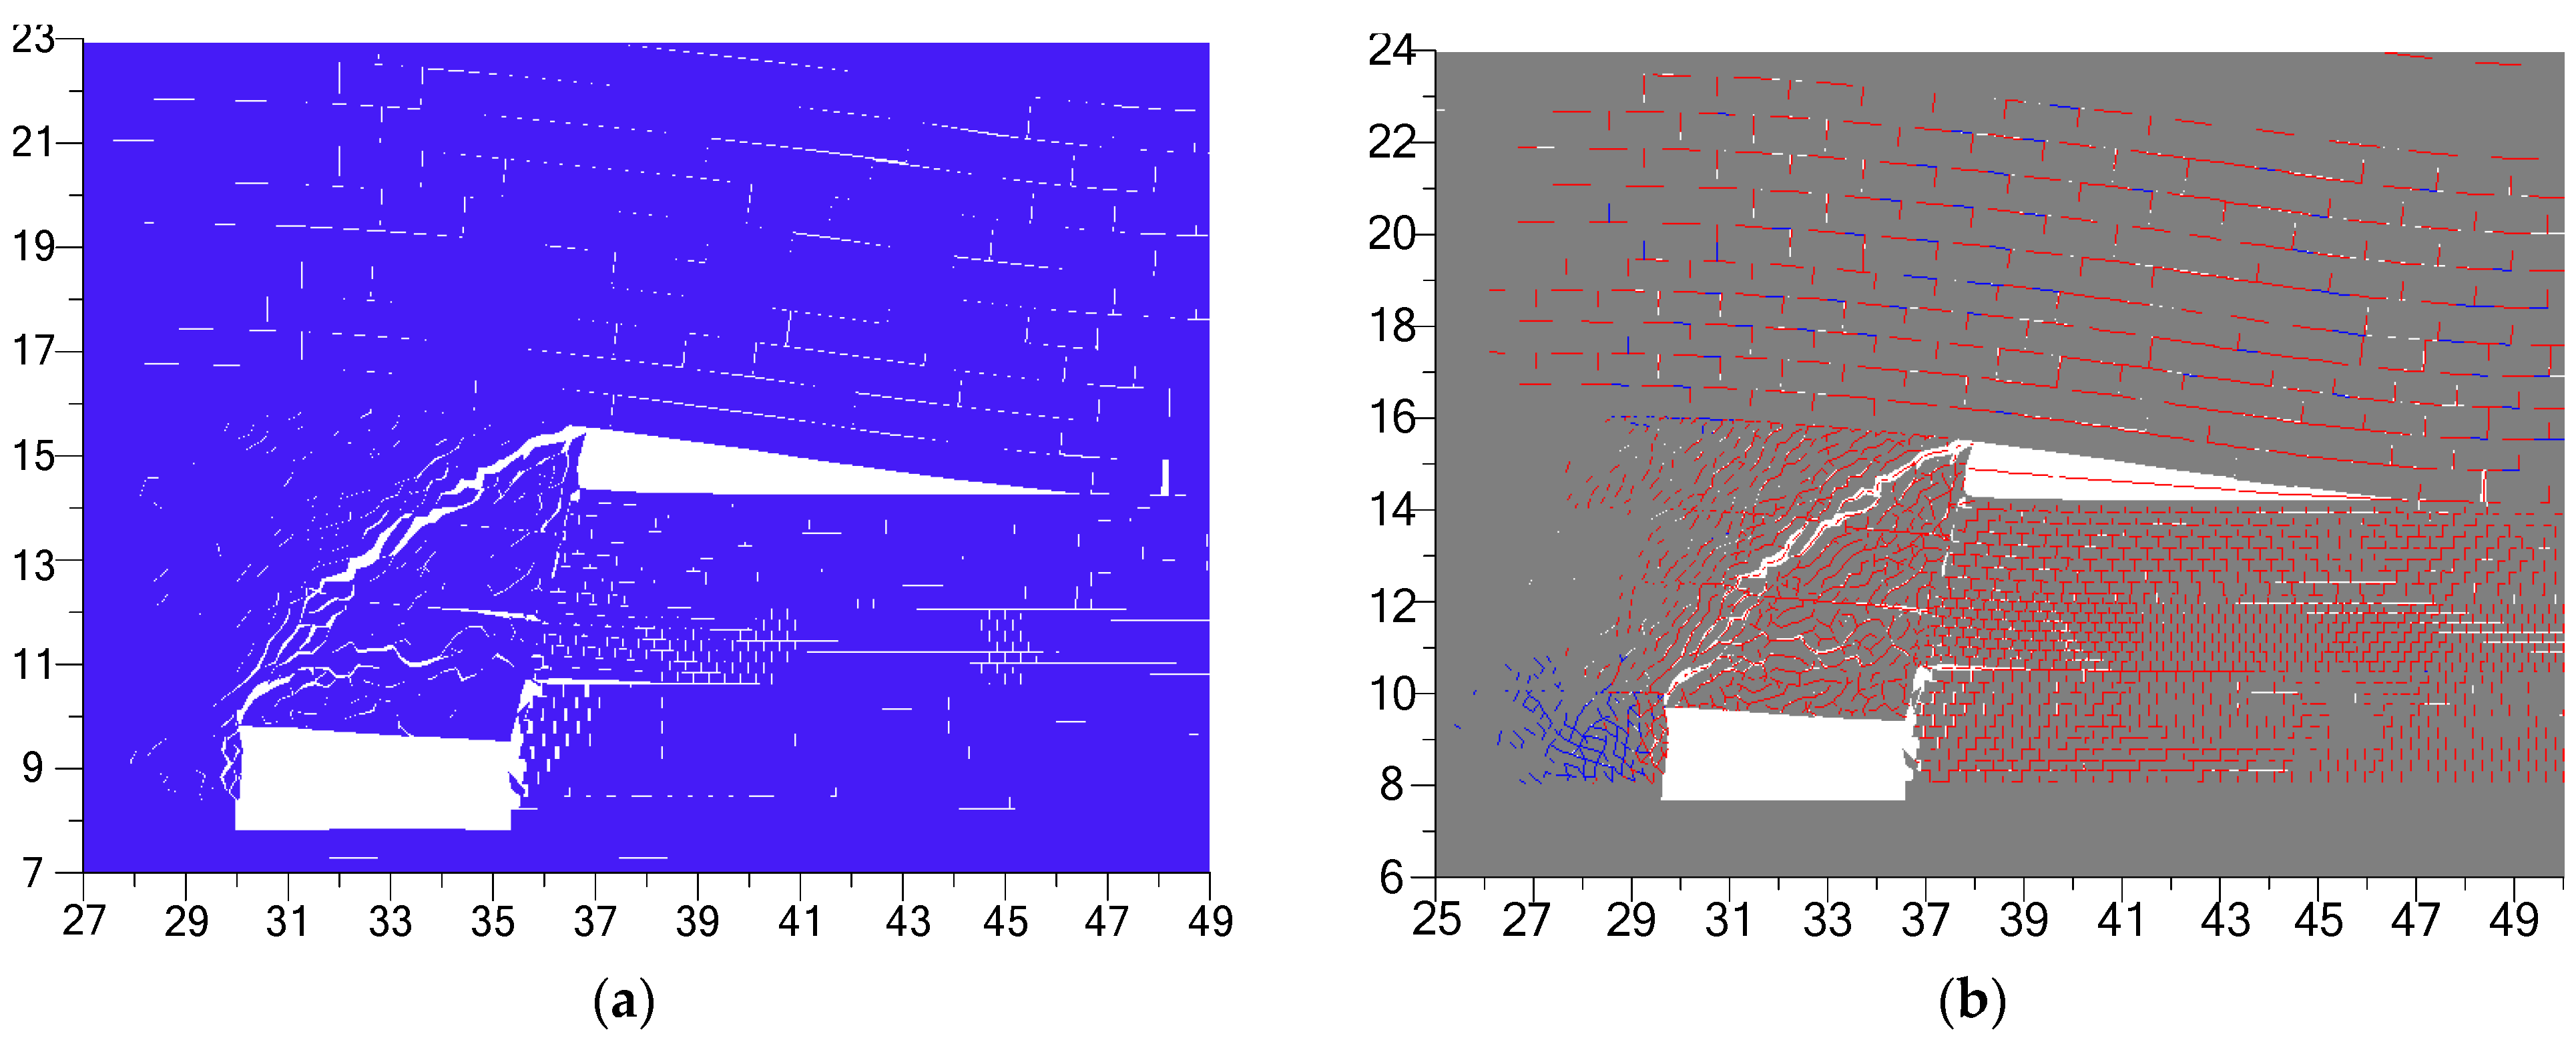
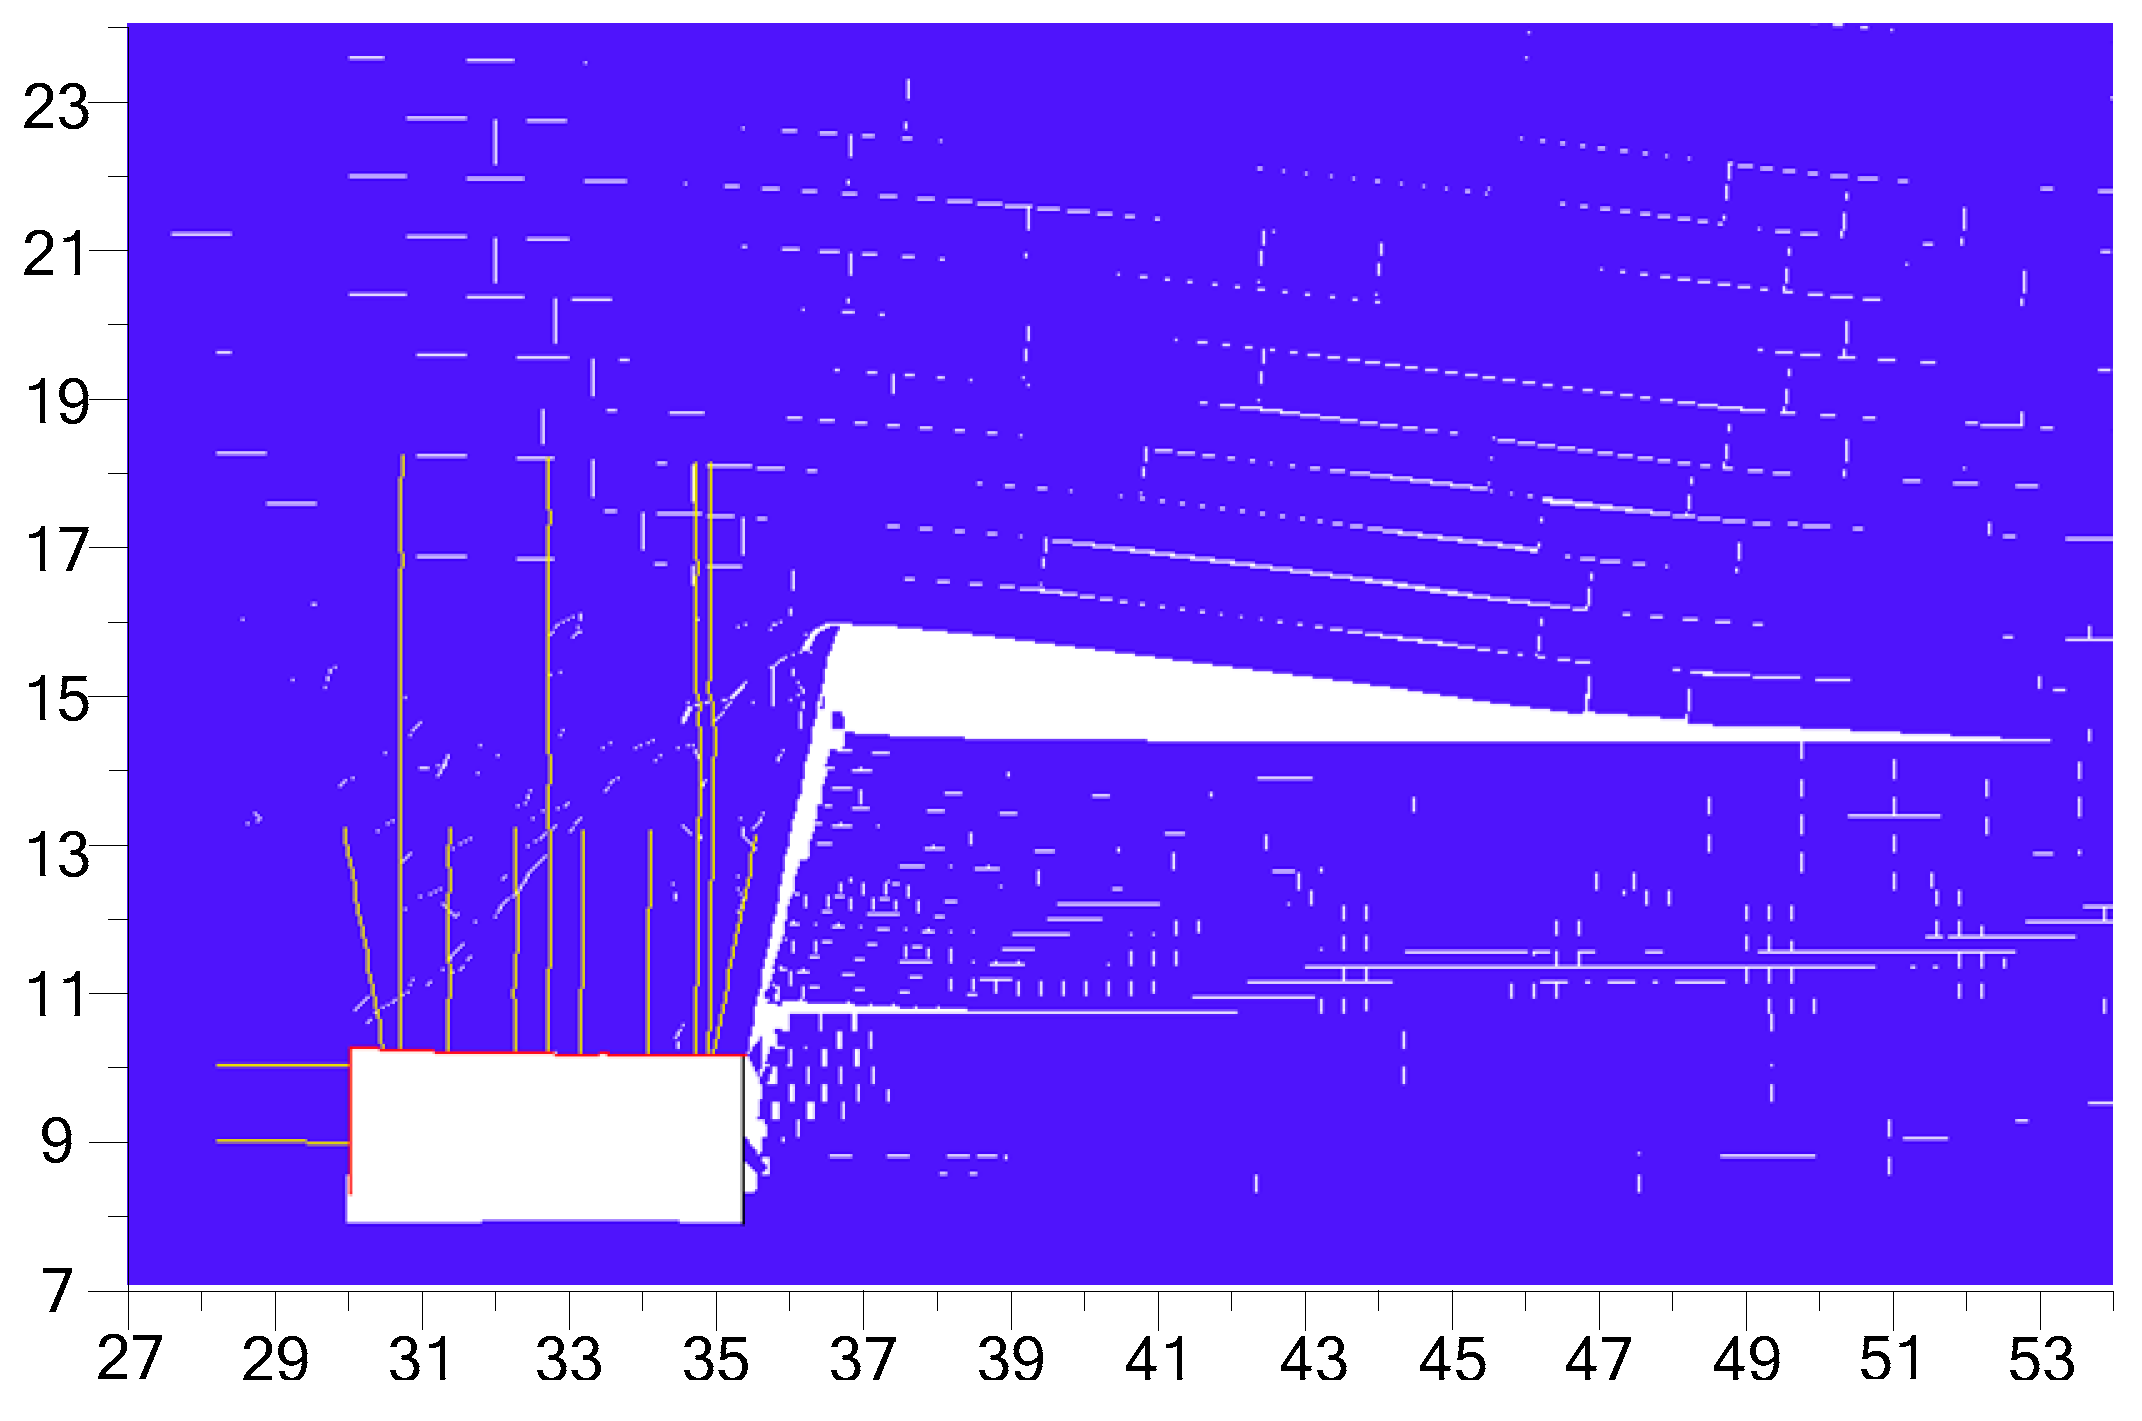
Figure 8.
Simulated failure patterns in the entry-surrounding rock: (a) Macroscopic fracture evolution; (b) microcosmic crack evolution. Tensile and shear cracks are marked by red and blue, respectively.
Figure 8.
Simulated failure patterns in the entry-surrounding rock: (a) Macroscopic fracture evolution; (b) microcosmic crack evolution. Tensile and shear cracks are marked by red and blue, respectively.
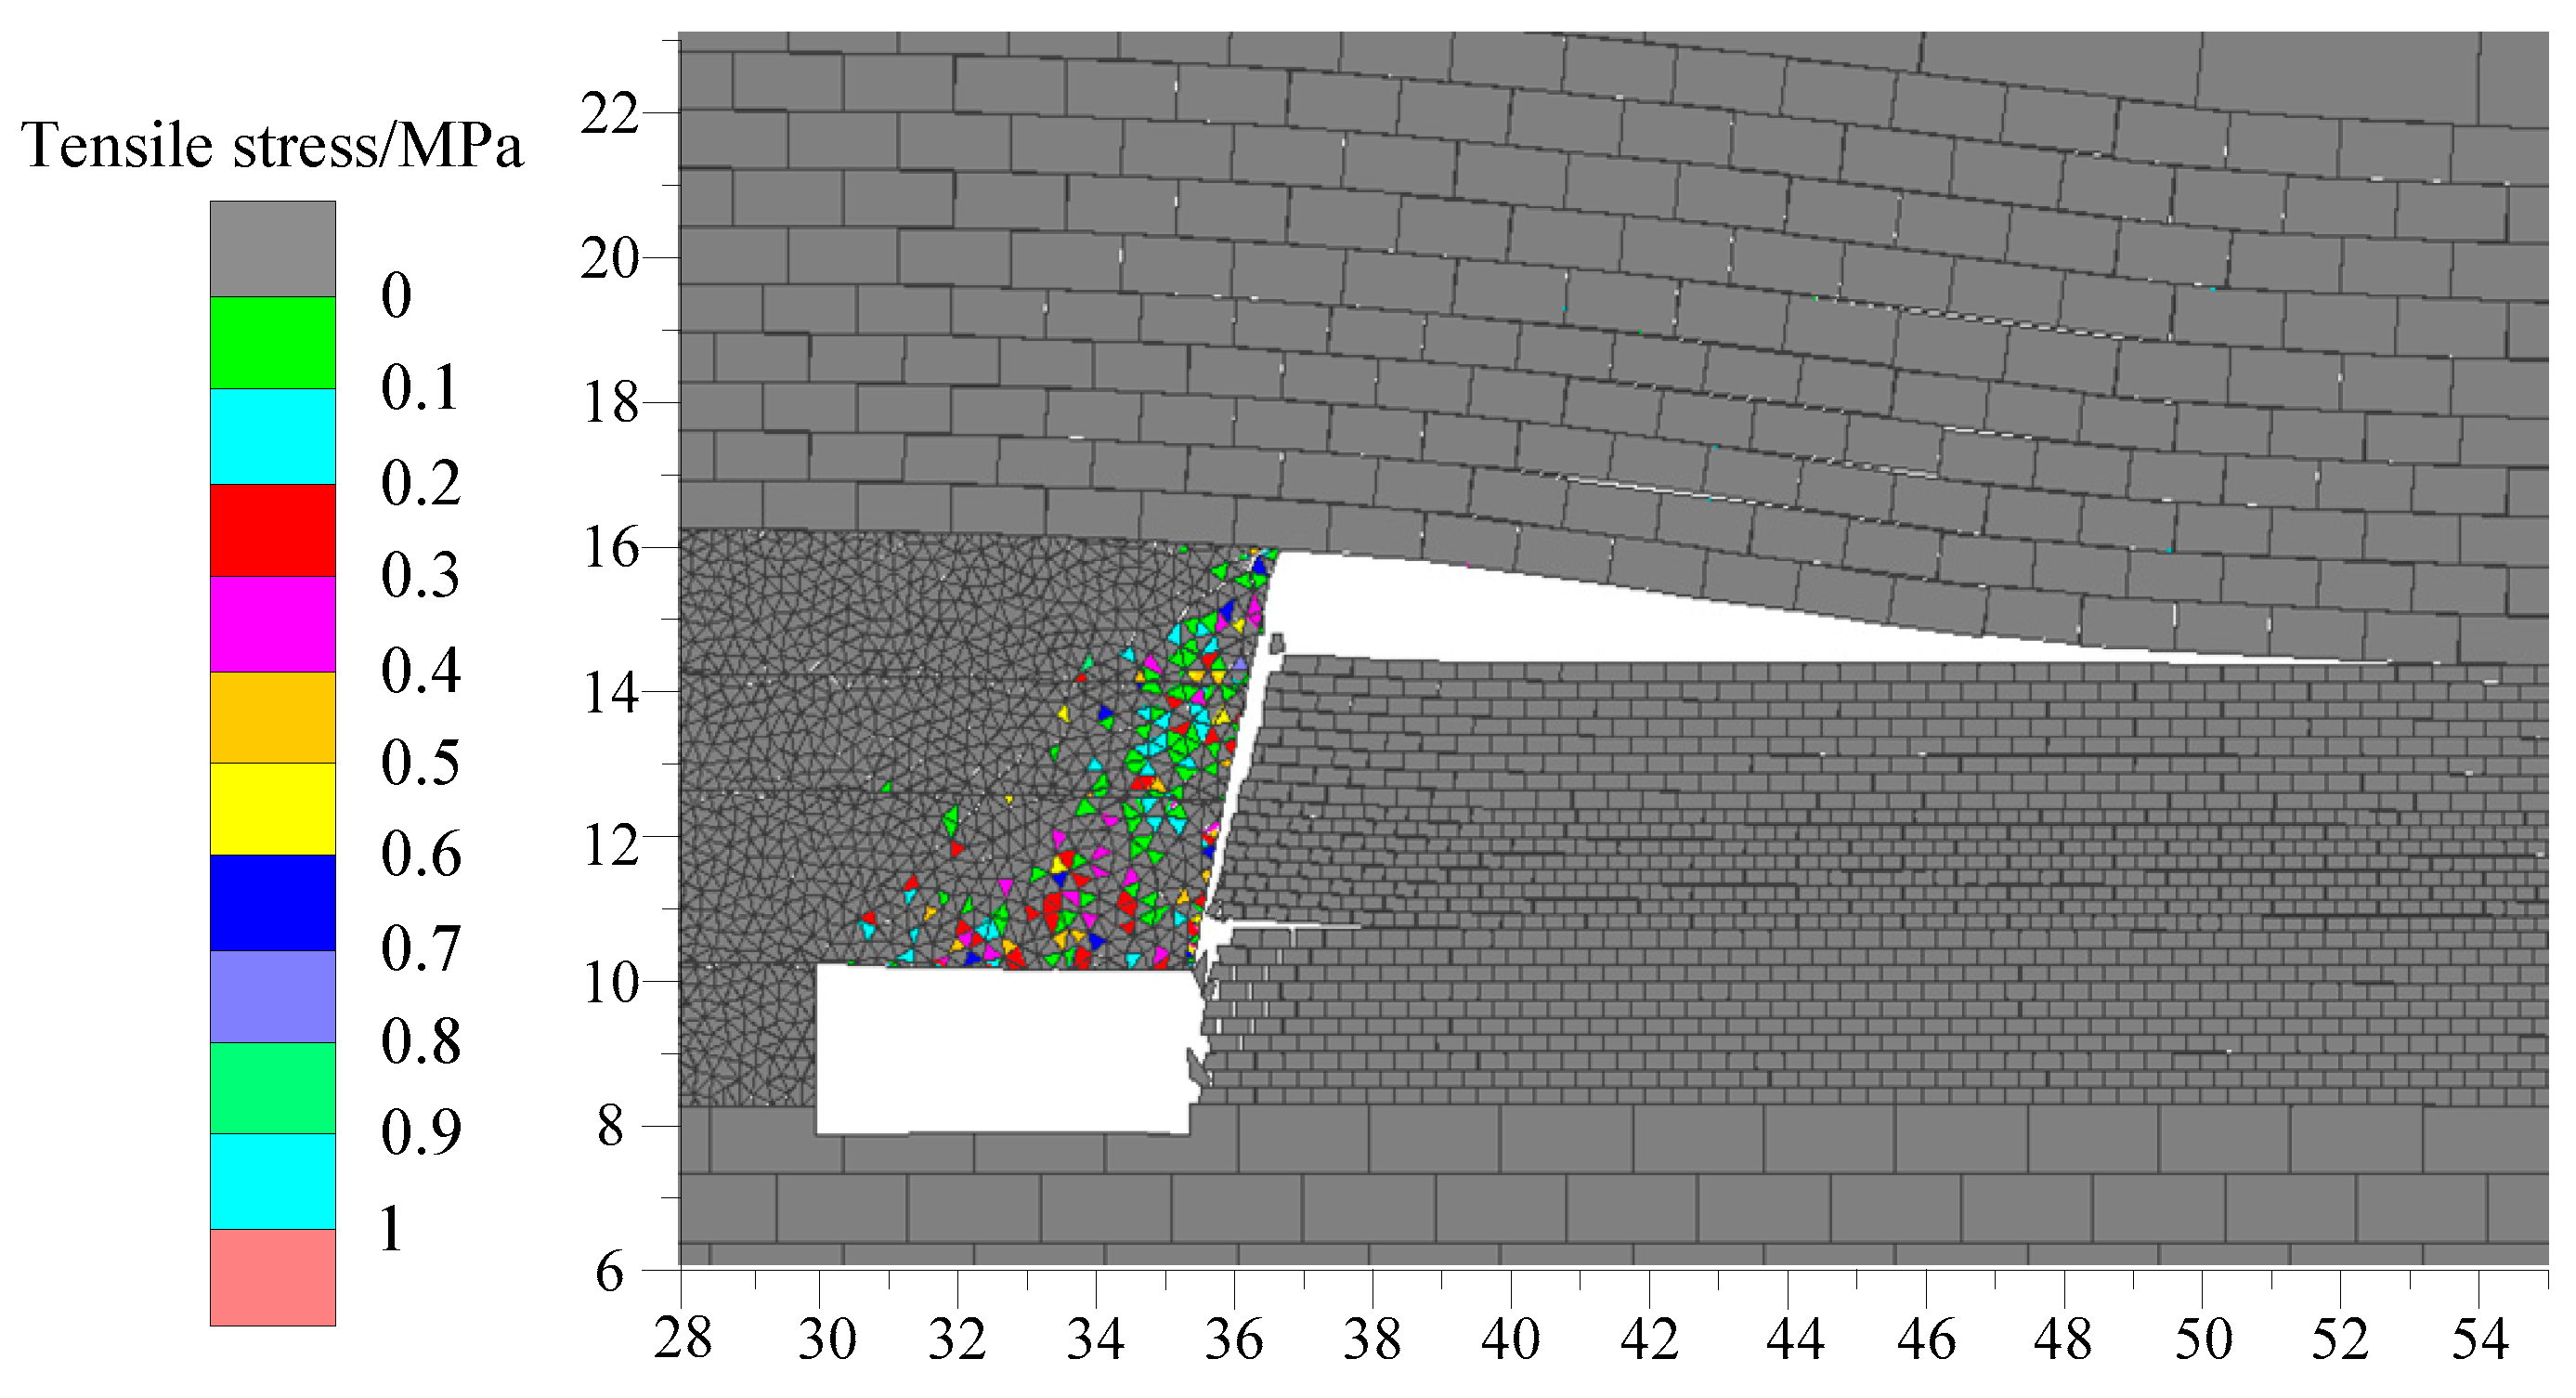
Figure 9.
Simulated stress distribution map in the entry-surrounding rock: (a) Vertical stress; (b) tensile stress.
Figure 9.
Simulated stress distribution map in the entry-surrounding rock: (a) Vertical stress; (b) tensile stress.
Figure 10.
Support scheme of the gob-side entry.
Figure 10.
Support scheme of the gob-side entry.
Figure 11.
Numerical model of the gob-side entry in a supporting condition.
Figure 11.
Numerical model of the gob-side entry in a supporting condition.
Figure 12.
Simulated localized tensile stress distribution map in the entry-surrounding rock in a supported condition.
Figure 12.
Simulated localized tensile stress distribution map in the entry-surrounding rock in a supported condition.
Figure 13.
Simulated microscopic crack evolution in the entry-surrounding rock in a supported condition.
Figure 13.
Simulated microscopic crack evolution in the entry-surrounding rock in a supported condition.
Figure 14.
Simulated failure patterns of the entry in a supported condition.
Figure 14.
Simulated failure patterns of the entry in a supported condition.
Figure 15.
Simulated displacement map of the entry-surrounding rock in a supported condition.
Figure 15.
Simulated displacement map of the entry-surrounding rock in a supported condition.
Figure 16.
Simulated displacement curves of the surrounding rock in a supported condition: (a) Roof; (b) rib.
Figure 16.
Simulated displacement curves of the surrounding rock in a supported condition: (a) Roof; (b) rib.
Figure 17.
Principles of the directional roof-cutting technique.
Figure 17.
Principles of the directional roof-cutting technique.
Figure 18.
Cumulative blasting effect: (a) The cutting plane in the immediate roof; (b) the cutting plane on the entry roof surface.
Figure 18.
Cumulative blasting effect: (a) The cutting plane in the immediate roof; (b) the cutting plane on the entry roof surface.
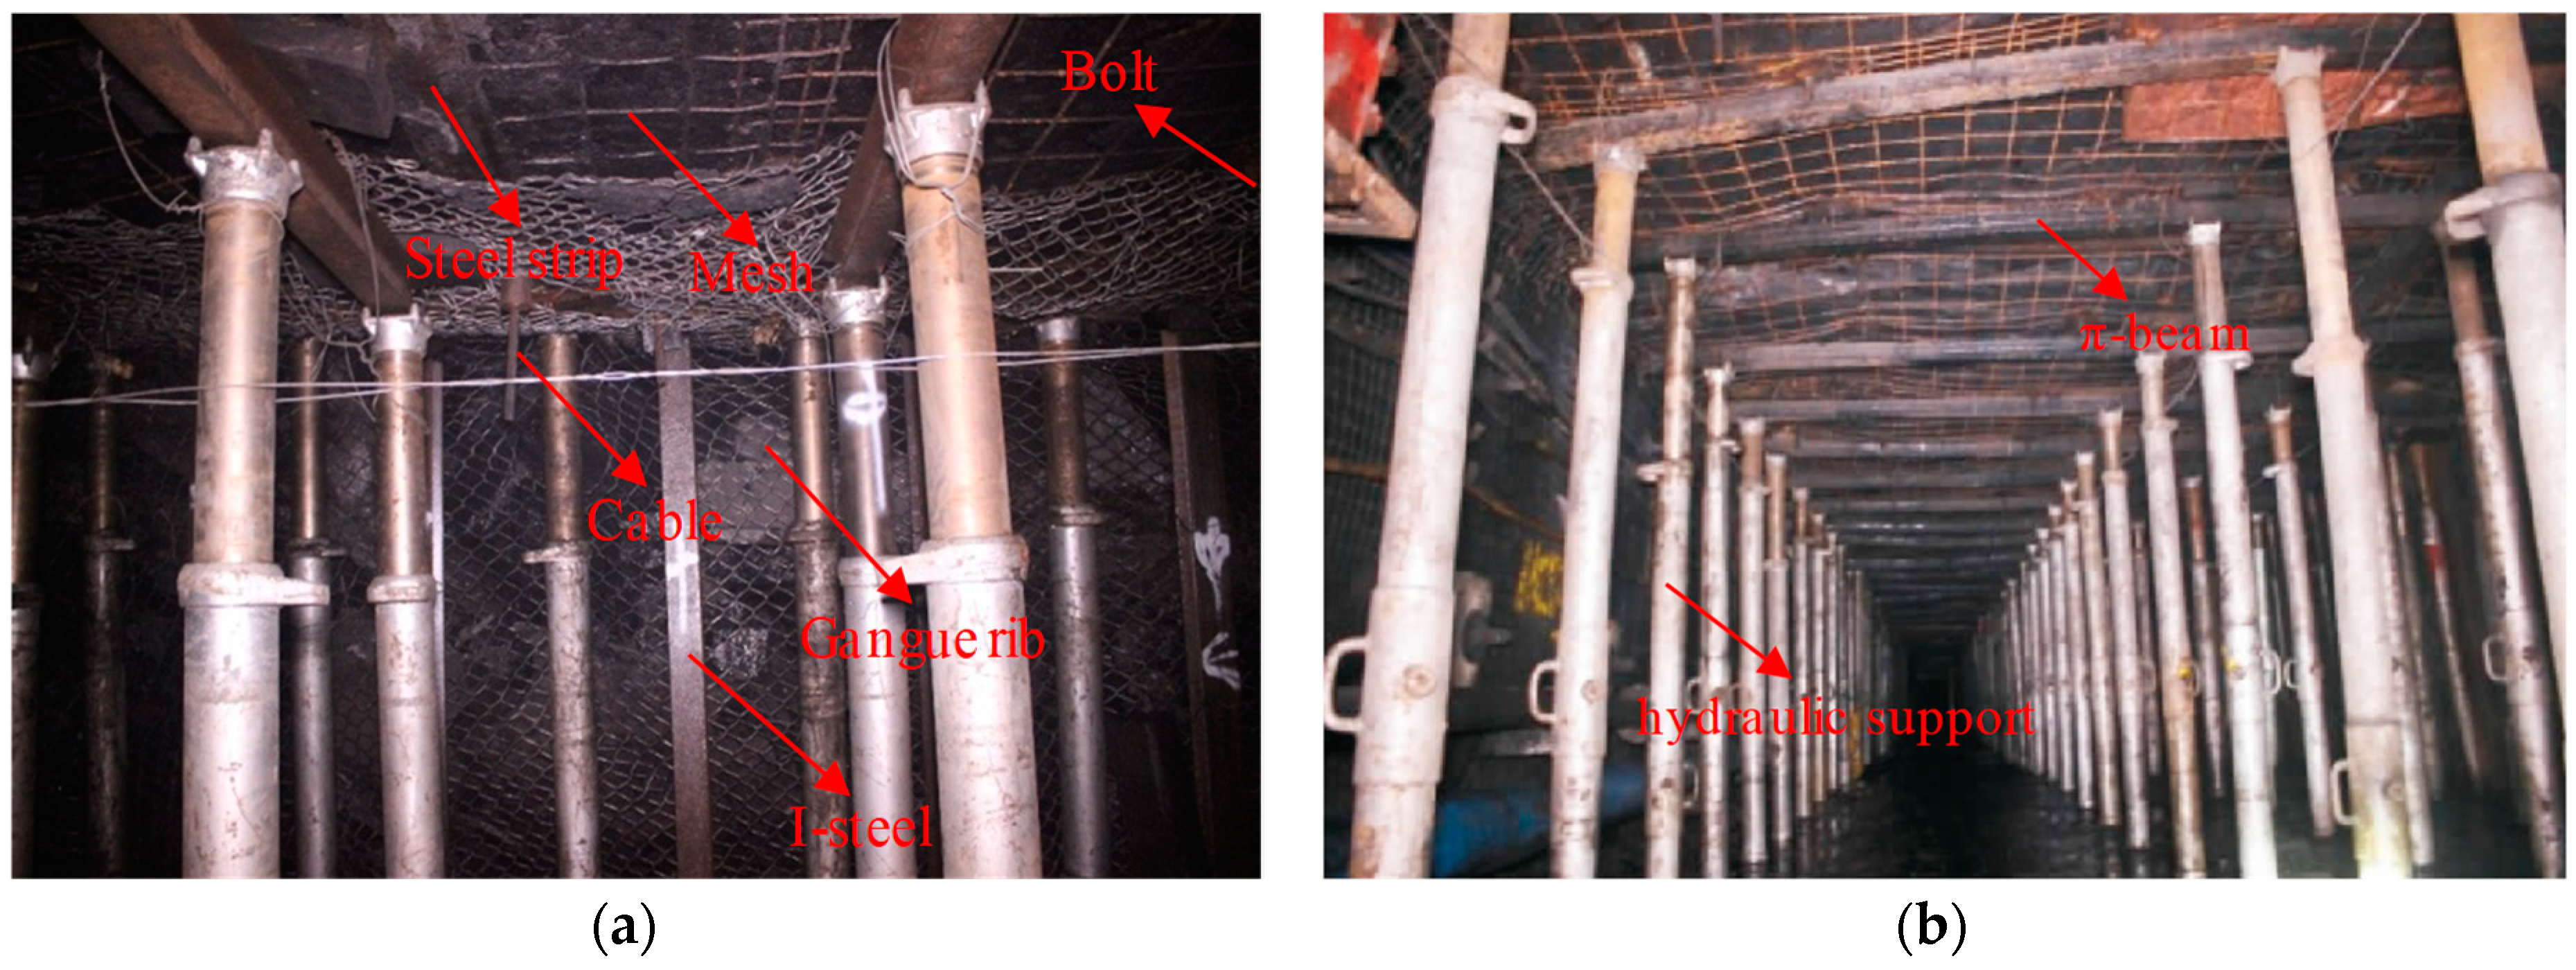
Figure 19.
Support system installation in the entry: (a) Active flexible support system; (b) passive rigid support system.
Figure 19.
Support system installation in the entry: (a) Active flexible support system; (b) passive rigid support system.
Figure 20.
Real-time monitoring equipment for entry deformation: (a) Abscission sensor; (b) convergence sensor.
Figure 20.
Real-time monitoring equipment for entry deformation: (a) Abscission sensor; (b) convergence sensor.
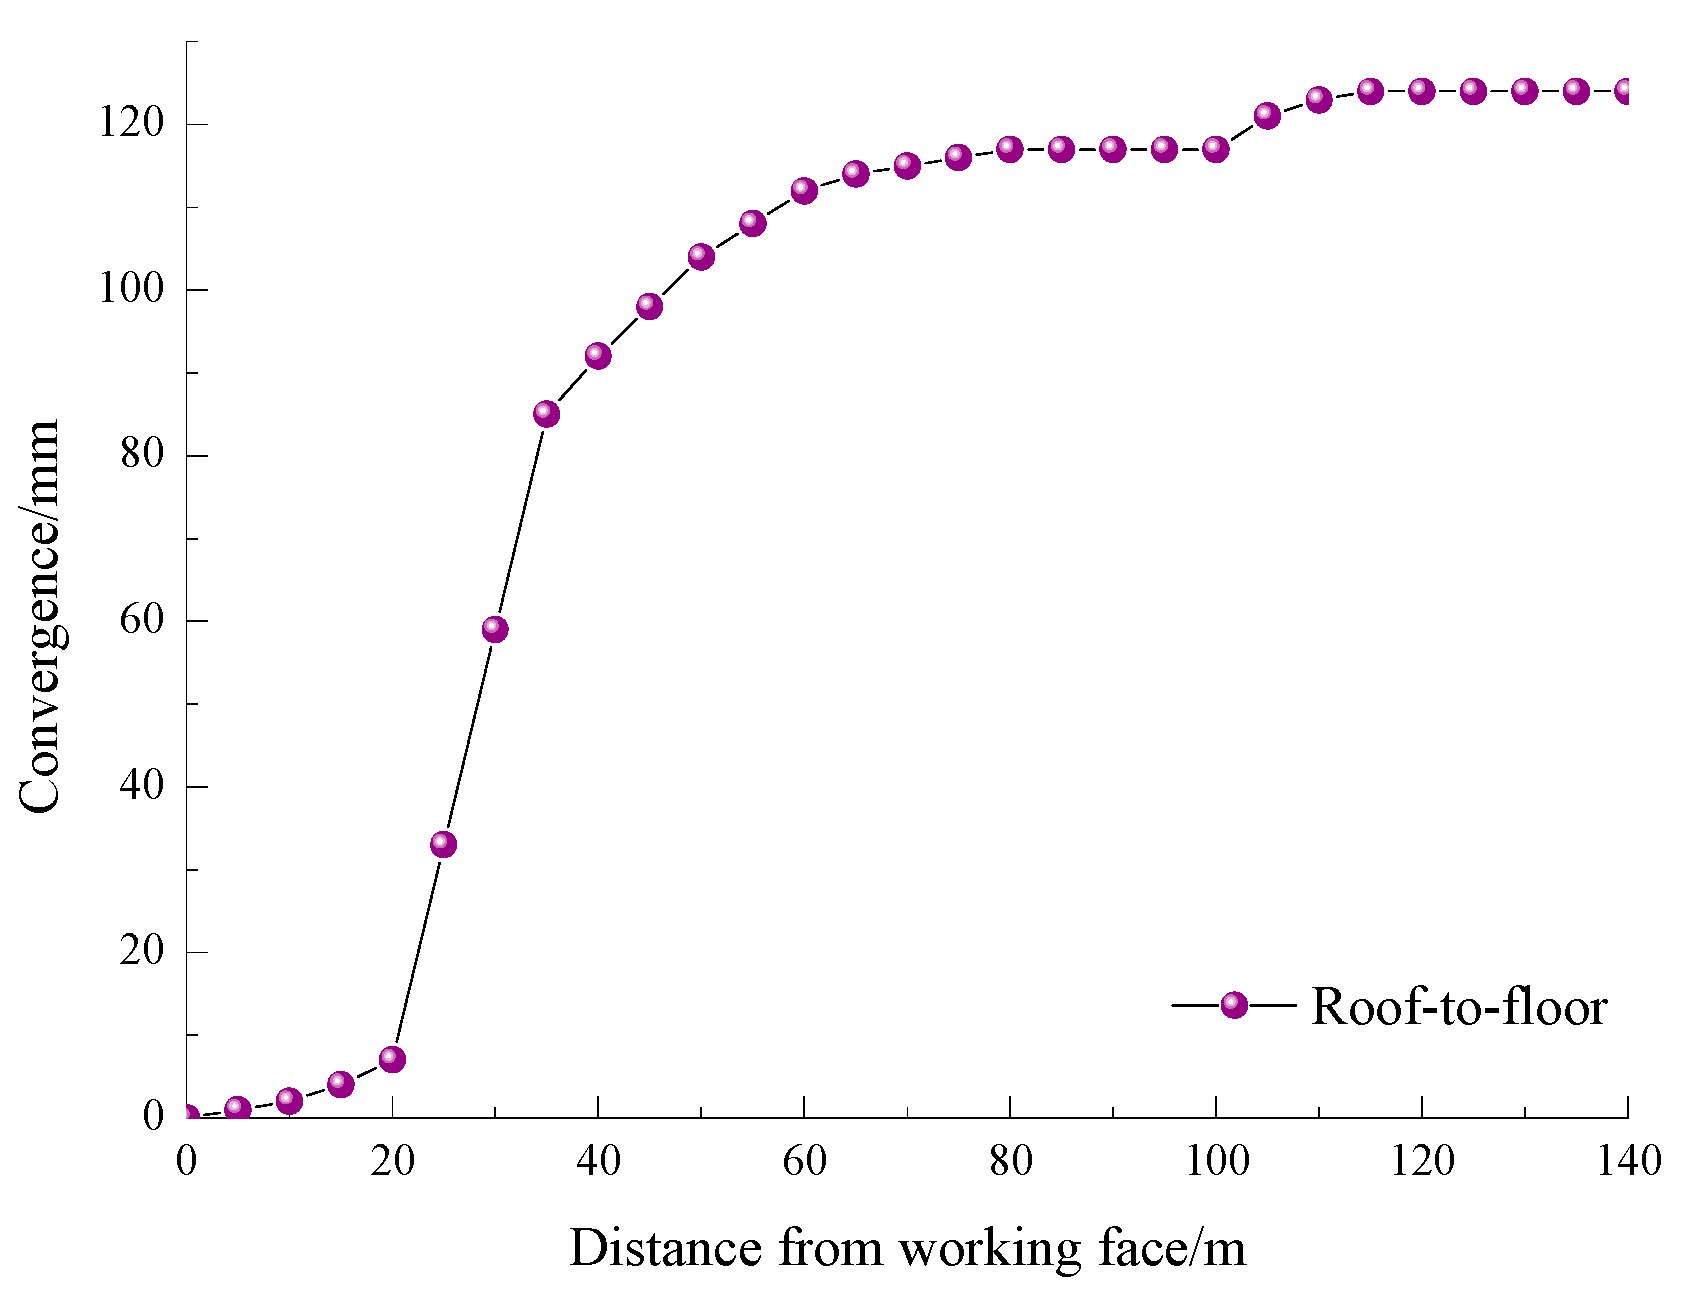
Figure 21.
Real-time monitoring curve of roof and floor convergence.
Figure 21.
Real-time monitoring curve of roof and floor convergence.
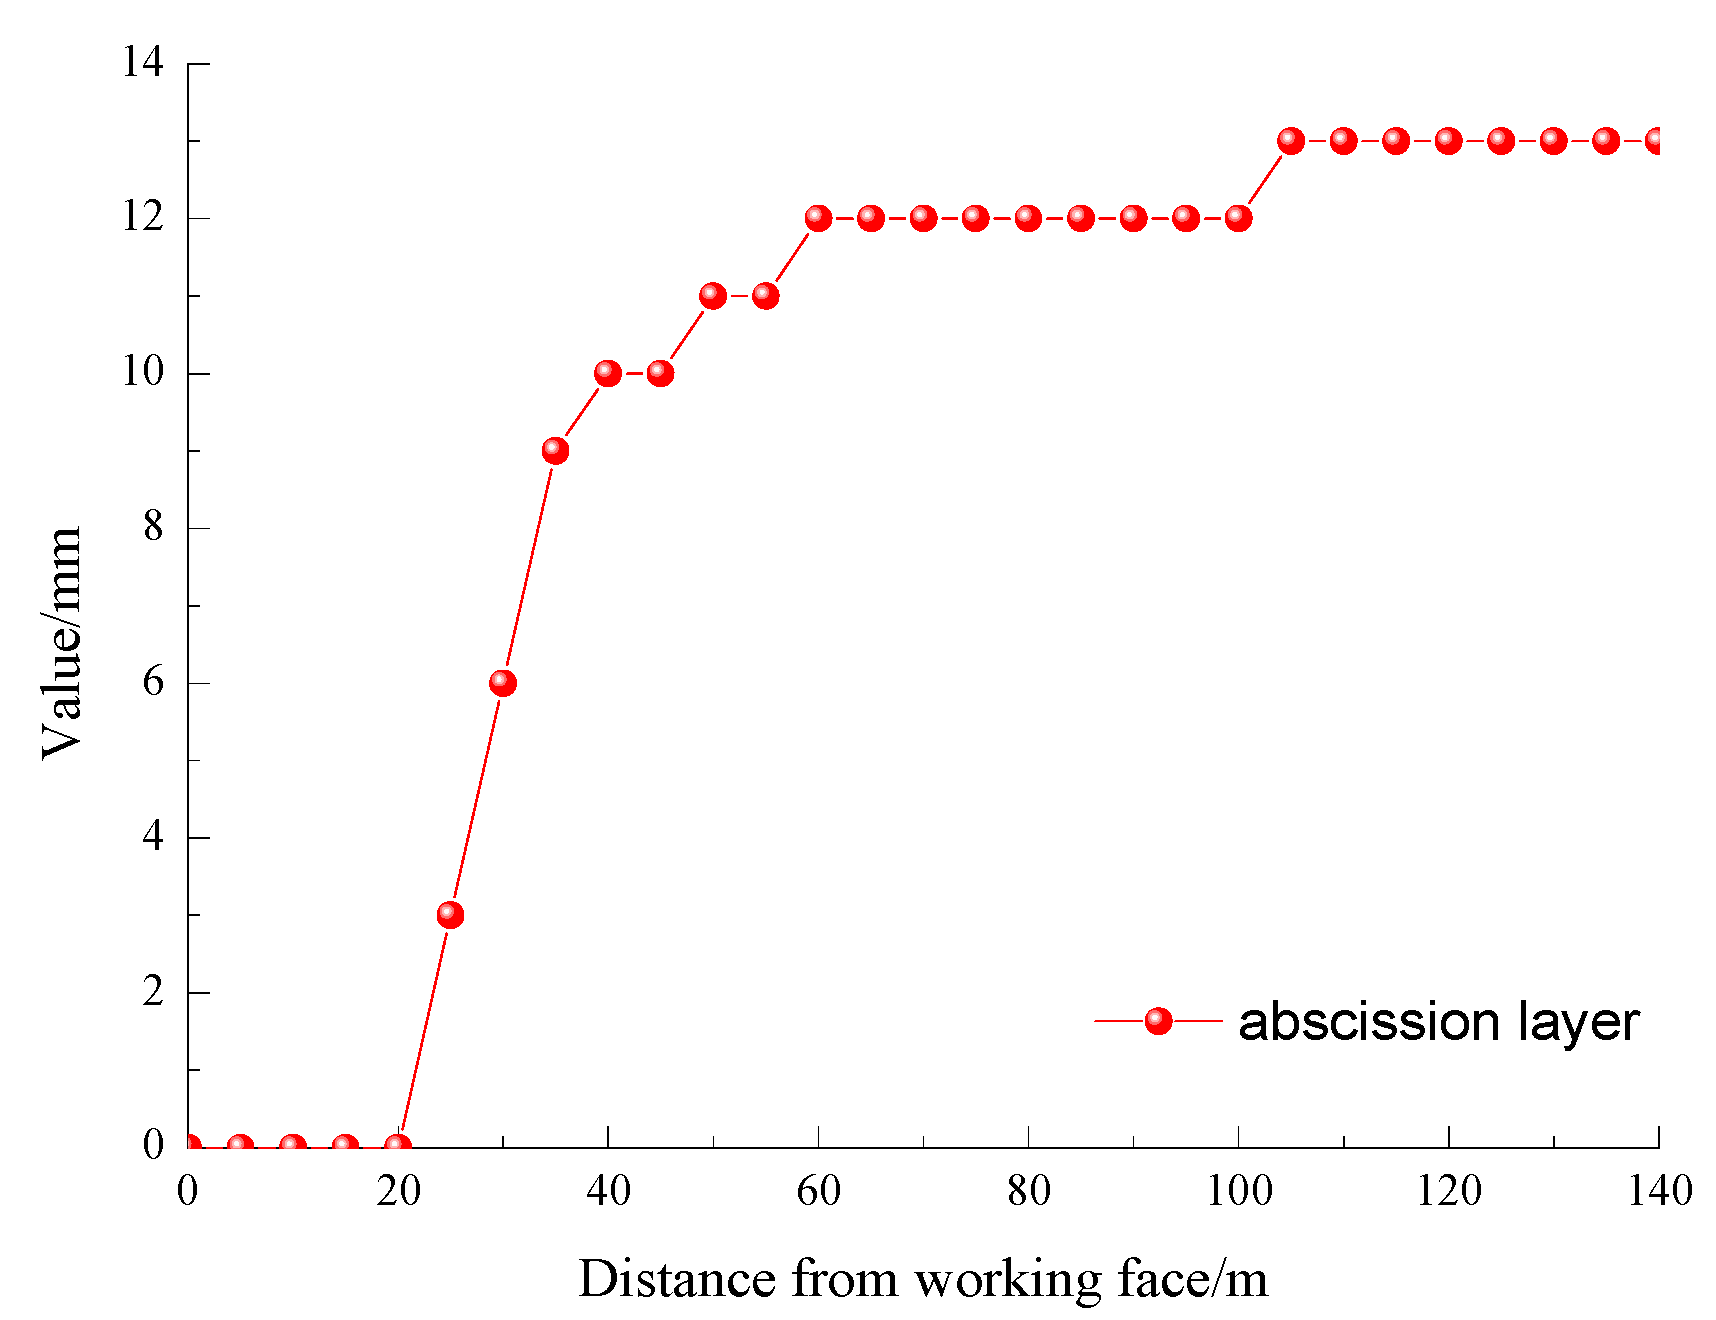
Figure 22.
Real-time monitoring curve of the abscission layer in the immediate roof.
Figure 22.
Real-time monitoring curve of the abscission layer in the immediate roof.
Figure 23.
Effect of the formed roadway after removing the hydraulic support and the π-beam.
Figure 23.
Effect of the formed roadway after removing the hydraulic support and the π-beam.
Table 1.
Intact rock and calculated rock mass physico-mechanical parameters.
Table 1.
Intact rock and calculated rock mass physico-mechanical parameters.
| Lithology | Intact Rock | Rock Mass |
|---|
| σci (MPa) | Eci (GPa) | Em (GPa) | σcm (MPa) | σtm (MPa) |
|---|
| Siltstone | 53.8 | 6.64 | 9.67 | 31.2 | 3.12 |
| Coal | 21.7 | 2.33 | 3.9 | 12.59 | 1.26 |
| Mudstone | 47.6 | 3.78 | 8.56 | 27.61 | 2.76 |
| Fine sandstone | 58.3 | 6.98 | 10.48 | 33.81 | 3.38 |
| Loess | 24.2 | 2.4 | 4.35 | 14.04 | 1.4 |
Table 2.
Physical and mechanical parameters of rock mass used in the UDEC model.
Table 2.
Physical and mechanical parameters of rock mass used in the UDEC model.
| Lithology | Block Parameters | Contact Parameters |
|---|
| Density (kg·m−3) | Bulk Modulus (GPa) | Shear Modulus (GPa) | Kn (GPa·m−1) | Ks (GPa·m−1) | Cj (MPa) | φj (°) | σtj (MPa) |
|---|
| Siltstone | 2560 | 6.72 | 3.84 | 973.2 | 389.3 | 9.7 | 14 | 3.12 |
| Coal | 1400 | 3.4 | 1.5 | 266.2 | 106.5 | 4.82 | 5 | 1.26 |
| Mudstone | 2000 | 6.48 | 3.34 | 927.7 | 371.1 | 9.4 | 9 | 2.76 |
| Fine sandstone | 2590 | 6.47 | 4.26 | 1075.97 | 430.4 | 9.75 | 15 | 3.38 |
| Loess | 1790 | 3.63 | 1.67 | 334.2 | 133.7 | 5.11 | 6 | 1.4 |
Table 3.
Calibrated Young’s modulus value and the compressive strength value in the UDEC model.
Table 3.
Calibrated Young’s modulus value and the compressive strength value in the UDEC model.
| Lithology | Young’s Modulus (GPa) | Compressive Strength (MPa) |
|---|
| Target Value | Calibrated Value | Error (%) | Target Value | Calibrated Value | Error (%) |
|---|
| Siltstone | 9.67 | 9.60 | 0.7 | 31.2 | 31.71 | 1.6 |
| Coal | 3.9 | 3.83 | 1.8 | 12.59 | 12.81 | 1.7 |
| Mudstone | 8.56 | 8.54 | 0.2 | 27.61 | 28.08 | 1.7 |
| Fine sandstone | 10.48 | 10.43 | 0.5 | 33.81 | 34.17 | 1.1 |
| Loess | 4.35 | 4.29 | 1.4 | 14.04 | 14.02 | 0.1 |
Table 4.
Properties of the bolt and cable elements used in the UDEC.
Table 4.
Properties of the bolt and cable elements used in the UDEC.
| Parameters | Density (kg·m−3) | Elastic Moduli (GPa) | Tensile Capability (kN) | Bond Stiffness (N/m2) | Bond Strength (N/m) | Pretension (kN) |
|---|
| Cable | 7500 | 200 | 480 | 2 × 10⁹ | 4 × 10⁵ | 280 |
| Bolt | 7500 | 200 | 120 | 2 × 10⁹ | 4 × 10⁵ | 80 |
Table 5.
Properties of the structure element in the UDEC.
Table 5.
Properties of the structure element in the UDEC.
| Parameters | Elastic Moduli (GPa) | Tensile Strength (MPa) | Compressive Strength (MPa) | Contact Normal Stiffness (GPa·m−1) | Contact Shear Stiffness (GPa·m−1) |
|---|
| Structure | 200 | 40 | 40 | 4 | 4 |
Table 6.
Properties of the support element in the UDEC.
Table 6.
Properties of the support element in the UDEC.
| Parameters | Axial Stiffness (GPa·m−1) | Compressive Yield Strength (MPa) |
|---|
| Support | 3 | 40 |

 ,
, 


