Boric Acid: A High Potential Candidate for Thermochemical Energy Storage

 , , , ,
  ,
, 
Abstract
:1. Introduction
2. Materials and Methods
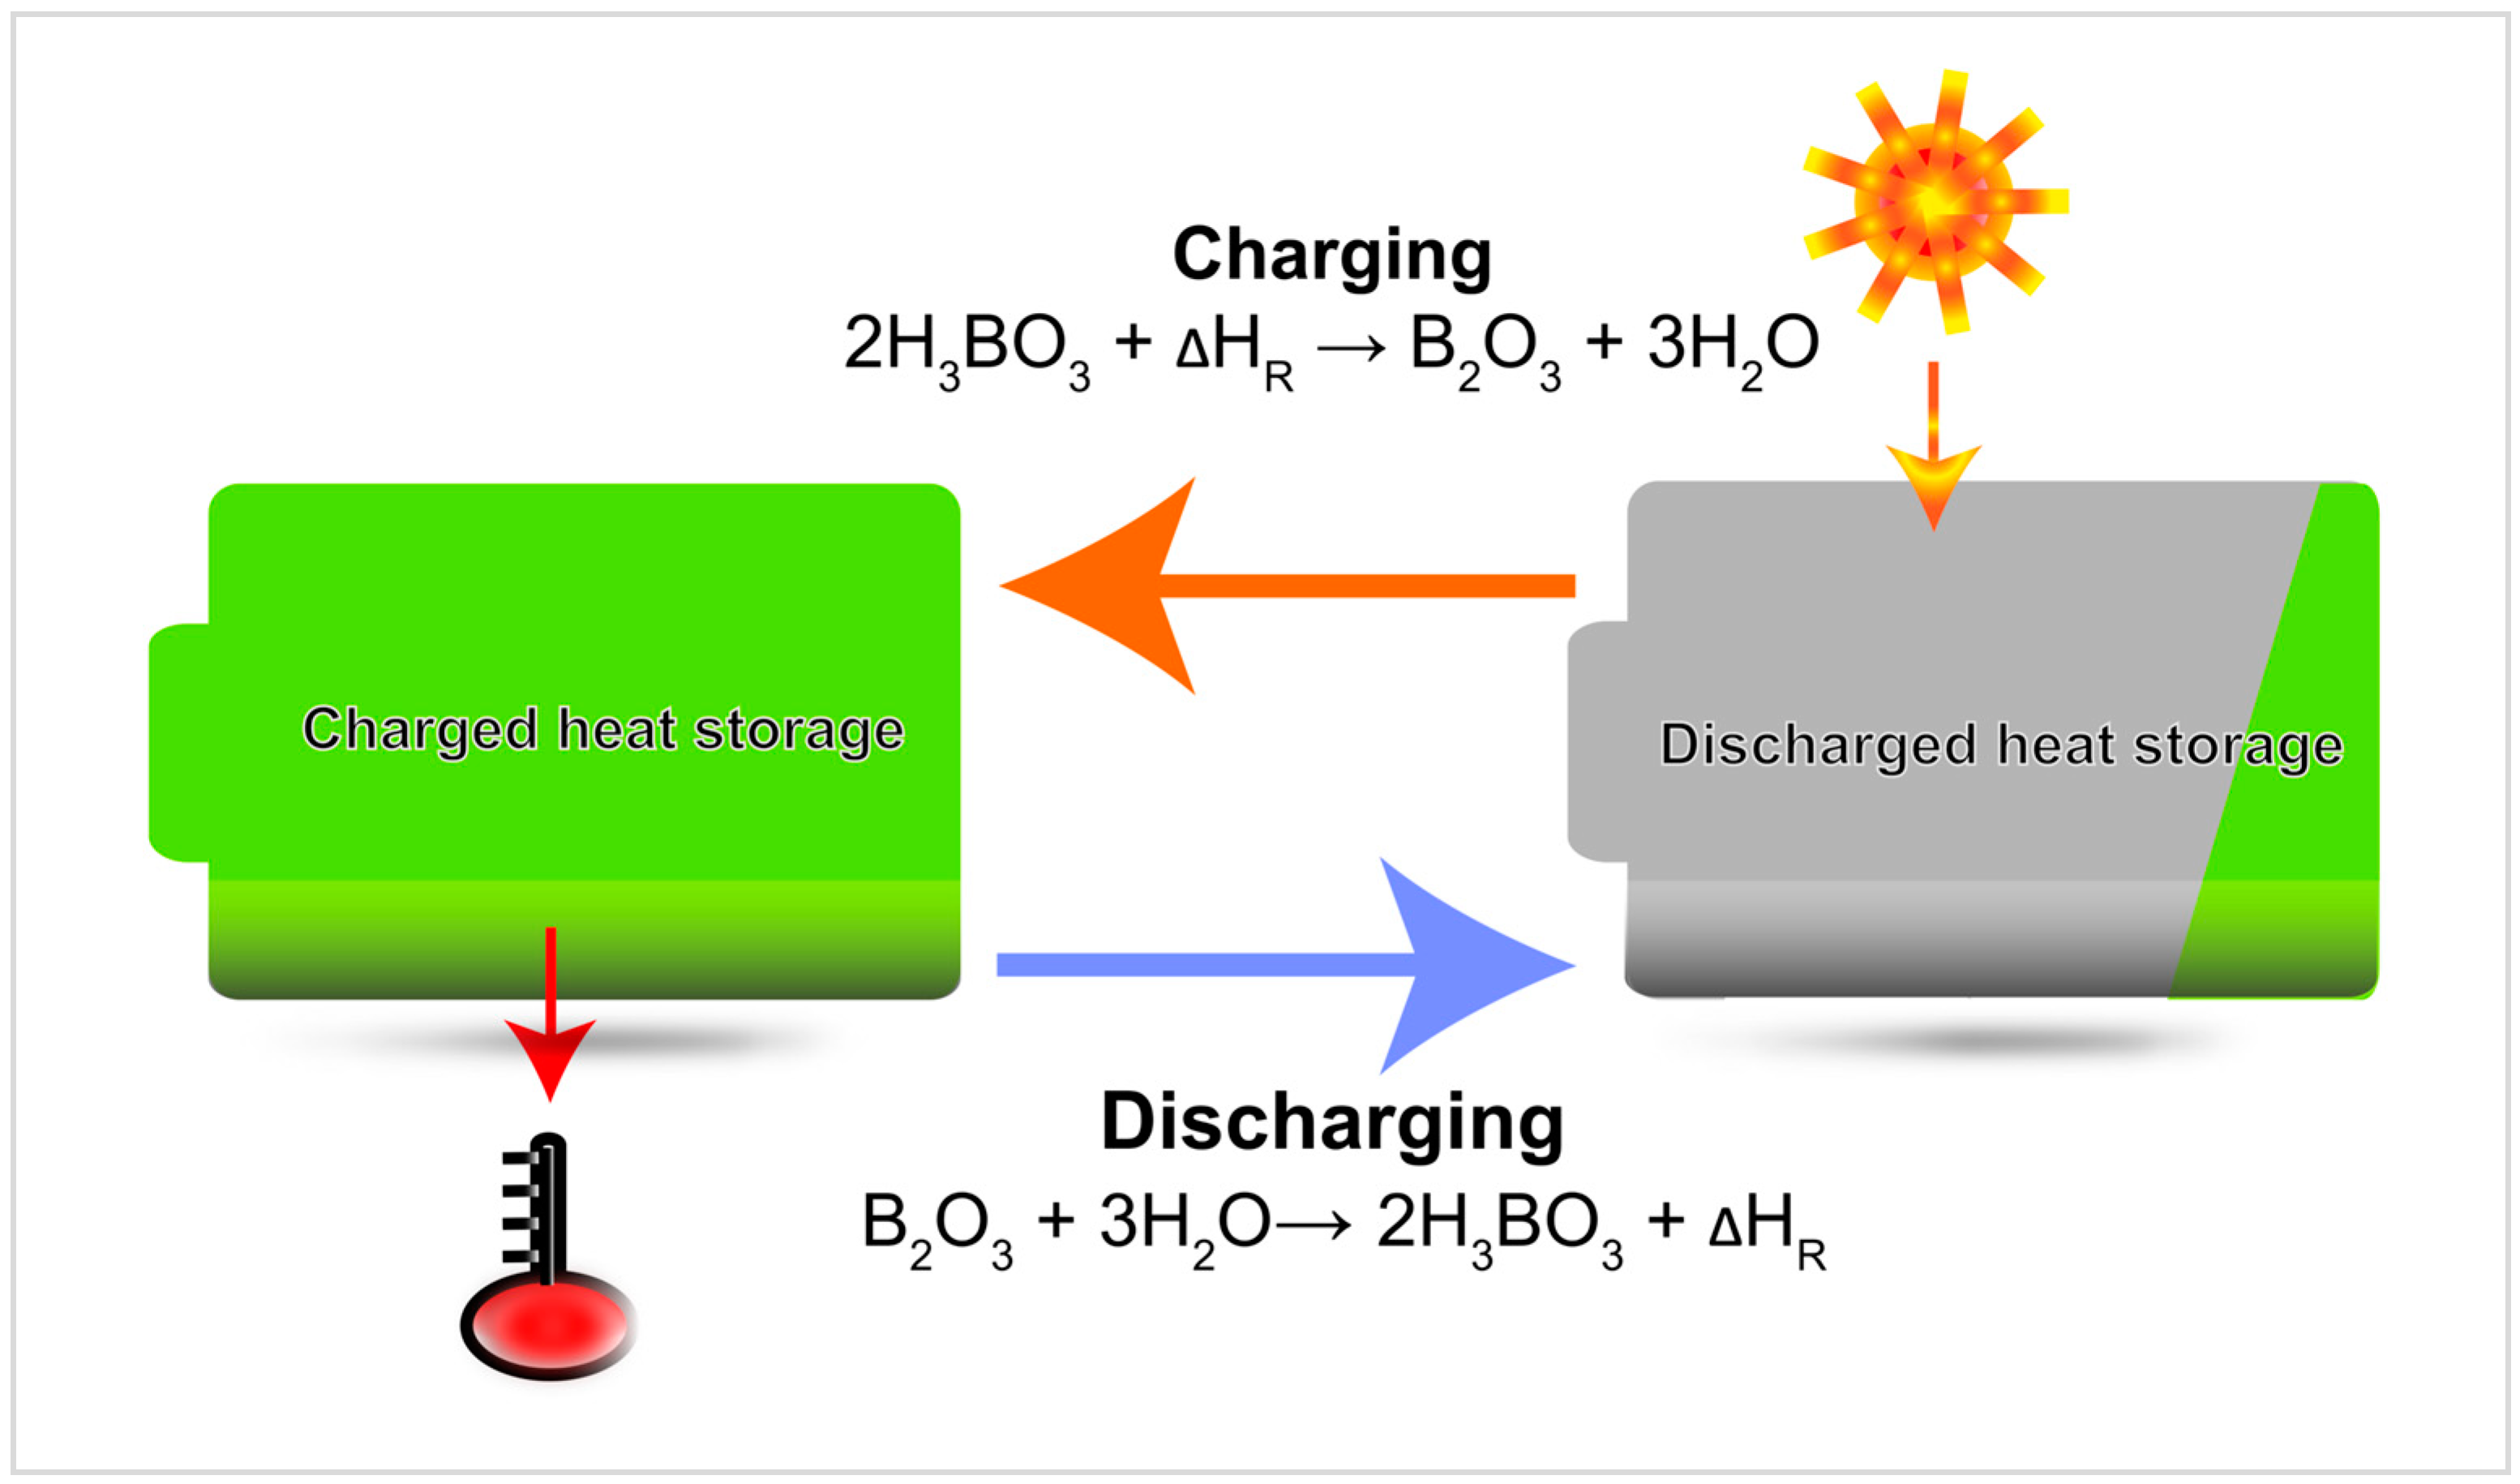
2.1. Discovery and Mechanism
2.2. Occurrence and Application of B2O3/H3BO3
| ● Colemanite | |
| ● Kernite | |
| ● Tincal | |
| ● Ulexite | Ca |
2.3. Material Properties
2.3.1. Material
- Boric Acid: Sigma Aldrich (St. Louis, MO, USA) (11606/CAS: 10043-35-3)
- Boron Oxide: Alfa Aesar (Wardhill, MA, USA) (12290/CAS: 1303-86-2)
- Metaboric Acid: Santa Cruz Biotechnology (Dallas, TX, USA) (sc-228460/CAS: 13460-50-9)
2.3.2. Particle Size
2.3.3. Scanning Electron Microscopy
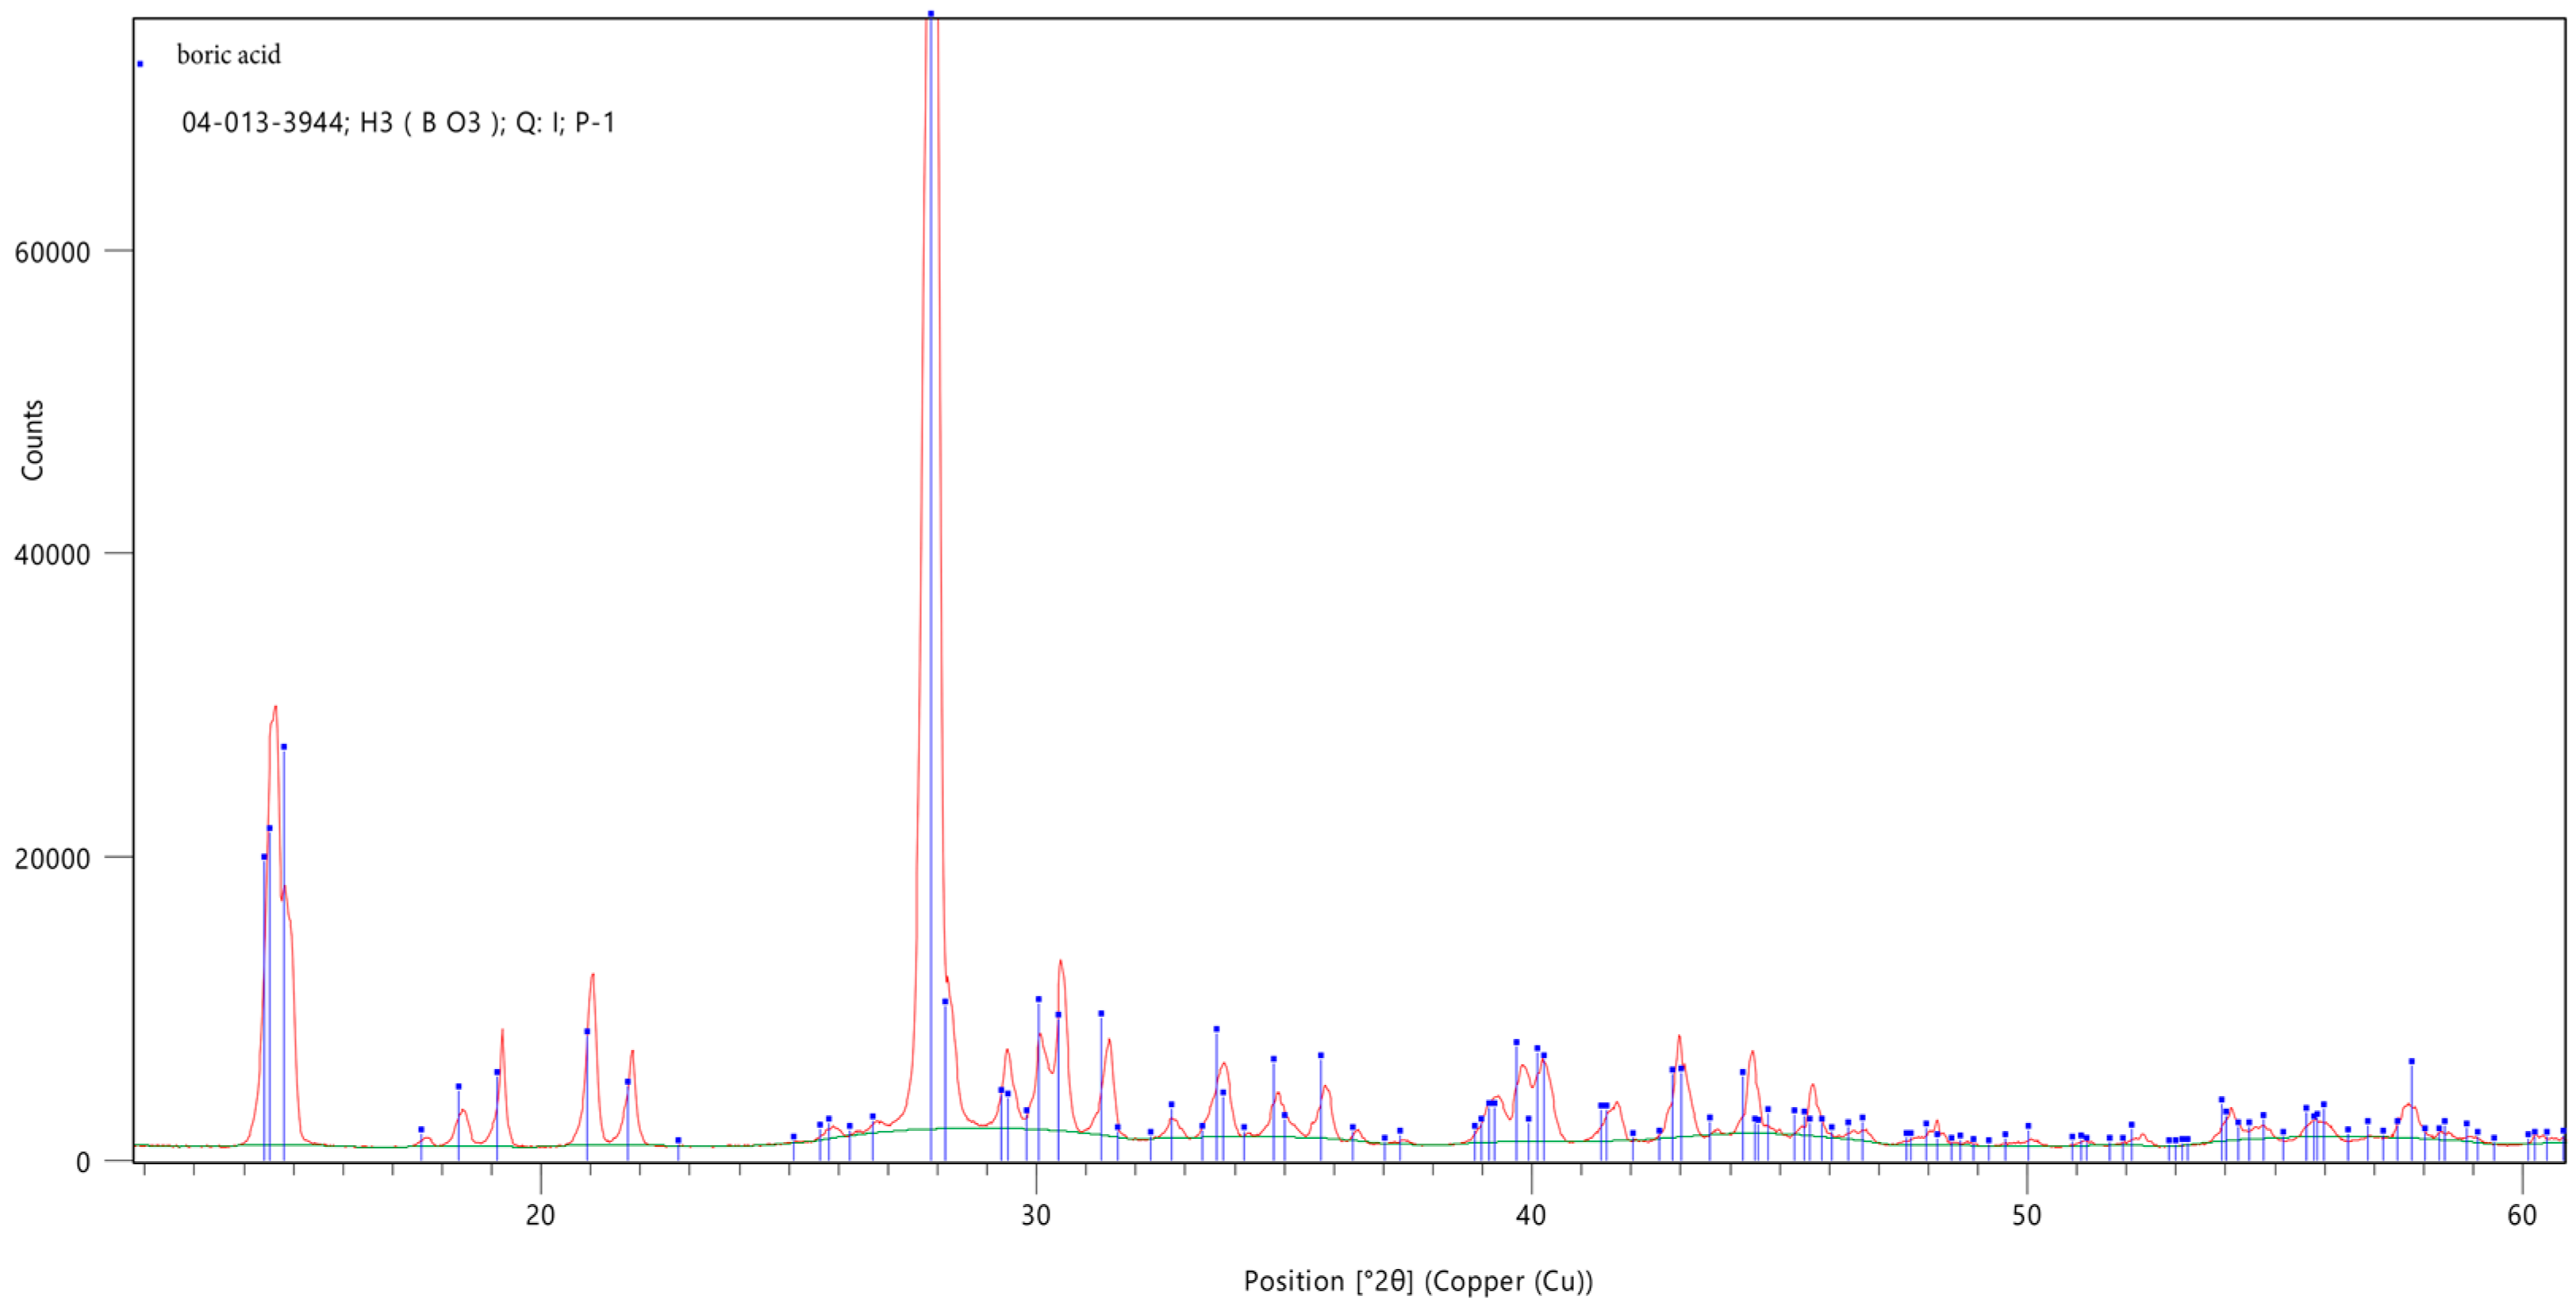
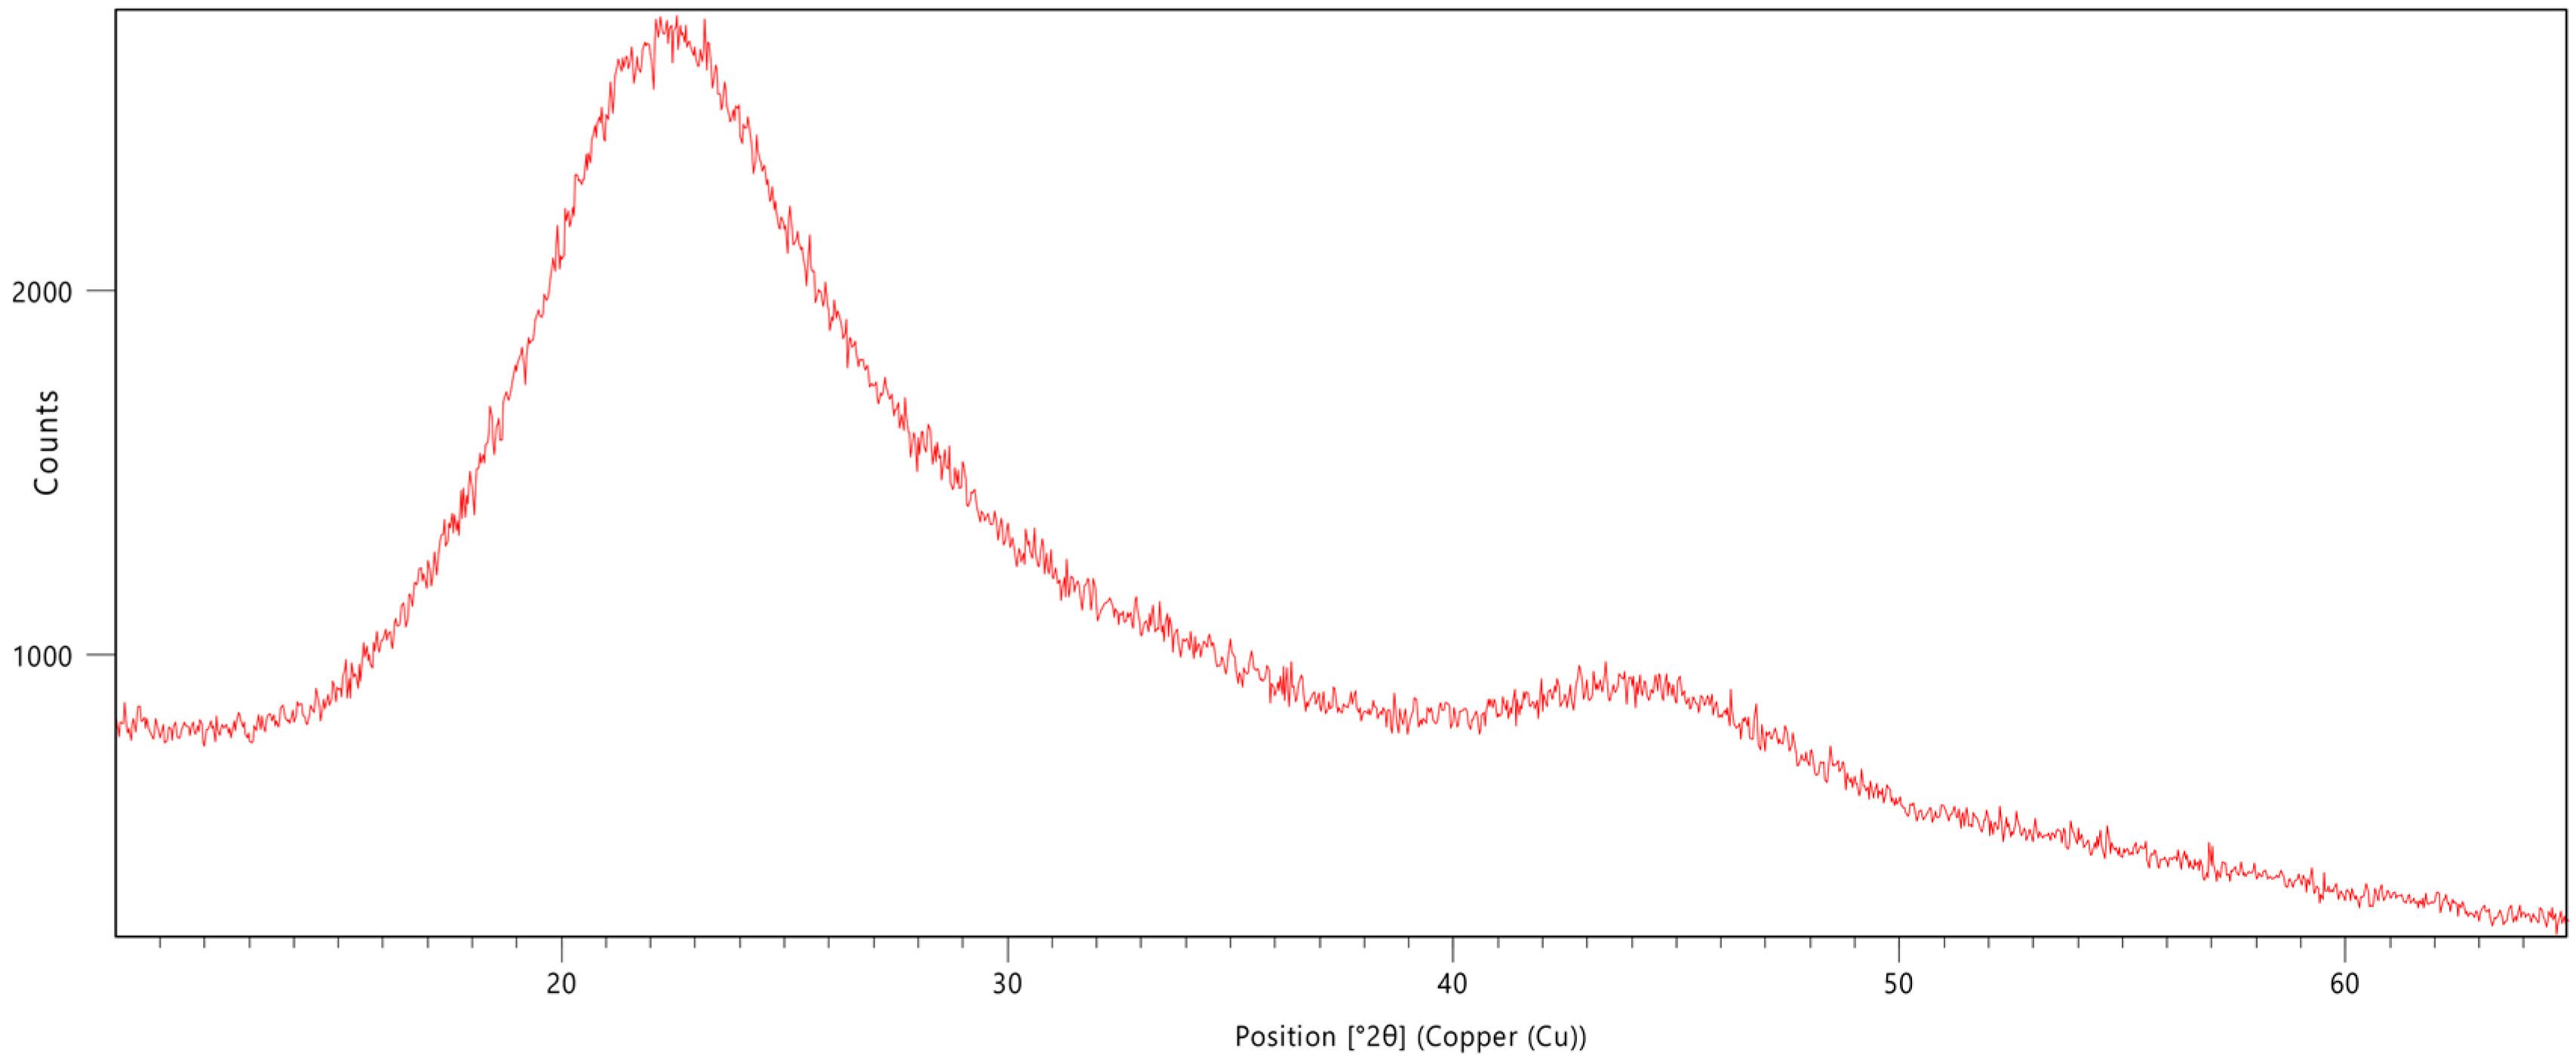
2.3.4. X-Ray Diffraction Analysis
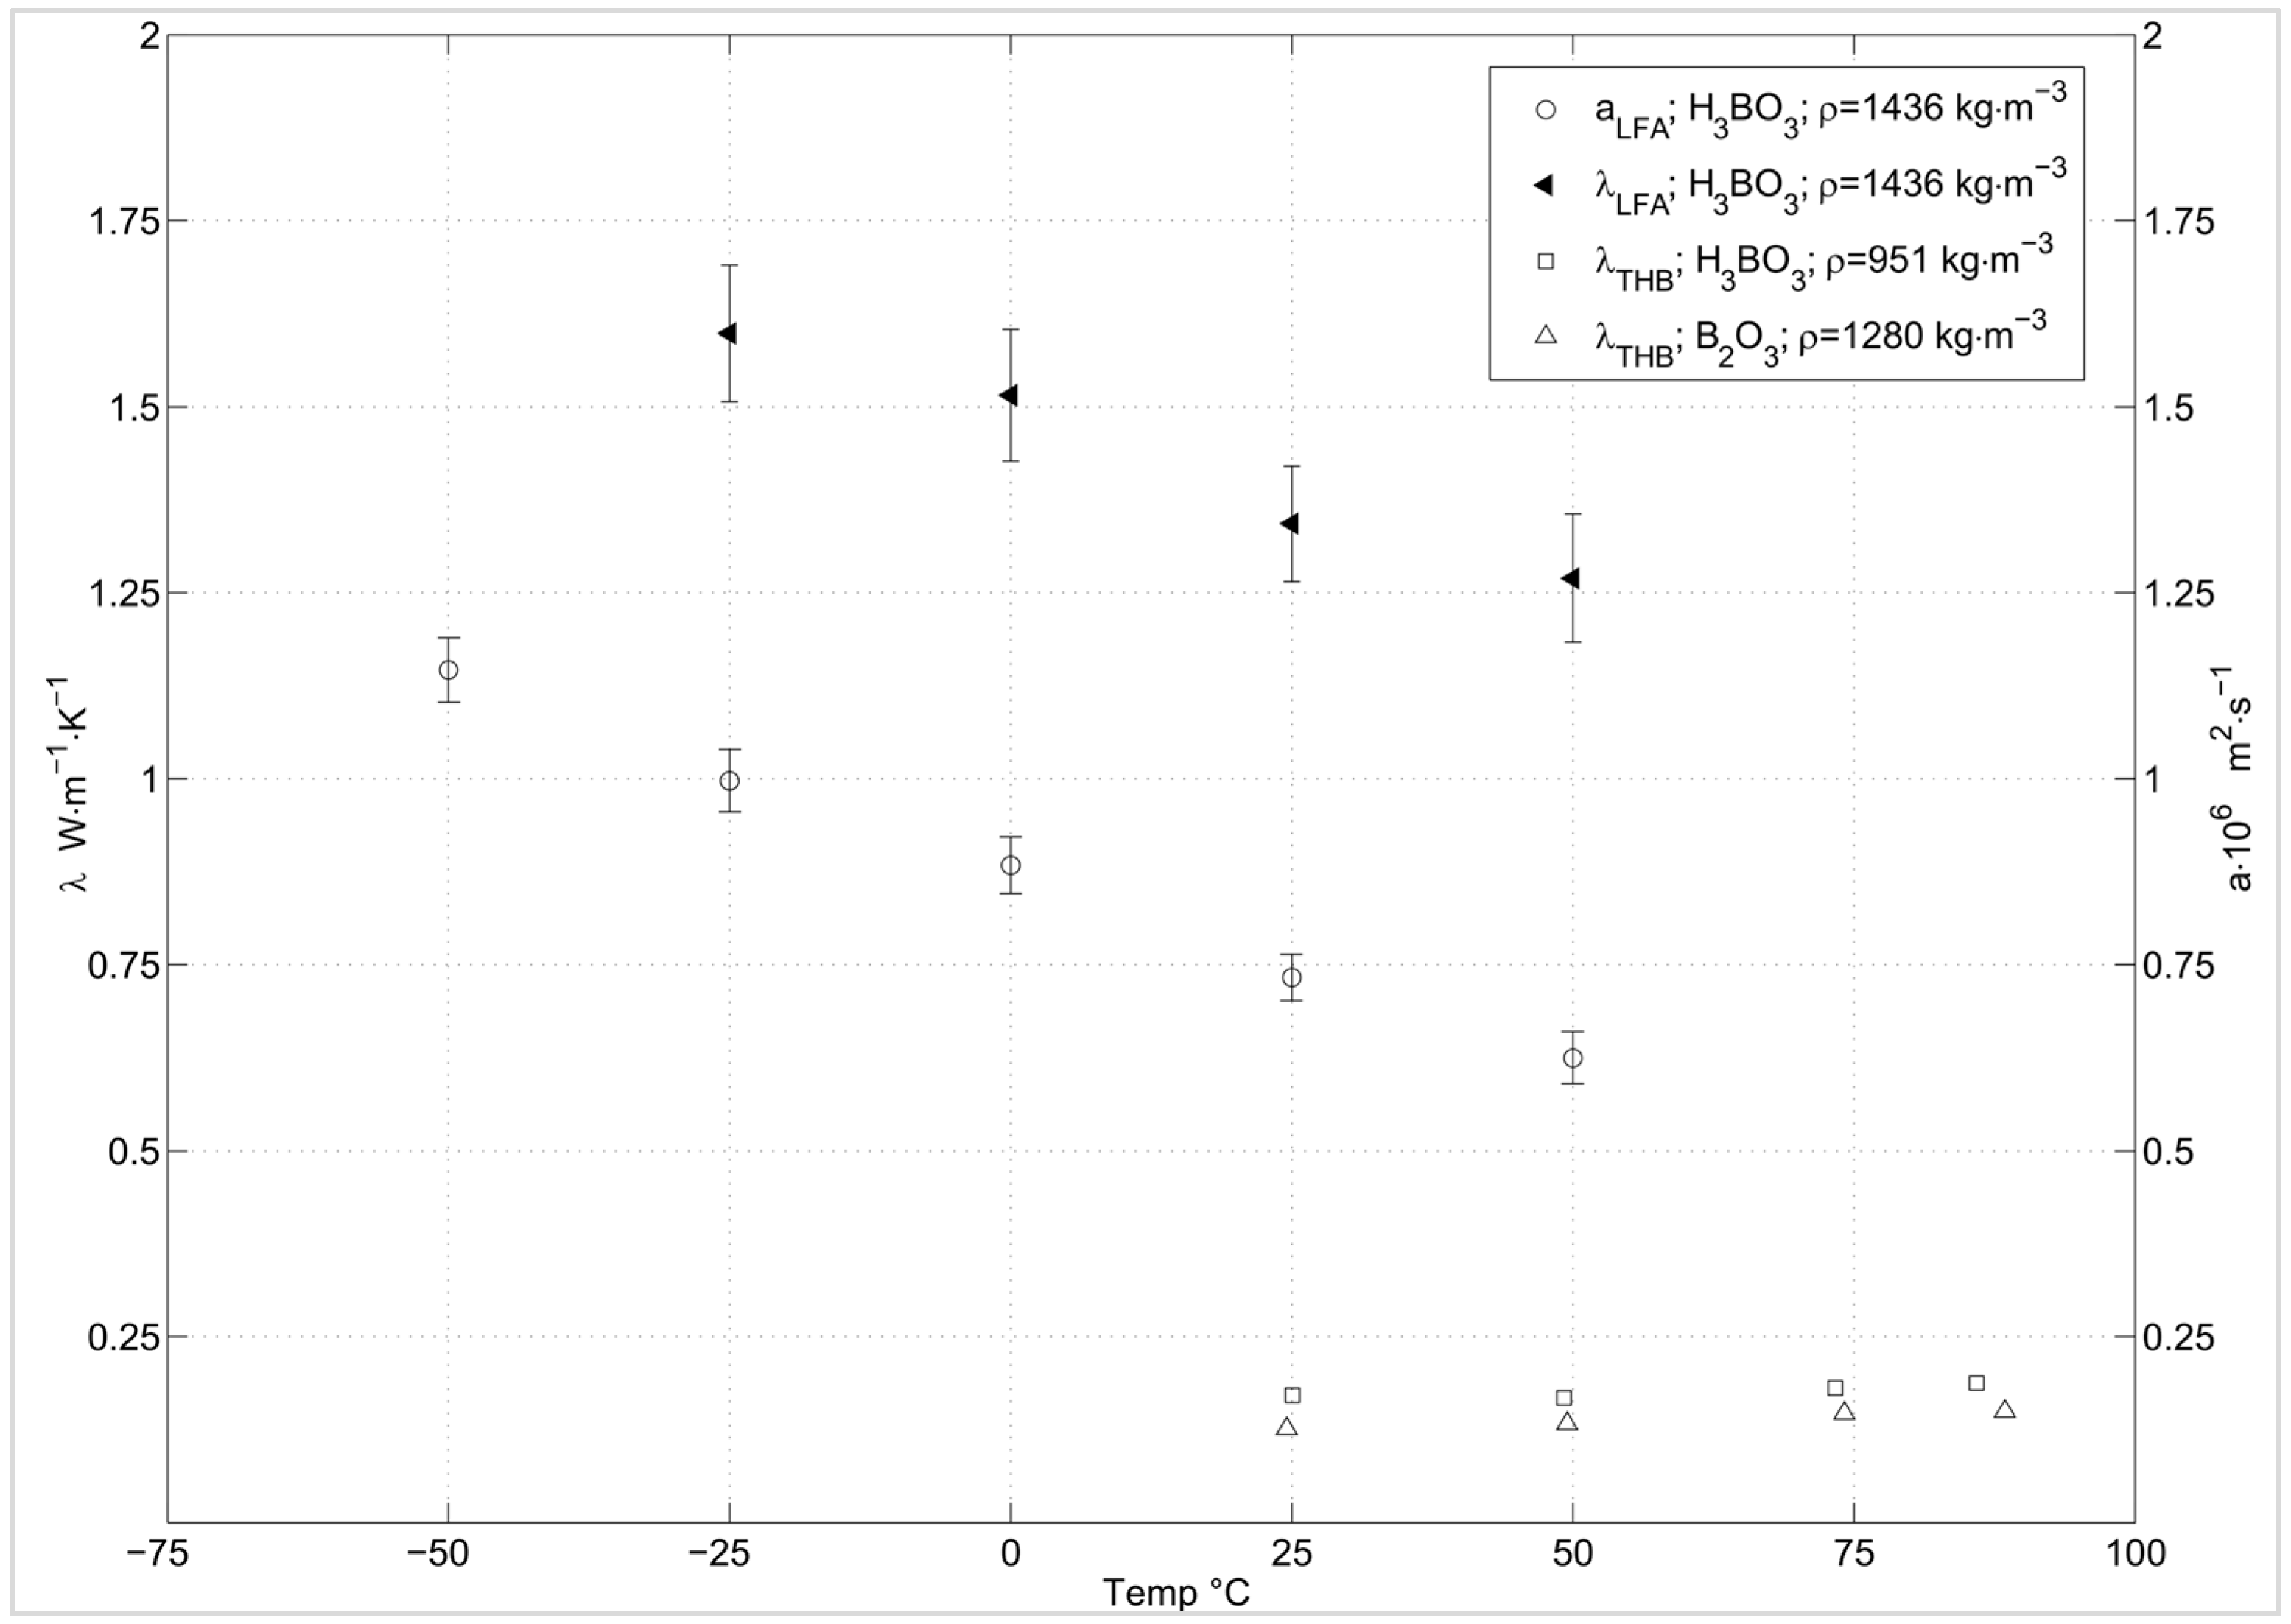
2.3.5. Thermal Conductivity/Diffusivity
2.3.6. Reaction Heat Analysis
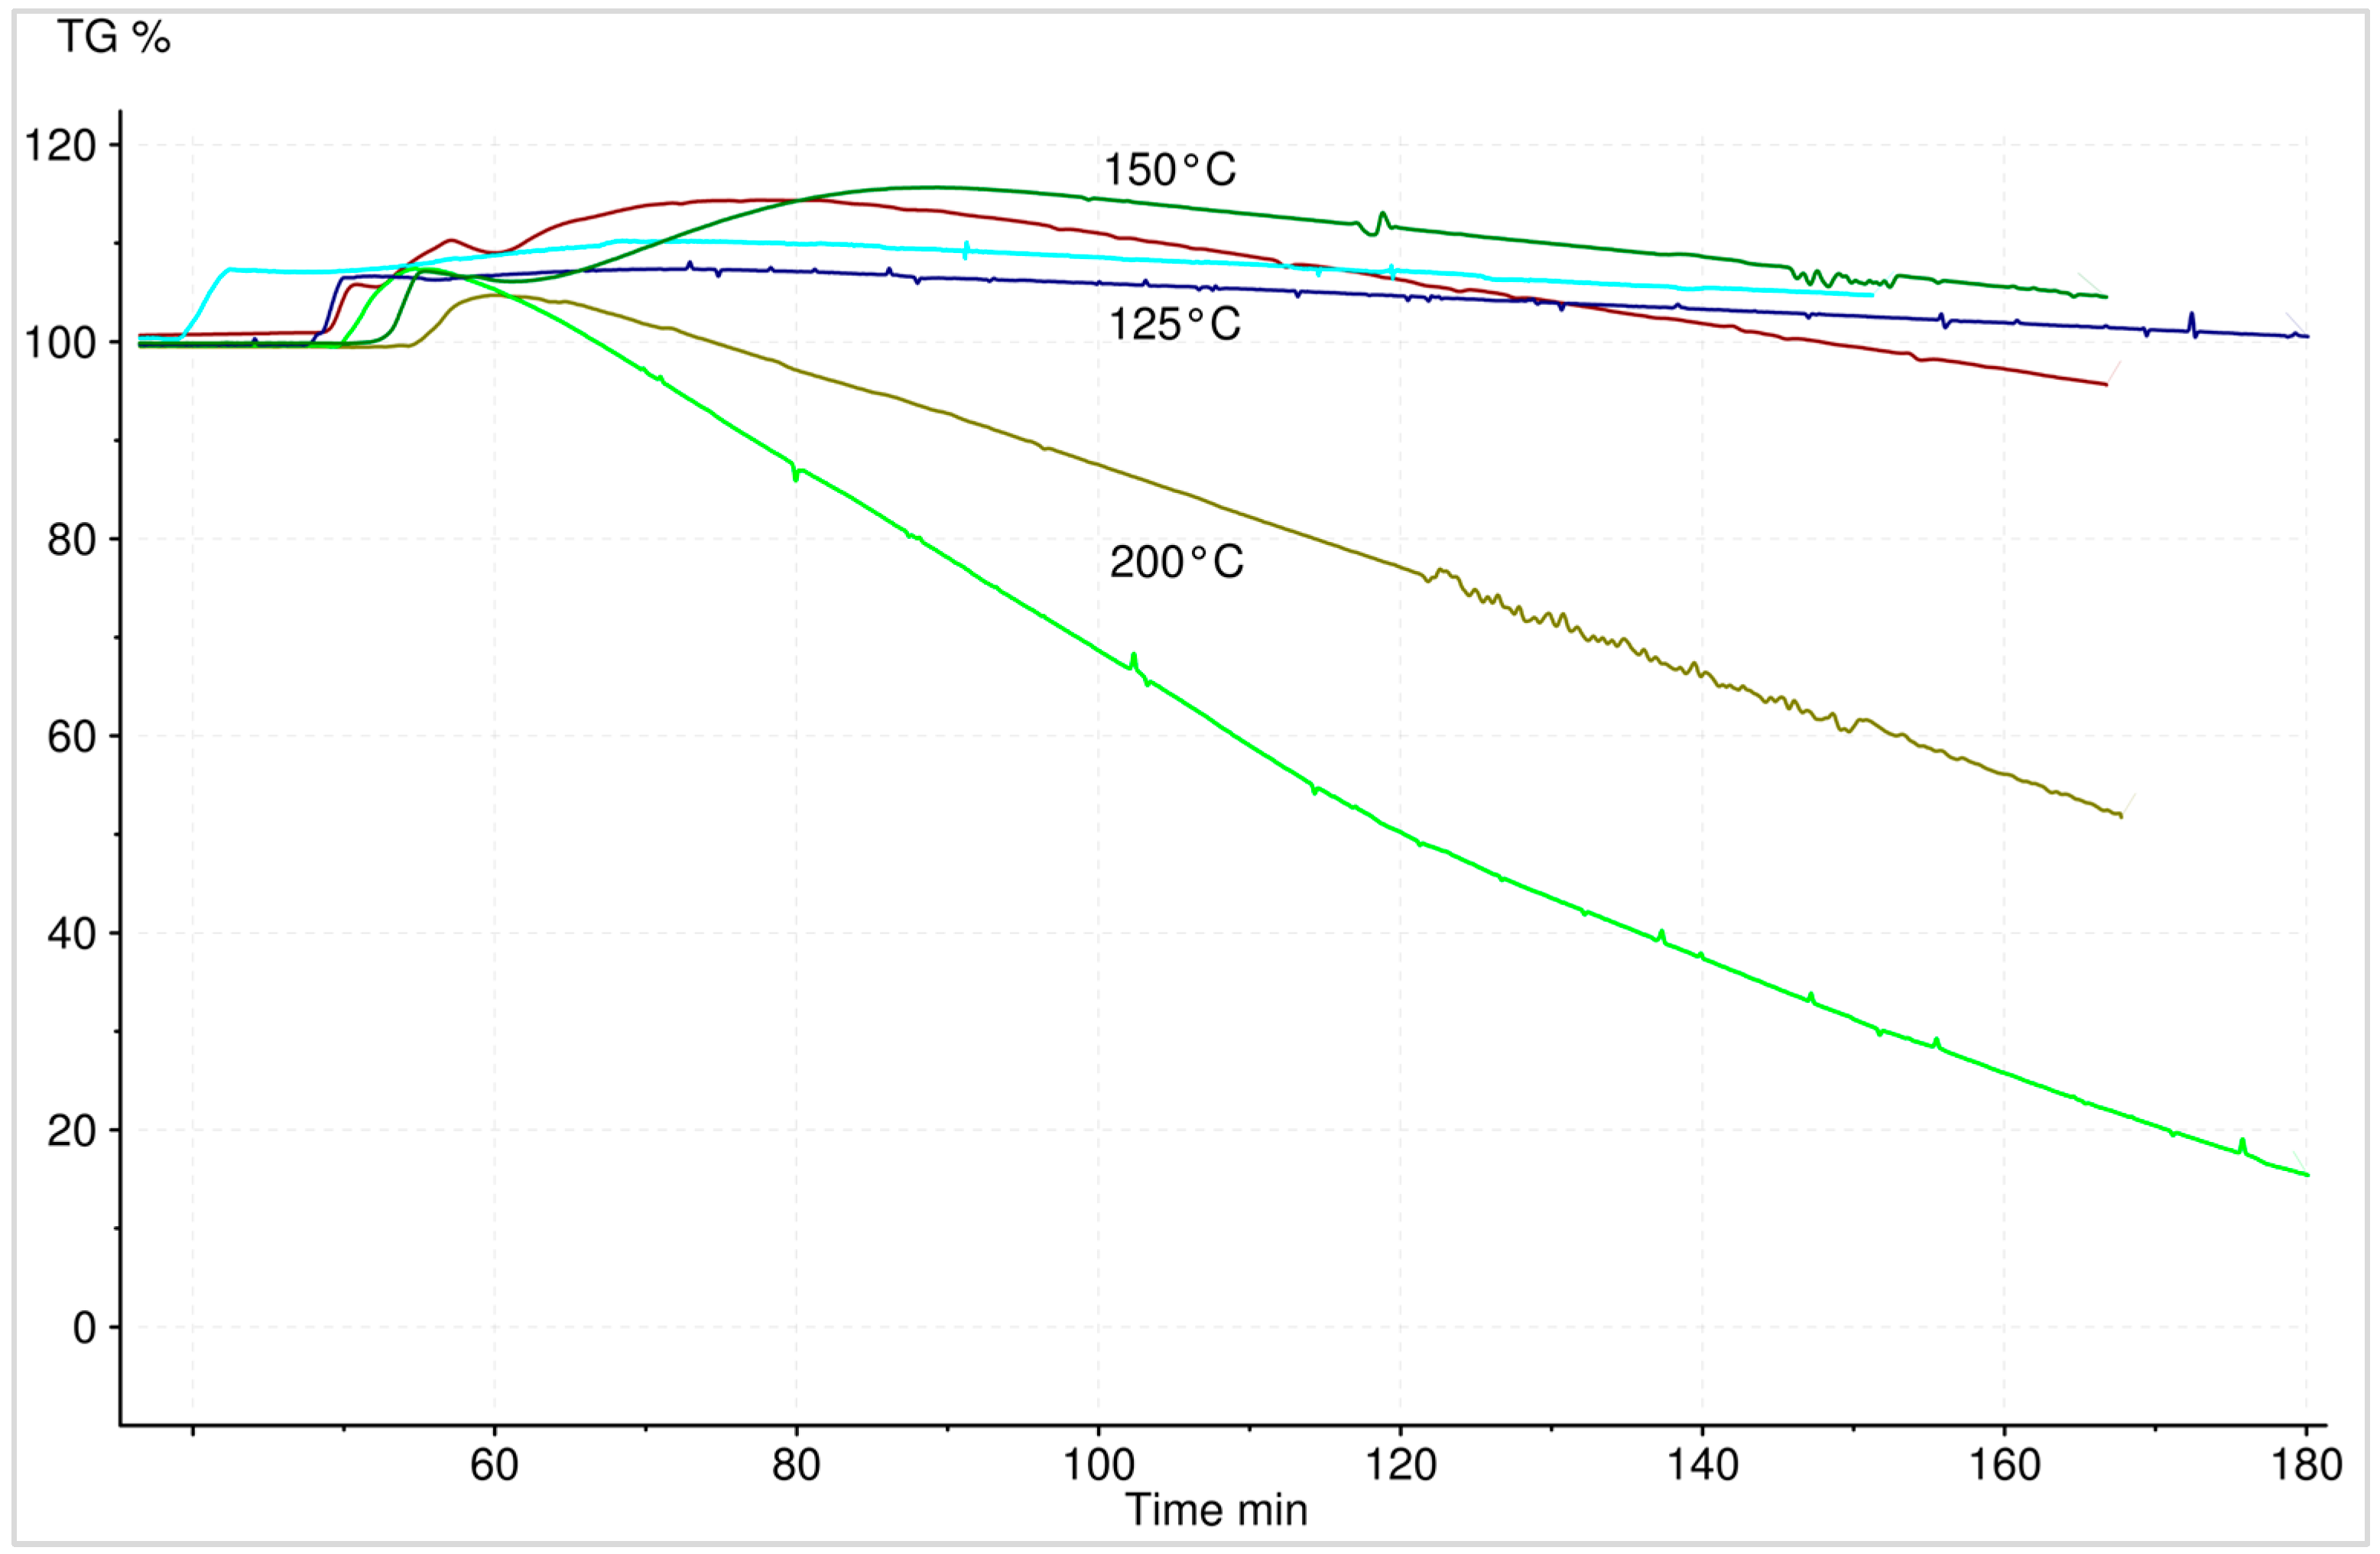
2.3.7. Macroscopic Reaction Heat Analysis
3. Results
3.1. Particle Size
3.2. Scanning Electron Microscopy (SEM)
3.3. X-Ray Diffraction Analysis
3.4. Thermal Conductivity/Diffusivity
3.5. Reaction Heat Analyses
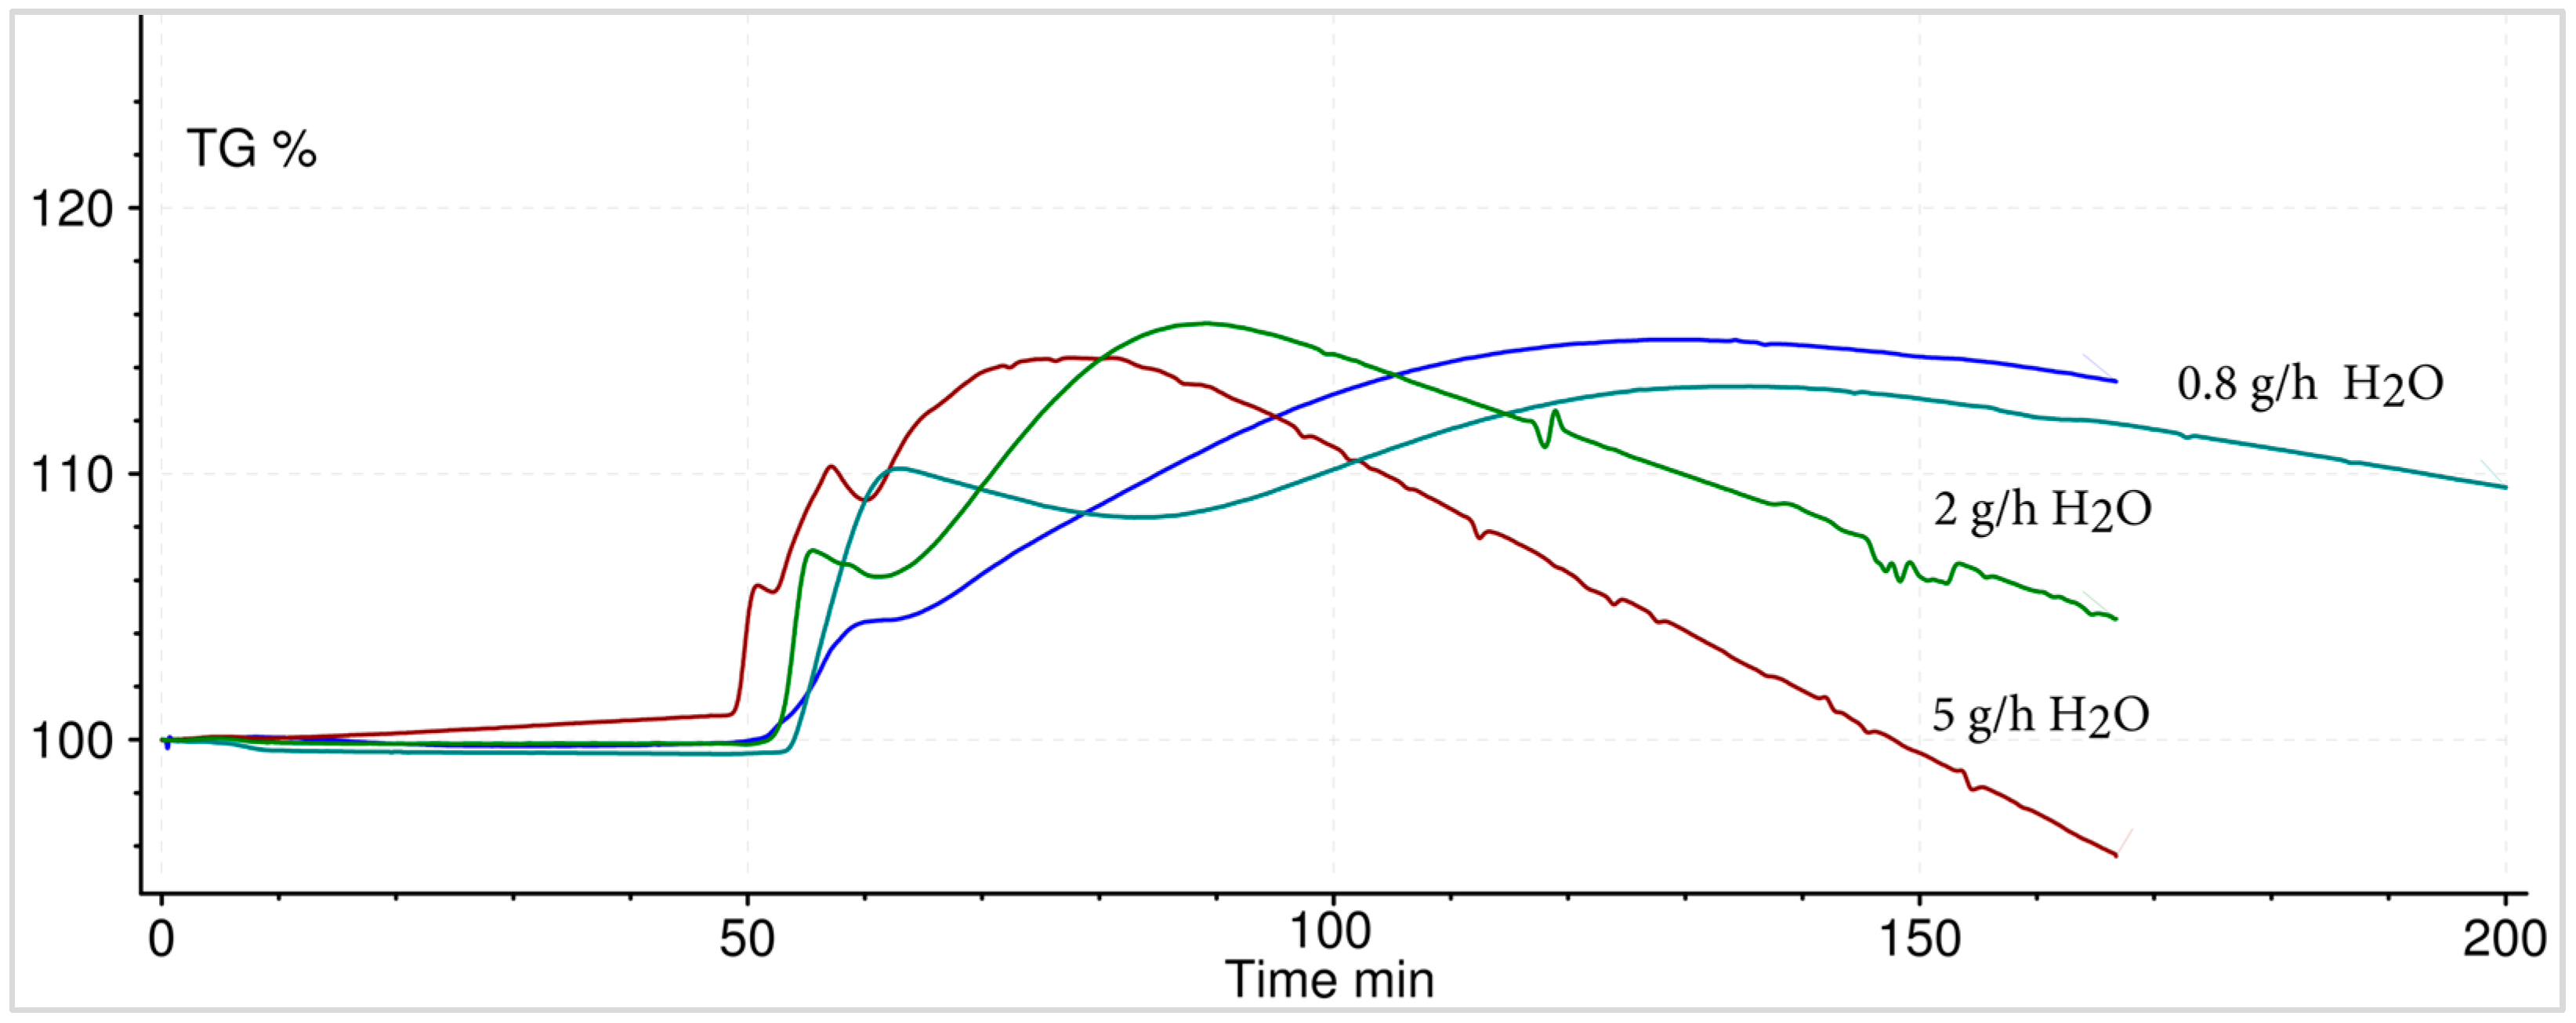
3.5.1. Hydration
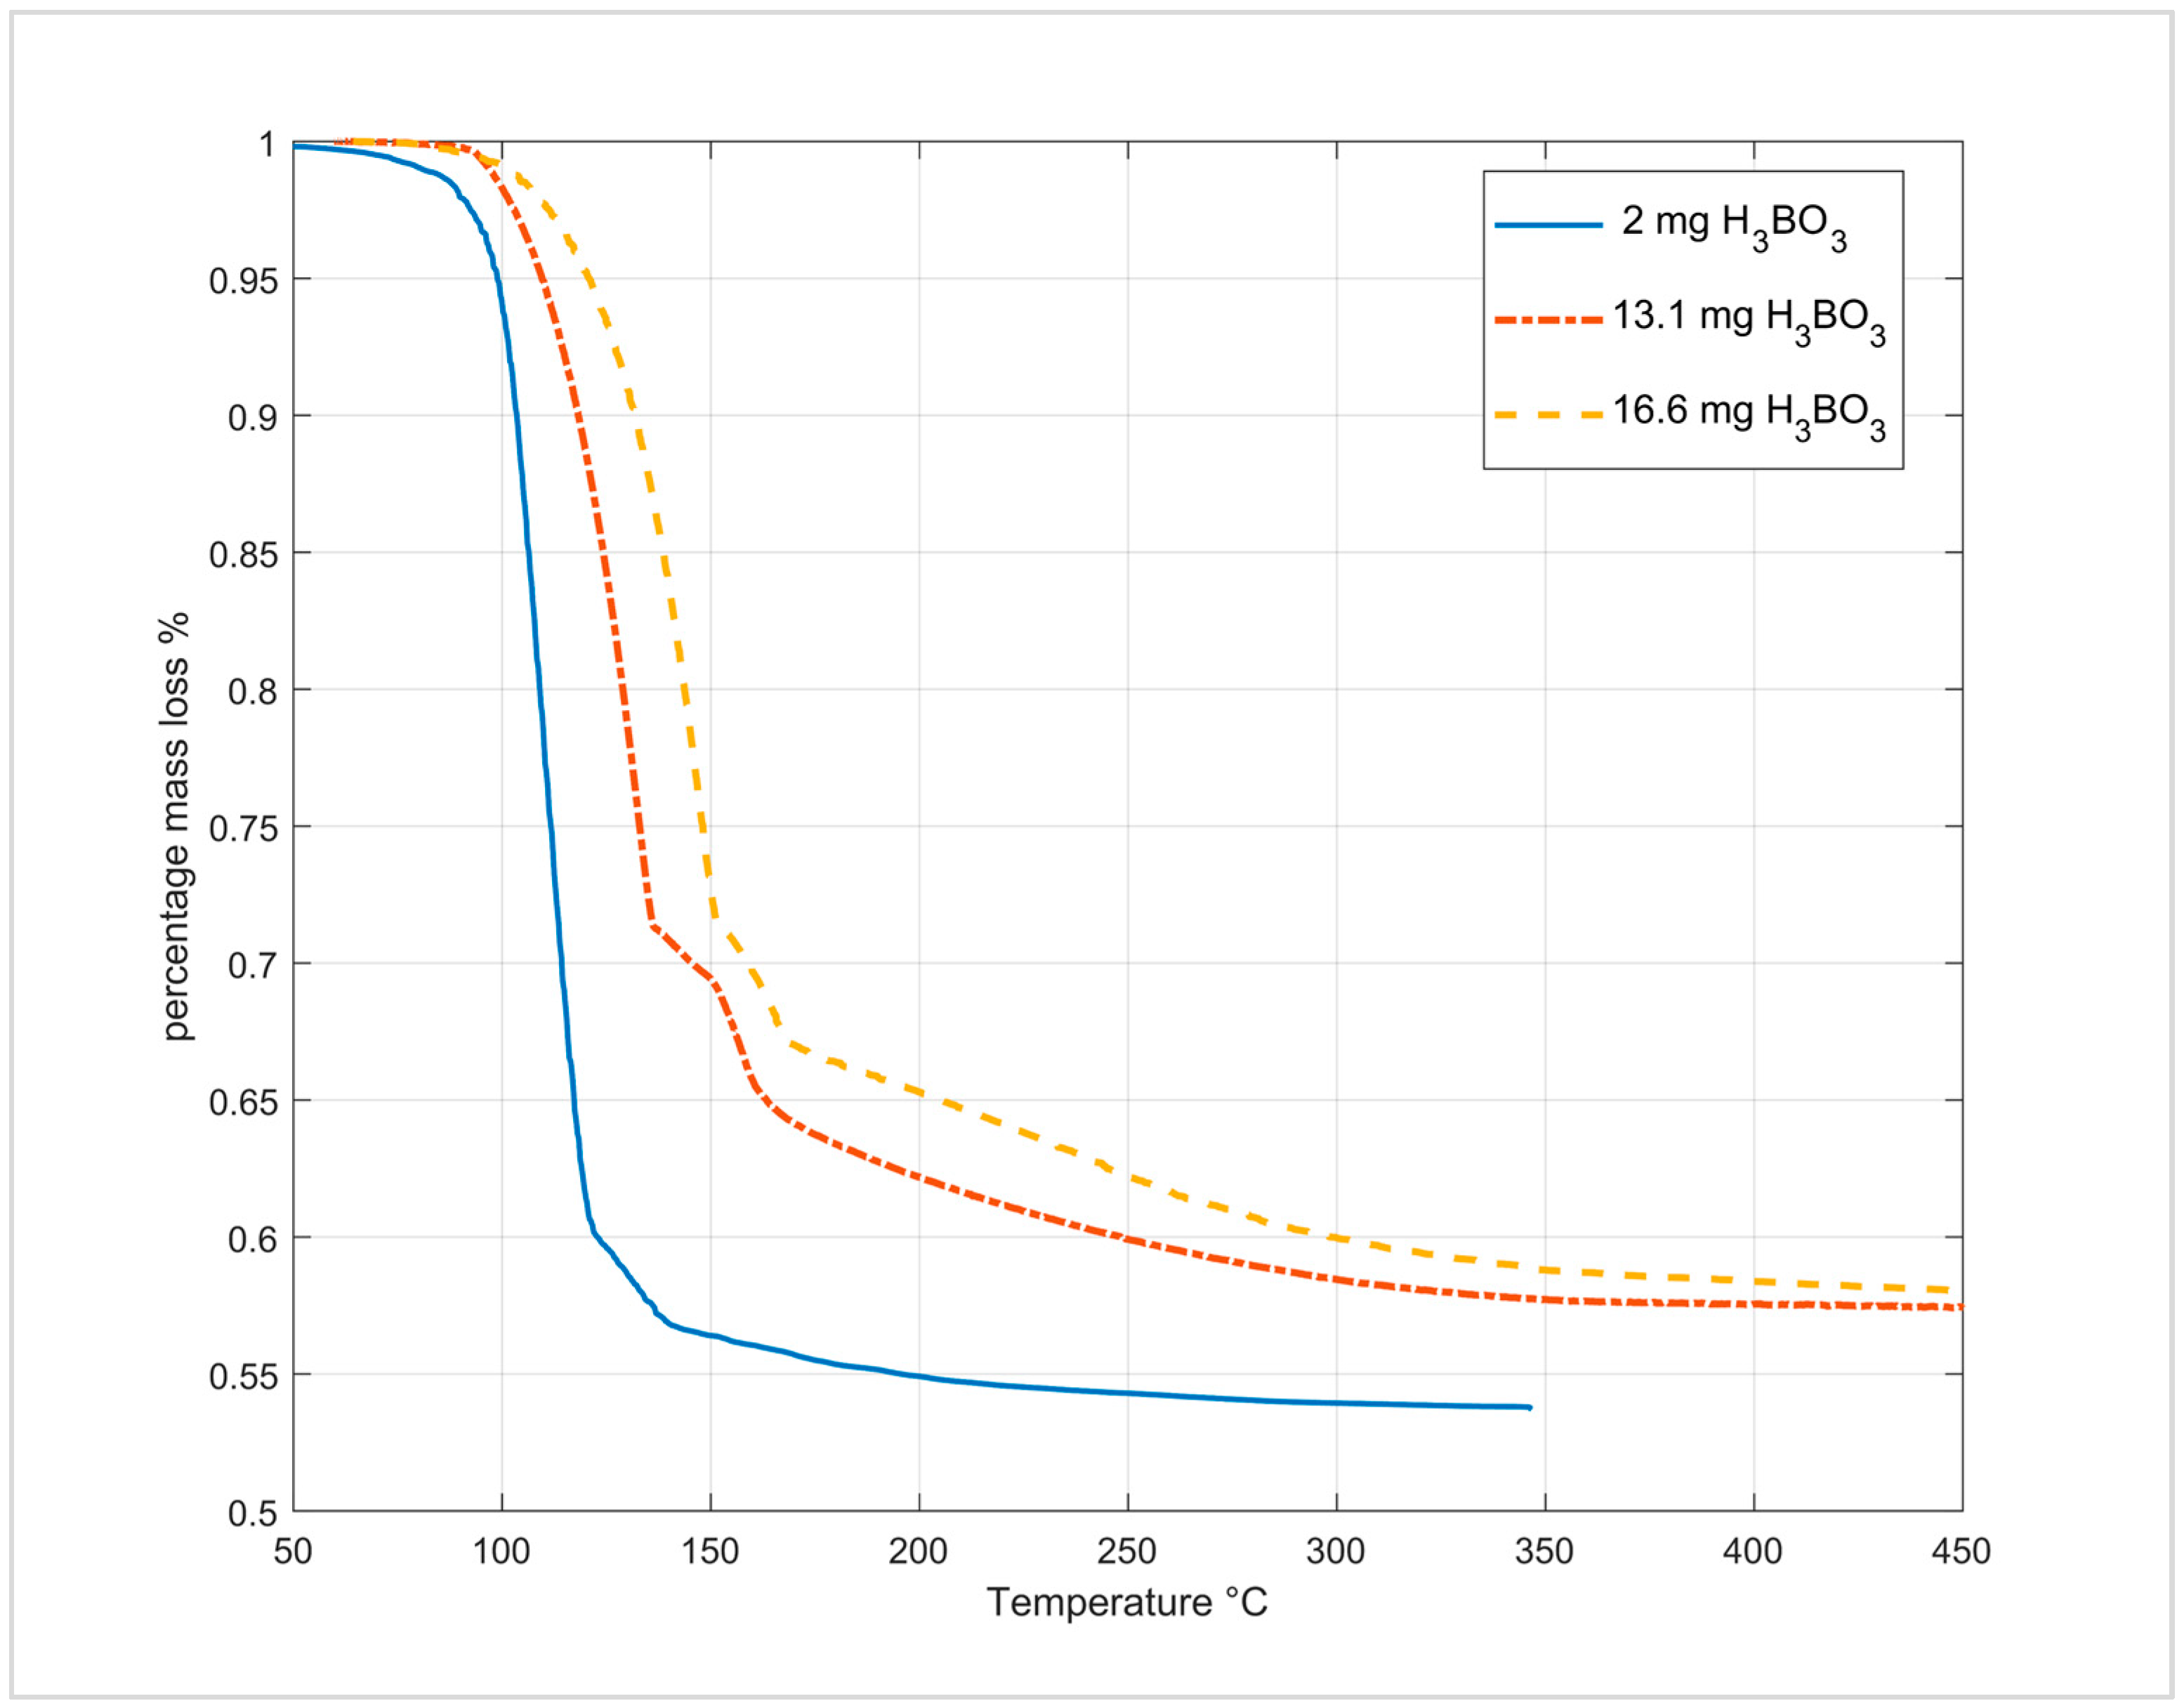
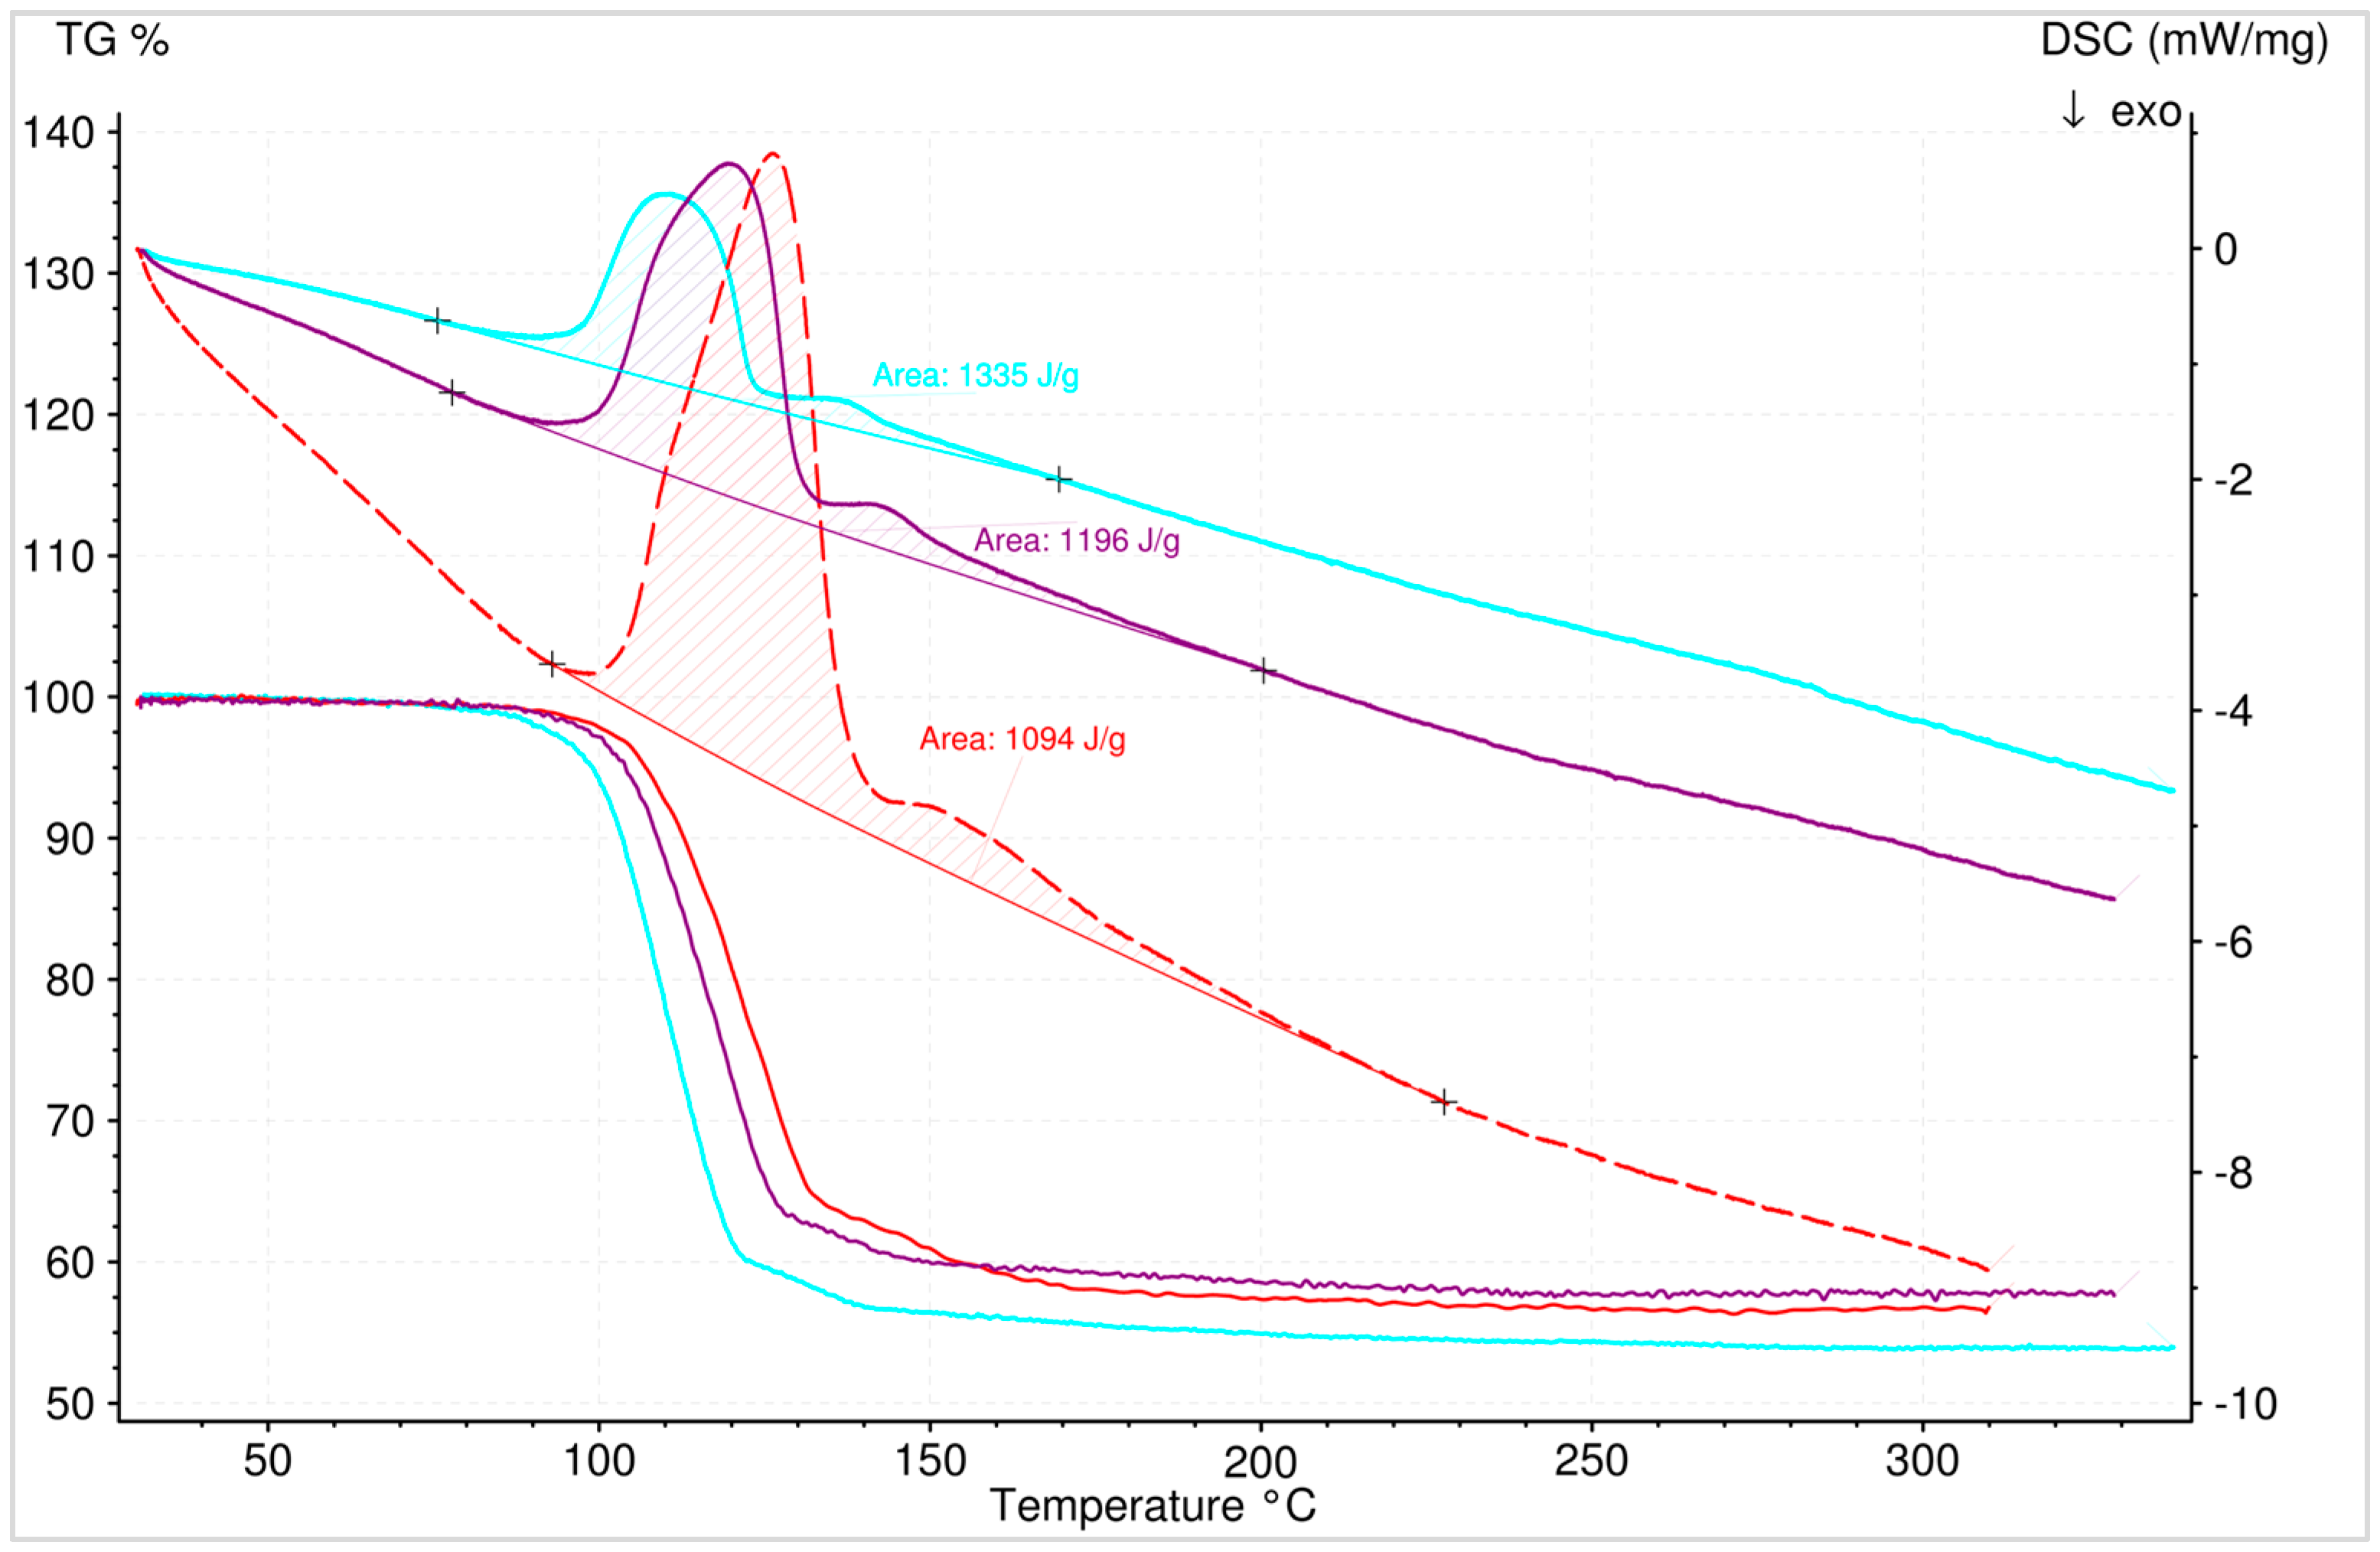
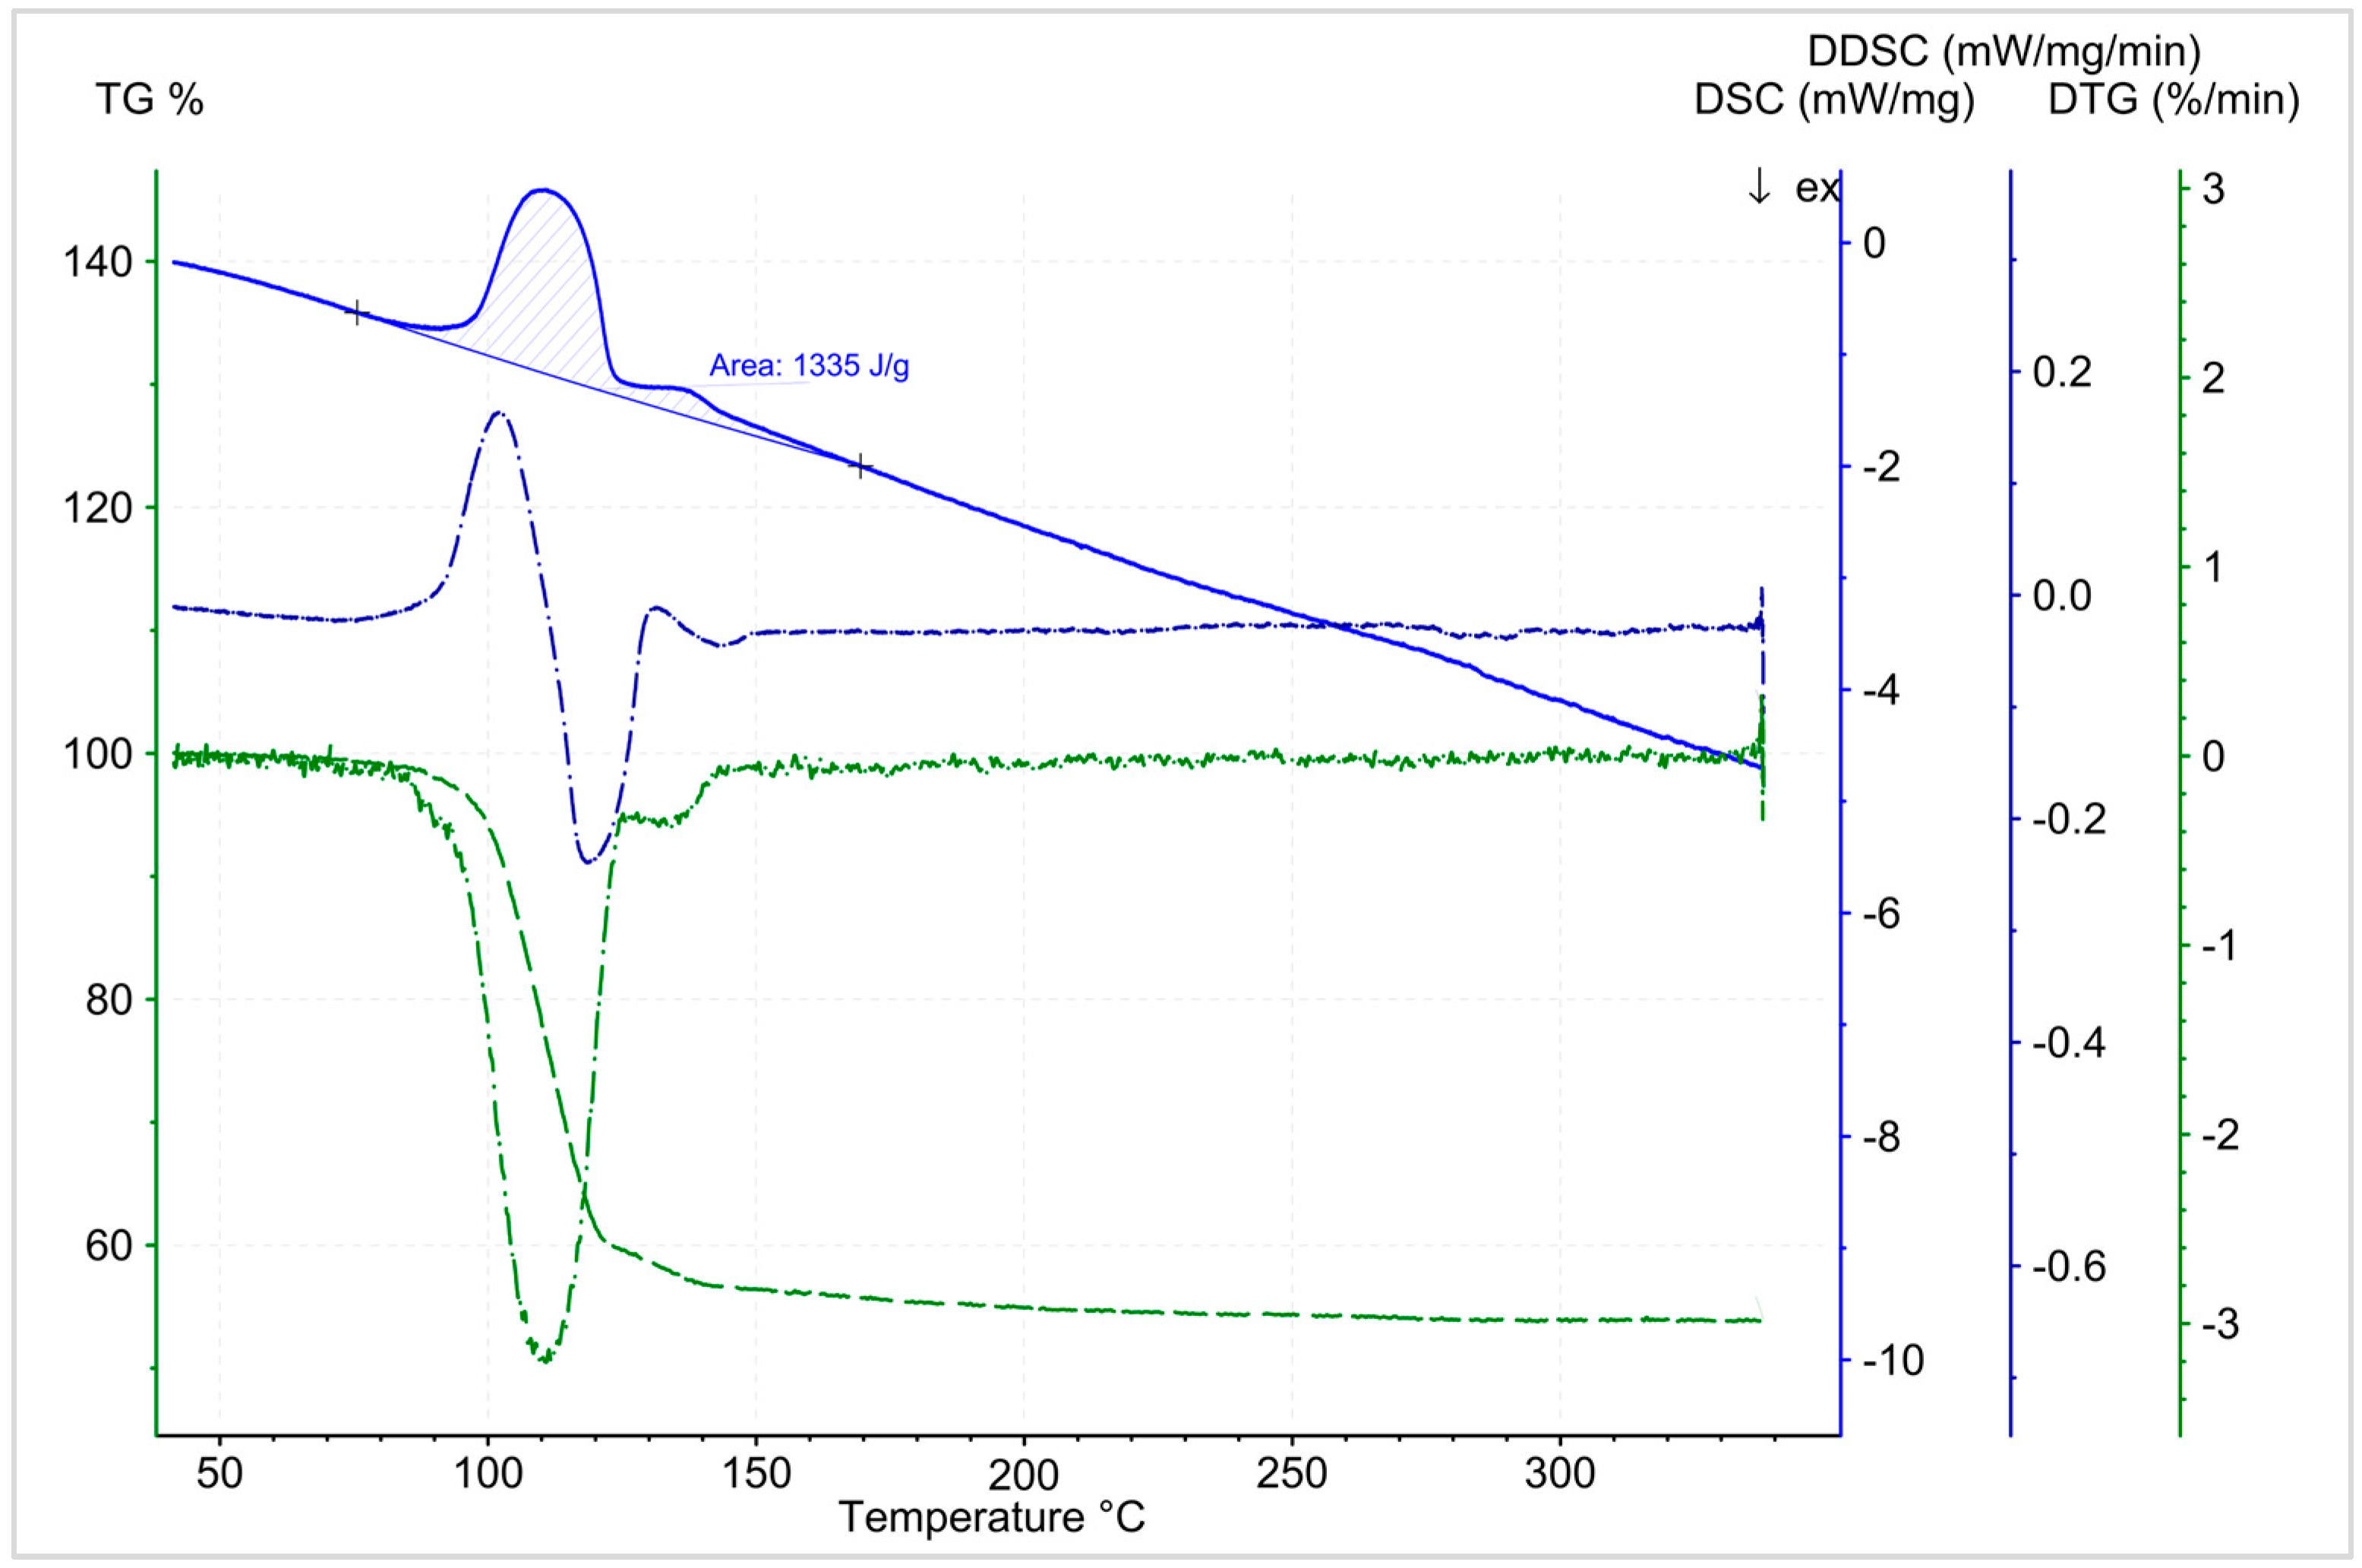
3.5.2. Dehydration
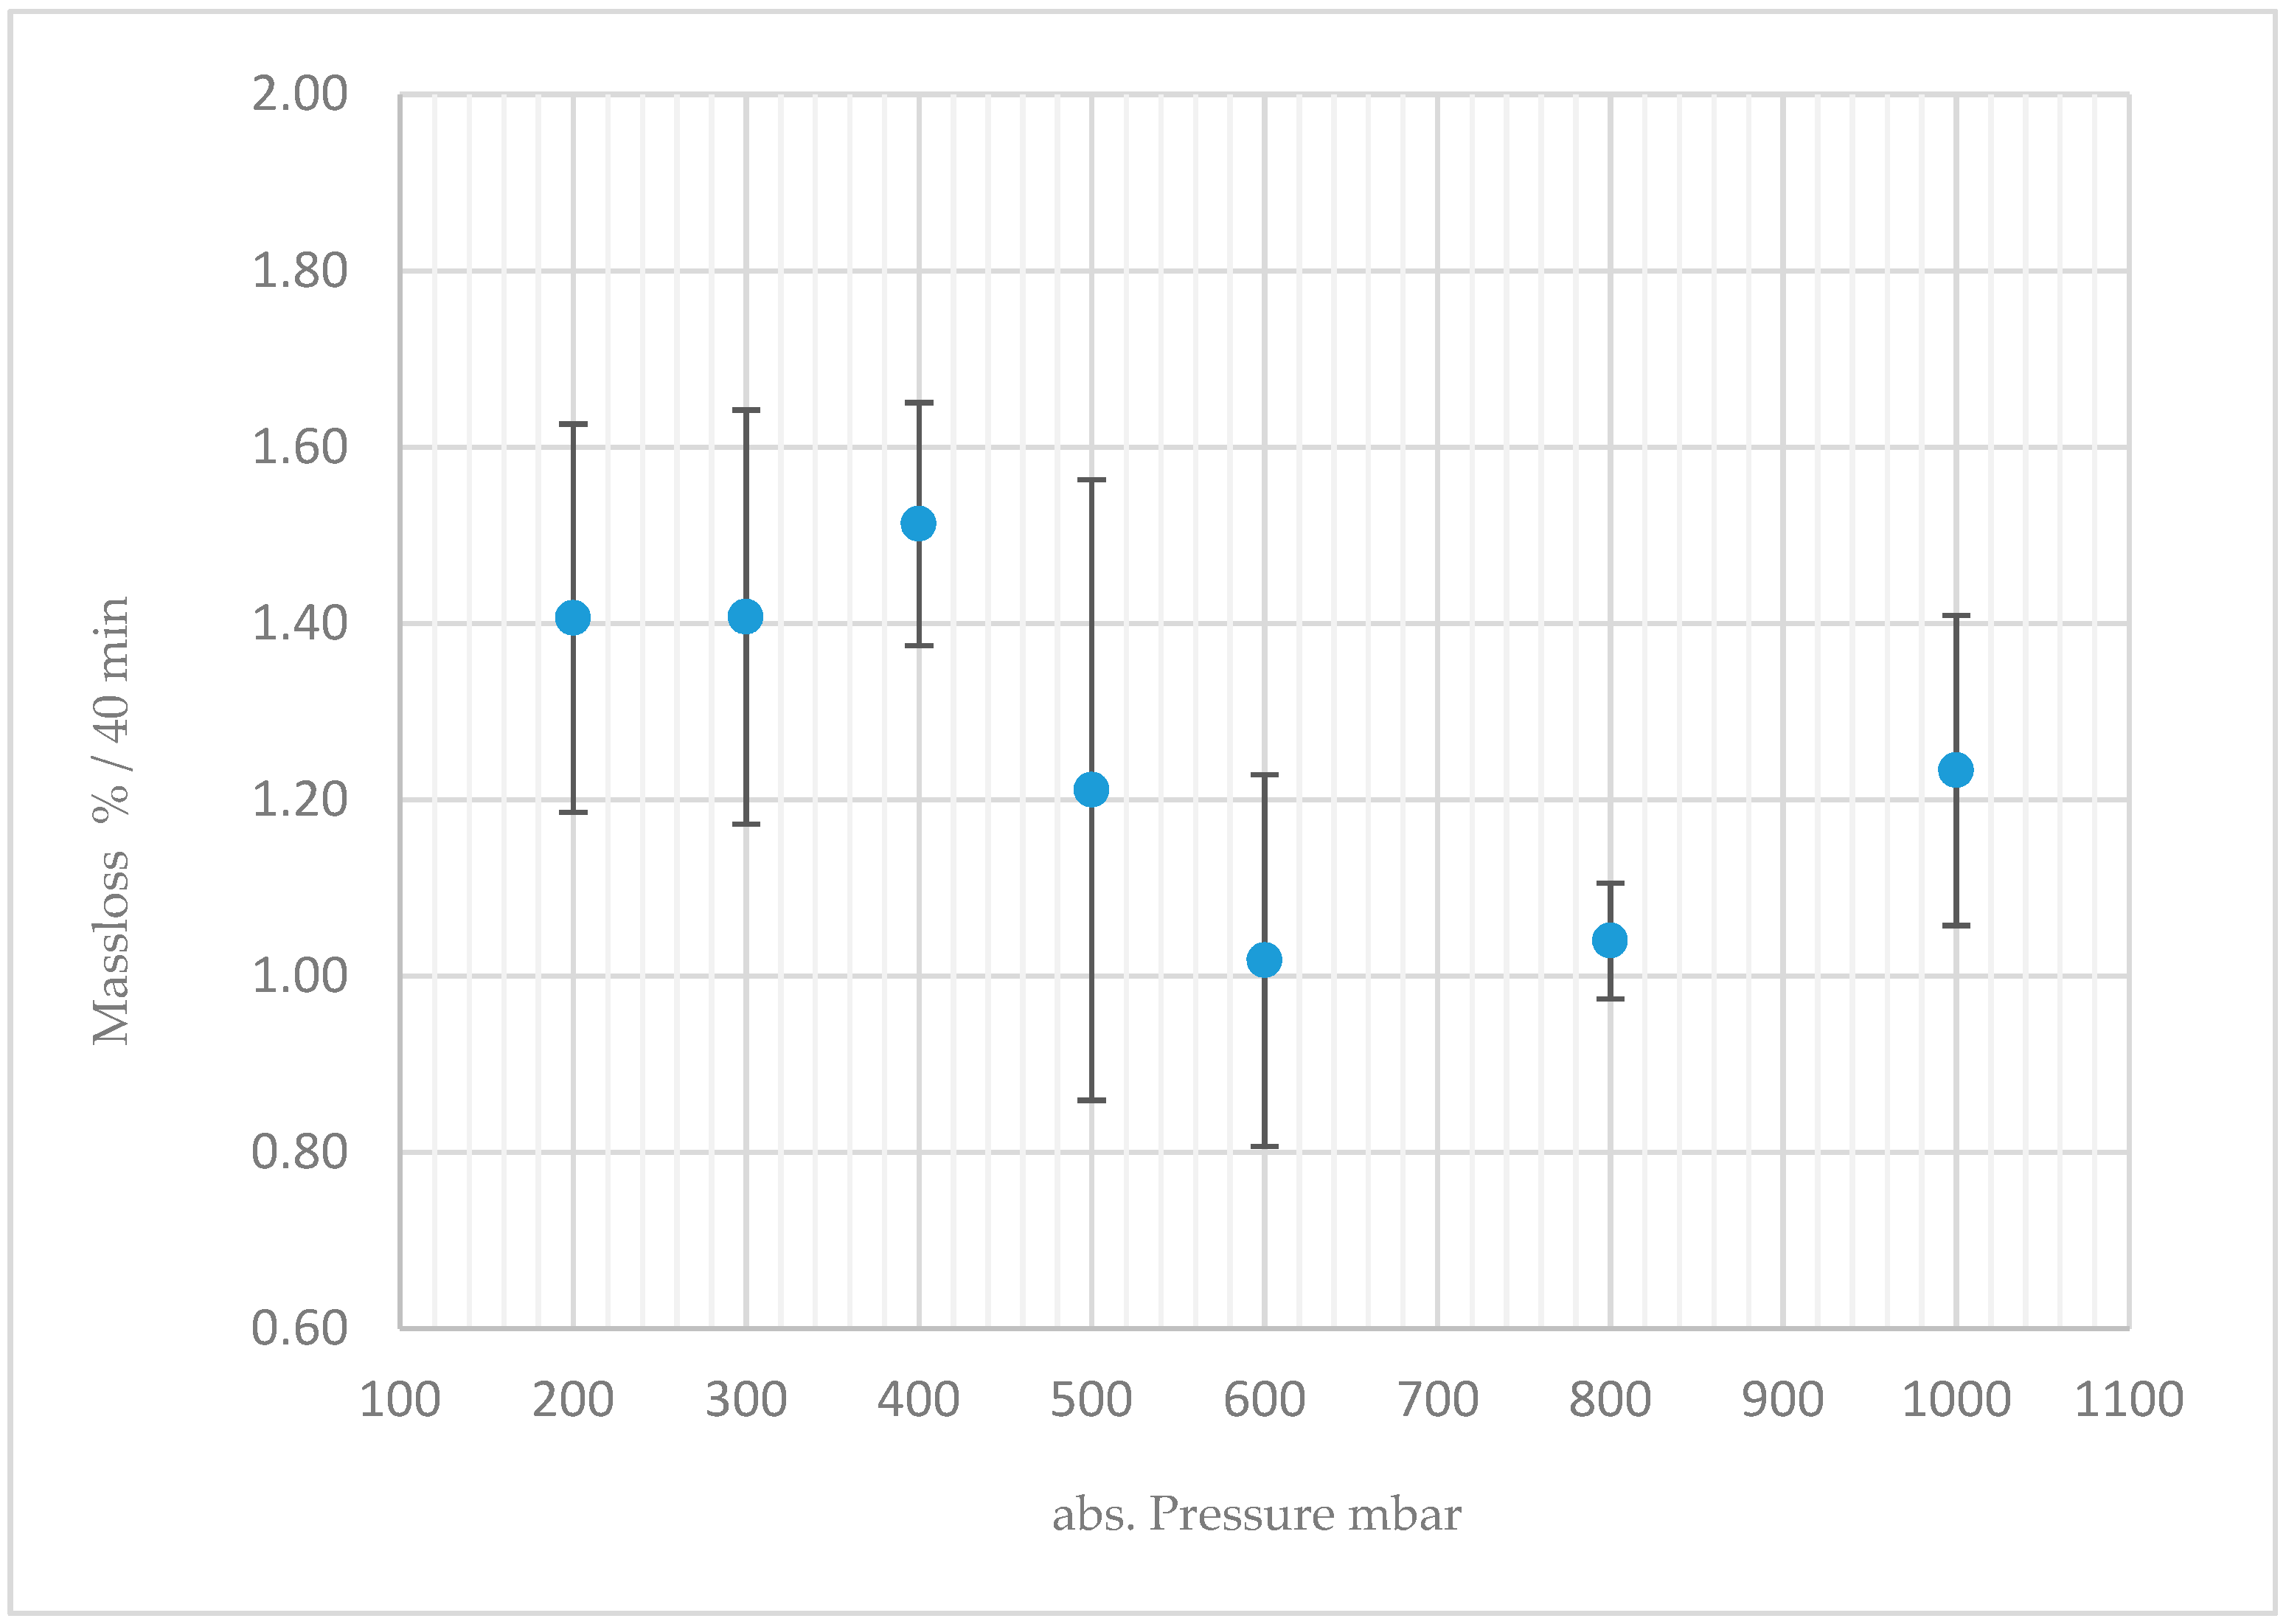
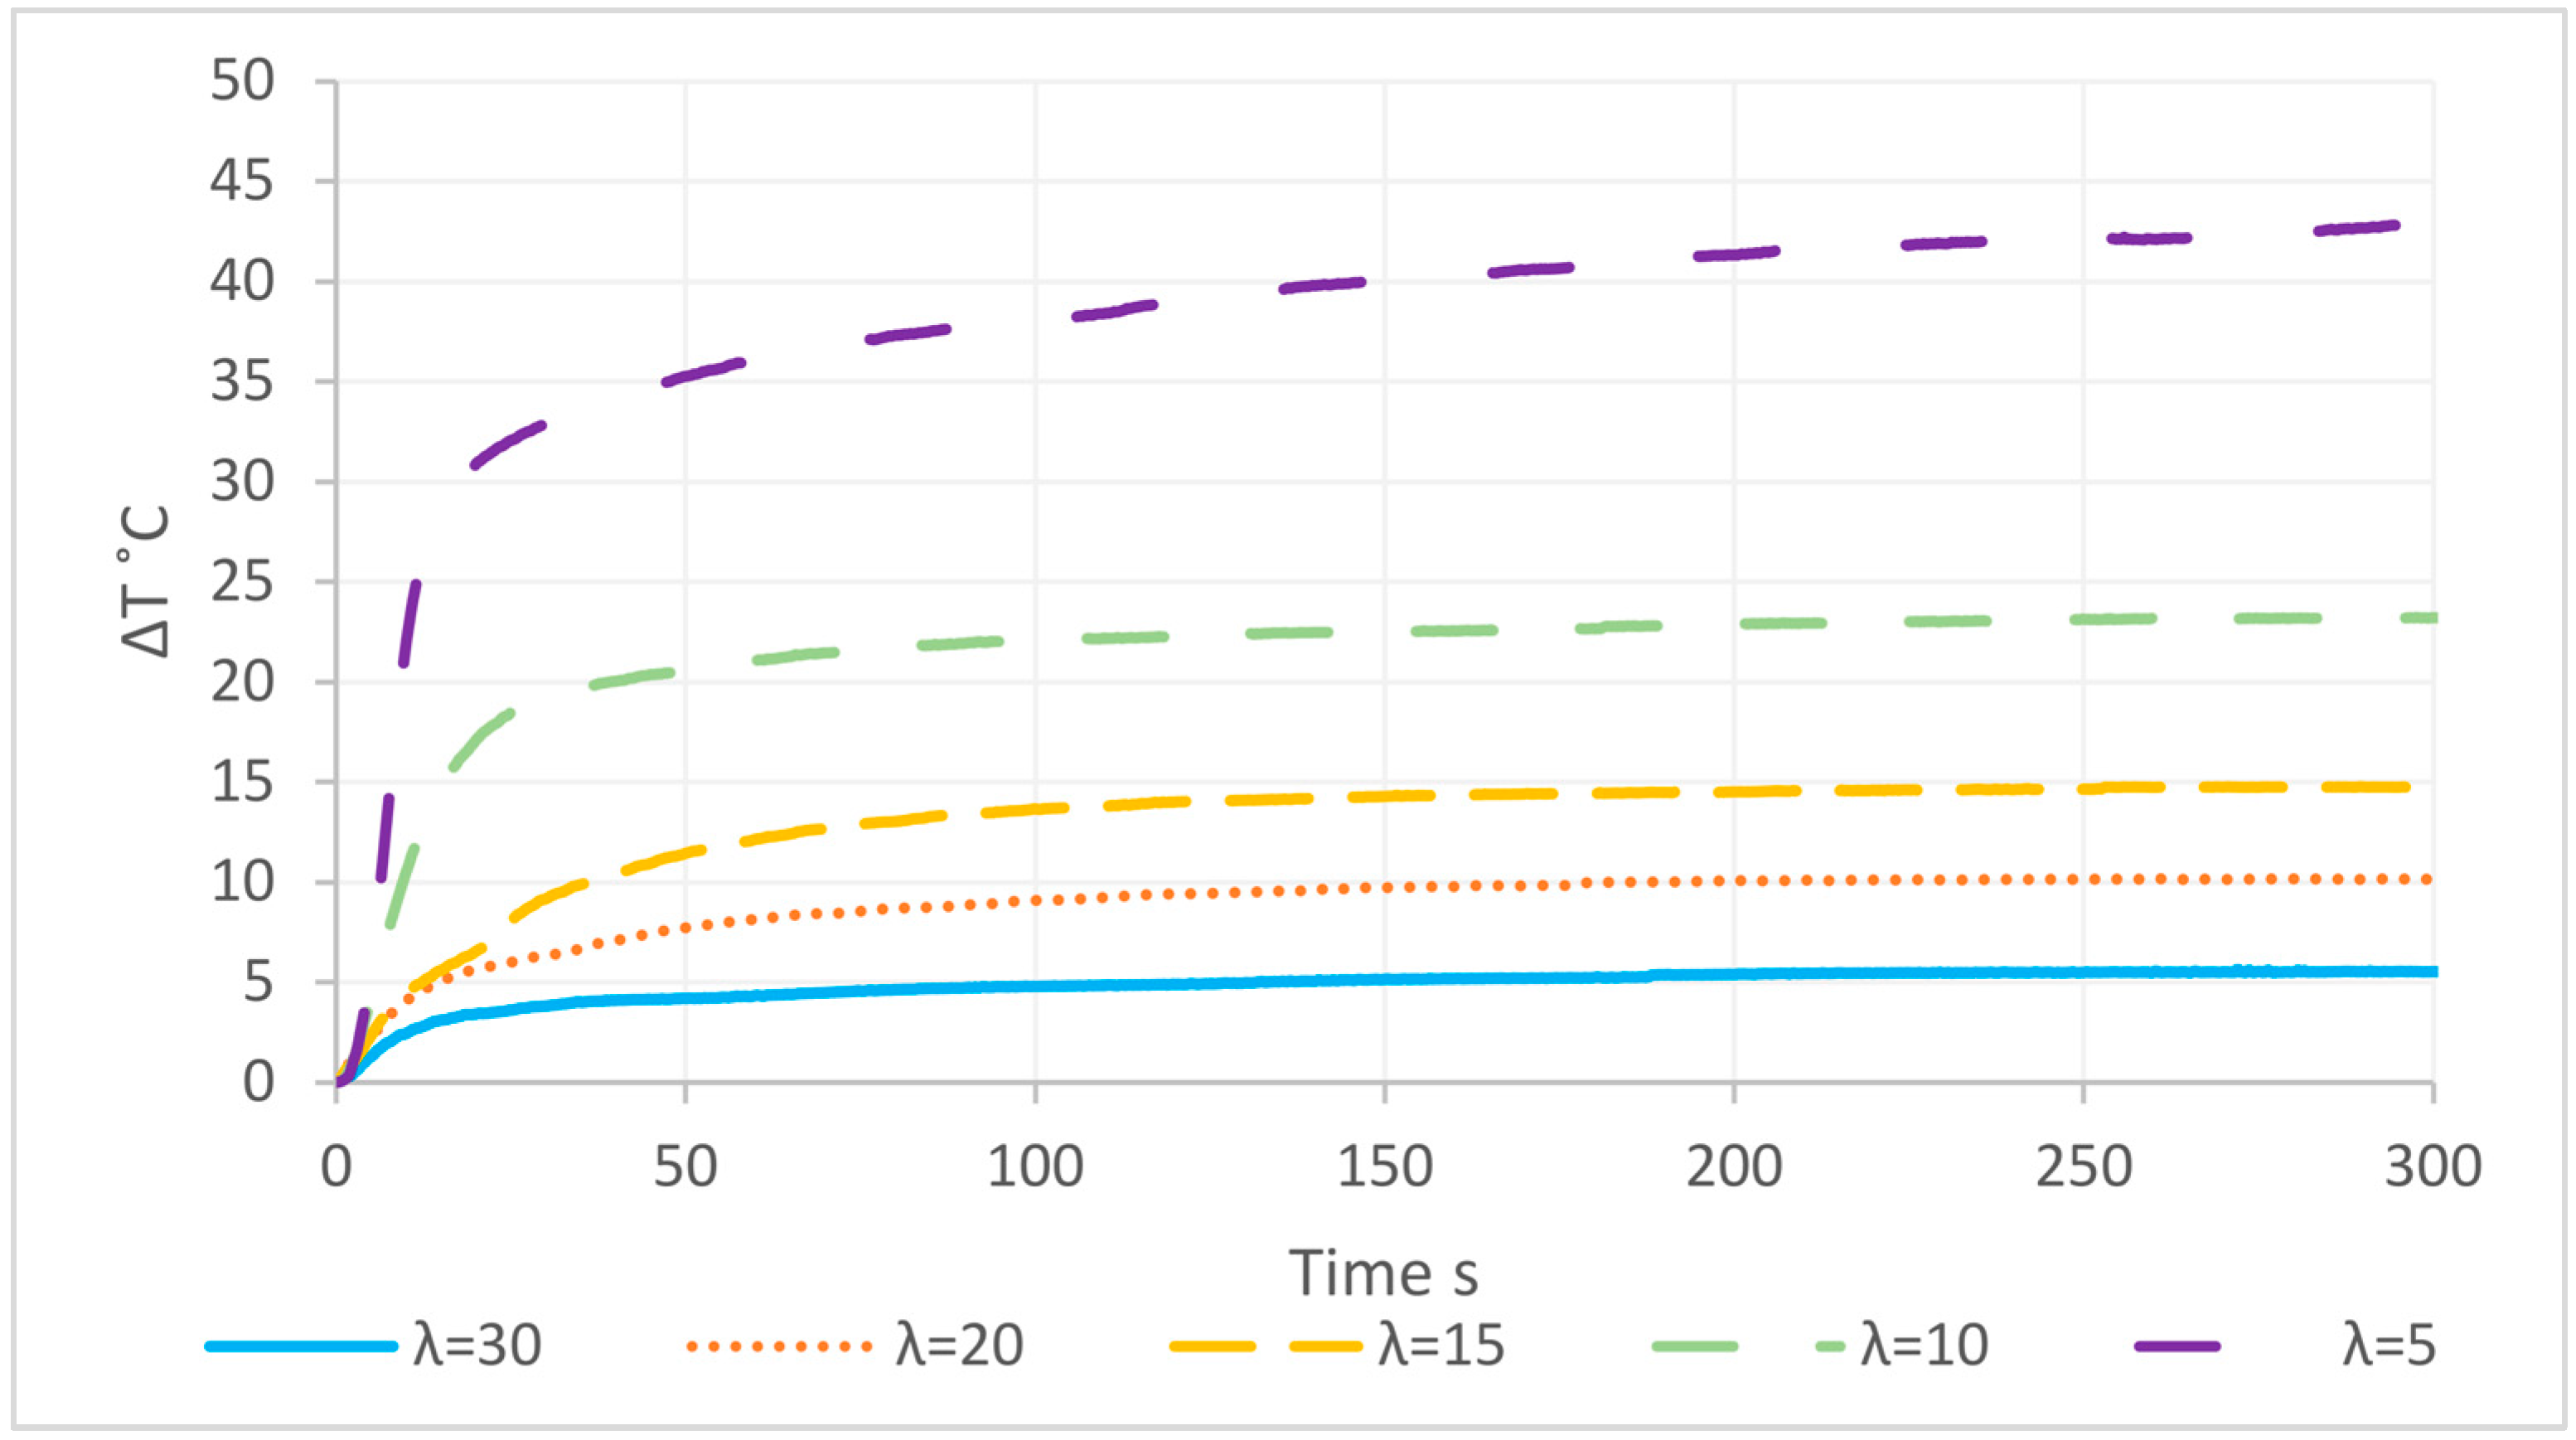
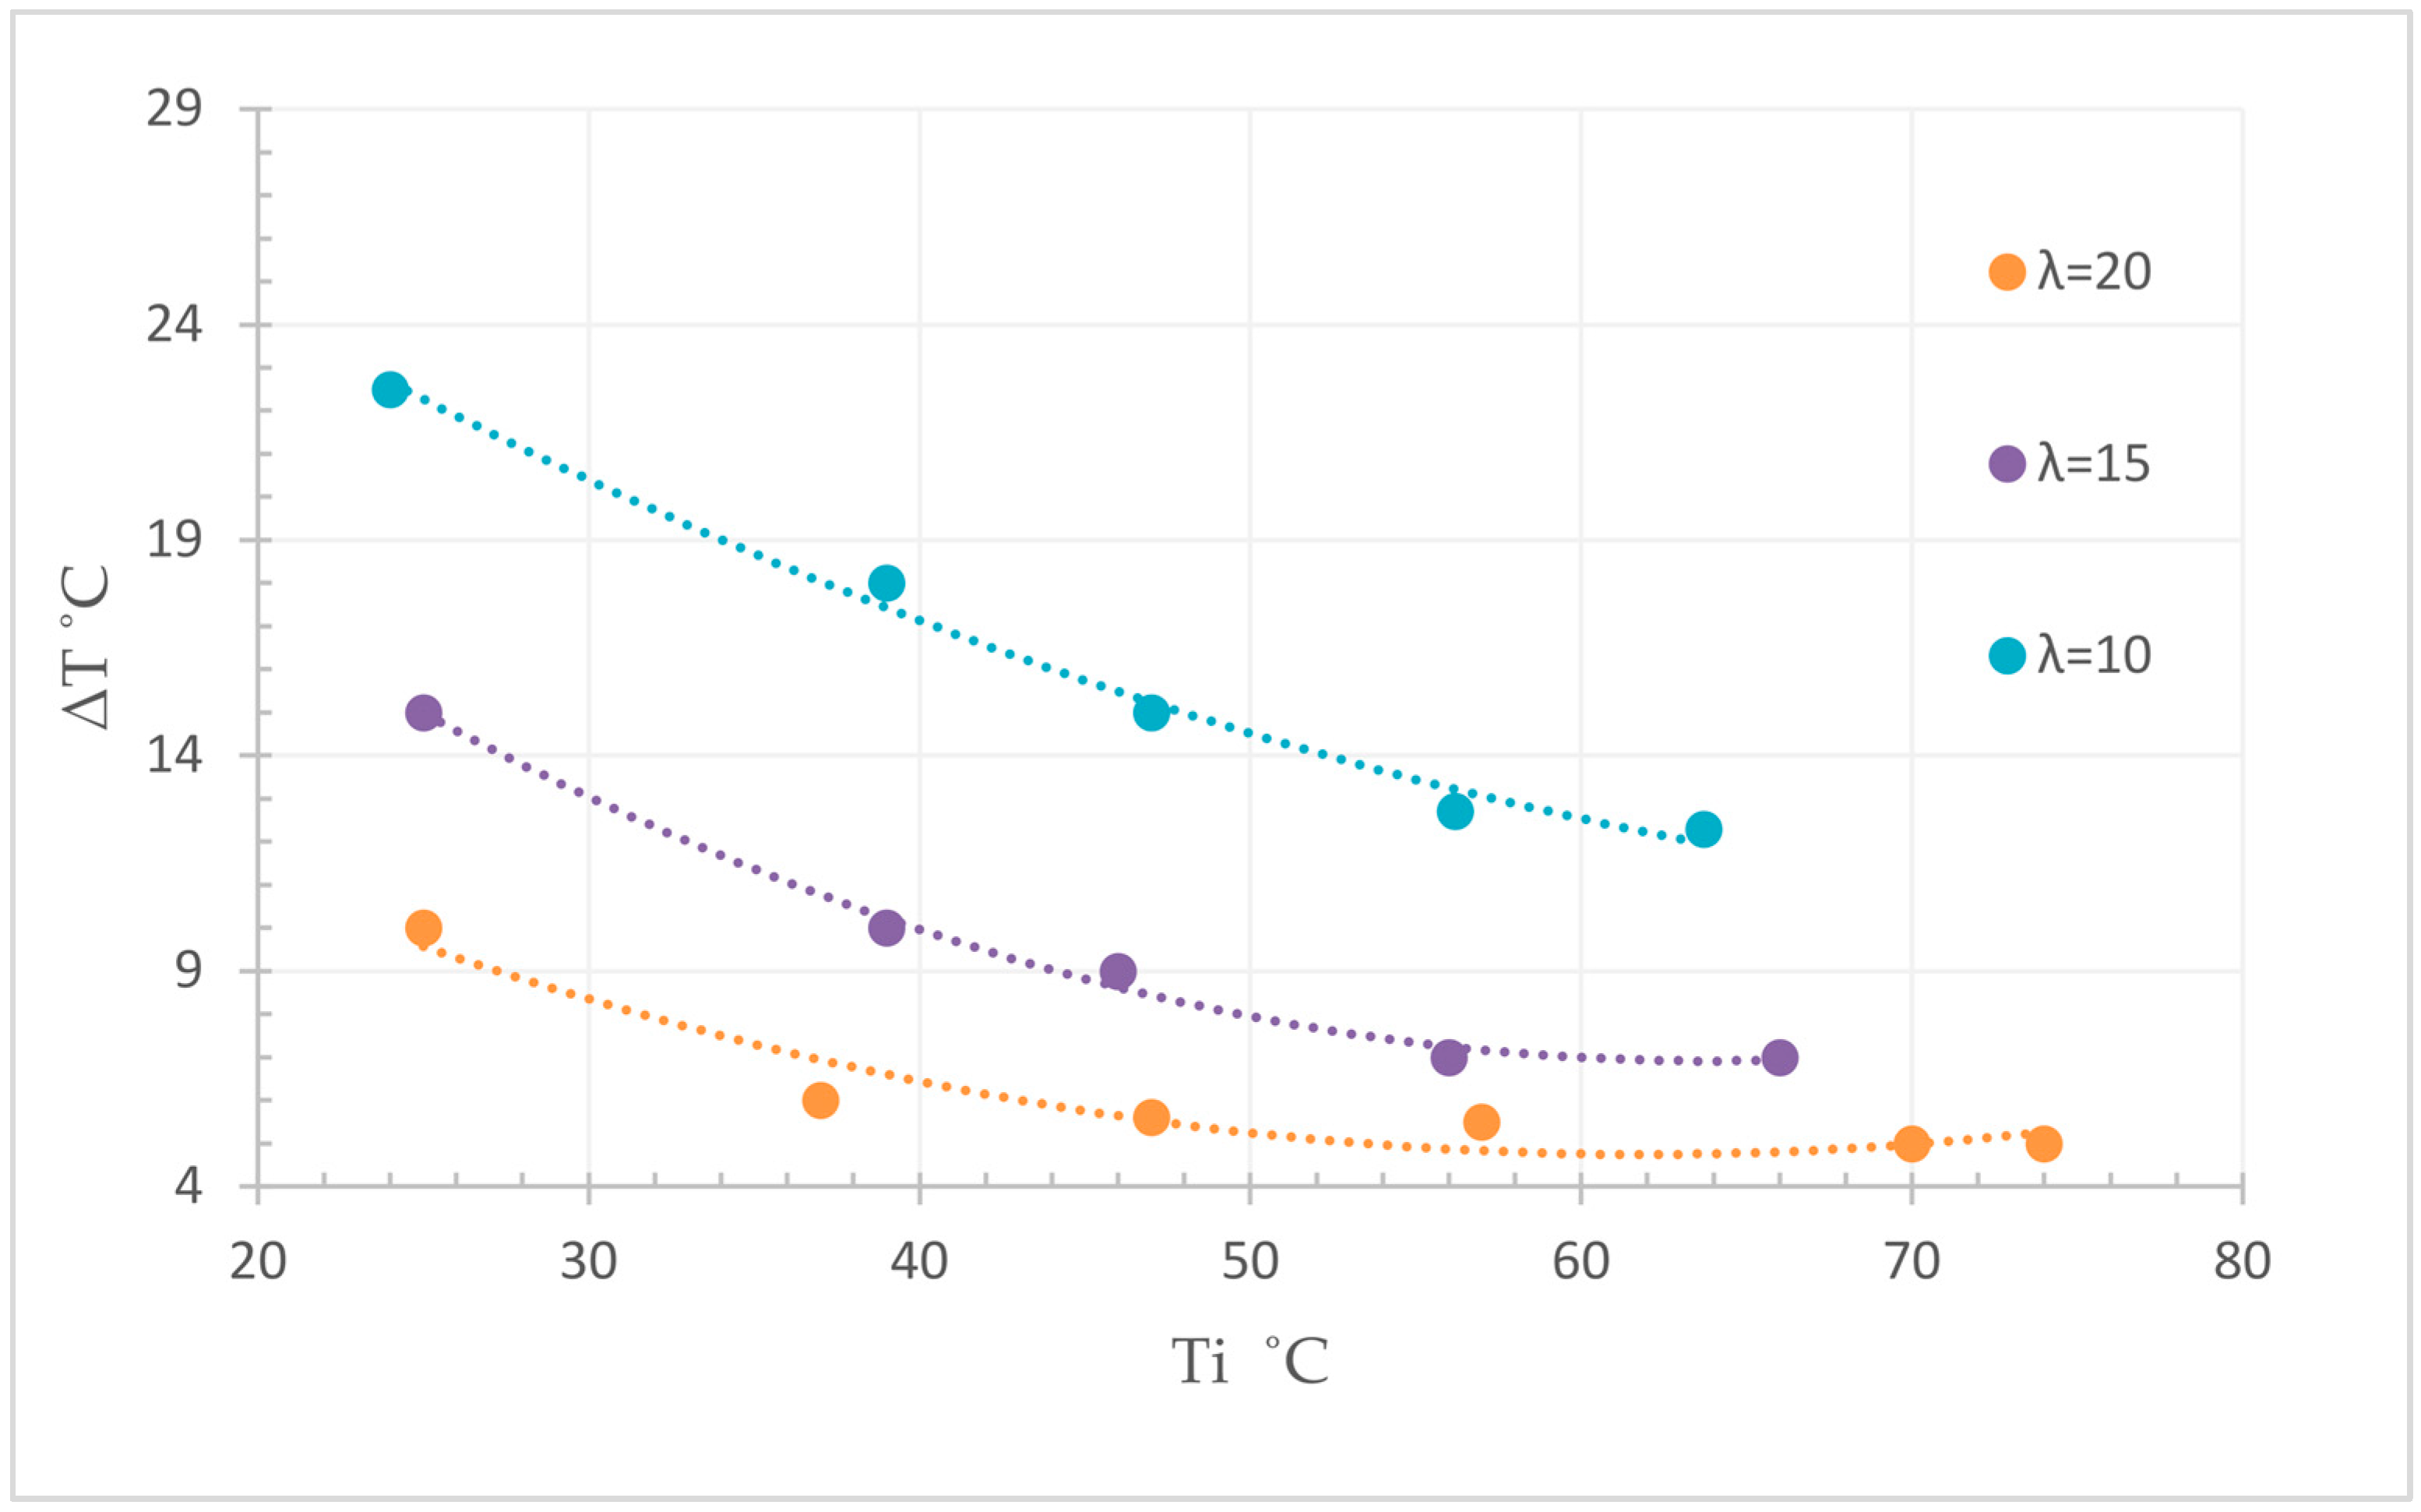
3.6. Macroscopic Reaction Heat Analysis
4. Conclusions
5. Patents
Author Contributions
Funding
Acknowledgments
Conflicts of Interest
References
- UNFCCC. What Is the Kyoto Protocol? Available online: https://unfccc.int/process-and-meetings/the-kyoto-protocol/what-is-the-kyoto-protocol/what-is-the-kyoto-protocol (accessed on 6 August 2018).
- European Commission. 2020 Energy Strategy. Available online: https://ec.europa.eu/energy/en/topics/energy-strategy-and-energy-union/2020-energy-strategy (accessed on 6 August 2018).
- European Commission. 2030 Climate & Energy Framework. Available online: https://ec.europa.eu/clima/policies/strategies/2030_en#tab-0-0 (accessed on 7 August 2018).
- International Energy Agency. World Energy Outlook 2017; International Energy Agency: Paris, France, 2017. [Google Scholar]
- Miro, L.; Bruckner, S.; Cabeza, L.E. Mapping and discussing Industrial Waste Heat (IWH) potentials for different countries. Renew. Sustain. Energy Rev. 2015, 51, 847–855. [Google Scholar] [CrossRef] [Green Version]
- Alva, G.; Liu, L.K.; Huang, X.; Fang, G.Y. Thermal energy storage materials and systems for solar energy applications. Renew. Sustain. Energy Rev. 2017, 68, 693–706. [Google Scholar] [CrossRef]
- Alva, G.; Lin, Y.; Fang, G. An overview of thermal energy storage systems. Energy 2018, 144, 341–378. [Google Scholar] [CrossRef]
- Zhang, H.L.; Baeyens, J.; Caceres, G.; Degreve, J.; Lv, Y.Q. Thermal energy storage: Recent developments and practical aspects. Prog. Energy Combust. Sci. 2016, 53, 1–40. [Google Scholar] [CrossRef]
- Pardo, P.; Deydier, A.; Anxionnaz-Minvielle, Z.; Rouge, S.; Cabassud, M.; Cognet, P. A review on high temperature thermochemical heat energy storage. Renew. Sustain. Energy Rev. 2014, 32, 591–610. [Google Scholar] [CrossRef] [Green Version]
- Deutsch, M.; Muller, D.; Aumeyr, C.; Jordan, C.; Gierl-Mayer, C.; Weinberger, P.; Winter, F.; Werner, A. Systematic search algorithm for potential thermochemical energy storage systems. Appl. Energy 2016, 183, 113–120. [Google Scholar] [CrossRef]
- Cabeza, L.F.; Sole, A.; Barreneche, C. Review on sorption materials and technologies for heat pumps and thermal energy storage. Renew. Energy 2017, 110, 3–39. [Google Scholar] [CrossRef]
- Gonzalez-Roubaud, E.; Perez-Osorio, D.; Prieto, C. Review of commercial thermal energy storage in concentrated solar power plants: Steam vs. molten salts. Renew. Sustain. Energy Rev. 2017, 80, 133–148. [Google Scholar] [CrossRef]
- VDI-wärmeatlas, V. 10. Auflage; Springer: Berlin, Germany, 2006.
- Zalba, B.; Marin, J.M.; Cabeza, L.F.; Mehling, H. Review on thermal energy storage with phase change: Materials, heat transfer analysis and applications. Appl. Therm. Eng. 2003, 23, 251–283. [Google Scholar] [CrossRef]
- Setoodeh Jahromy, S.; Birkelbach, F.; Jordan, C.; Huber, C.; Harasek, M.; Werner, A.; Winter, F. Impact of Partial Pressure, Conversion, and Temperature on the Oxidation Reaction Kinetics of Cu2O to CuO in Thermochemical Energy Storage. Energies 2019, 12, 508. [Google Scholar] [CrossRef]
- Roine, A. HSC Chemistry® 7; Outotec: Espoo, Finland, 2007. [Google Scholar]
- Zachariasen, W.H. The crystal structure of cubic metaboric acid. Acta Crystallogr. 1963, 16, 380–384. [Google Scholar] [CrossRef] [Green Version]
- Sevim, F.; Demir, F.; Bilen, M.; Okur, H. Kinetic analysis of thermal decomposition of boric acid from thermogravimetric data. Korean J. Chem. Eng. 2006, 23, 736–740. [Google Scholar] [CrossRef]
- Balcı, S.; Sezgi, N.A.; Eren, E. Boron Oxide Production Kinetics Using Boric Acid as Raw Material. Ind. Eng. Chem. Res. 2012, 51, 11091–11096. [Google Scholar] [CrossRef]
- Zhang, W.; Sun, S.; Xu, J.; Chen, Z. Kinetic Study of Boron Oxide Prepared by Dehydration of Boric Acid. Asian J. Chem. 2015, 27, 1001–1004. [Google Scholar] [CrossRef]
- Harabor, A.; Rotaru, P.; Scorei, R.I.; Harabor, N.A. Non-conventional hexagonal structure for boric acid. J. Therm. Anal. Calorim. 2014, 118, 1375–1384. [Google Scholar] [CrossRef]
- Rotaru, A. Thermal and kinetic study of hexagonal boric acid versus triclinic boric acid in air flow. J. Therm. Anal. Calorim. 2017, 127, 755–763. [Google Scholar] [CrossRef]
- Aghili, S.; Panjepour, M.; Meratian, M. Kinetic analysis of formation of boron trioxide from thermal decomposition of boric acid under non-isothermal conditions. J. Therm. Anal. Calorim. 2018, 131, 2443–2455. [Google Scholar] [CrossRef]
- U.S. Geological Survey. Mineral Commodity Summaries 2018; U.S. Department of the Interior: Washington, DC, USA, 2018.
- Indian Bureau of Mines. Part-III: Minerals Reviews—Boron Minerals; Government of India—Ministry of Mines: New Delhi, India, 2017.
- Scorei, R.I.; Rotaru, P. Calcium fructoborate--potential anti-inflammatory agent. Biol. Trace Elem. Res. 2011, 143, 1223–1238. [Google Scholar] [CrossRef]
- Iavazzo, C.; Gkegkes, I.D.; Zarkada, I.M.; Falagas, M.E. Boric acid for recurrent vulvovaginal candidiasis: The clinical evidence. J. Womens Health 2011, 20, 1245–1255. [Google Scholar] [CrossRef]
- Perelygin, Y.P.; Chistyakov, D.Y. Boric acid. Russ. J. Appl. Chem. 2006, 79, 2041–2042. [Google Scholar] [CrossRef]
- CIA. The Use of Boron Substances in Fuels; General CIA Records: Washington, DC, USA, 1955.
- Lager, D. Evaluation of Thermophysical Properties for Thermal Energy Storage Materials—Determining Factors, Prospects and Limitations. PhD Thesis, TU Wien, Wien, Austria, 2017. [Google Scholar]
- Vyazovkin, S.; Chrissafis, K.; Di Lorenzo, M.L.; Koga, N.; Pijolat, M.; Roduit, B.; Sbirrazzuoli, N.; Sunol, J.J. ICTAC Kinetics Committee recommendations for collecting experimental thermal analysis data for kinetic computations. Thermochim. Acta 2014, 590, 1–23. [Google Scholar] [CrossRef]
- Mukhanov, V.A.; Kurakevich, O.O.; Solozhenko, V.L. On the hardness of boron (III) oxide. J. Superhard Mater. 2008, 30, 71–72. [Google Scholar]
- Dressler, W. Ueber die Flüchtigkeit der Borsäure. neue Bestimmungen des Verteilungsgleichgewichtes zwischen Wasser und Dampf; ETH Zürich: Zurich, Switzerland, 1945. [Google Scholar]
- Pawlek, B. Optimierung des B2O3—H3BO3 Reaktionssystems zum Zwecke der thermischen Energiespeicherung. Bachelor’s Thesis, TU Wien, Wien, Austria, 2019. [Google Scholar]
- Reis, J.M.S.M.d. Hydration of Boron Oxide for Thermochemical Energy Storage. Master’s Thesis, TU Wien, Wien, Austria, 2018; p. 85. [Google Scholar]
- Werner, A.; Karel, T.; Jordan, C.; Deutsch, M.; Winter, F. Verfahren zur thermochemischen Energiespeicherung. Austrian Patent AT 518448 B1, 15 December 2017. Available online: www.patentamt.at (accessed on 21 March 2019).


| Type | Material | Energy Storage Density | Temp-Range/Melting Point | Ref. |
|---|---|---|---|---|
| Physisorption TES | Zeolites 13X/H2O | 601 MJ/m3 | 65–130 °C | [11] |
| Chemisorption TES | MgSO4 × 7H2O | 1512 MJ/m3 | 150 °C | [11] |
| Sensible TES | HITEC solar salt | 2.9 MJ/m3 | 250–450 °C | [12] |
| Sensible TES | Water at 50 °C | 206 MJ/m3 | 50 °C | [13] |
| Latent TES | MgCl2 | 1048 MJ/m3 | 714 °C | [14] |
| Latent TES | NaF | 2031 MJ/m3 | 996 °C | [6] |
| TCES | Cu2O | 3606 MJ/m3 | 350–1100 °C | [15] |
| TCES | H3BO3 | 2238 MJ/m3 | 90–<200 °C | [16] |
© 2019 by the authors. Licensee MDPI, Basel, Switzerland. This article is an open access article distributed under the terms and conditions of the Creative Commons Attribution (CC BY) license (http://creativecommons.org/licenses/by/4.0/).
Share and Cite
Huber, C.; Setoodeh Jahromy, S.; Jordan, C.; Schreiner, M.; Harasek, M.; Werner, A.; Winter, F. Boric Acid: A High Potential Candidate for Thermochemical Energy Storage. Energies 2019, 12, 1086. https://doi.org/10.3390/en12061086
Huber C, Setoodeh Jahromy S, Jordan C, Schreiner M, Harasek M, Werner A, Winter F. Boric Acid: A High Potential Candidate for Thermochemical Energy Storage. Energies. 2019; 12(6):1086. https://doi.org/10.3390/en12061086
Chicago/Turabian StyleHuber, Clemens, Saman Setoodeh Jahromy, Christian Jordan, Manfred Schreiner, Michael Harasek, Andreas Werner, and Franz Winter. 2019. "Boric Acid: A High Potential Candidate for Thermochemical Energy Storage" Energies 12, no. 6: 1086. https://doi.org/10.3390/en12061086