Article

Effect of Fuel and Air Dilution on Syngas Combustion in an Optical SI Engine

1
Instituto de Mecánica y Producción Industrial, Universidad de La República, Montevideo 11300, Uruguay
2
Istituto Motori, Consiglio Nazionale delle Ricerche, 80125 Napoli, Italy
3
Instituto Tecnológico de Aeronáutica, São Jose dos Campos 12228-900, Brazil
*
Author to whom correspondence should be addressed.
Energies 2019, 12(8), 1566; https://doi.org/10.3390/en12081566
Submission received: 12 March 2019 / Revised: 3 April 2019 / Accepted: 19 April 2019 / Published: 25 April 2019

Abstract

:
To mitigate the increasing concentration of carbon dioxide in the atmosphere, energy production processes must change from fossil to renewable resources. Bioenergy utilization from agricultural residues can be a step towards achieving this goal. Syngas (fuel obtained from biomass gasification) has been proved to have the potential of replacing fossil fuels in stationary internal combustion engines (ICEs). The processes associated with switching from traditional fuels to alternatives have always led to intense research efforts in order to have a broad understanding of the behavior of the engine in all operating conditions. In particular, attention needs to be focused on fuels containing relatively high concentrations of hydrogen, due to its faster propagation speed with respect to traditional fossil energy sources. Therefore, a combustion study was performed in a research optical SI engine, for a comparison between a well-established fuel such as methane (the main component of natural gas) and syngas. The main goal of this work is to study the effect of inert gases in the fuel mixture and that of air dilution during lean fuelling. Thus, two pure syngas blends (mixtures of CO and H2) and their respective diluted mixtures (CO and H2 with 50vol% of inert gases, CO2 and N2) were tested in several air-fuel ratios (stoichiometric to lean burn conditions). Initially, the combustion process was studied in detail by traditional thermodynamic analysis and then optical diagnostics were applied thanks to the optical access through the piston crown. Specifically, images were taken in the UV-visible spectrum of the entire cycle to follow the propagation of the flame front. The results show that hydrogen promotes flame propagation and reduces its distortion, as well as resulting in flames evolving closer to the spark plug. All syngas blends show a stable combustion process, even in conditions of high air and fuel dilution. In the leanest case, real syngas mixtures present a decrease in terms of performance due to significant reduction in volumetric efficiency. However, this condition strongly decreases pollutant emissions, with nitrogen oxide (NOx) concentrations almost negligible.

1. Introduction

The provision of an extended electricity distribution network in rural areas of developing countries is an objective which has been recognized by the governments of these countries as well as international institutions [1,2]. One potential option is to create small isolated grids, powered by small-scale generators with a low-cost fuel. In general, residues of biomass are discarded or directly burned in low-efficiency systems which implies high rates of waste. An improved process for obtaining fuel from biomass waste is gasification, a process in which syngas is obtained [3,4]. This alternative fuel is generally considered in the literature as a mixture of hydrogen and carbon monoxide [5]. However, given the commercial processes for its production, it is common to find large amounts of nitrogen and carbon dioxide (20–70% of the total gas in volume). In some cases, methane and other fuel gases are found in the blend, but in percentages less than 3%. The final mixture depends on components such as the gasification process, the raw material and oxidant used [6]. Specifically, the most common type of gasifier tested by several researchers [7,8,9,10] coupled with ICEs is the downdraft fixed bed gasifier (DFBG) due to the flexibility in terms of capability of using a wide variety of biomass sources. Therefore, at locations where agroindustry waste is available in large amounts, this technology is a potential solution for the improvement of electrification. The main requirements in these areas are low cost of installation and simple operation; therefore, several combustion and mechanical tasks need to be solved before this idea can be implemented on a large scale.
The synthesized gas is characterized by great variability in its composition, given the various input factors that affect the production process. One of the most important is the composition of biomass residues [11]. In general, inert gases (CO2 and N2) are present in concentrations around 50% when air is used as an oxidant in DFBG systems [12]. The latter dilutes the fuel gas making it more difficult to combust in engines, as it results in high cyclic variability, similar to lean burn conditions. Additionally, syngas is characterized by volumetric energy content lower than traditional fuels such as gasoline, methane, etc. This directly affects the volumetric efficiency of the engine and consequently the thermal efficiency. Another important feature is the stoichiometric air-fuel ratio (AFRst). For biomass waste is between 1.0 and 9.0, significantly less than methane (17.2). Therefore, increased injection times and, in some cases, different injector design is needed.
Several authors [7,8,13,14,15,16,17] have studied syngas mixtures and compared them with conventional fuels (gasoline, natural gas, and hydrogen) in terms of engine performance, durability, combustion stability, and exhaust emissions. A reduction in efficiency and power was observed due to low energy density. Also, it is not possible to reach stoichiometric AFR given the prolonged injection pulses that are necessary [18]. Therefore, the analysis is done comparing lean operative conditions (λ = 1.2 to 2.0). Moreover, the start of combustion must be delayed so as not to produce excessive peak pressure events and to improve the performance due to the higher rate of combustion, mainly due to the presence of hydrogen. The compression ratio can be increased given the low tendency to knock in this type of fuel thanks to the presence of CO and N2 [19]. However, in almost all works the high combustion instability was highlighted as one of the main problems. The coefficient of variation values in indicated mean effective pressure (COVIMEP) above 10% was measured, which is considered unacceptable for any power production engines.
Among several experimental and numerical works in the area, this technology was not widely applied due to, at least in part, several combustion-related issues. Starting from these considerations, four different synthetic syngas mixtures (prepared in laboratory conditions) were tested, with and without the addition of diluents in the fuel. Then, for comparative purposes, the blends were analyzed together with methane as a baseline fuel. The first group of syngas is called ‘pure syngas’ with two blends: S50 (50% H2 + 50% CO) and S75 (75% H2 + 25% CO). The second group is called ‘real syngas’, with two blends: S50D (S50 + 50% diluents) and S75D (S75 + 50% diluents). The experimental campaign was performed in a spark ignition (SI) single cylinder engine (SCE) testbed with port fuel injection (PFI) system. Moreover, the engine is equipped with a flat optical piston that enables the bottom view of the pent-roof combustion chamber. The objective is to investigate the effect of diluents (N2, CO2, and Air) on the combustion process, with the application of traditional thermodynamic techniques and direct flame visualization. Fuel dilution refers to the mix of inert gases (N2 and CO2) in the pure fuel and the term air dilution corresponds to lean operation (λ > 1.0). Moreover, the engine speed was set at 900 rpm and maximum load or throttle fully open (WOT). The relative air-fuel ratio was changed from stoichiometric (λ = 1.0), generally used in automotive SI engines, to values close to the extreme lean operative condition for methane (λ = 1.4), representative of stationary applications for power generation. This work adds valuable information in the combustion field, and it could help to overcome some practical difficulties currently found in the development of engines operated with syngas. In addition, it incorporates new optical combustion measurements of alternative fuels that cannot be found in the bibliography. It is important to note that the measurements are performed in real engine operating conditions in which flame speed, as well as other spatial parameters of the combustion, were obtained.

2. Experimental Setup and Methodology

2.1. Experimental Apparatus

Experimental tests were performed on a PFI-SI-SCE as shown in Figure 1a. The same test bed was previously used in other work on combustion characterization [20,21]. Optical access is provided by both the piston and the top of the cylinder liner. In the first case, the metal piston crown is replaced by a sapphire window. The optical set-up allows a bottom view of around 78% of the piston diameter (61% of cylinder cross-section). By using the lateral view, the entire cylinder diameter (82 mm) and half of the stroke (45 mm) in the vertical axis can be observed. In this work, the view from below the combustion chamber was used to characterize the combustion process. However, flame speed measurements are similar from both views as it was demonstrated by the research group in previous work [21]. The light emitted by the combustion process after ignition and prior to the opening of the exhaust valves are captured thanks to a 45° inclined ultraviolet (UV) mirror located in the elongated piston and an acquisition system developed for this purpose (high-speed camera together with a double intensifier). Figure 1b shows the combustion chamber with external lighting for its visualization. During fired operation, the test cell is kept without light to avoid reflections as well as disturbances in the measurement. The cylinder head used is representative of current commercial engines with pent-roof design and two camshafts to command the two intake and two exhaust valves. In addition, the spark plug is located 5 mm from the center and a pressure sensor was inserted between the valves (Figure 1b) for the thermodynamic analysis of combustion.
Since it is a research engine, it allows flexibility in terms of the variation of different parameters. Among them is the compression ratio, which can be modified by placing spacers under the piston crown. In the present study, 9.7 was used for ensuring high-load operation points without incurring the danger of breaking the optical windows due to high-pressure peaks. All acquisition components are synchronized through an engine-timing unit. A high-precision rotary shaft encoder AVL 365 was used for engine control and data acquisition, with a resolution of 0.1 degrees crank angle. An electronic central unit (ECU) controlled injection and ignition parameters. In-cylinder pressure was measured with the AVL GU22C piezoelectric pressure transducer (accuracy of ±1%.) for combustion analysis. Further details on engine specifications can be found in Table 1 and previous work [20,21]. The top dead center (TDC) of combustion was taken as the reference point throughout the manuscript, with crank angle degree (CAD) after top dead center (ATDC) denominating signal phasing.
The experiments were performed at 900 rpm and WOT; the relatively low engine speed and load level were selected as operating conditions representative of electric generator systems [22]. The PFI system was programmed to end the injection close to intake valves opening (358 CAD ATDC) for all cases. This strategy was adopted to improve mixture homogeneity in the intake port and ensure that the injection is done with the intake valves closed, independently of the duration of fuel delivery (generally, syngas requires longer injection time compared to methane due to its lower AFR). Therefore, the falling edge of the injector control signal was set at 330 CAD ATDC. The relative air-fuel ratio was controlled by adjusting the duration of the injection pulse and monitored at the outlet of the exhaust manifold (30 cm from the exhaust valve) by means of an oxygen sensor especially calibrated for combustion of gaseous fuels. Likewise, the injection pressure was kept constant for all tests (7 bar) and the injection duration was changed to meet the required mixture strength in each test. The injector used was a Bosch ML082G gas injector. Ambient temperature (298 K), cooling water (333 K) and oil system (333 K) were kept constant and ambient pressure was around 1 atm.
Spark advance (SA) was set at maximum brake torque of the baseline case (−7 CAD ATDC) in order to maintain the same in-cylinder fluid conditions before the spark event. For this work, methane at stoichiometric condition was selected as the baseline case due to the extensive used in commercial application [23]. In addition, this approach is in line with the operation requirements by several manufacturers in order to change the fuel without ECU calibration changes [24].

2.2. Fuels

Four different syngas mixtures were tested in order to analyze the effect on the combustion process of inert gases (N2 and CO2) present in real syngas and air dilution in the total mixture. The ratios of reactive fuel components (H2/CO) were selected at 1.0 (50–50%) and 3.0 (75–25%), composition representative of pure syngas [25,26,27]; these were used by the research group in a previous work [20]. Diluted syngas, also called ‘real syngas’, was obtained by adding CO2 and N2 to the ‘pure syngas’ mixtures. The work of E. Monteiro [6] shows that a representative amount is around 35% for N2 and 15% of CO2 for fuels extracted from DFBG. This represents a total quantity of 50% degree of dilution (DOD). Also, see Table 2 for more details of the fuel mixtures. All the results were compared with pure methane, as a representative component of natural gas (NG), commonly used in the energy generation sector. Table 3 shows the main properties of the mixtures; diluted syngas has the lowest lower heating value (LHV), followed by pure syngas and methane. Also, 75/25 H2/CO shows higher LHV than the 50/50 H2/CO blend due to the higher ratio of hydrogen (LHV 142 MJ/kg) to CO (LHV 10 MJ/kg). Therefore, another interesting point of this experimental work is the inclusion of fuels with varied calorific power under the same operating conditions.
As a starting point in the combustion analysis of these fuels, the laminar flame speed was calculated by CHEMKIN-PRO 2018 tool [28,29] at ambient conditions (1 atm and 293 K). Syngas with dilution showed higher velocity compared to methane, but significantly less than the pure syngas. This is due to the proportion of hydrogen in the mixtures, which has a propagation speed higher than CO and CH4. If we compare the same H2/CO ratio in syngas, the dilution reduced speed values by 60% for the simulated conditions. Thus, one of the objectives of this work is to perform the same analysis at in-cylinder engine conditions. This means high temperature and pressure combined with the effects of fluid motion.
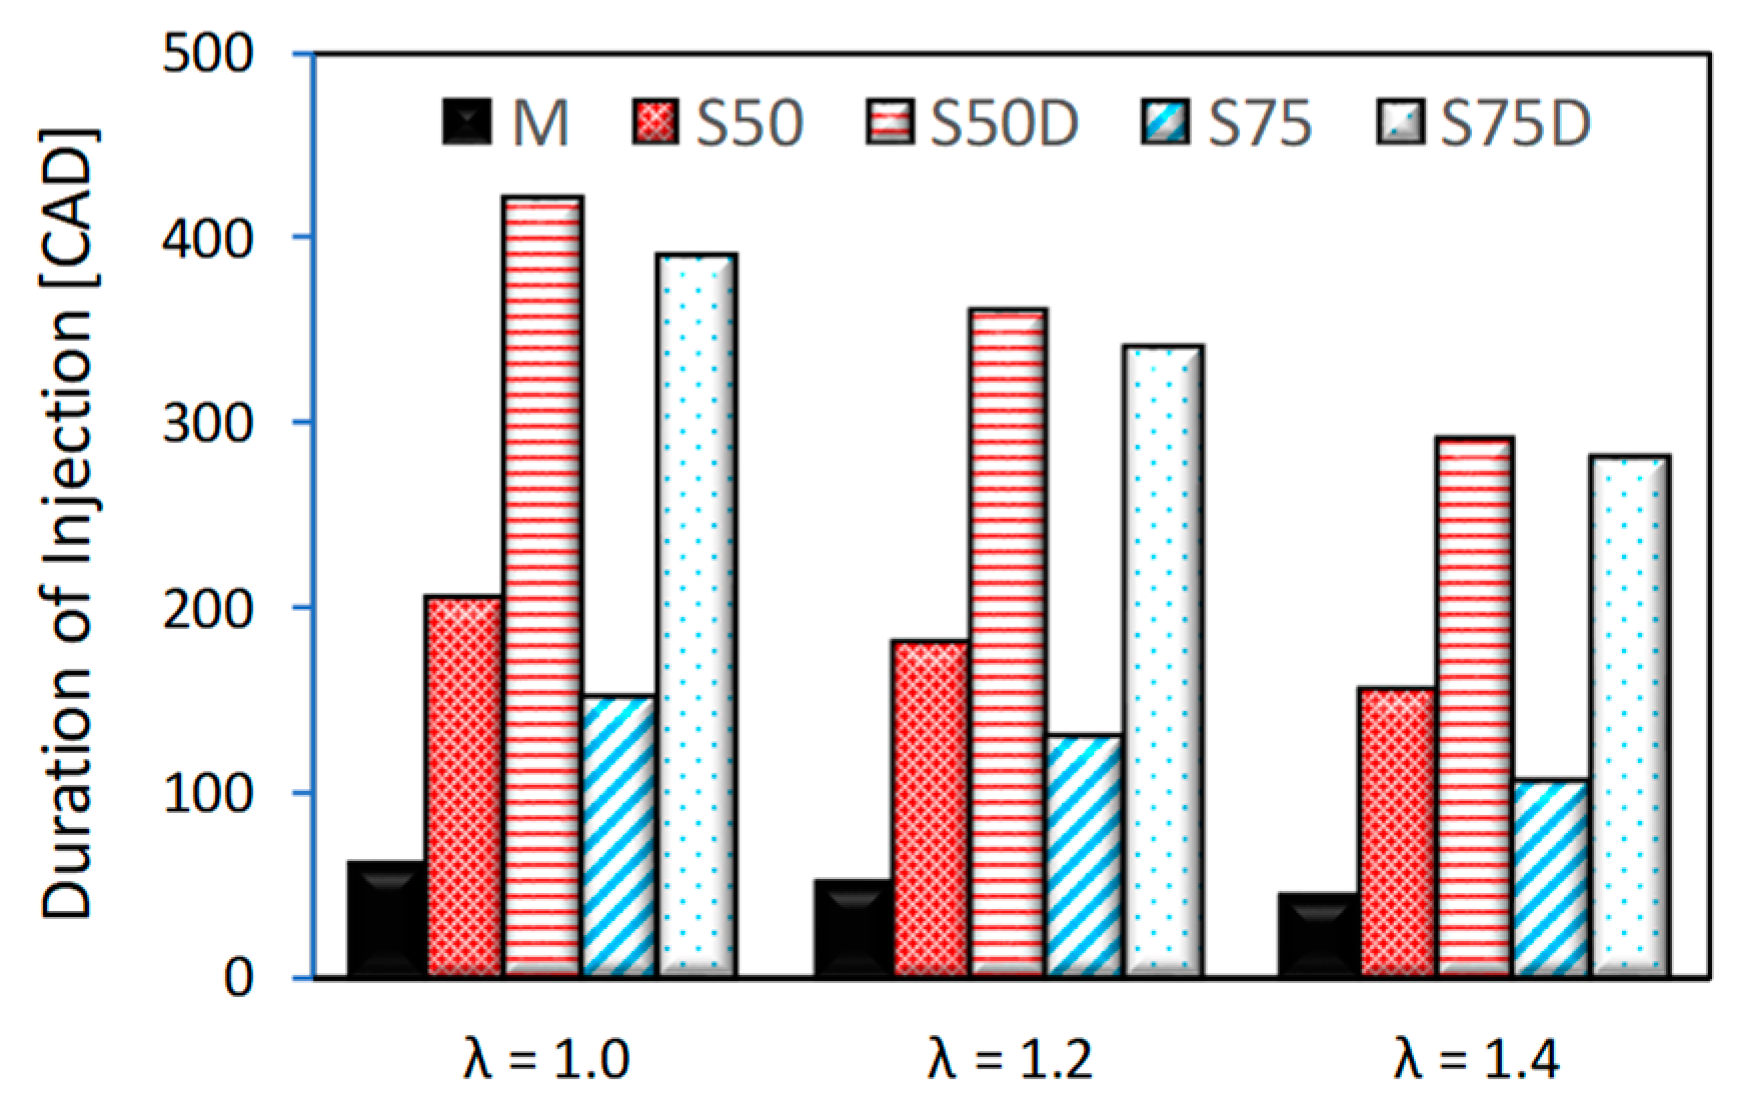
The air-fuel mixture was changed from stoichiometric to lean condition by varying the width of the injector pulse. The mix between fuel and air was done in the intake port, as is commonly found in commercial PFI-SI engines. It can be seen in Figure 2 that the mixtures with H2 have a long duration of injection. In addition, the DOI trend is inverse to the LHV and AFRst of the fuel presented in Table 3. The maximum difference was 360 CAD between methane and S50D at λ = 1.0. This configuration result shows the necessity of investigating, in several operative conditions, non-conventional fuels due to the high variations in control variables. Also, they are important for companies that aim to propose improvements in the future.

2.3. Thermodynamic and Optical Measurements

A traditional thermodynamic analysis was combined with optical measurements to obtain overall information about the combustion process. In addition, it is possible to observe the behavior of syngas flames with high spatial resolution thanks to the UV-digital image acquisition of the flame front. In-cylinder pressure data were recorded during 200 consecutive combustion cycles, and the last 30 cycles of each set featured acquisition of image sequences (limited due to the optical apparatus memory capacity). For the thermodynamic analysis, an in-house developed code was used to extract information on the rate of heat release, mass fraction burned (MFB), combustion stability (COVIMEP), power, fuel conversion efficiency and heat losses from pressure traces. The first-law analysis approach was used [30], which included the calculation of blow-by losses and heat transfer. This code was especially developed and calibrate for optical research engines; detailed information can be found in [31,32].
The image sequences were taken with a high-speed PCO Dimax S1 camera coupled with a Video Scope VS4-1845HS intensifier. This allows high sensitivity in the spectral range of 290–700 nm, typical of radical species as HC*, OH*, CH* found during the combustion process in ICEs [33]. The high-speed camera features a 12-bit complementary metal-oxide semiconductor image sensor (CMOS) that can work at up to 44,767 fps in full chip configuration (1008 × 1008 pixel). In this work, an acquisition rate of 5400 fps, i.e., 1 image/CAD, was set at the engine speed of 900 rpm. Therefore, a region of interest of 864 × 896 pixels was selected in the camera software. In addition, a UV-Nikon lens with a focal length of 105 mm and f-number of 4.5 was used. The obtained spatial resolution was 0.011 pixel/µm. Overall, the f-number together with the intensifier gain and exposure time was tuned to obtain high-quality images. An exposure time of 92.5 µs (0.5 CAD) and 70% of intensification level was fixed for all mixtures. However, the f-number was changed to avoid image saturation. Two different setups were used, one for high-luminosity flames (methane and pure syngas at λ = 1.0) with f/32 and the other with f/5.6 for diluted syngas and lean methane combustion. In spite of the fact that this approach has the disadvantage that flame luminosity between mixtures cannot be quantitatively compared, it avoids the risk of damage to the equipment and has no effect on the analysis of flame morphology parameters [34].
The National Instruments Vision Development Module was used for image post-processing by using an in-house algorithm [34]. Figure 3 shows the main steps of the procedure, from the original image to the outline flame front extraction. In this way, it was possible to estimate the flame area and its centroid coordinates, both in x (Cx) and y (Cy) directions. Moreover, propagation speed (St) was calculated with the assumption of a perfect semi-spherical flame (circumference in the x-y plane). Therefore, St is the incremental outline radius between two consecutive frames over the dwell time. The Heywood Circularity Factor (HCF) was used to follow the evolution of flame front distortion. This shape factor corresponded to the ratio between the flame front perimeter and the circumference length of a circle with the same area of the flame. Values different from 1.0 indicate distortion in the flame front with respect to a circumference, generally assumed by theoretical models as the shape of the flame view in a horizontal plane. More information about the calculus of morphological parameters can be found in [20].
All the parameters previously mentioned give information that characterizes the global or macroscopic behavior of the flame. Microscopic or local features of the flame front can also be obtained by applying the in-house Vision algorithm. In this work, evaluations were performed for obtaining the wrinkling of the flame front, defined as local curvature along the flame front (Figure 4a). A convention was adopted in which positive curvature is taken if the radius of curvature is measured from the unburnt gases as shown in Figure 4a. This radius is measured by discretization of the flame front in square regions of interest (side of 5 pixels). A long radius means low curvature and a short radius is equivalent to high curvature, as illustrated in Figure 4a. For each operative condition, the curvature frequency distributions were obtained by the cumulative of selected images from 30 consecutive cycles (Figure 4b), all corresponding to the same flame area compared to the piston cross-section. In detail, flame stages of 10% and 30% (with respect to the piston cross-section) were studied. The selection was based on the link with the thermodynamic parameters, which were 5% and 10% of MFB, respectively. These thresholds are commonly used to determine the start and development stage of the combustion process. Gaussian fitting was used, and the full width at half maximum (FWHM) was obtained as a parameter of curvature dispersion:
FWHM = σ   ( 2 2 l n 2 )
with σ being the variance of the data. This means that the increase in FWHM is linked with more corrugate flame fronts [35]. The baseline fuel in lean conditions presents a FWHM of 9.6 at 30% flame area (Figure 4b). It is important to note that these values can be directly compared for all mixtures because the data features the same spatial resolution and similar in-cylinder fluid conditions. Caution must be taken for the quantitative comparison with other works. However, it is valuable information that describes the change in local morphology characteristics between different syngas mixtures and methane.

3. Results

3.1. Thermodynamic Analysis

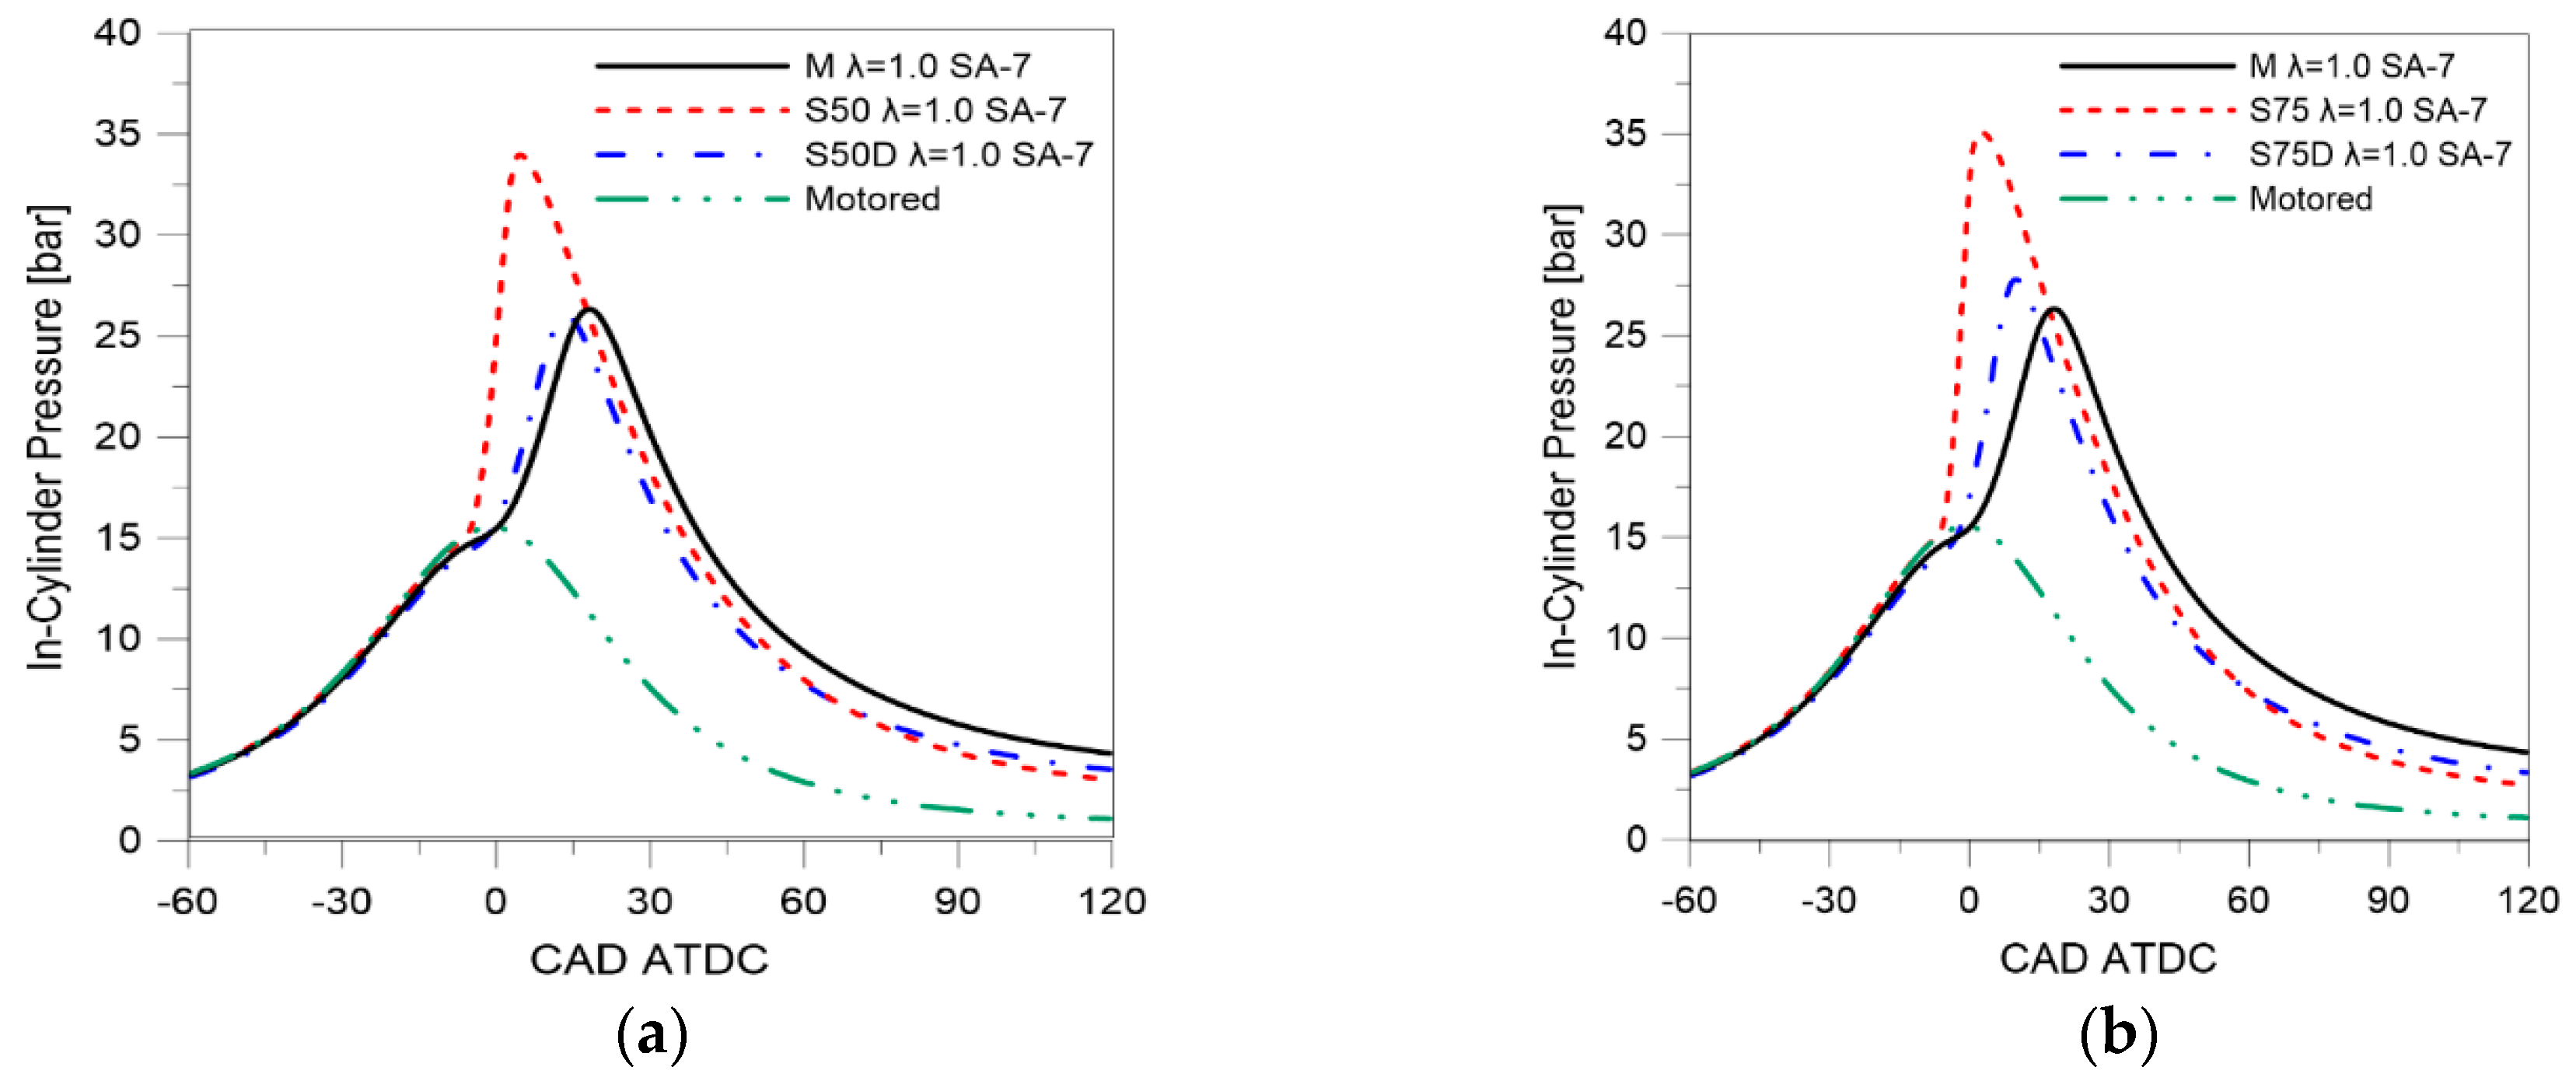
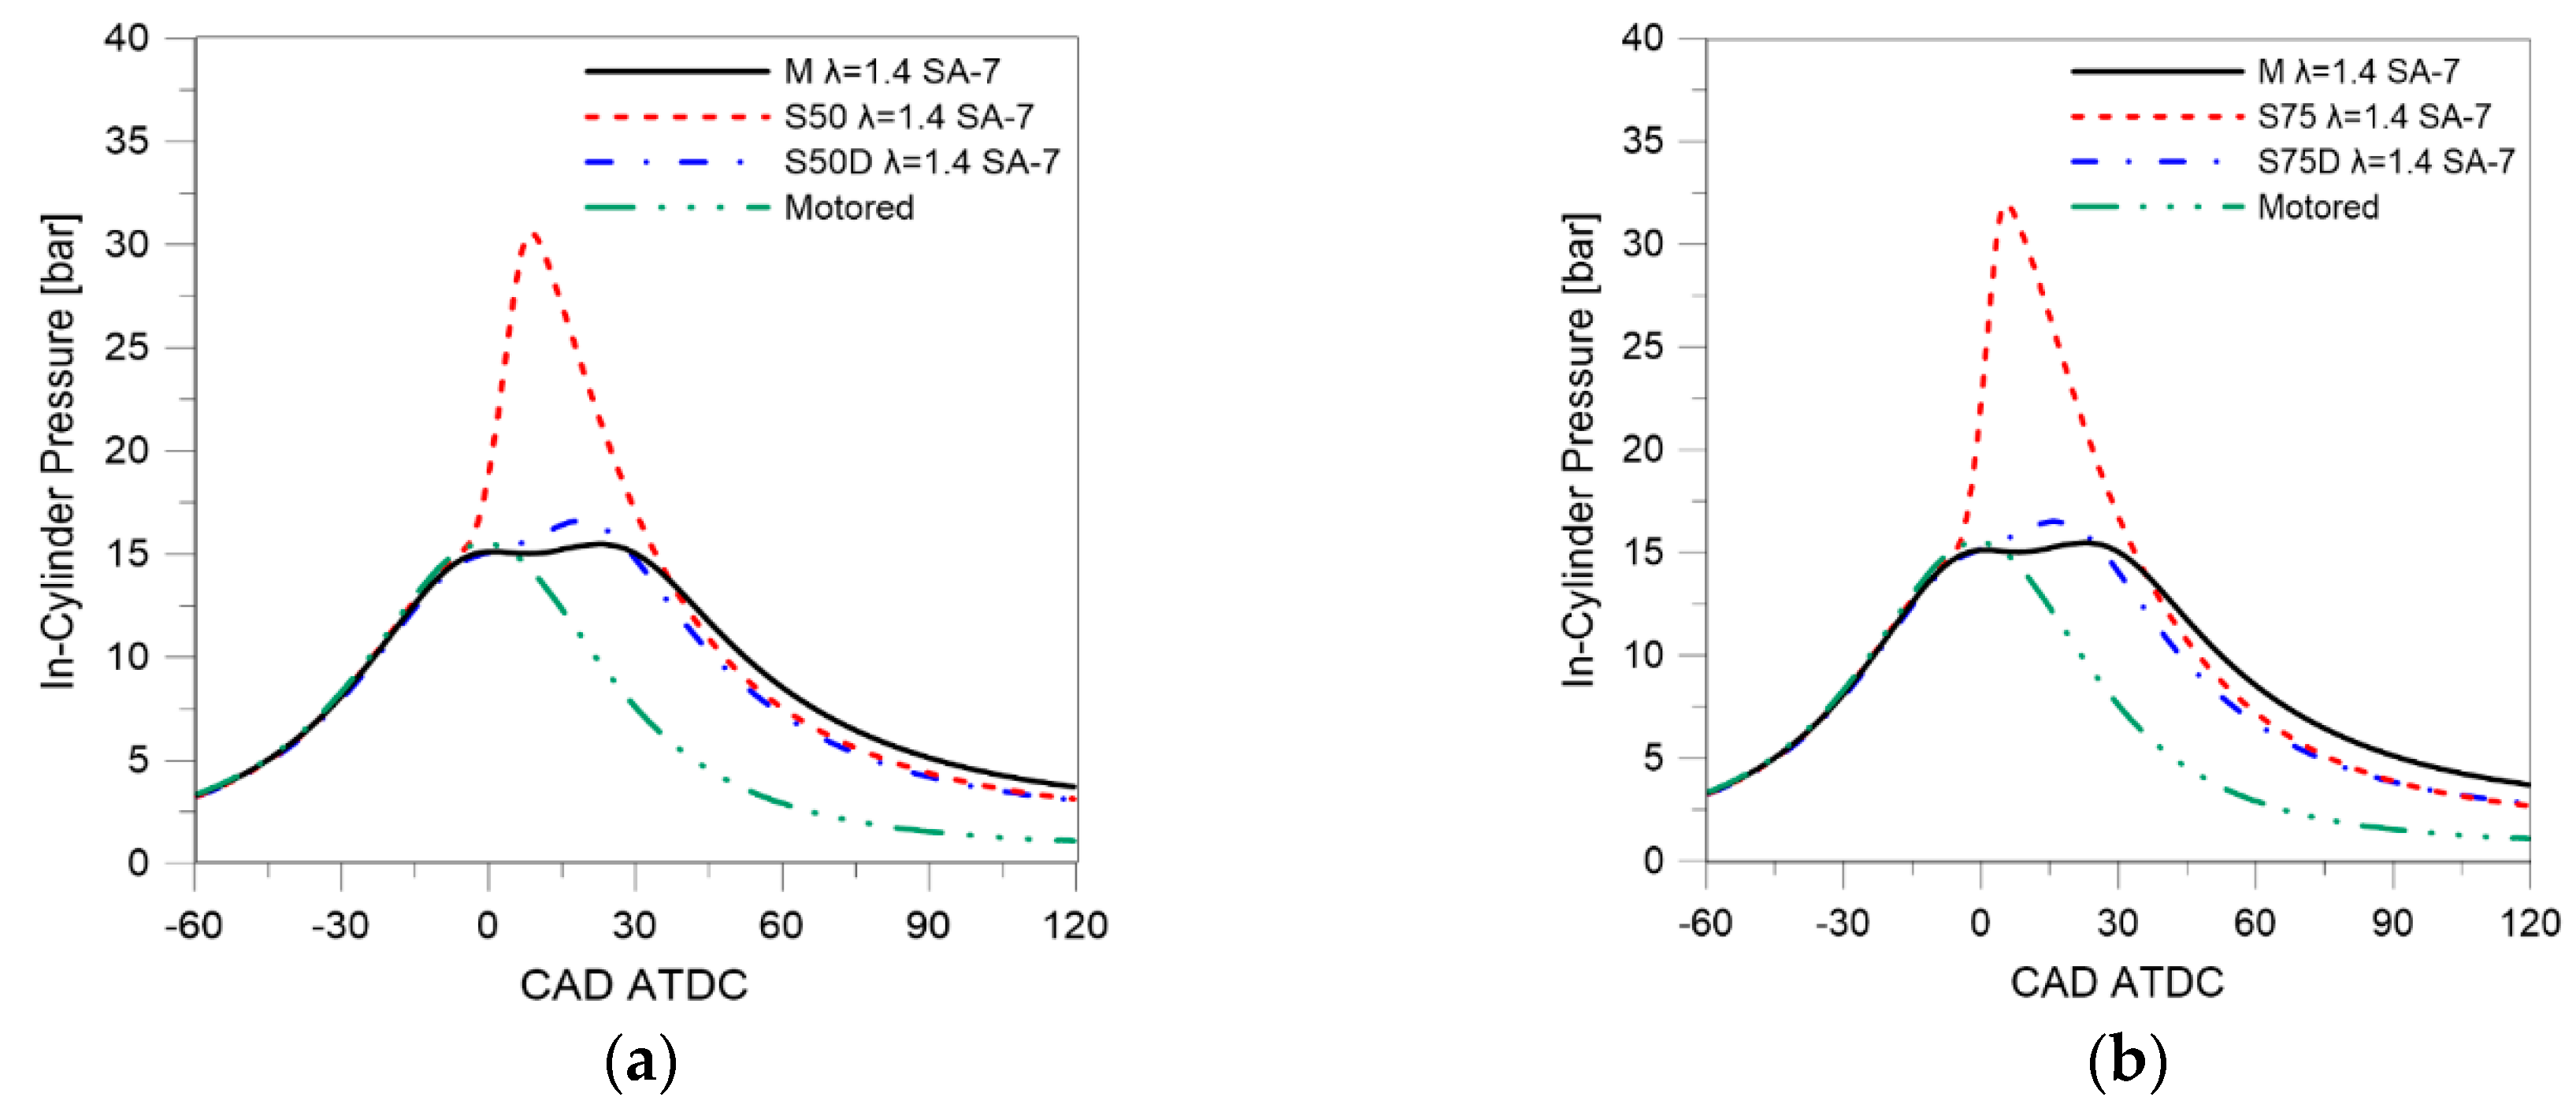
In-cylinder pressure was analyzed as the average value of 200 consecutive acquisitions for five different fuels and three air-fuel dilutions. The results for stoichiometric and the leanest air-fuel ratio are reported in Figure 5 and Figure 6, respectively. The motored pressure signal before the combustion process is depicted with dash-double-dot lines. Pure syngas shows the highest peak pressure in both H2/CO and air diluted conditions. Despite the inert gas content in real syngas mixtures, the peak pressure was higher than that of methane for all conditions. On the other hand, the pressure trace in the expansion stroke for syngas mixtures (pure and diluted) was lower compared to the baseline fuel. This behavior could be attributed to the spark timing optimization strategy, which has a strong effect on this parameter [23]. The high difference in combustion duration caused a shift of the peak pressure position to the left. In stoichiometric conditions (Figure 5) the real syngas featured a shift of around 8 CAD with respect to pure syngas (for the same H2 proportion). The influence of fuel dilution was similar for both hydrogen levels at λ = 1.0, with a reduction of around 20% in peak pressure. Air dilution exerts a strong effect on combustion behavior, with an important pressure decrease for methane and real syngas mixtures (Figure 6). The high hydrogen content in pure syngas mixtures enhanced flame propagation and resulted in a reduction of only 5 bar in the peak pressure with respect to stoichiometric conditions.
The mass fraction burned was calculated with the thermodynamic first-law procedure explained in Section 2.3. Global results of the MFB traces are detailed in Table 4, with 5%, 10%, and 50% points being representative of the initial, kernel development, and main combustion phases, respectively. The effect of hydrogen on the combustion speed is evident, greatly reducing the duration of each stage. In addition, air dilution also plays an important role, especially for fuels with lower laminar speed (see Table 3). This information is useful to have the first reference when re-calibration of the ECU is made for this type of alternative fuels.
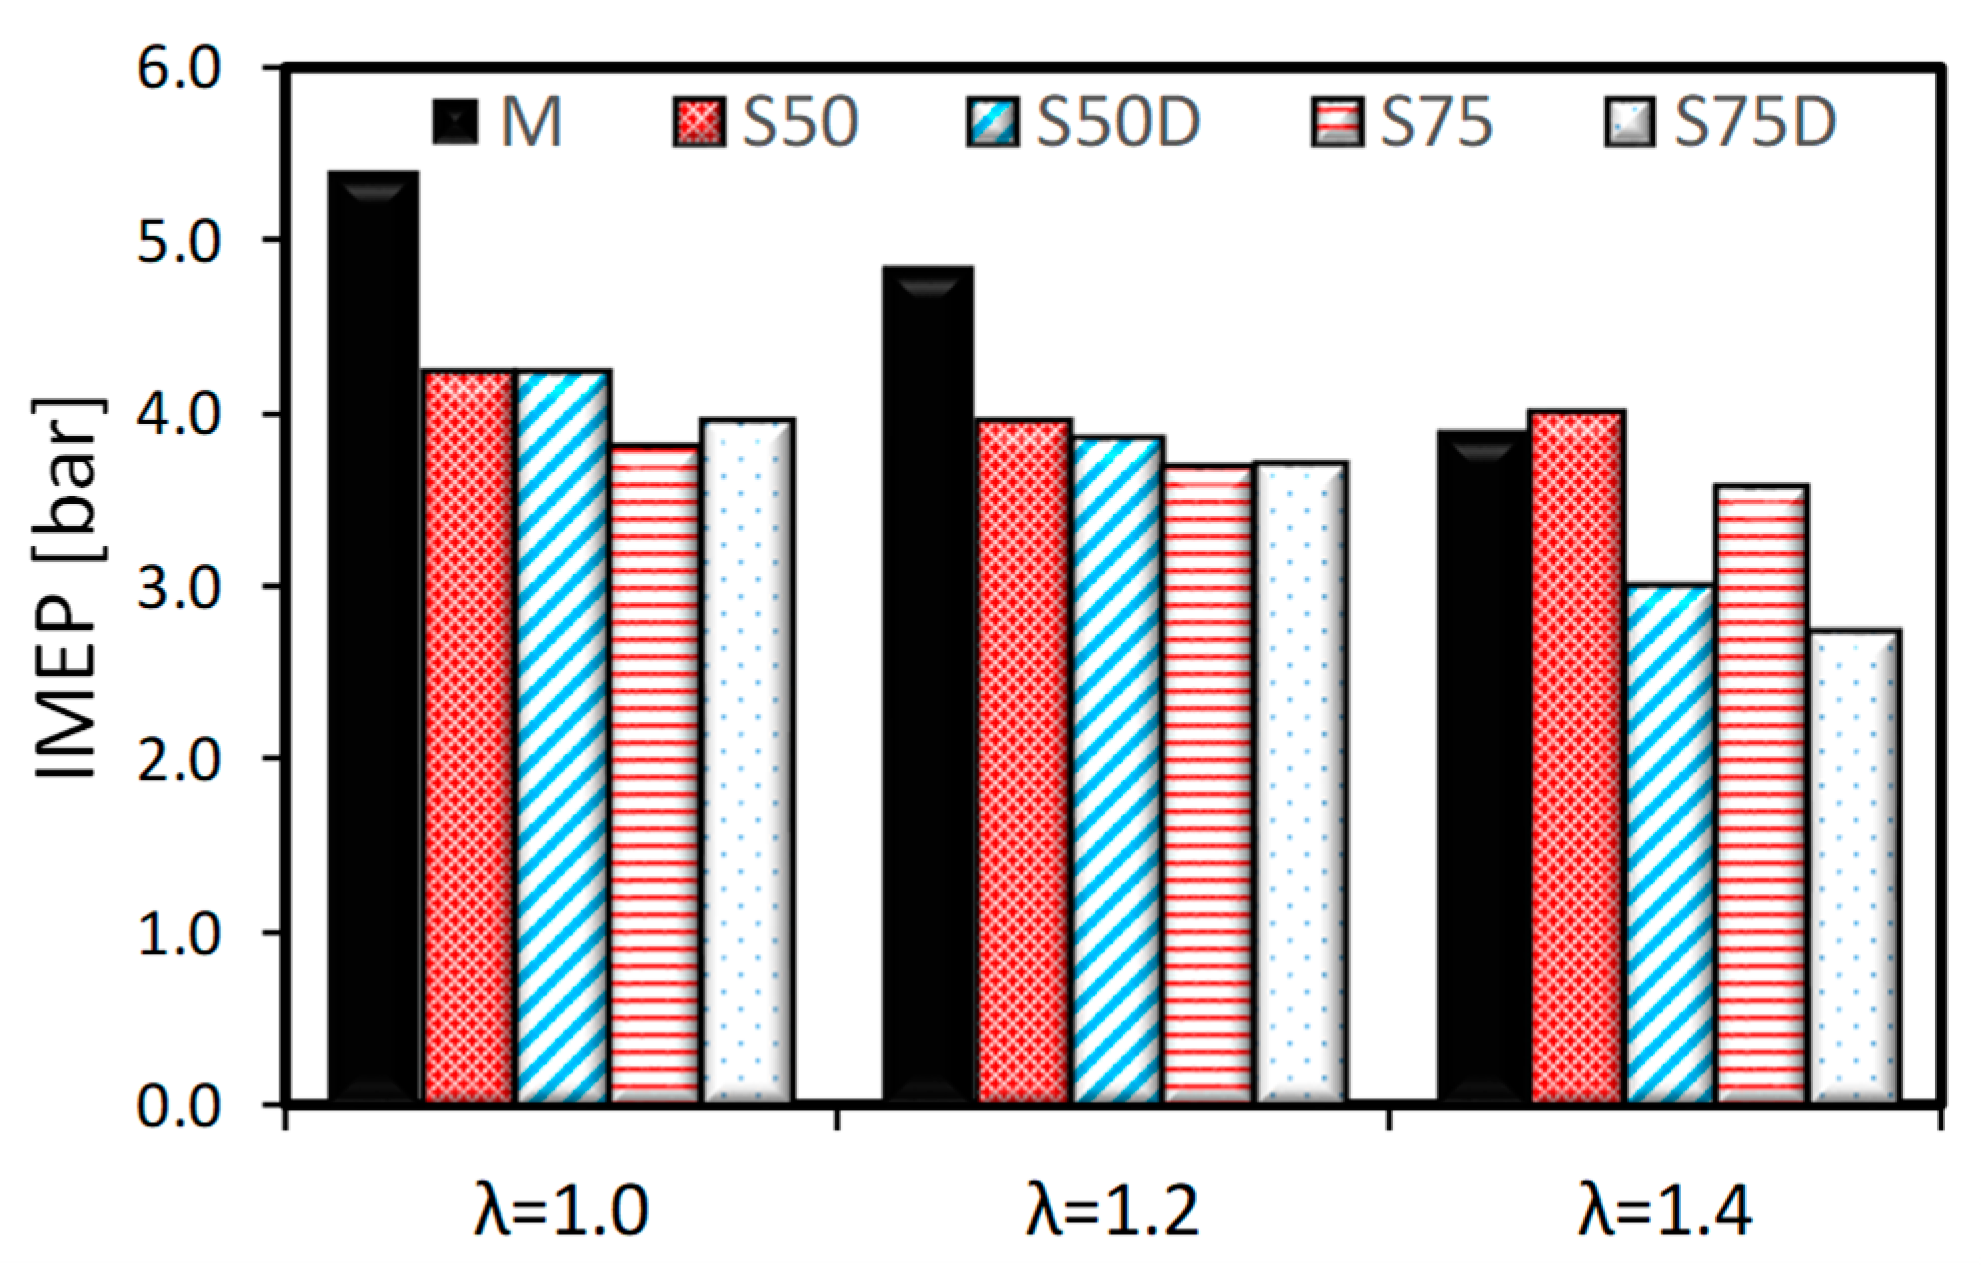
Other parameters such as IMEP, combustion stability, and fuel conversion efficiency were obtained from the analysis of pressure traces. IMEP is commonly used as a normalized parameter for power analysis. Figure 7 shows the IMEP for the five fuels and three air-fuel ratios tested. Methane featured the highest value for stoichiometric operation and intermediate lean conditions. However, for the leanest case (λ = 1.4) pure syngas with the H2/CO ratio of 50/50% IMEP was higher than the baseline. Methane showed an important increase in combustion duration and reduction of peak in-cylinder pressure. This could be explained due to the SA optimization approach, which has a strong effect in lean conditions. On the other hand, the fixed spark advance seems to be better suited for pure syngas mixtures. Practically, the stoichiometric and the lean mixture feature the same IMEP, and thus the same power output.
An important decrease in IMEP was recorded for diluted syngas only at λ = 1.4, mainly due to a combined effect of fuel and air dilution. At this point the losses in volumetric efficiency are high. When comparing the H2 content, it can be seen that the 50% H2 blend has higher power output than the 75% H2 one under the tested conditions. This behavior could be associated with the effect of advanced spark timing and lower volumetric efficiency due to the reduced density of hydrogen. In spite of the fact that the main objective of the test did not include measuring the performance of the fuels, the results suggest that re-calibration of the ECU needs to be performed when considering such a fuel type change and other air management and injection strategy need to be applied. Also, other interesting options to be considered are turbocharging and direct injection system. These could improve the volumetric efficiency in high dilution conditions such as S50D and S75D at λ ≤ 1.4.
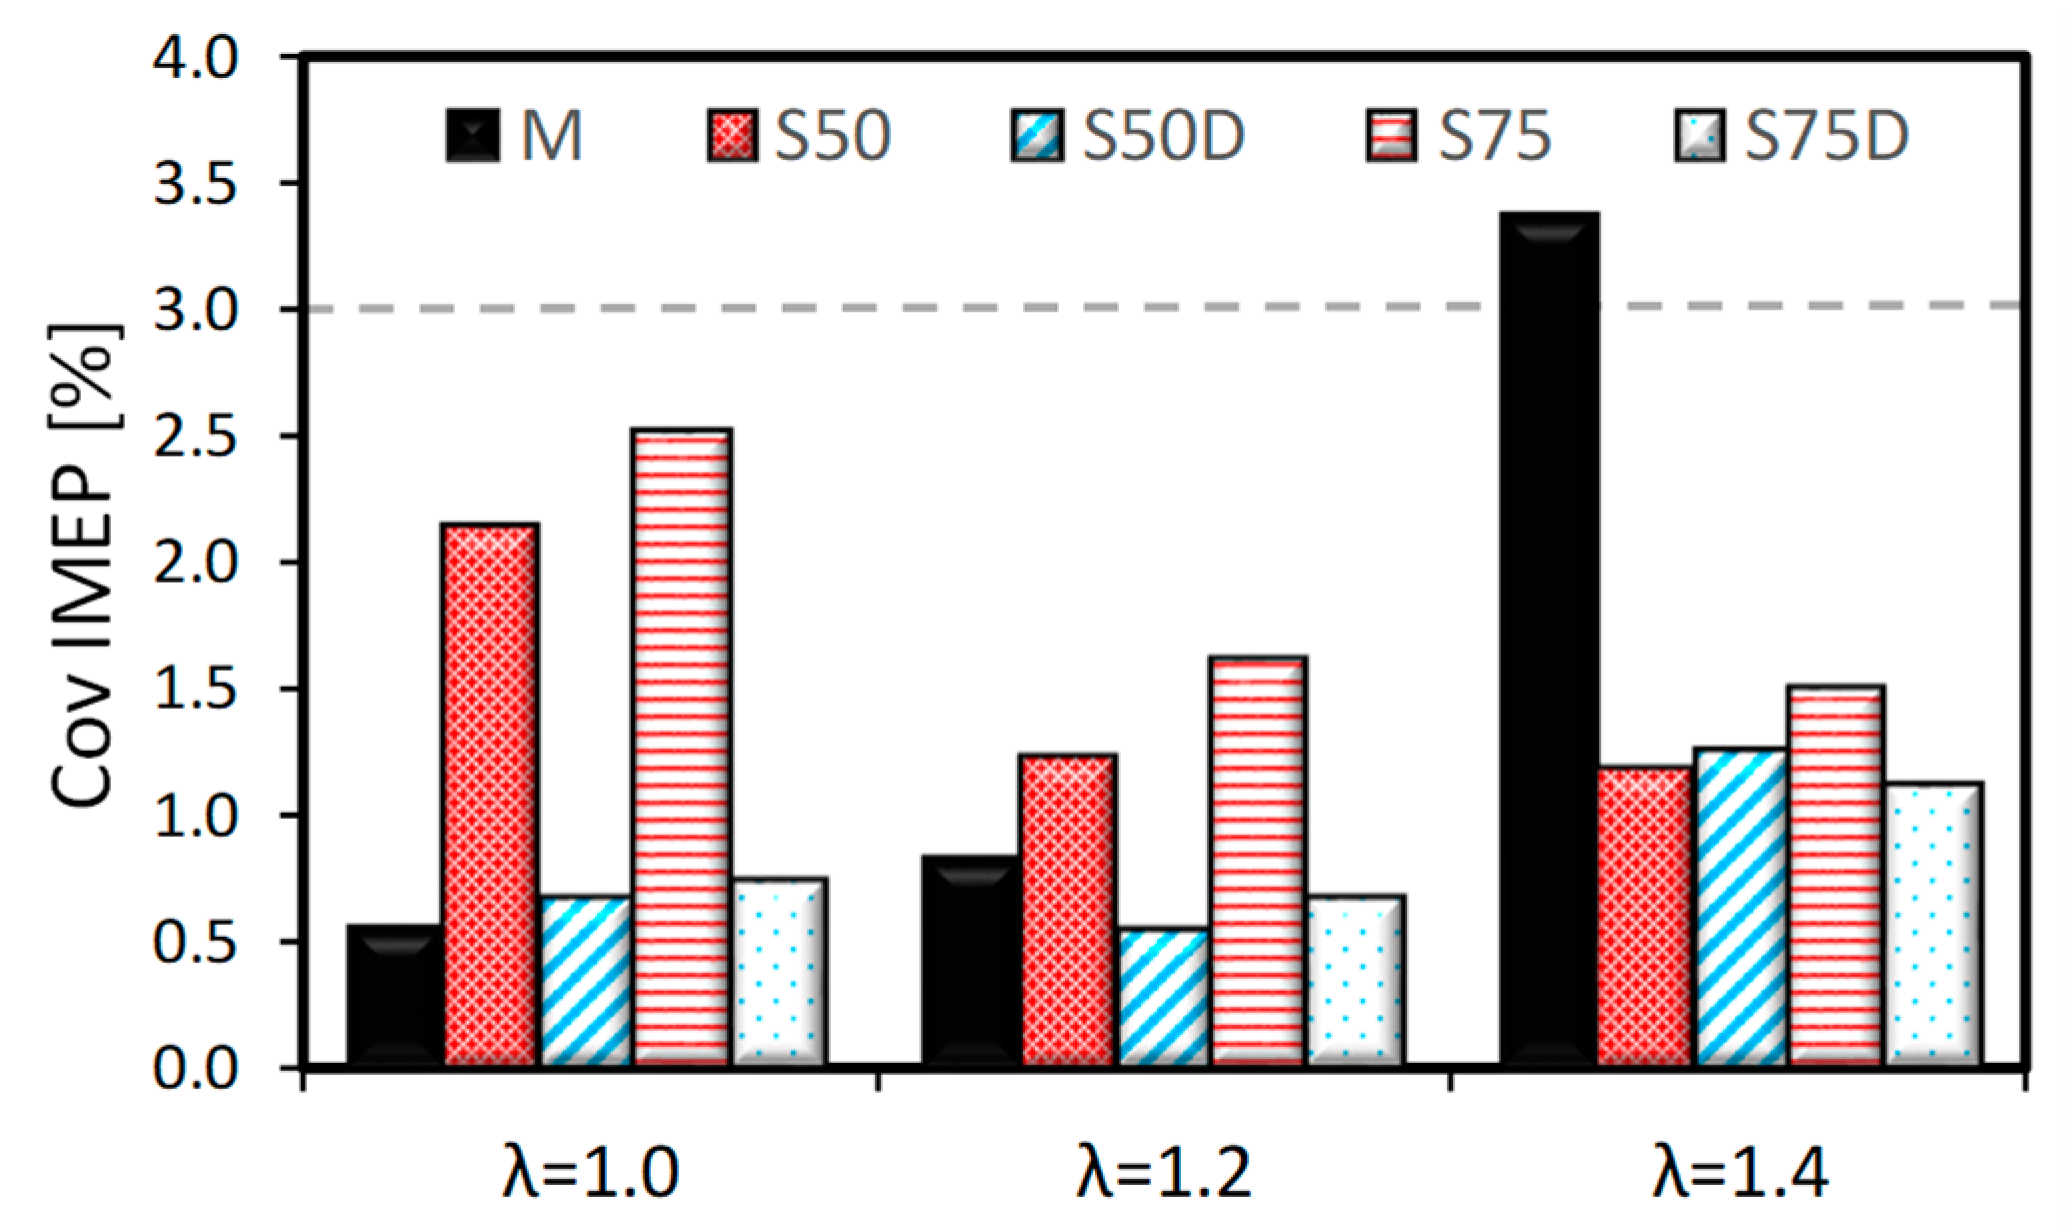
The stable operation of an internal combustion engine is one of the most important parameters, and it is a critical task when alternative gaseous fuels, derived from biomass waste, are applied [30]. In this work, it was quantified with the COVIMEP (Figure 8) and a limit below 3% was taken as a reference of stable combustion processes [36]. Pure and diluted syngas show excellent behavior in extreme lean conditions as well. The lack of spark timing optimization affected pure fuel more than the real one. Methane at λ = 1.4 presents values over the stability limit. This suggests the advantage of using hydrogen as an additive to control the combustion process in SI-ICE.
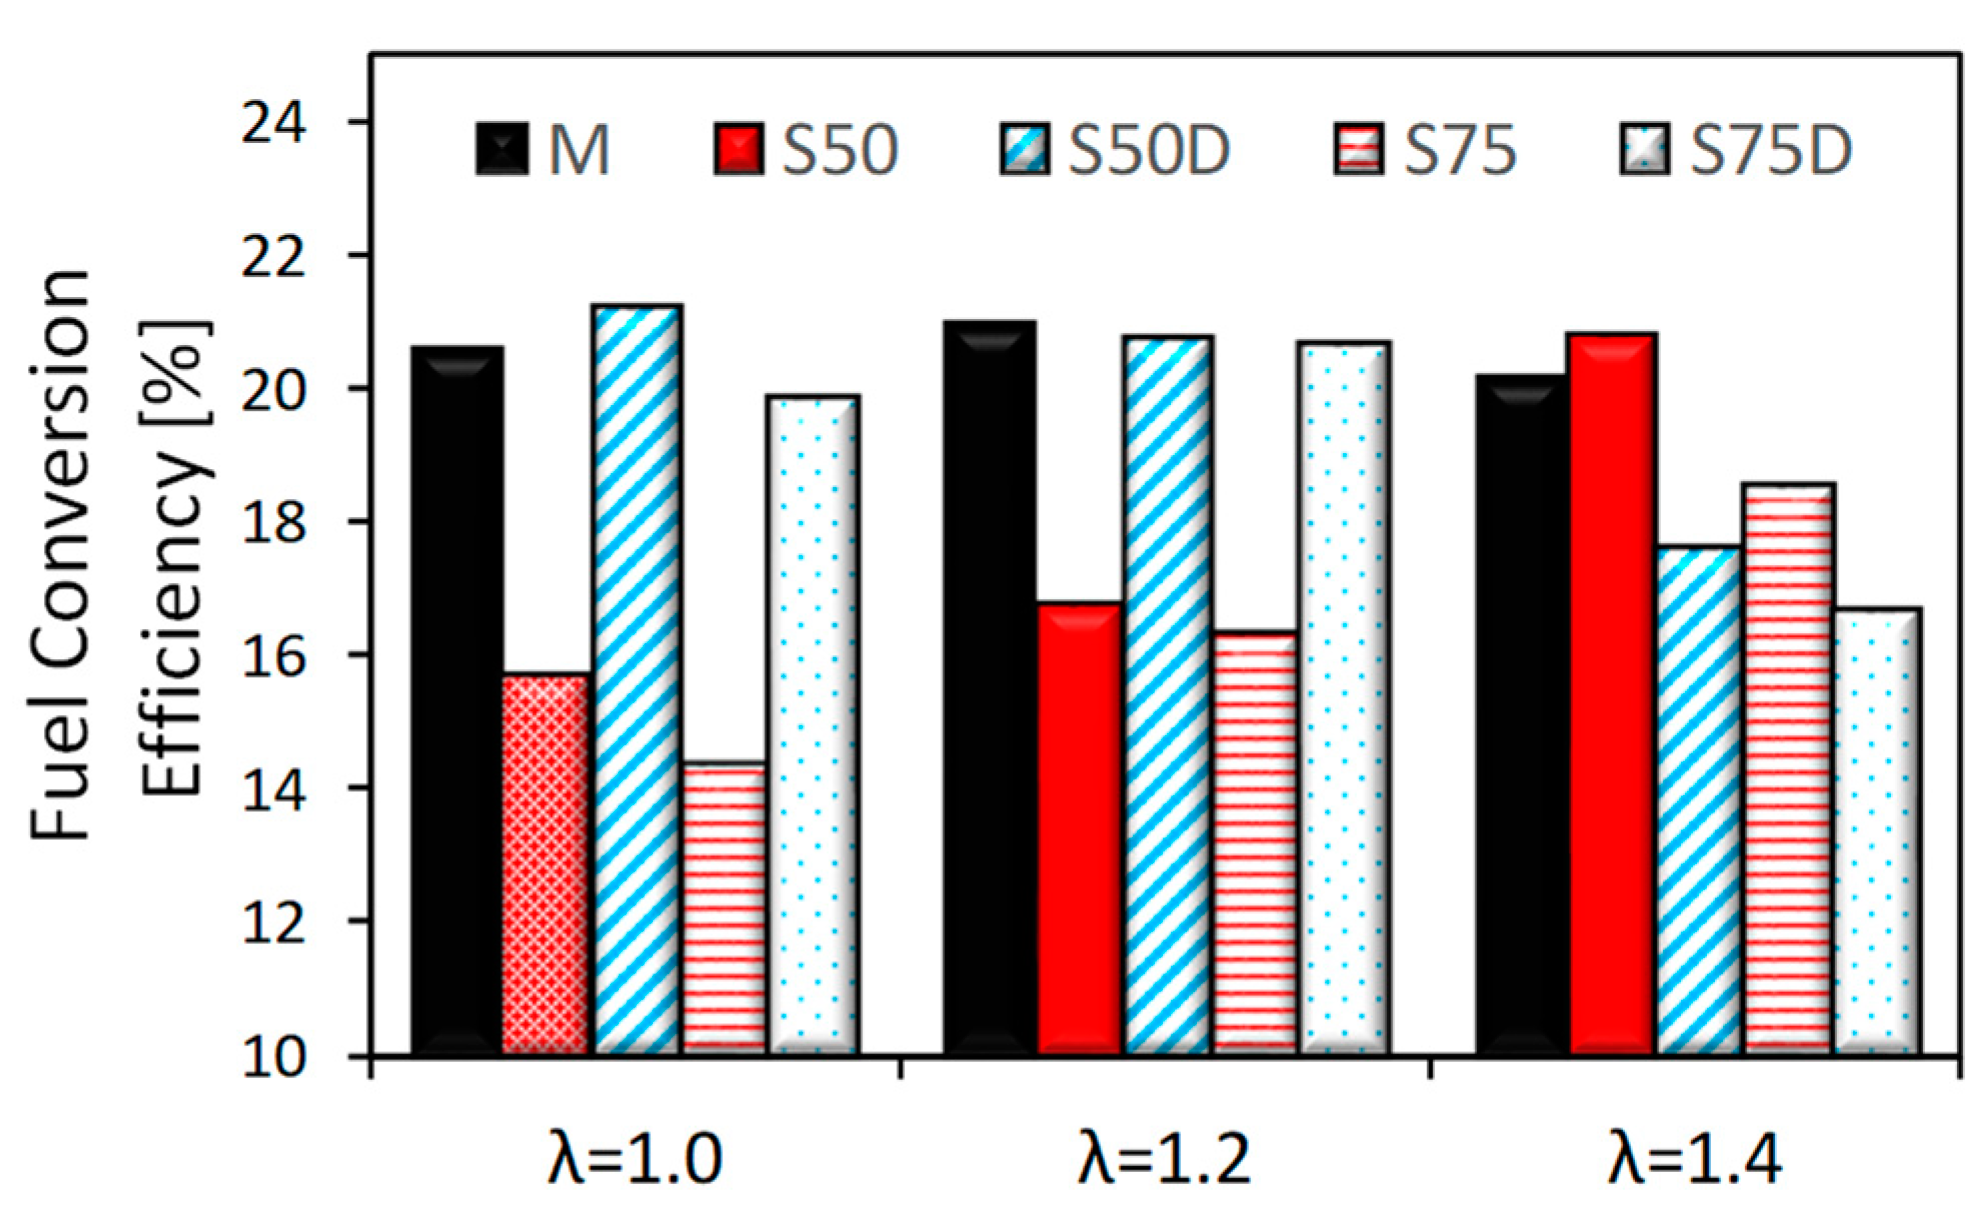
Fuel conversion efficiency is depicted in Figure 9. It was calculated as defined by Heywood [30], i.e., the ratio of the work produced per cycle ( W c ) to the amount of fuel energy supplied per cycle that can be released in the combustion process:
n f = W c m f L H V = I M E P   V d m f L H V
Cyclic work was calculated based on in-cylinder pressure measurements, and the energy supplied was estimated by the fuel mass multiplied by the lower heating value (LHV) of the fuel (see Table 3). The baseline fuel shows values of around 20% for all the air dilution tested. However, pure syngas presents an improvement when λ is higher. This is mainly due to the spark timing configuration, which is better for lean mixtures of these gases (S50 and S75). On the other hand, real syngas mixtures exhibit a decrease with air dilution for both hydrogen content. The losses in volumetric efficiency have greater penalties for these fuels (S50D, S75D) as was explained in the IMEP analysis. The highest efficiency values were seen for real syngas mixtures at λ = 1.0 (21.5%). It is important to note that the low-efficiency values are common in optical research engines due to the increased top land volume and high blow-by losses [37].
The last set of parameters analyzed in this section are the exhaust emissions, which were measured with a Multigas 2030 spectrometer analyzer. Table 5 shows pollutant emission (CO, NOx, and CH4) for λ = 1.4. Only this condition was considered for the sake of brevity of the manuscript and because it is the most common condition in energy production applications. From the table, it can be seen that the concentration of CO at the exhaust increases with that in the intake manifold (due to fuel content). The high top-land region volume and low fuel conversion efficiency that was seen in the previous graph are the main reasons for this behavior. Similar behavior was seen during the methane combustion process with high concentration of CH4 at the exhaust. Despite the fact that real syngas features lower CO percentages in the fuel than the corresponding pure blends, more unburned fuel was found in the exhaust line. In this case, the drop-in fuel conversion efficiency is the main explanation (see Figure 9).
NOx emissions are one of the most important aspects considered by the regulations, due to the direct impact on local air pollution. Moreover, it is also one of the most controlled gases when hydrogen is used in combustion because of the tendency to increase the temperatures in the combustion chamber (see Table 3). NO2 and NO generation during the combustion process is strongly correlated with in-cylinder temperature [38]. Therefore, roughly the same trend as that shown in Figure 6 (high peak pressure correlates with high burned gas temperature) can be appreciated in the measurements of NOx concentrations.

3.2. Optical Investigations

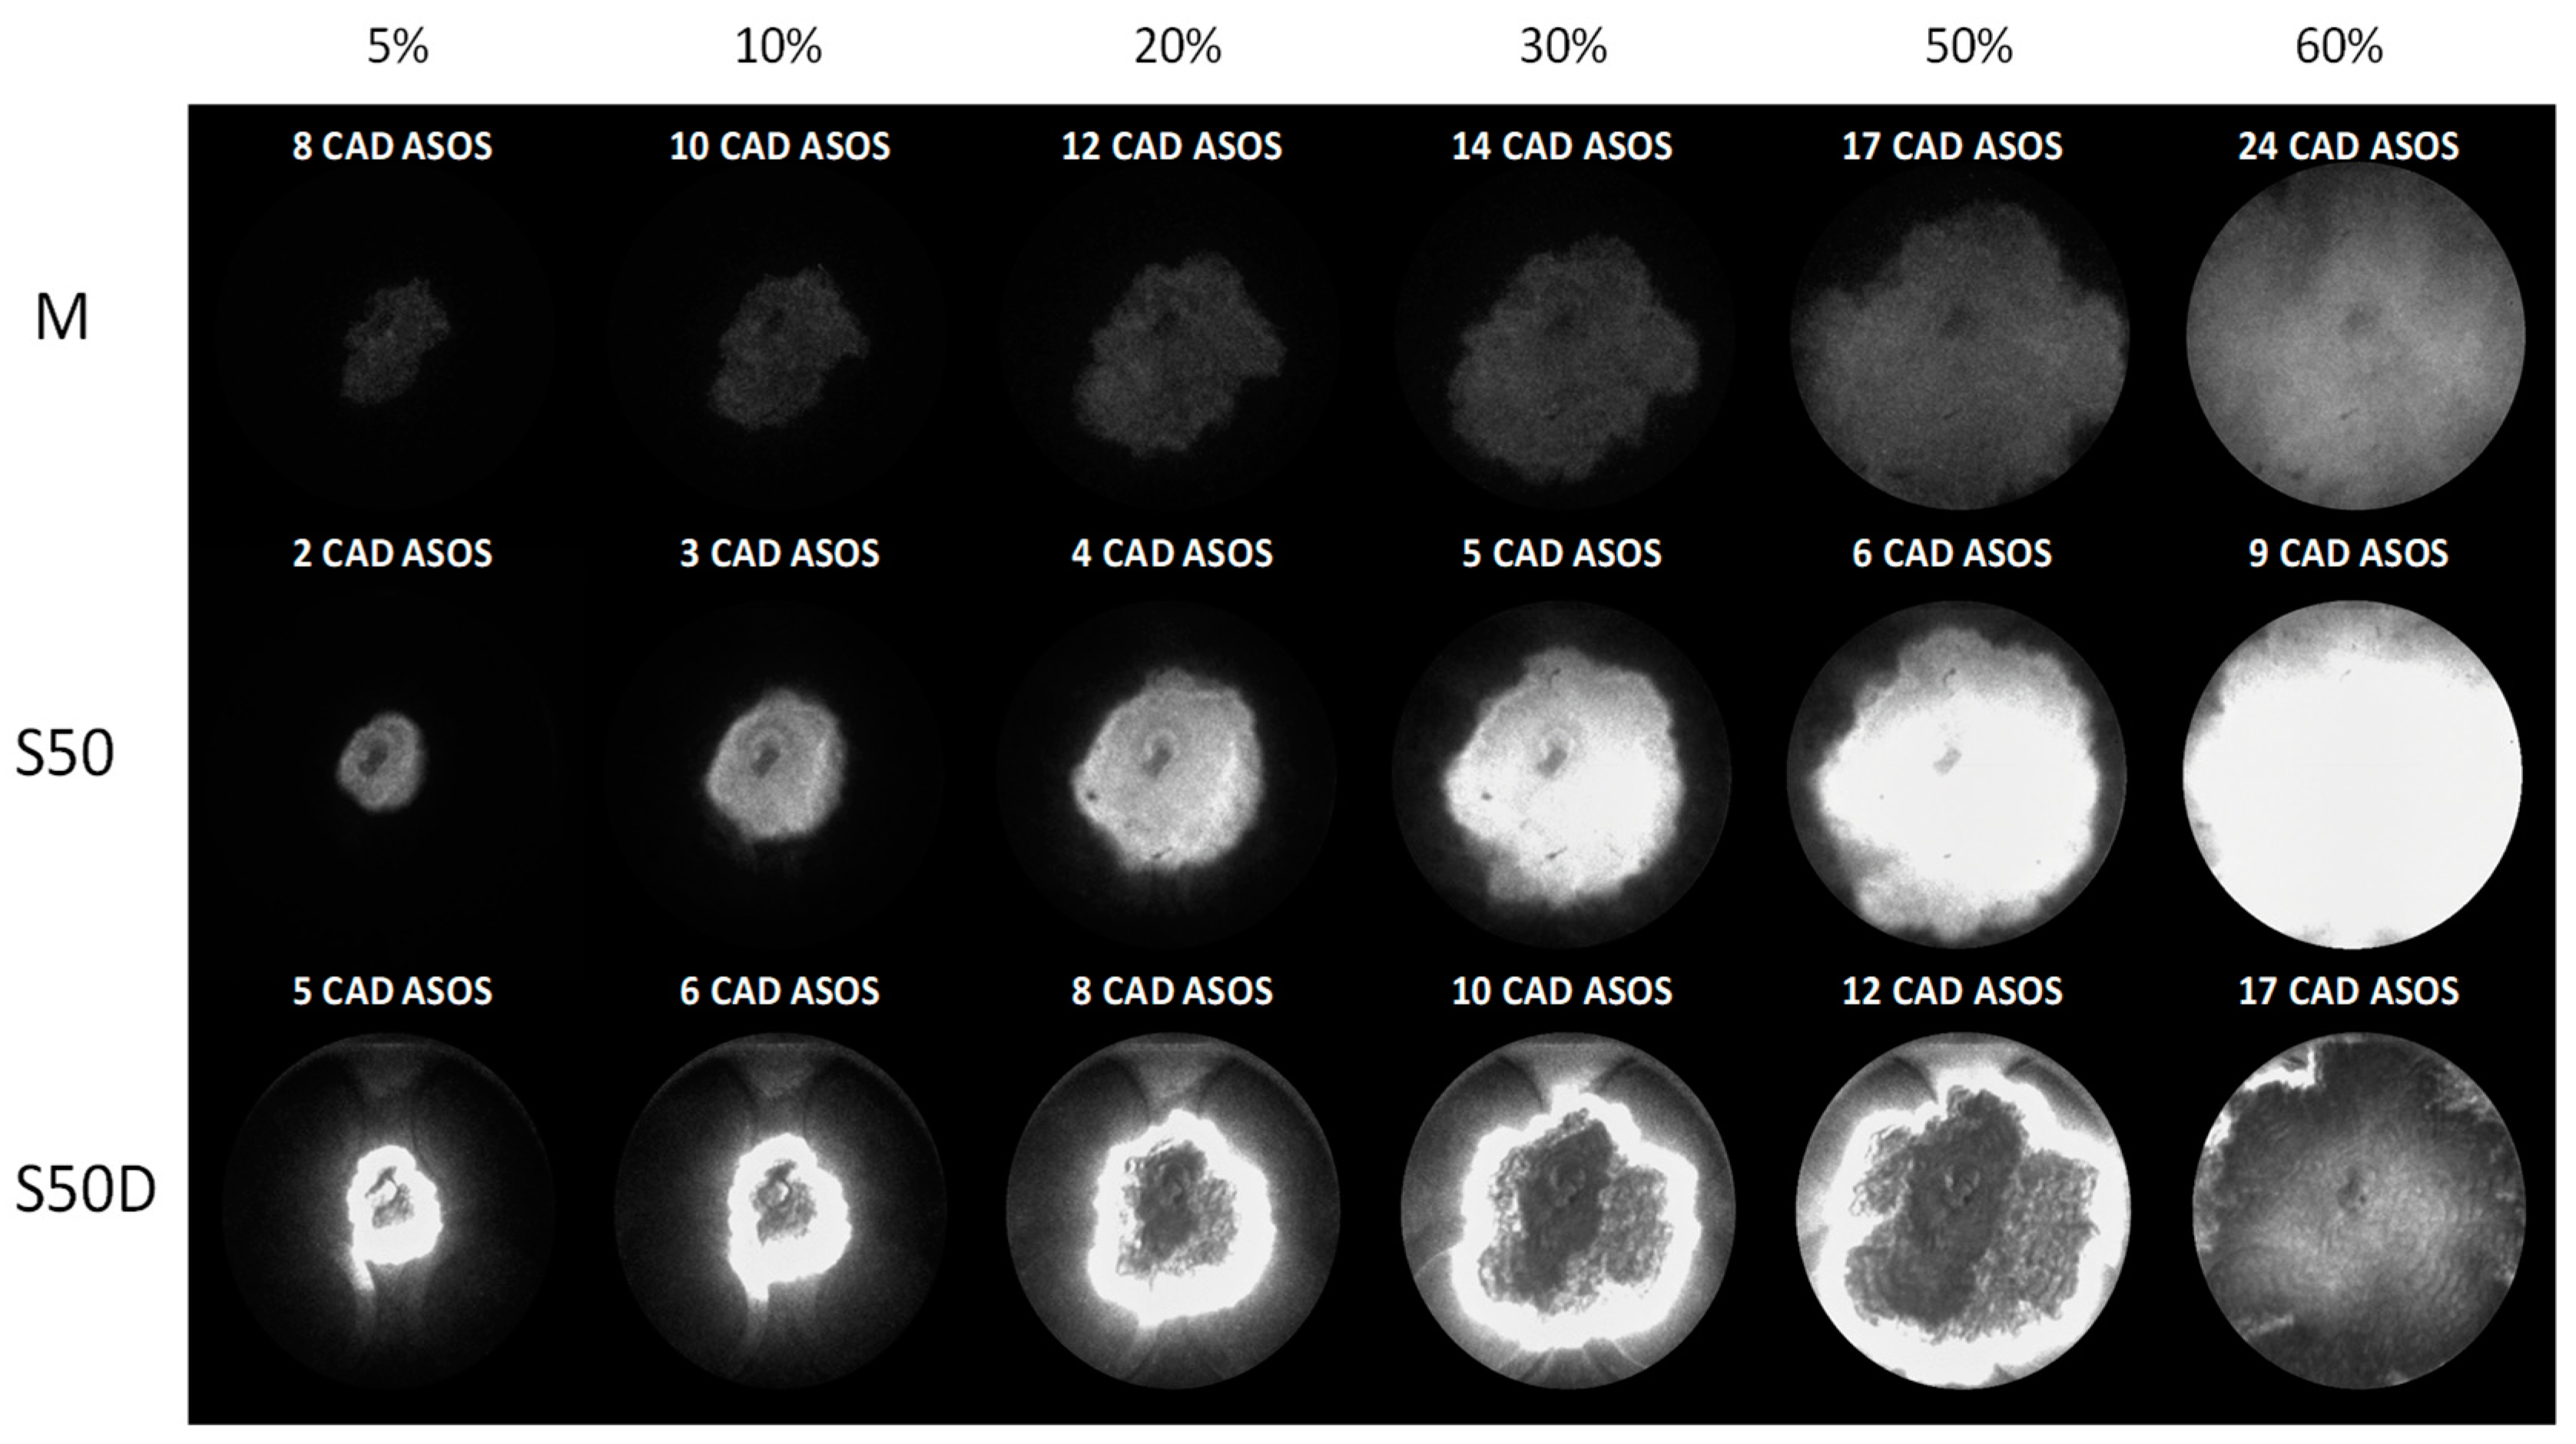
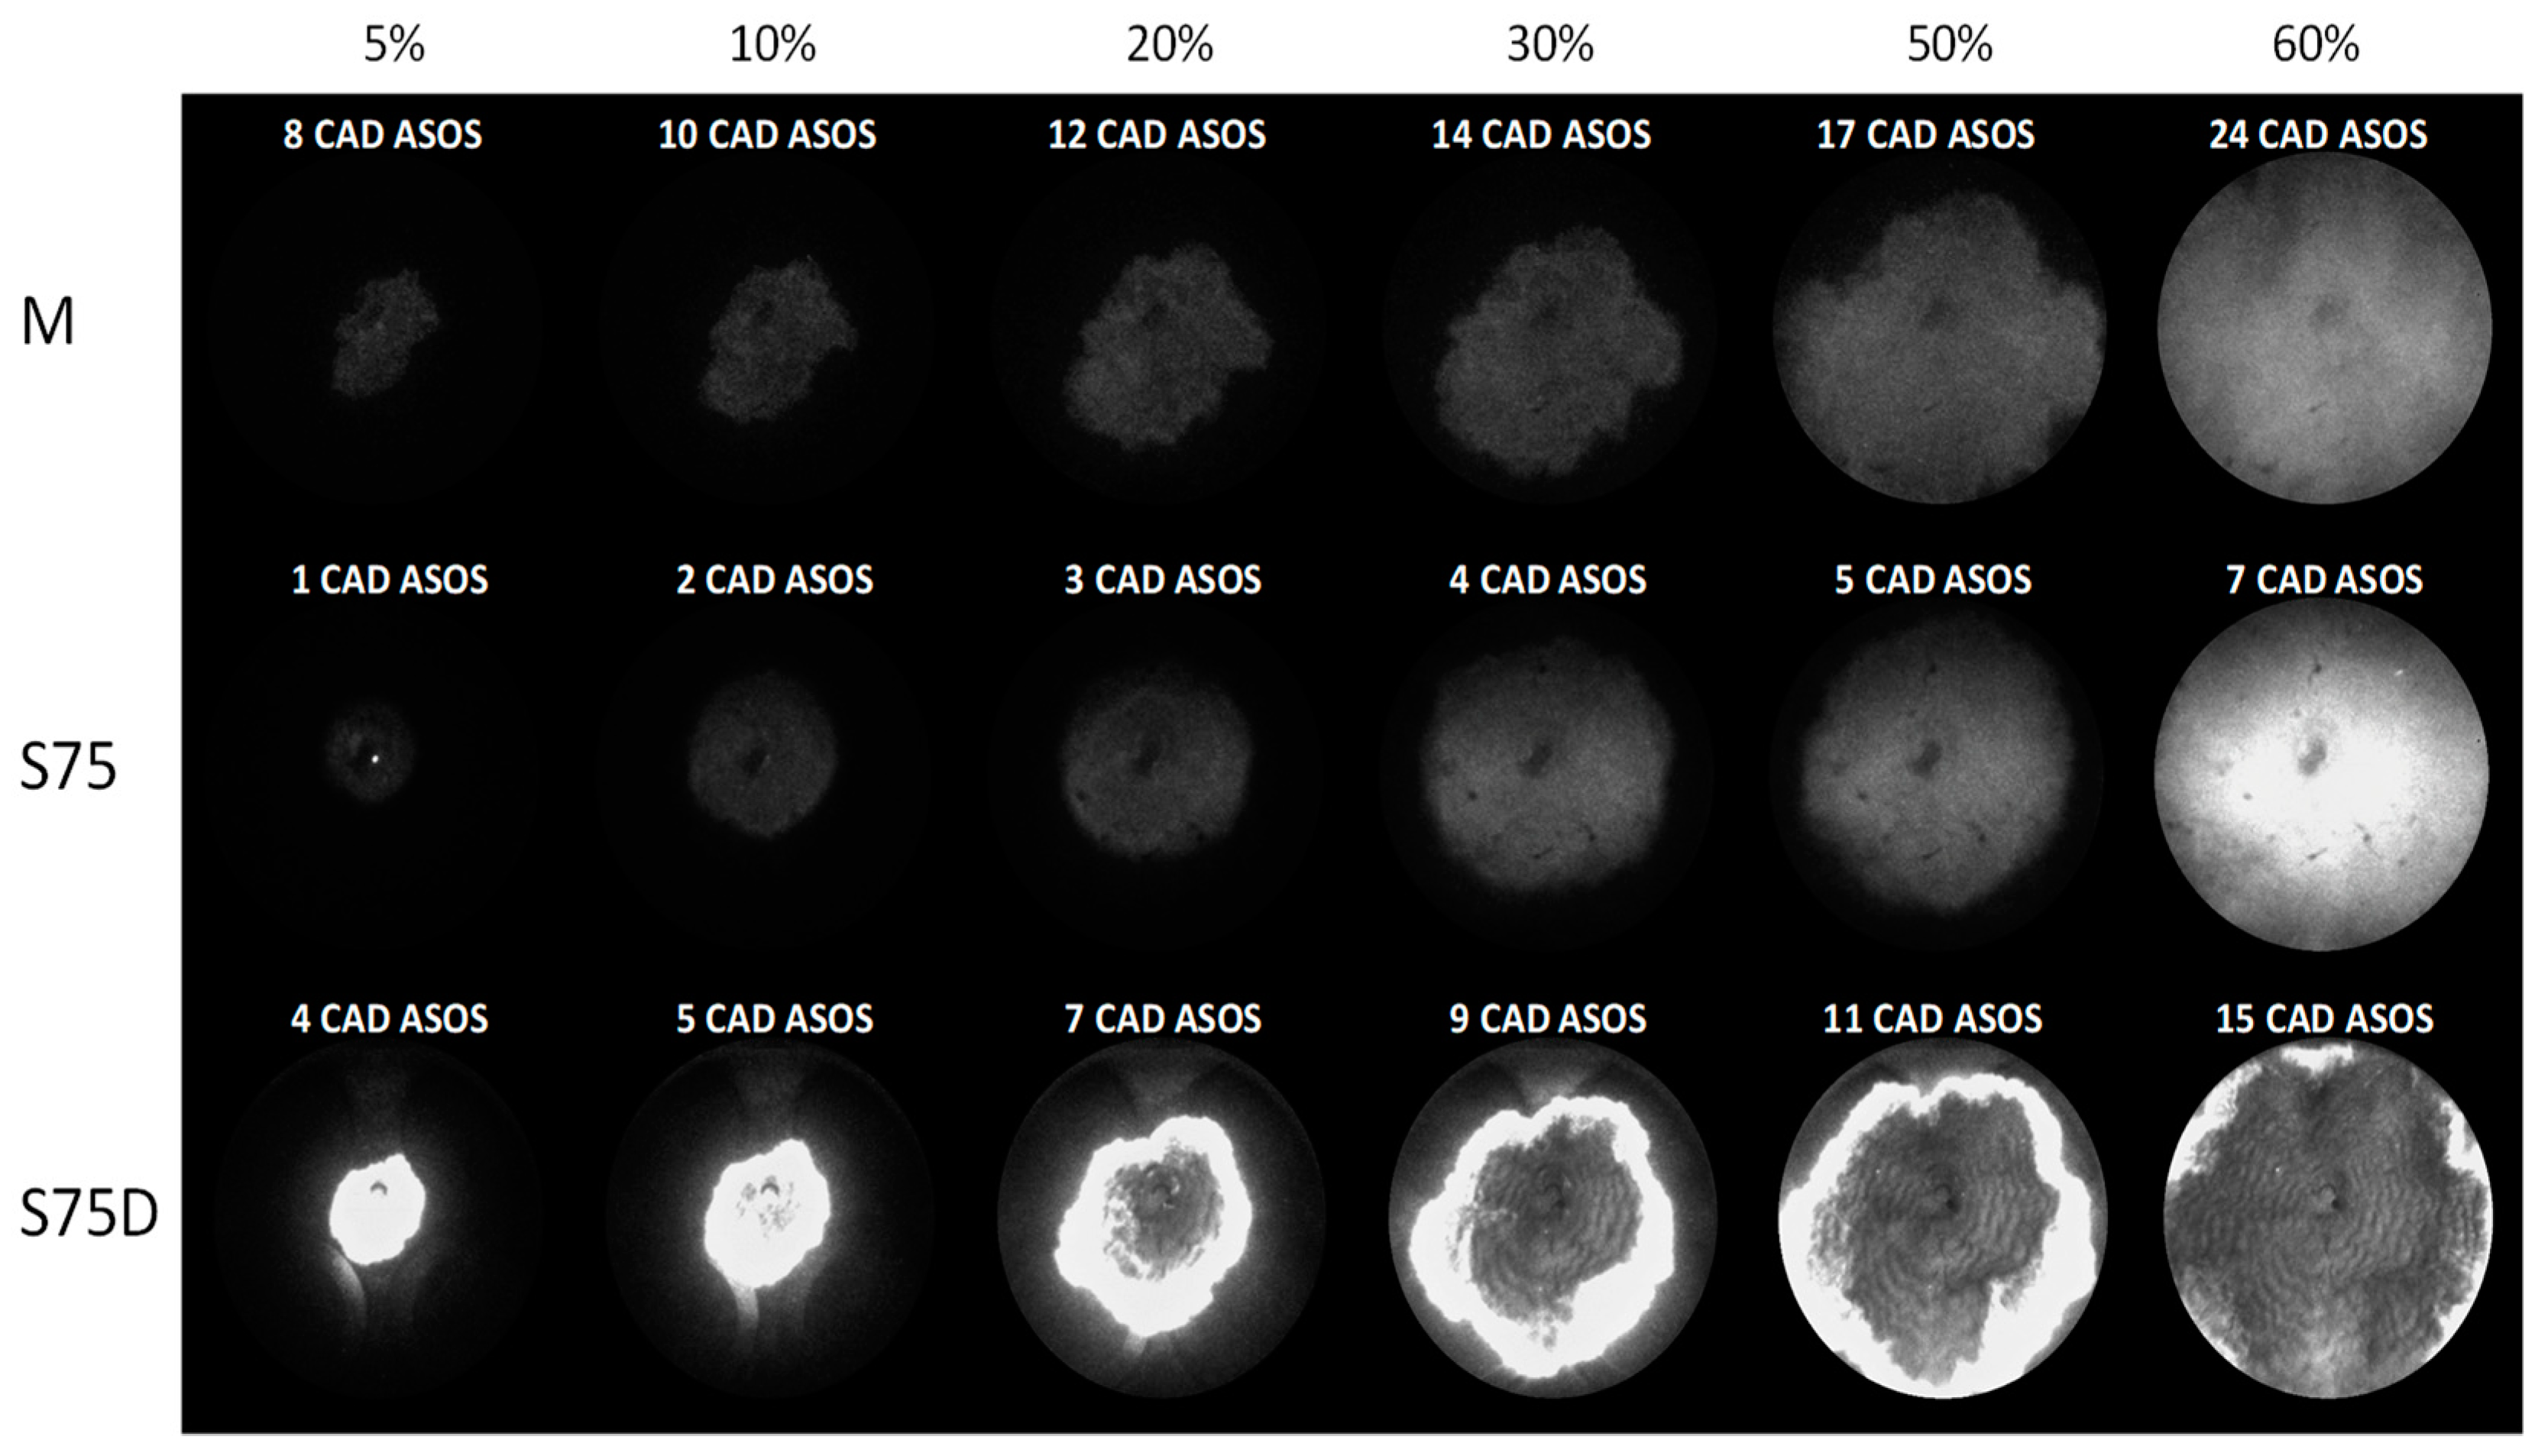
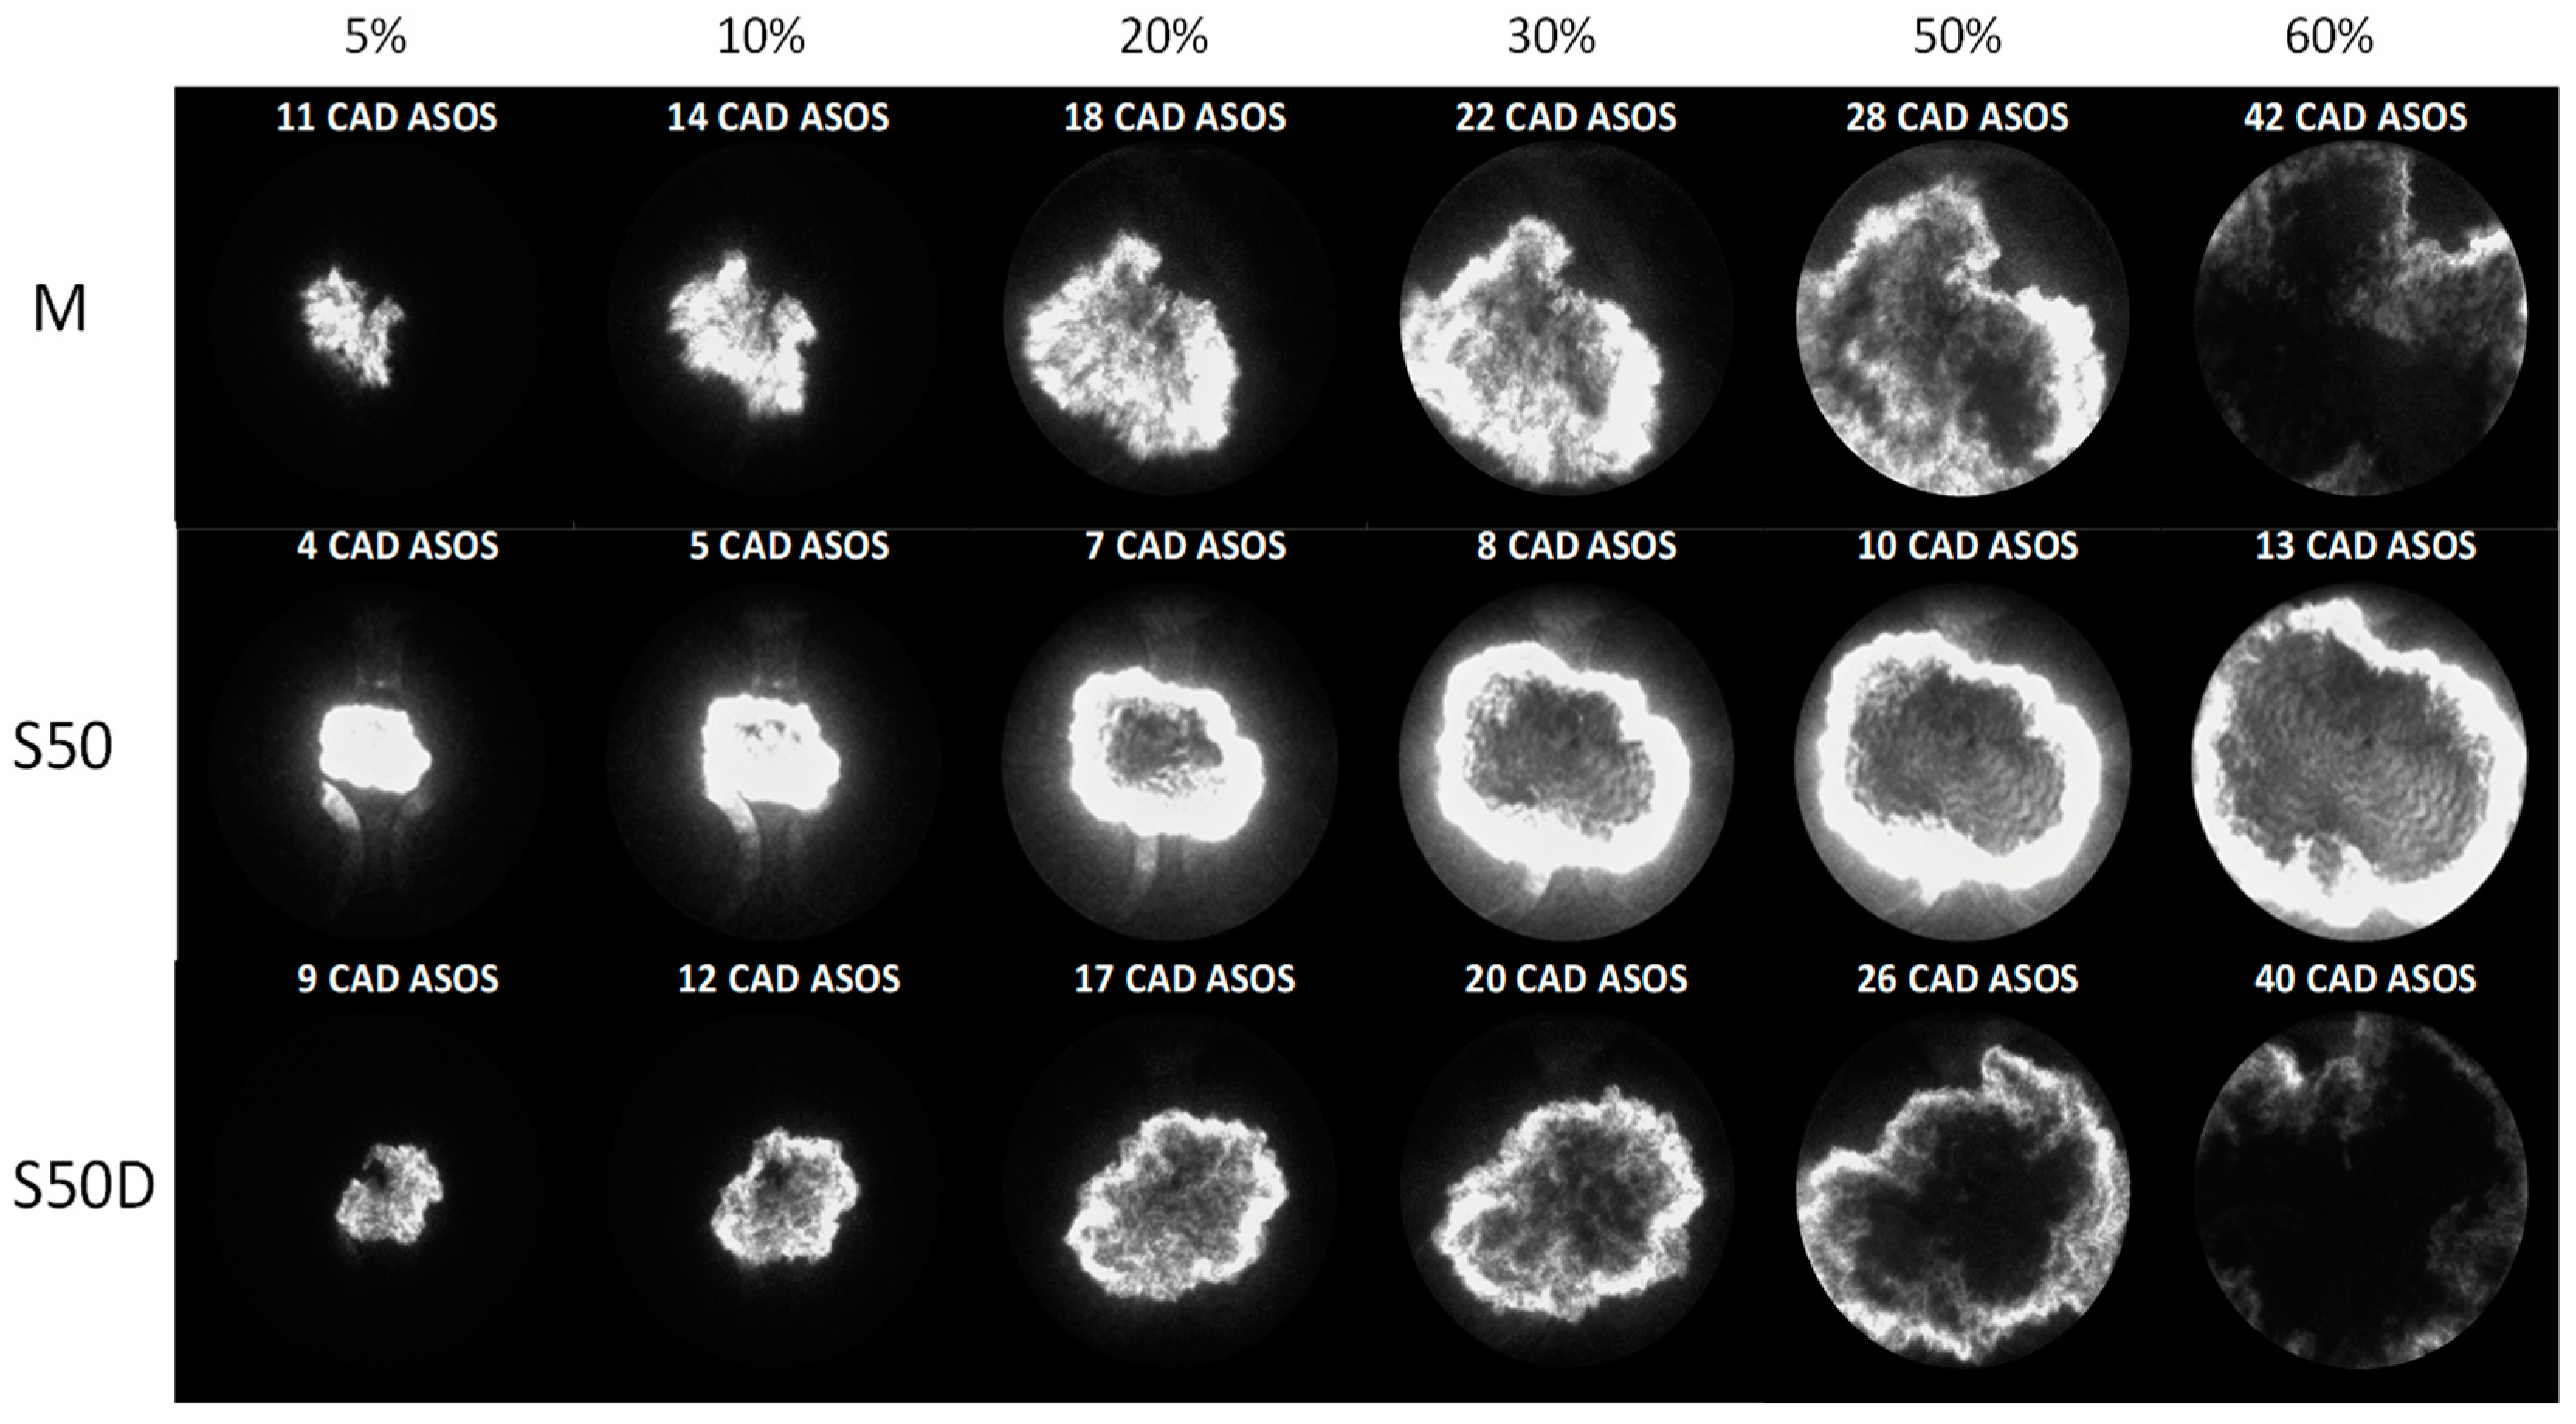
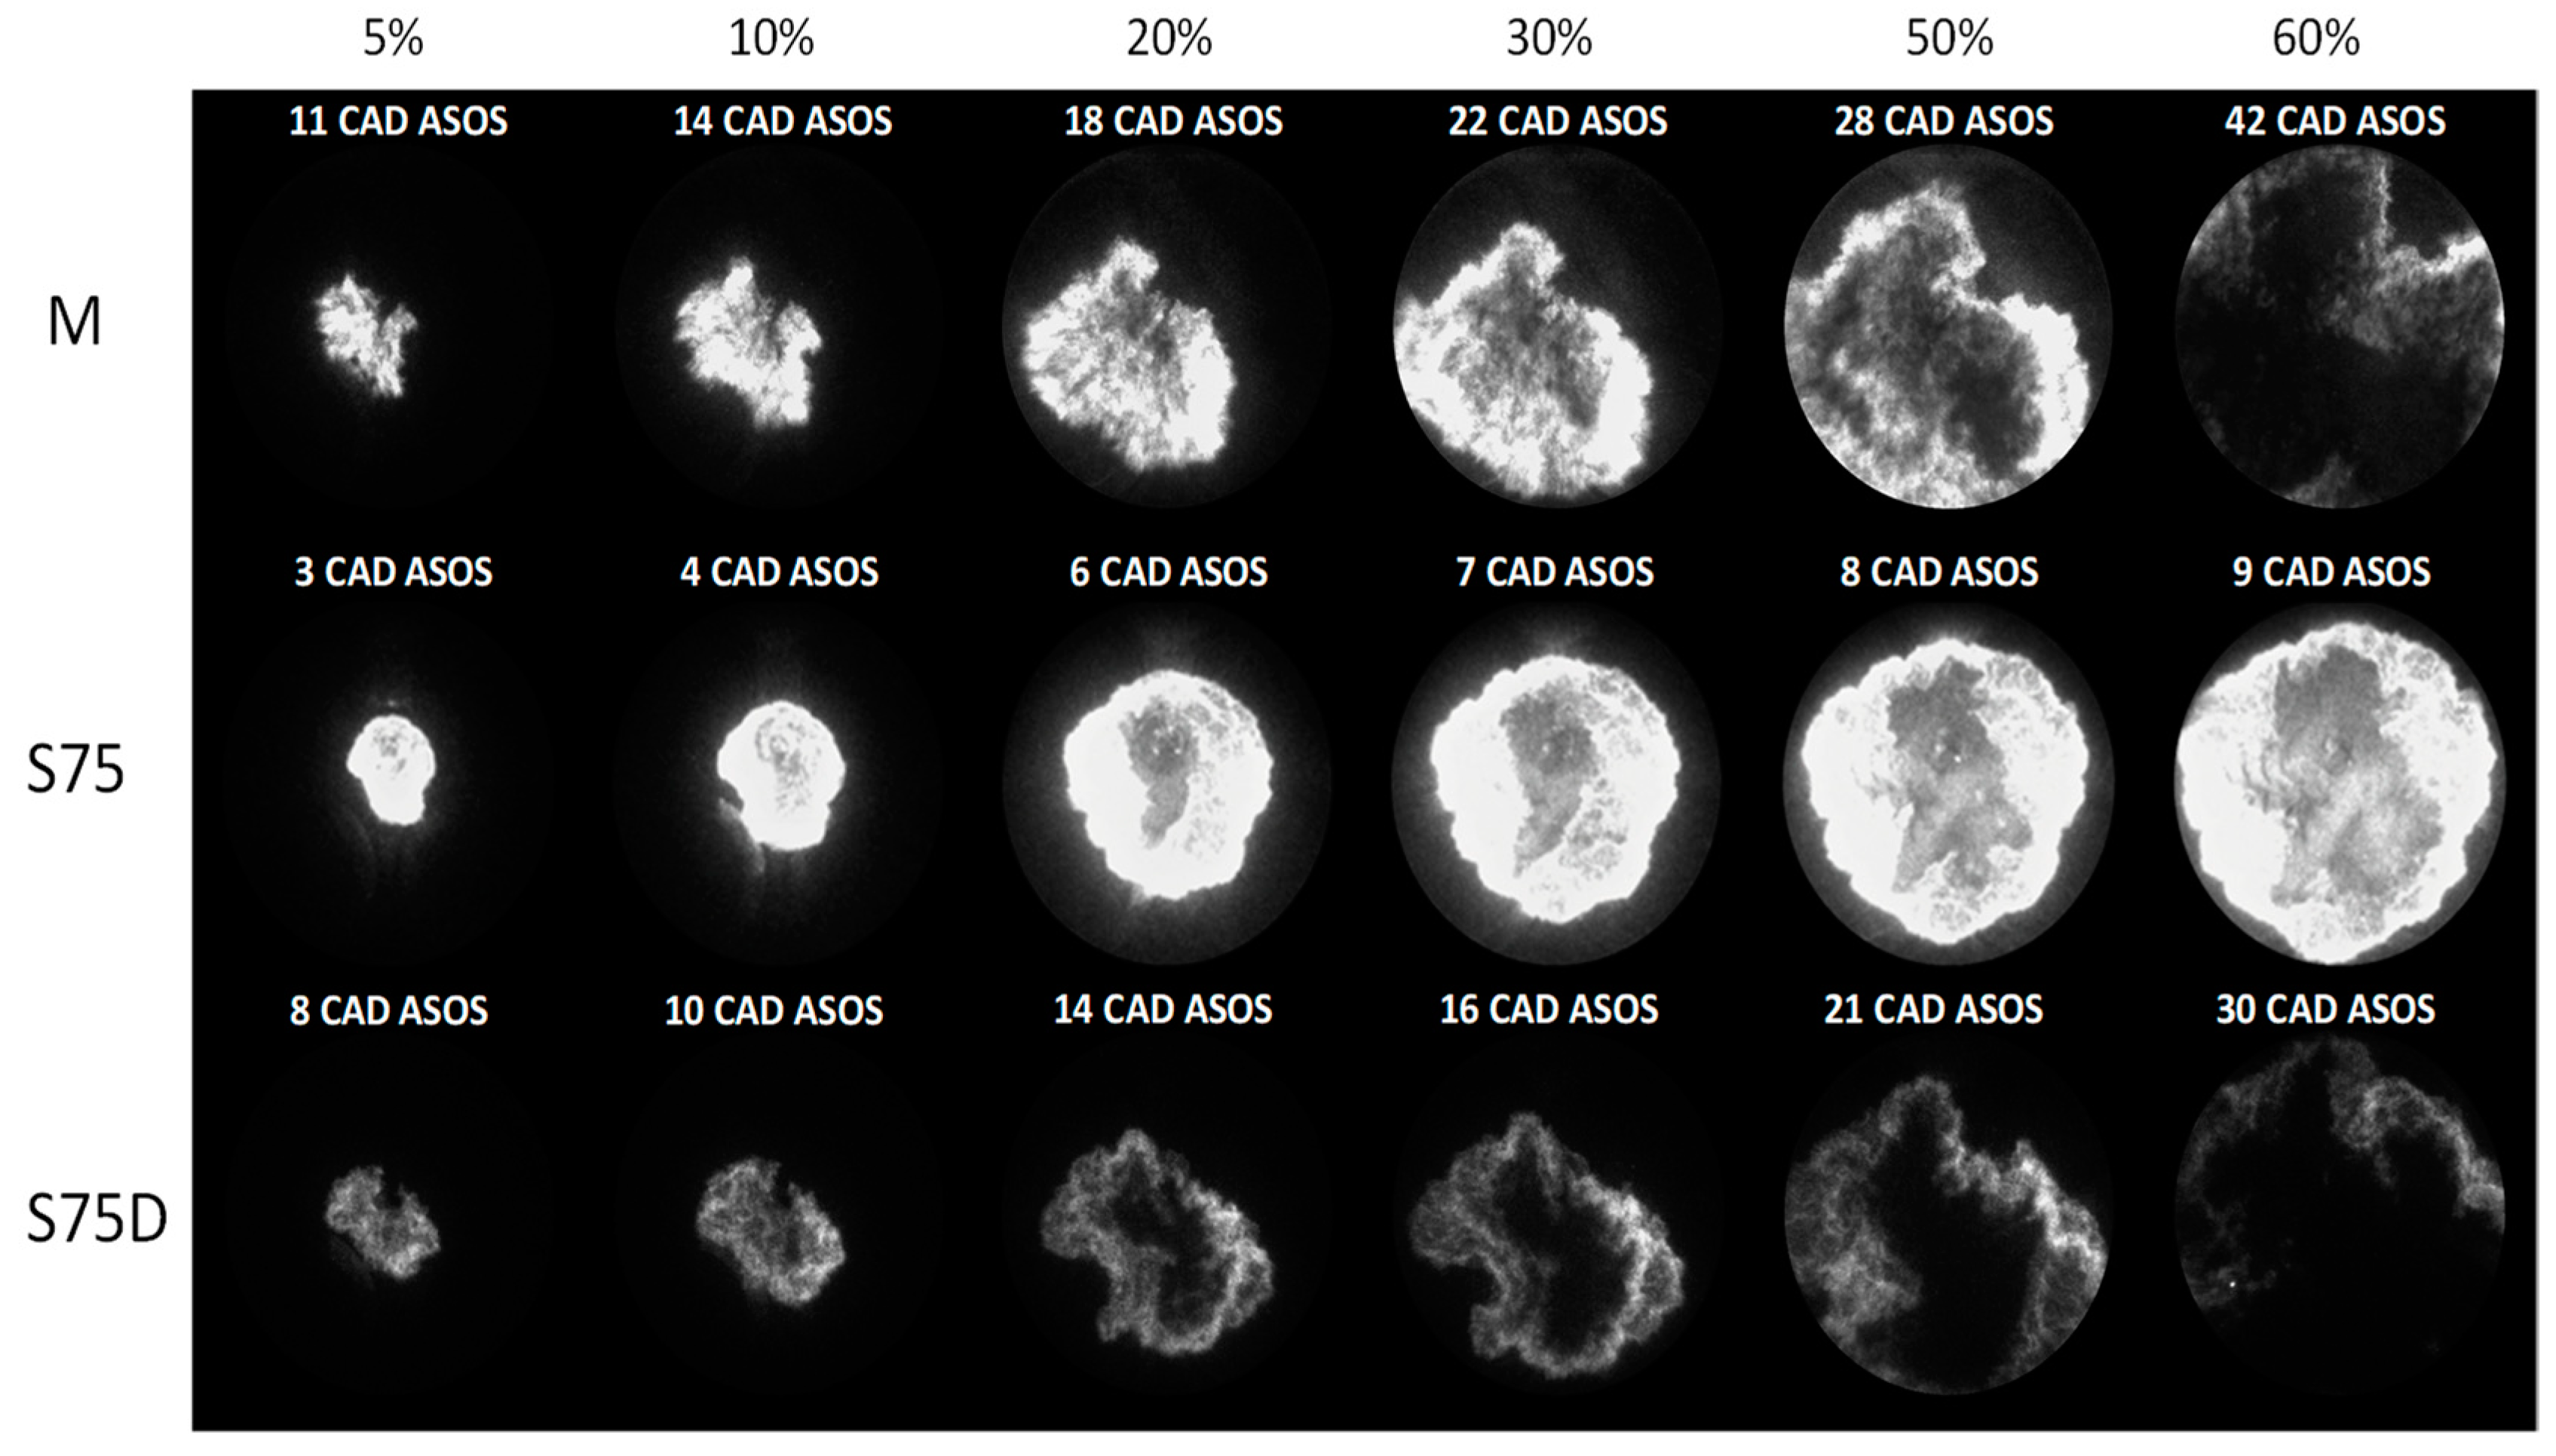
Traditional thermodynamic analysis gives global information on the evolution of combustion. However, for the study of new fuels, it is important to introduce additional measures for the detailed study of the process. In this work, direct visualization was performed through the window provided by the piston crown. Figure 10 shows an image sequence of six different instances (from 5% to 60% of piston area) for stoichiometric air-fuel ratio and syngas blends with 50% H2. A similar sequence can be seen in Figure 11 for 75% H2 blends. Methane data was duplicated for easier comparison. The crank angle values at the different flame area thresholds give indirect information of flame propagation speed. It is clear that pure syngas is much faster than diluted syngas and methane. Despite the fuel dilution, the hydrogen content of real syngas mixtures improves the combustion speed and shortens its duration by 4 CAD for S50D and 6 CAD for S75D with respect to methane. The high difference in terms of luminosity between diluted syngas and the other fuels is mainly because of the change in the f-number of the focal length as was mentioned in the optical measurement section. However, quantitative measurements such as flame speed, distortion, and displacement if its center in the combustion chamber can be measured with high precision [23].
In the case of lean combustion, the same camera set up could be used due to lower flame intensity. Figure 12 and Figure 13 show the sequence of images for H2/CO at 50/50% and 75/25% for the leanest case, respectively. Syngas without fuel dilution shows the highest emission intensity, followed by diluted syngas and methane. This behavior could be explained due to a different rate of heat released and local concentration of active chemical species. Martinez et al. [20] showed that the hydrogen content in mixtures of methane and syngas increases flame luminosity. The same behavior can be seen for these fuels. In addition, it can be appreciated that the flame front thickness was greater for pure syngas compared to the diluted blends and methane. Pure syngas featured the fastest propagation and the lowest flame distortion at the same air-fuel ratio. Also, the high content of hydrogen reduces the displacement of the flame center. This promotes combustion with a more uniform process.
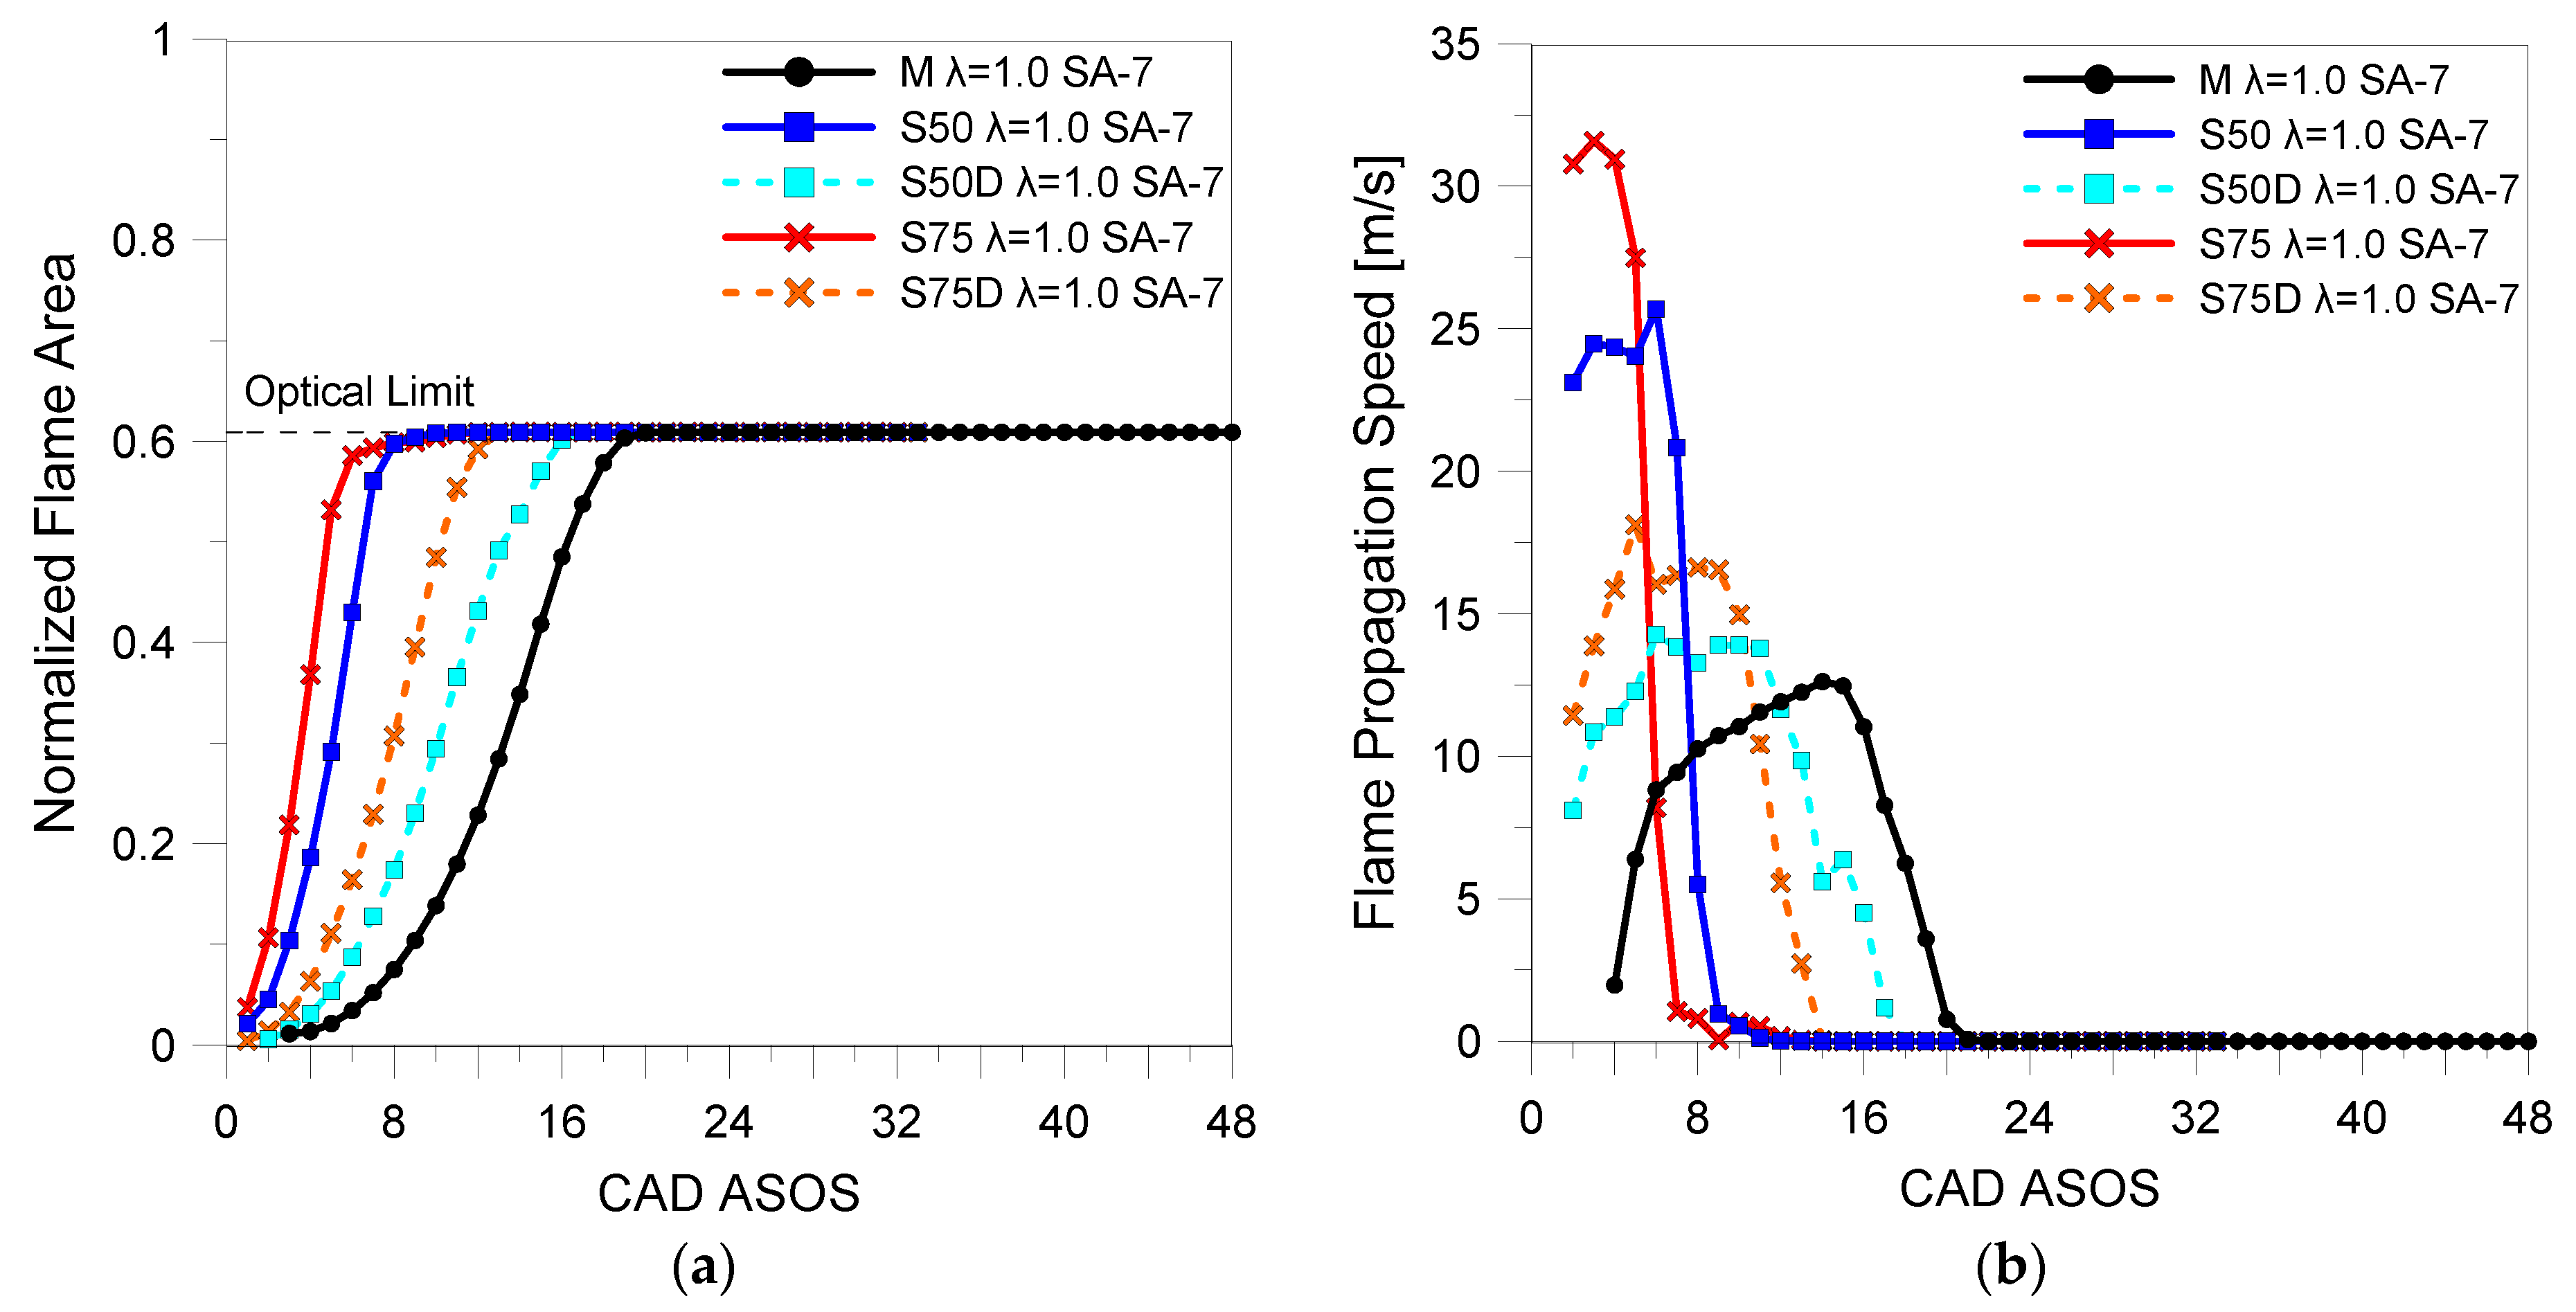
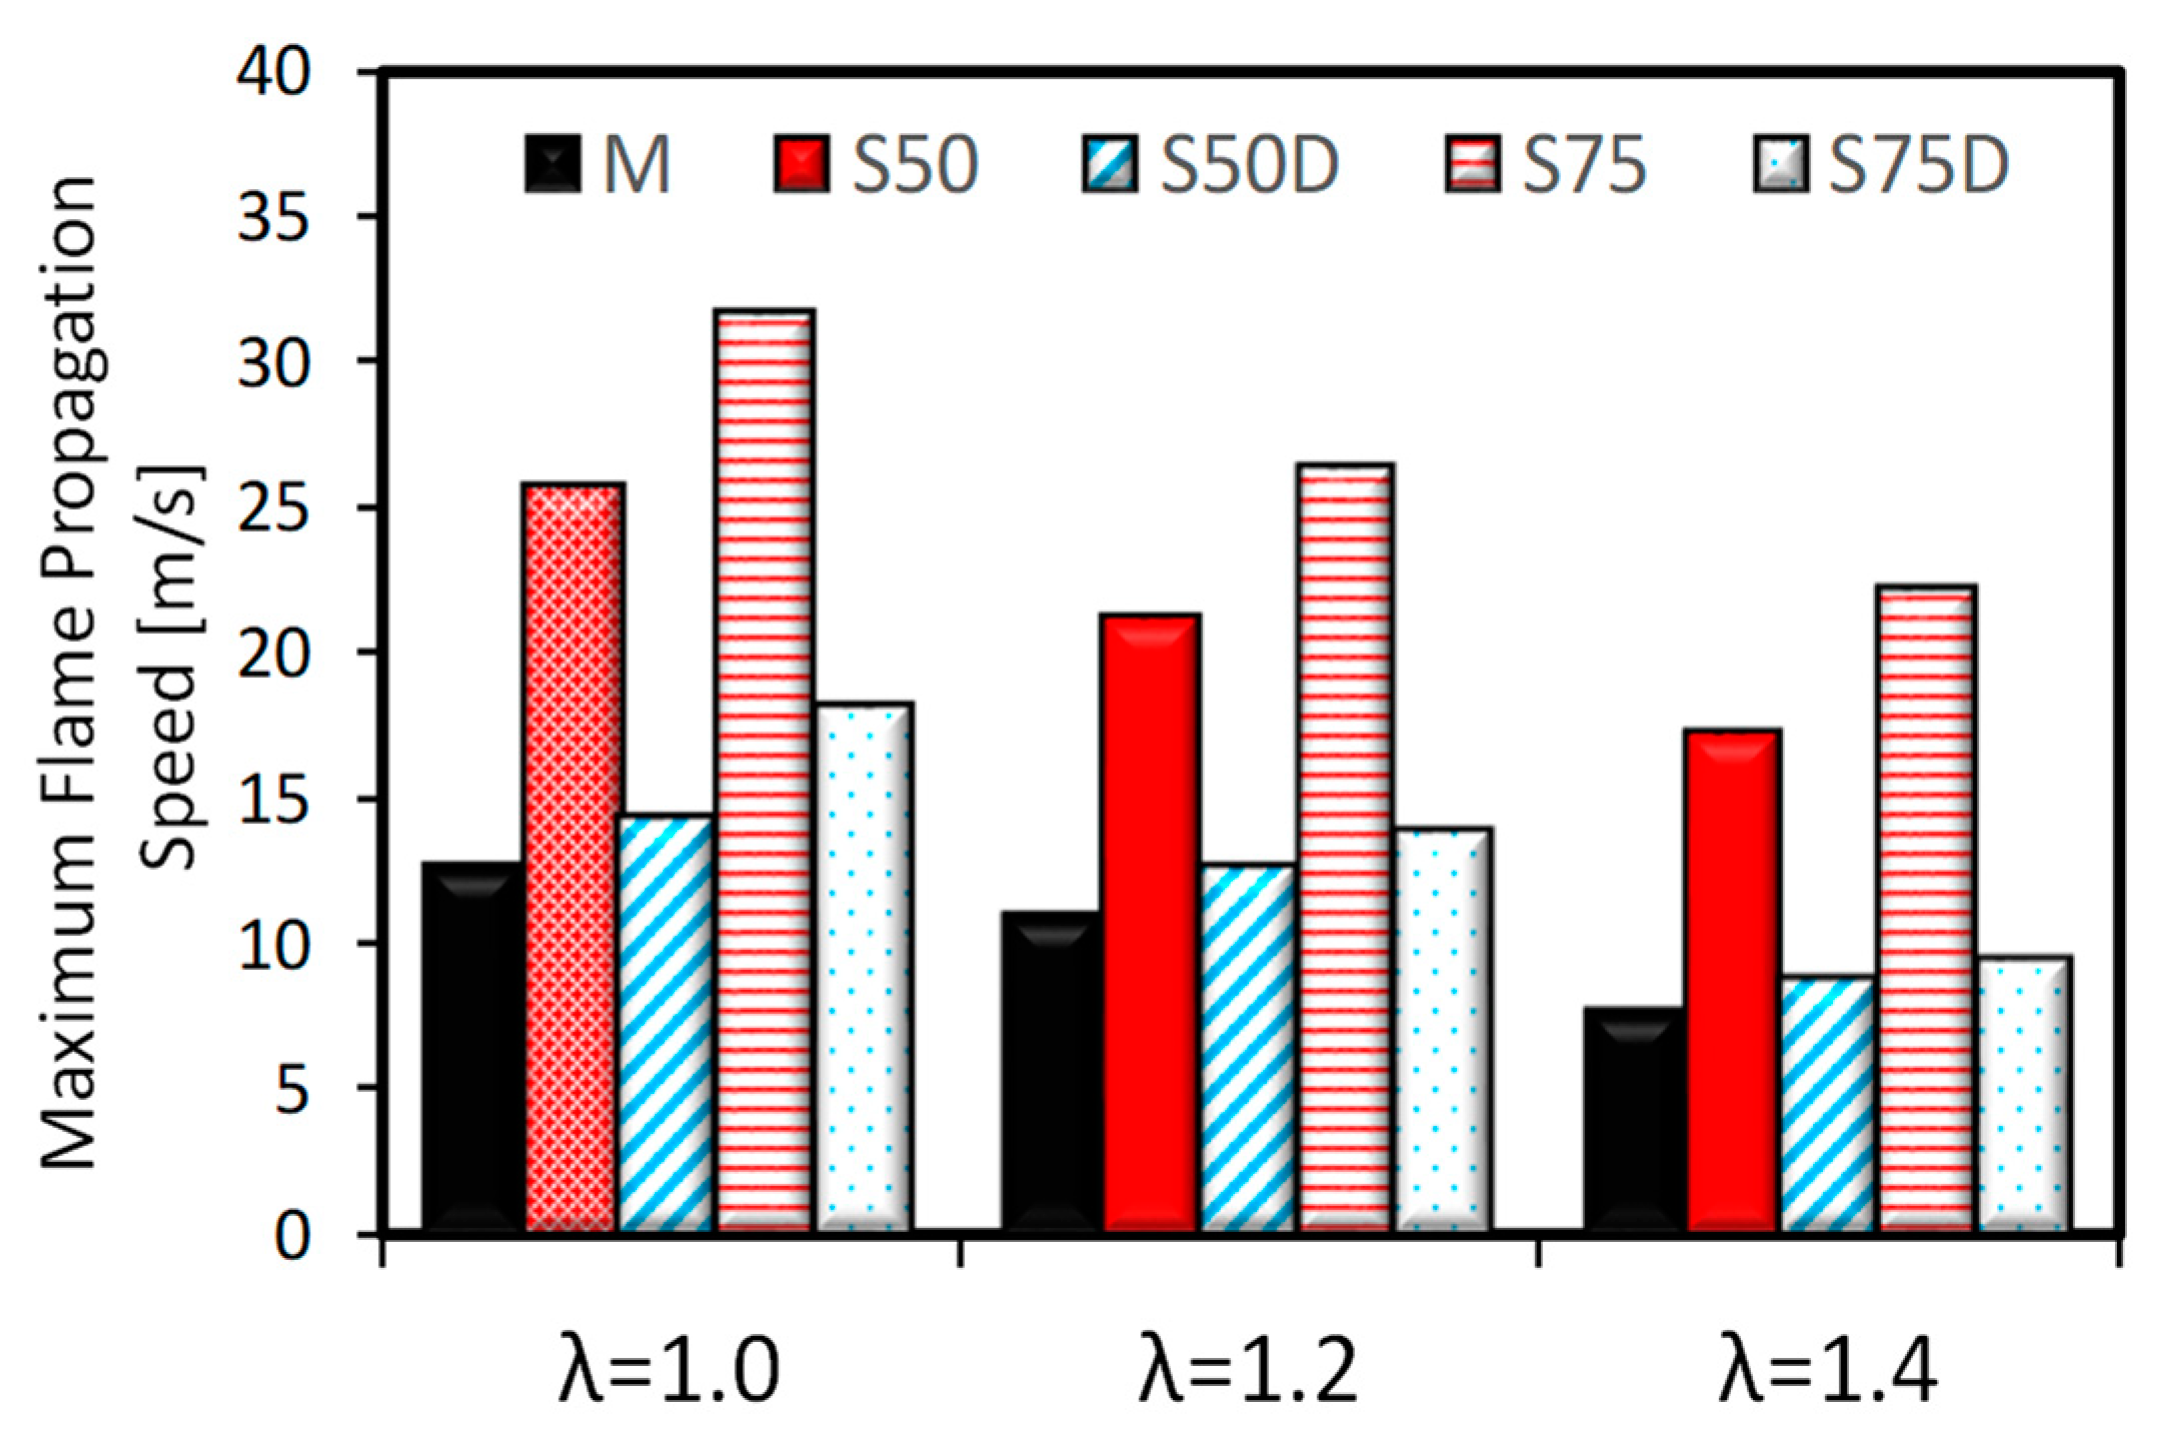
After a qualitative analysis of the flame front propagation, this study quantified the trends of the average flame area and propagation speed by applying the image processing procedure described in the previous section. Results reported in Figure 14, Figure 15, and Figure 16 are related to the averaged values over 30 consecutive engine cycles. Pure syngas was the ‘fastest’ fuel due to the high content of hydrogen. In particular, the H2/CO 75–25% blend at λ = 1.0 featured the highest speed value (32 m/s), 20 m/s faster than the baseline fuel in the same conditions (Figure 14). It is important to note that the results have the same trend as evaluated by using in-cylinder pressure data (see Table 4). Specifically, valuable results could be extracted even in the 0–5% MFB range, which is well recognized to be less accurate when using traditional thermodynamic analysis. In addition, S75D and S50D showed an increase of 5 m/s and 3 m/s with respect to methane, respectively. Therefore, the presence of hydrogen compensates for the inhibiting effect of diluent gases (CO2 and N2) on the flame propagation speed.
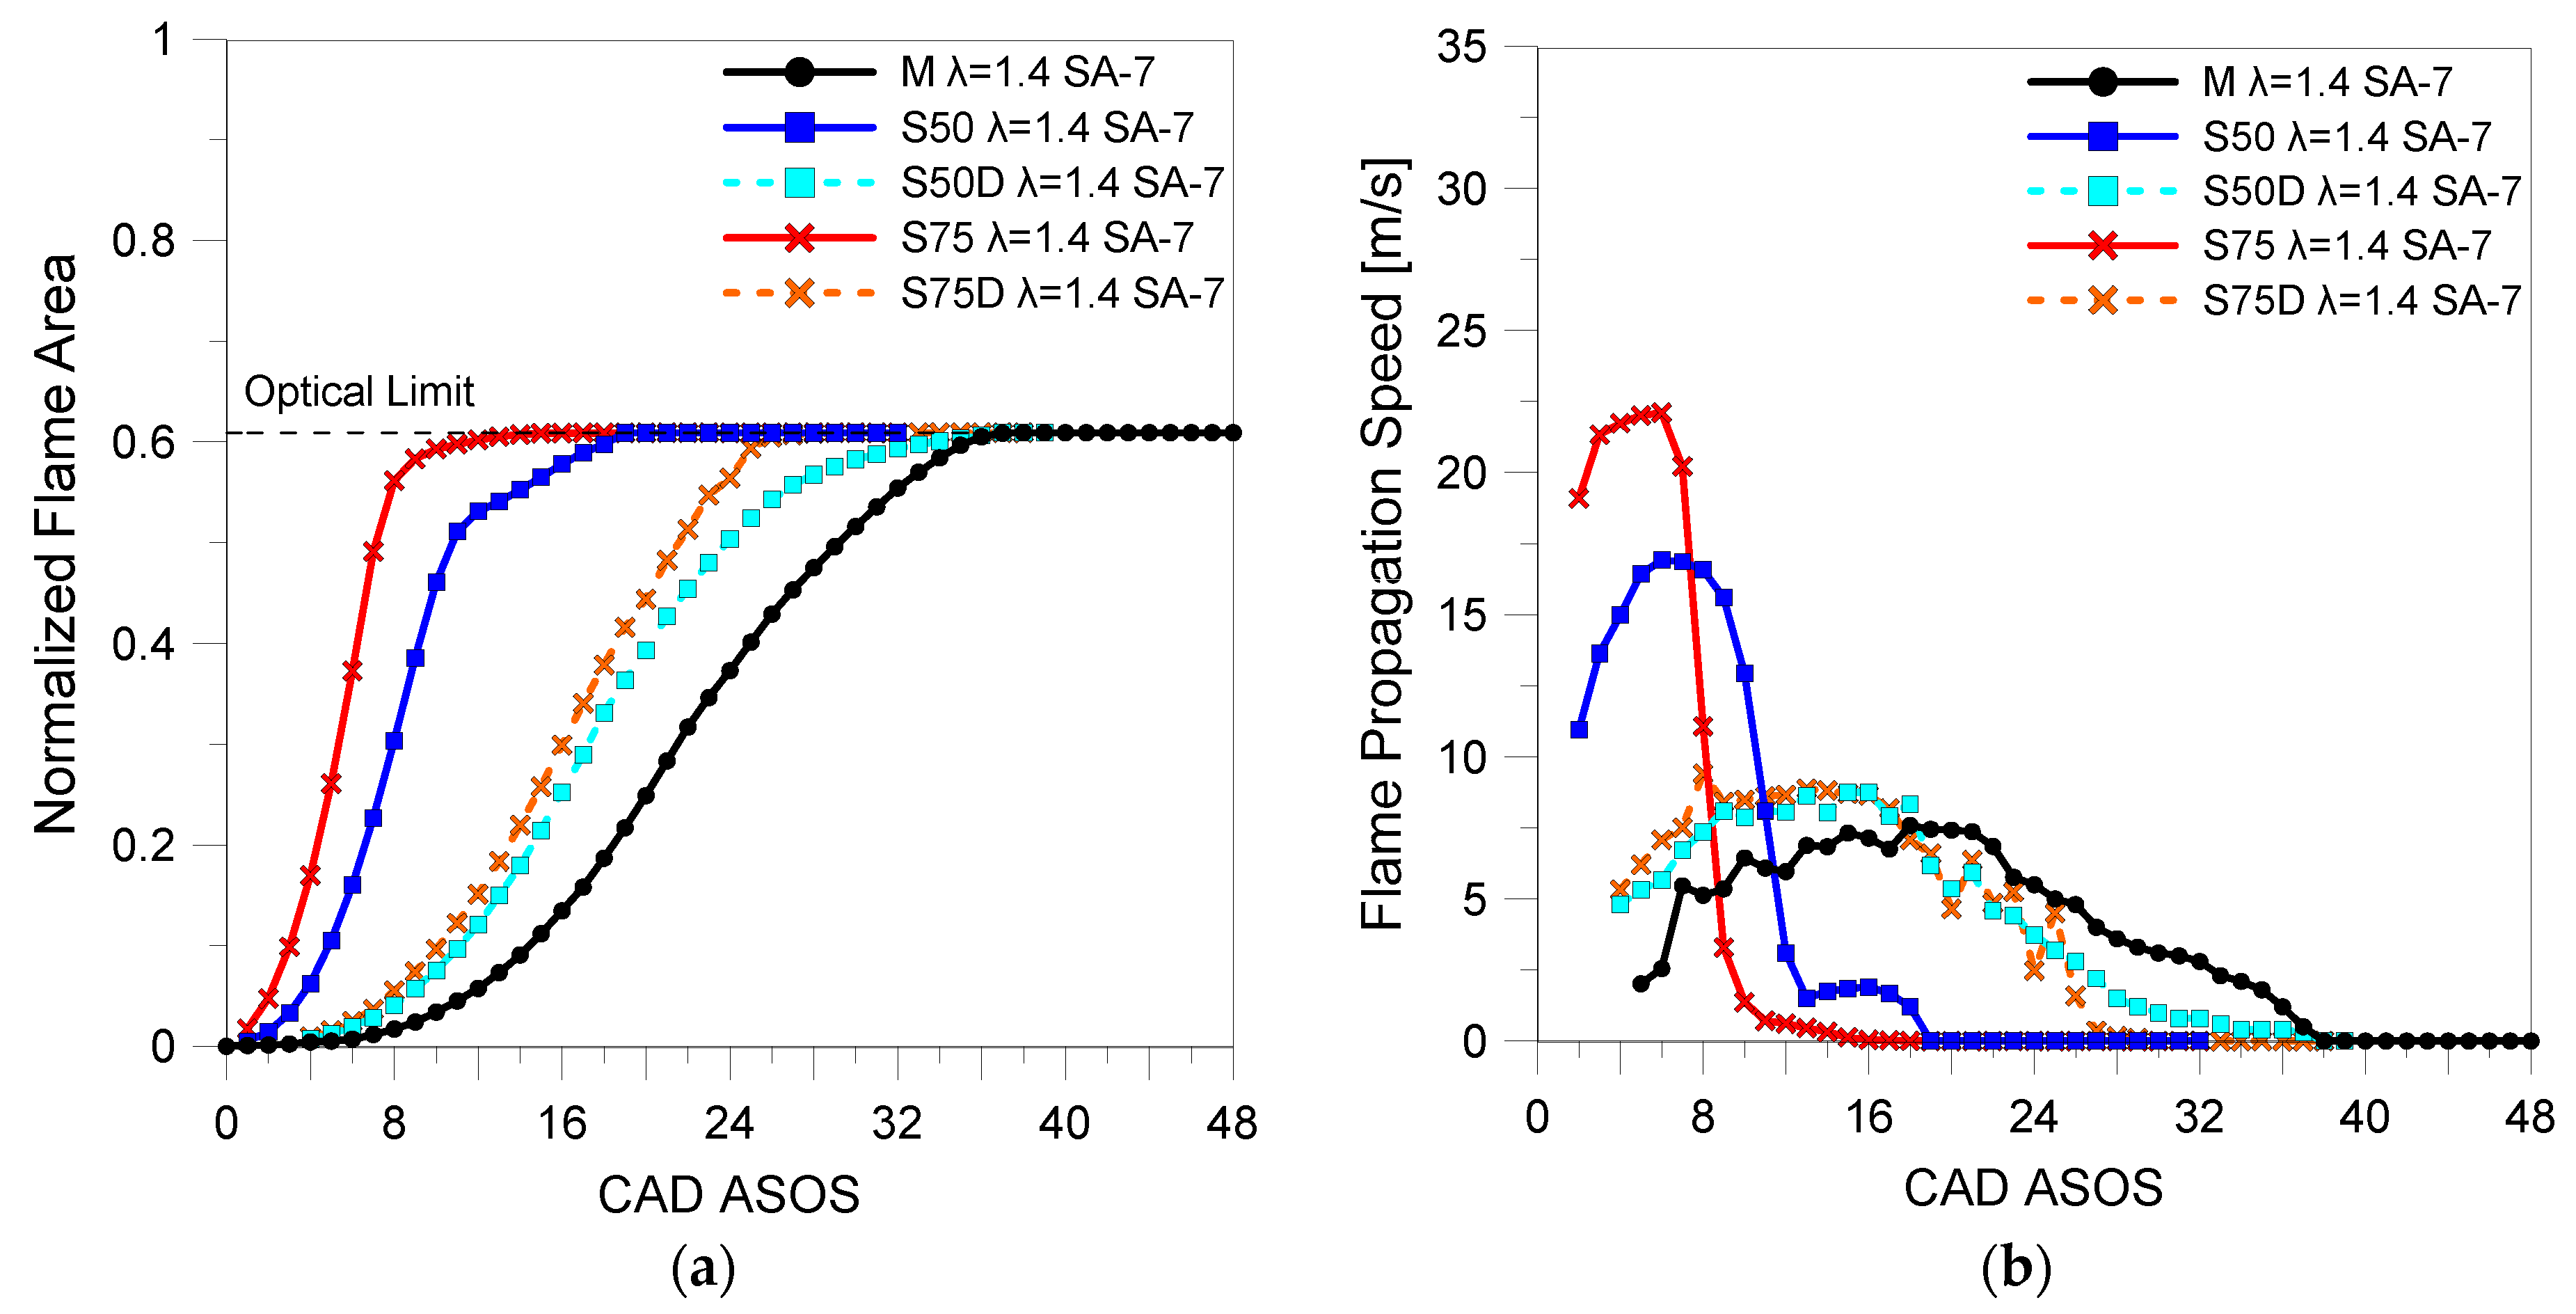
The lean cases (λ = 1.2 and λ = 1.4) showed a similar trend as λ = 1.0. For the leanest operating point, S75D suffered a decrease of 8.7 m/s with respect to λ = 1.0 and in the case of S50D, a decrease of 5.5 m/s was found (Figure 17). This analysis can be performed thanks to the fixed spark timing setting; these trends would change if optimized ignition were to be set for each fuel. However, this point was not among the objectives of this work. Another interesting comment is the fact that these results contribute to the literature on flame propagation when using alternative gaseous fuels in ICEs. In addition, these trends can be included as a direct comparison for 1-D and 3-D numerical models.
As iterated in the previous sections, laminar flame speed values are commonly used as a reference point for evaluating combustion evolution in ICEs. The results presented in Figure 17 for flame propagation speed inside the combustion chamber of the ICE (i.e., their peak values extracted from the traces shown in Figure 14, Figure 15 and Figure 16) are in line with those of laminar flame speed at atmospheric condition in constant volume chamber devices (see Table 3). This is associated with the fact that laminar flame speed is a key factor in flame front propagation. Also, the same fluid-dynamic conditions are set at ignition, and therefore, the turbulent component for different fuels is comparable [39].
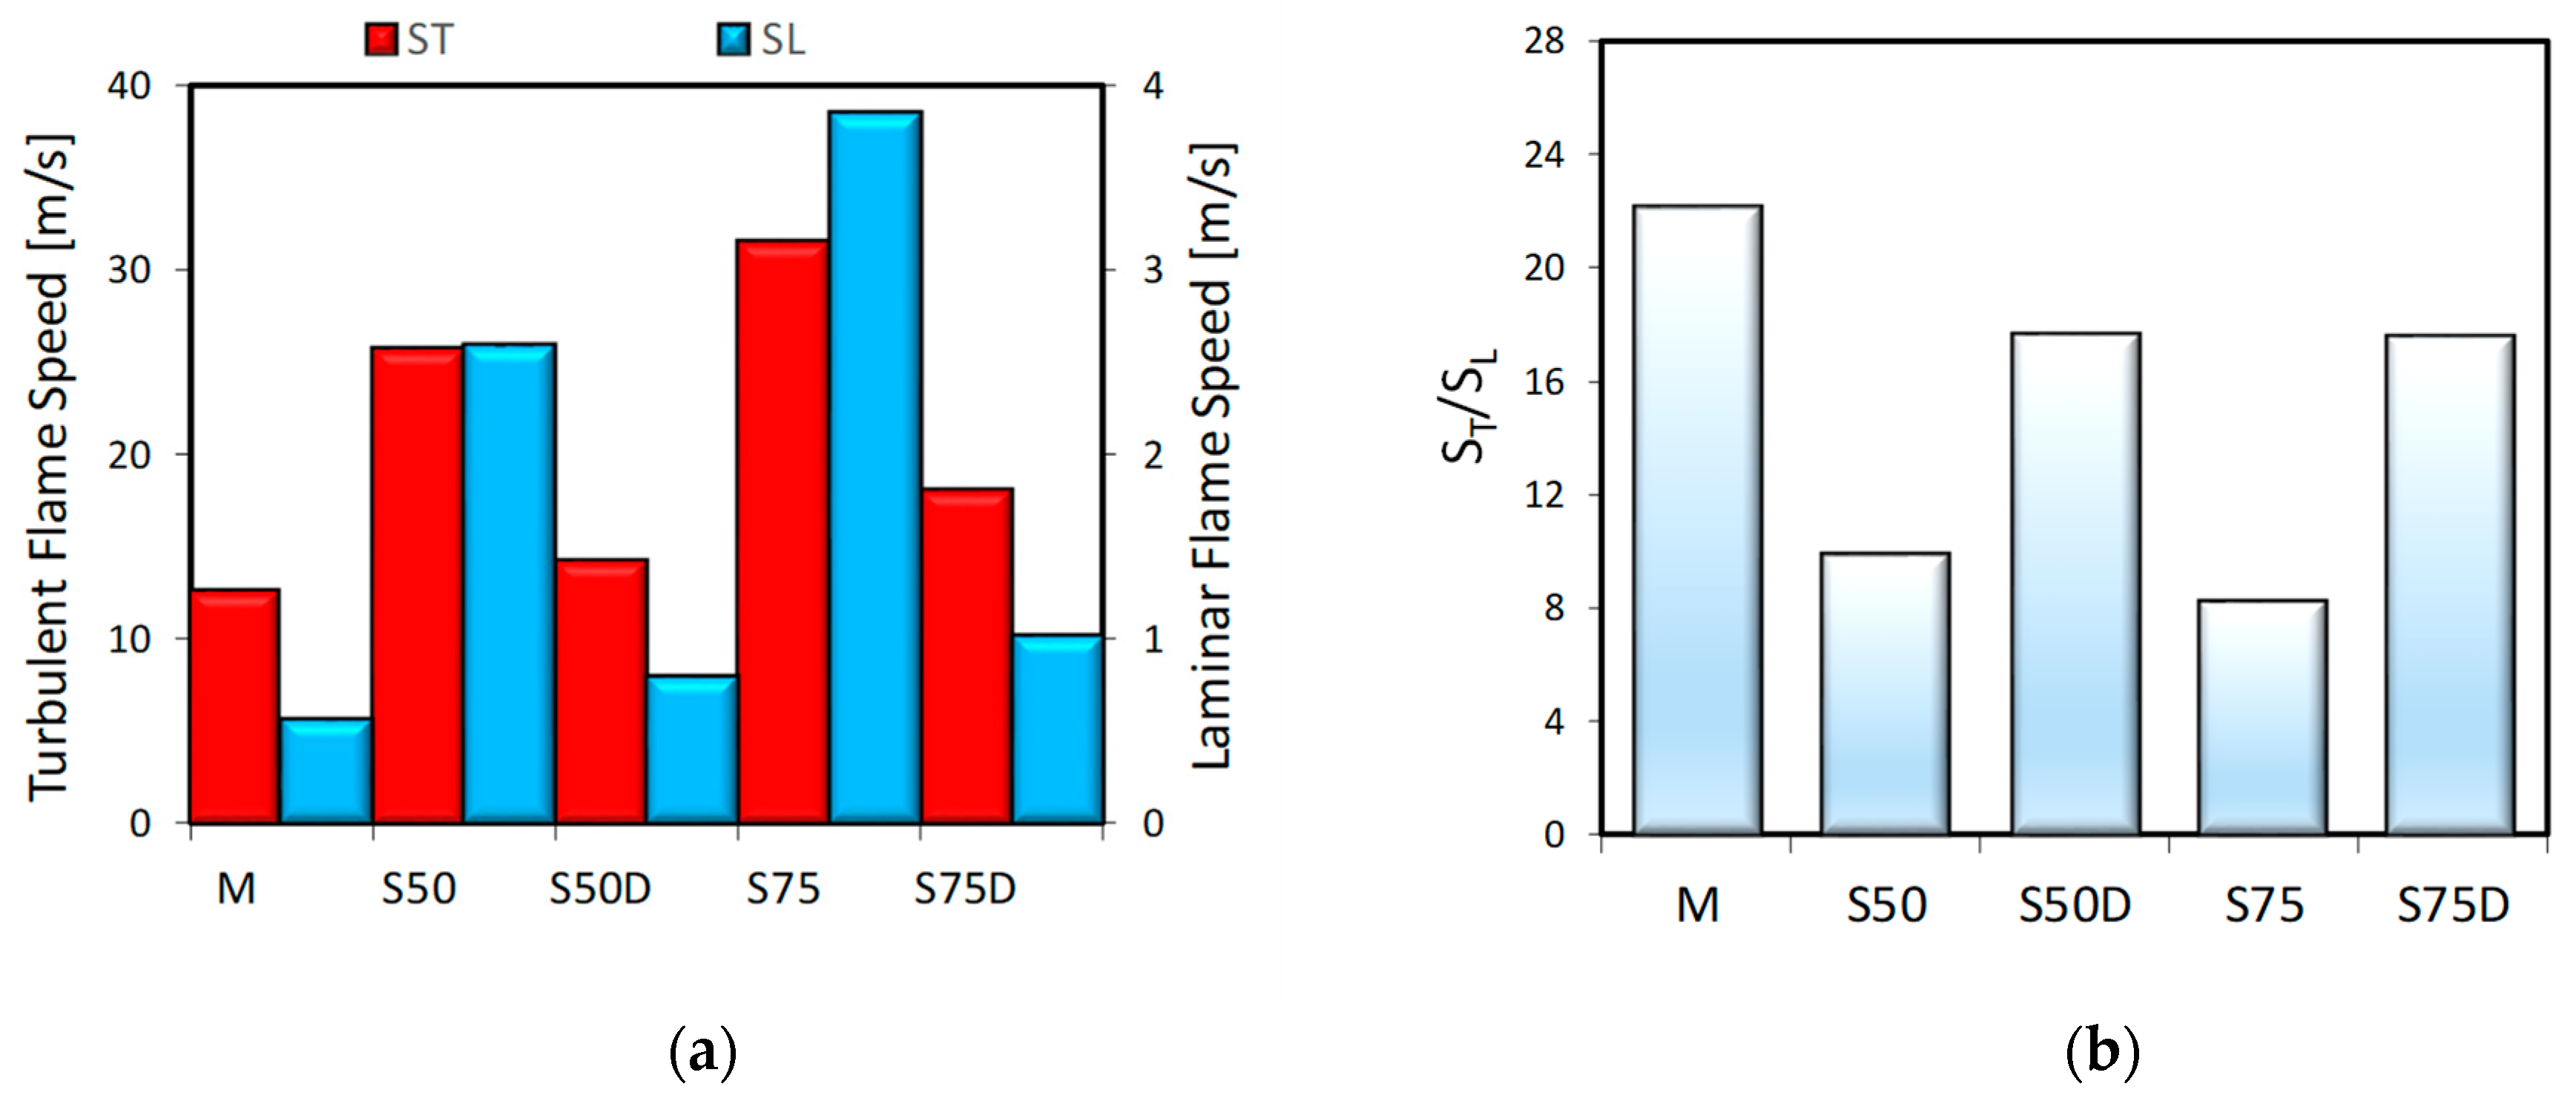
Measured flame propagation speed (turbulent speed) was also compared to laminar flame speed values calculated in the engine like conditions. Figure 18a shows the comparison of the two parameters (i.e., their peak values, with the latter estimated using the CHEMKIN tool, with pressure and temperature values determined from measurements on the engine (at the crank angle of peak turbulent flame speed). It is important to note that pressure was directly taken from the pressure transducer. Meanwhile, the temperature was estimated with the first law of thermodynamics coupled with a heat and mass transfer model [34]. The results show the same trend between fuels in laminar and turbulent flame speed. It is good to note that the graph was depicted with a scale factor of 10 between turbulent and laminar. Despite pure syngas having the highest values in both conditions, methane and diluted syngas presented high rates of increase, around 20 times with respect to 10 times of pure cases (Figure 18b). This could be associated with the effect of turbulence in slow mixtures. Therefore, the results show that at the engine like conditions the values taken in constant volume chamber could be taken as a reference but turbulence influence need to be considered.
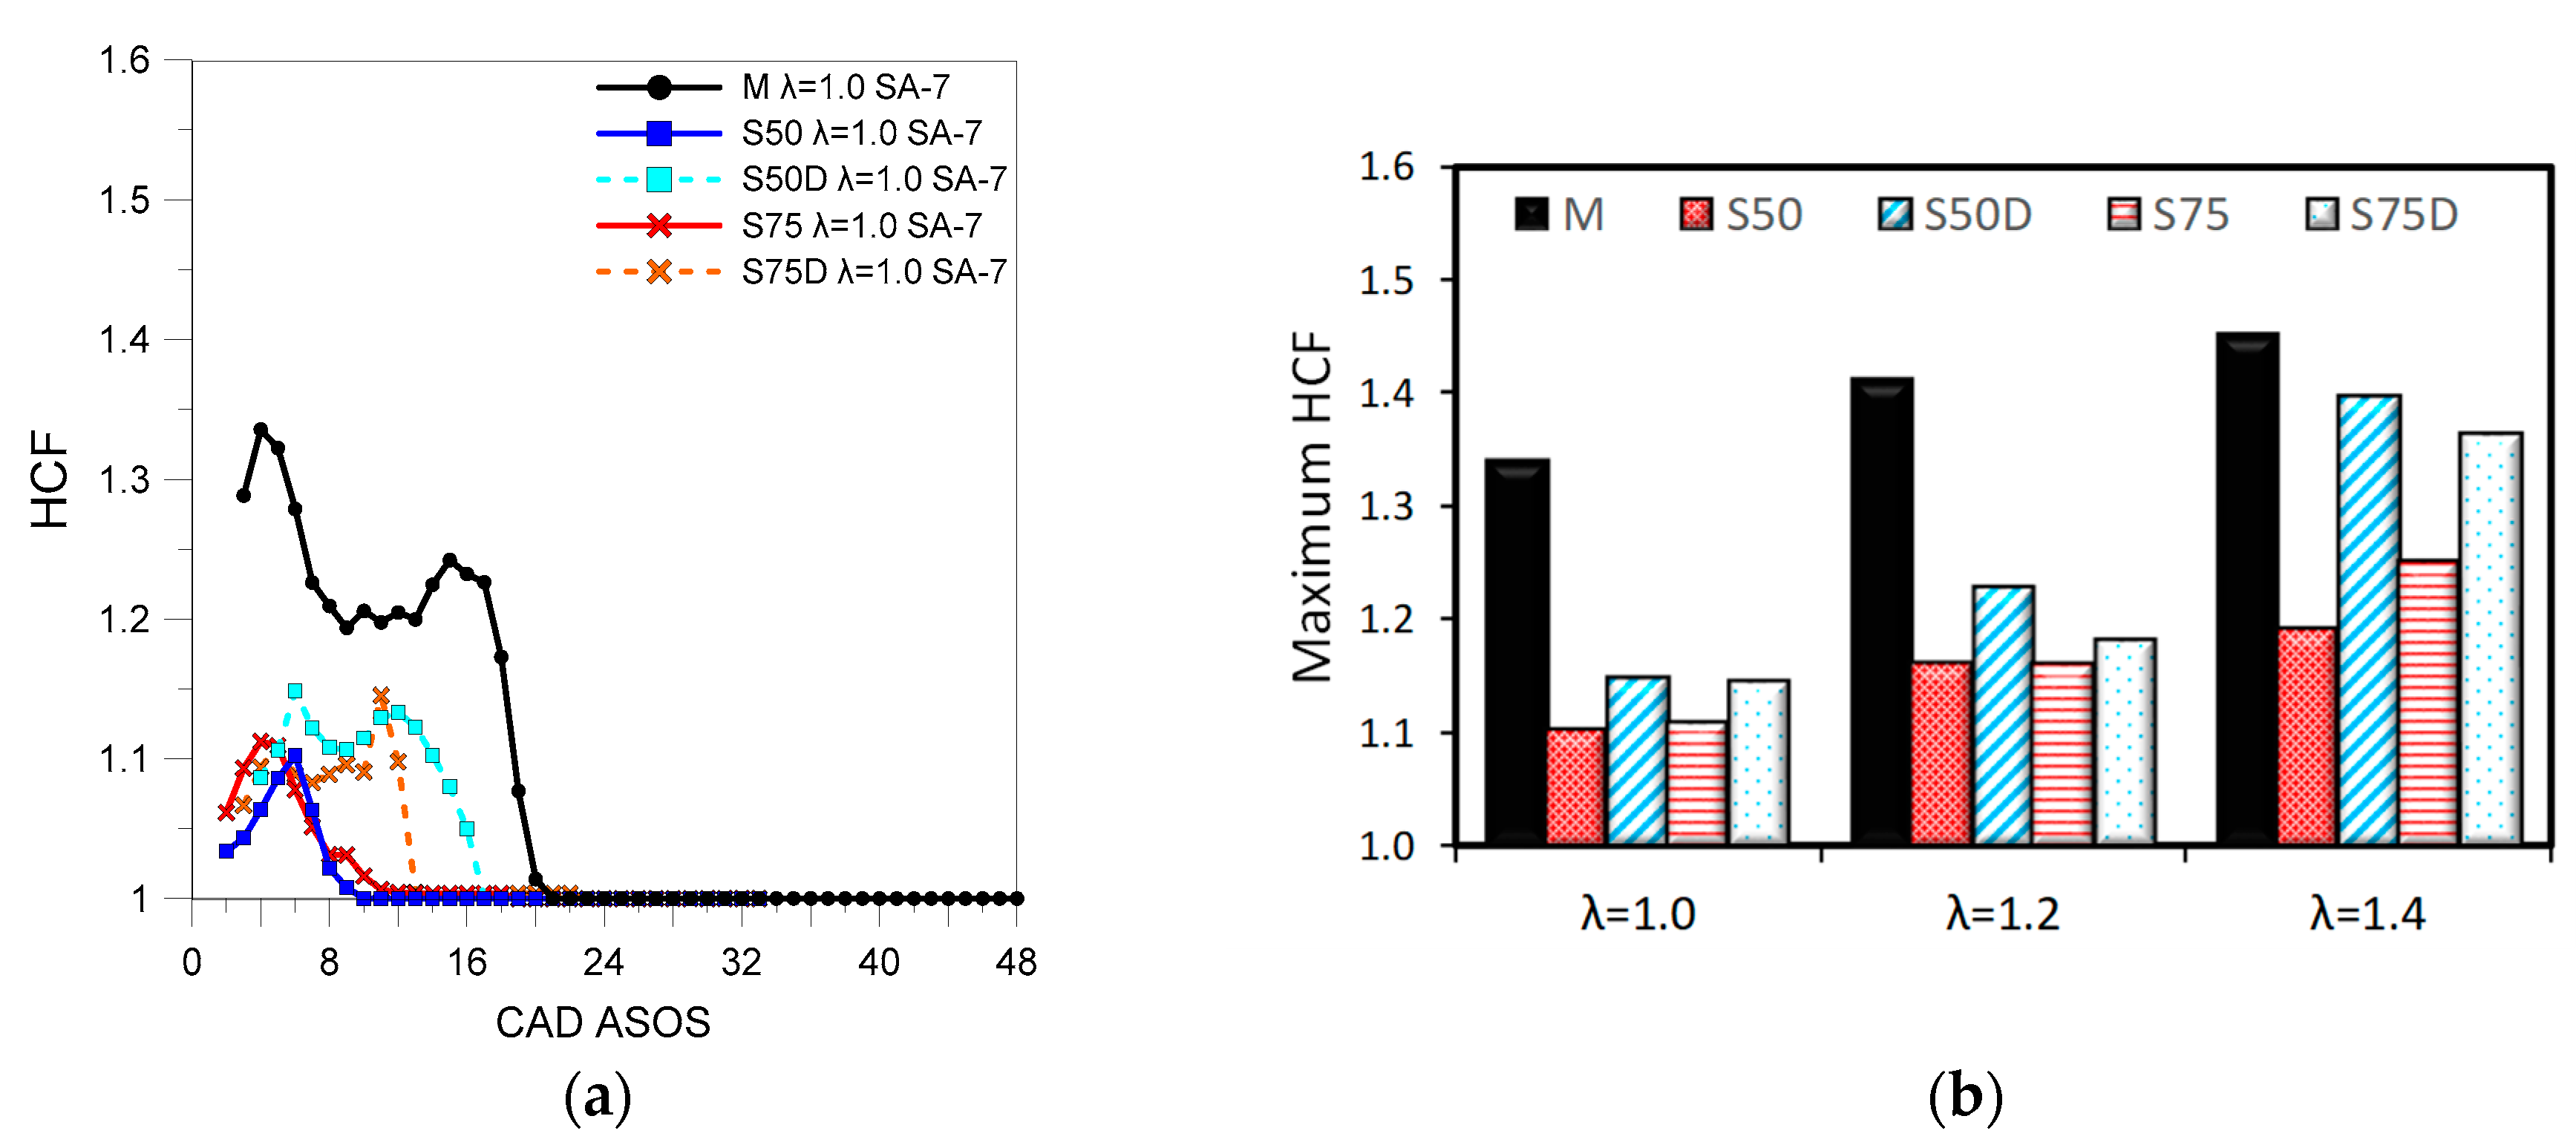
Proceeding with the morphologic analysis, flame distortion was analyzed by using the Heywood Circularity Factor (HCF). Figure 19a shows that without air dilution (λ = 1.0) the flame propagated quite uniformly in all directions for pure and real syngas blends. Methane resulted in less “circular” flame fronts, with a maximum distortion of around 1.35. Focusing on the different relative air-fuel ratios (Figure 19b), it is possible to see an increase at higher λ. This behavior could be attributed to the higher effect of in-cylinder turbulence due to the low burning velocity. However, hydrogen content helps to reduce this effect as can be seen for HCF values in the case of syngas with respect to methane. For real syngas mixtures, the double effect of air and fuel dilution caused a strong increase in flame distortion, even higher than pure methane.
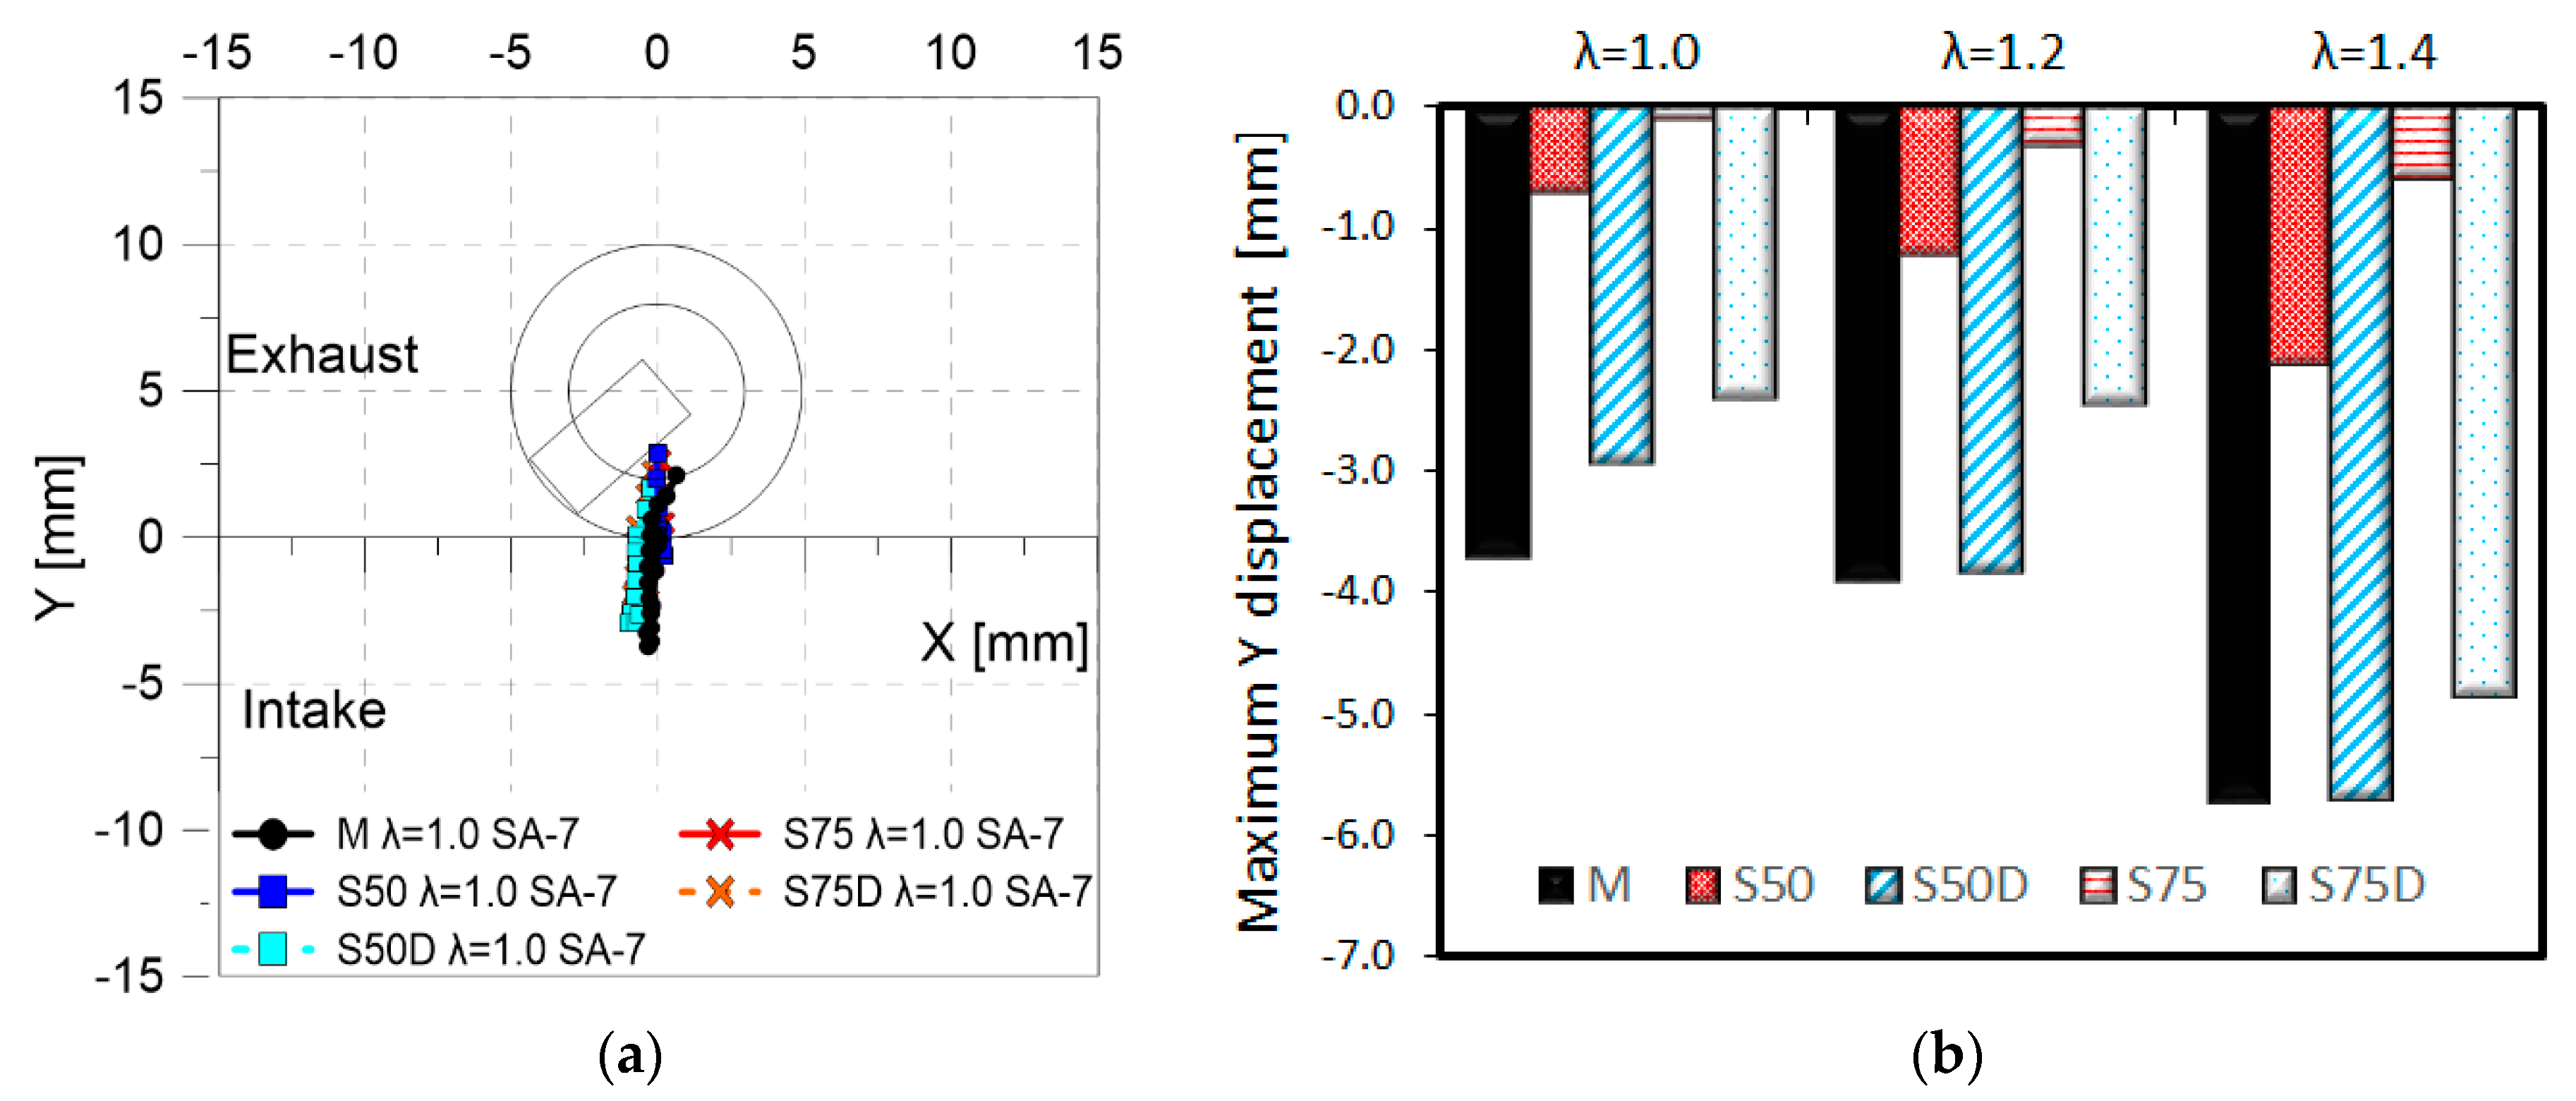
Another global morphology parameter analyzed was flame center displacement. This parameter gives interesting information about how the flame evolves inside the combustion chamber and shows whether there is a preferential direction of propagation. Figure 20 depicts the trends in stoichiometric conditions, for which an initial displacement towards intake valves can be noticed, after which a return to the center of the combustion chamber was measured. The first trend could be associated with the tumble motion (vertical plane) and the selected injection mode (PFI). For the same cylinder head used in this work and similar crank angle speed, Gomes et al. [40] measured Tumble ratios of 4.0 during intake and 1.5 during compression. Centered flames during late combustion are expected because it is the center of the optical window (see Figure 1b). Another important aspect is that almost negligible movement in the horizontal axis was seen for all fuels. For this type of combustion chamber geometries, the swirl motion (horizontal plane) is low. Huang et al. [41] show that for a similar combustion chamber geometry the swirl ratio values are around 0.1 [40].
Therefore, another comparison between fuels was done with maximum vertical displacement (Figure 20b). It could be seen that the addition of hydrogen reduces the displacement towards the intake valves. However, the increase in fuel dilution enhances the preferential displacement to that side. In addition, air dilution was seen to have a similar effect to that of fuel dilution, e.g., during lean fueling with pure syngas (S50 and S75 at λ = 1.4) and when inert gas was added (S50D and S75D at λ = 1.0).
Finally, the flame front surface wrinkling was analyzed with respect to fuel type. This parameter is associated with in-cylinder turbulence and fuel chemistry [38,42]. The literature is not completely coherent on this aspect; however, several authors link flame front corrugation with the combustion reaction rate and overall duration of the process [43]. Also, it was suggested that the high thermal and mass diffusivities of hydrogen reduce the flame thickness and with that increase wrinkling. These results are important for numerical simulation codes, as well, especially if wrinkling effects are considered when calculating the flame front area [44]. In this work, as was described in the methodology section, wrinkling was measured with the curvature tool, as the average of 10 combustion images with approximately the same flame area for two different points (10% and 30% of the piston cross-section). This ensures a comparative study of all the fuels at similar MFB; the first threshold (i.e., 10%, equivalent to around 5% MFB) is representative for flame kernel development, and the second one (i.e., 30%, equivalent to around 10% MFB) is indicative of the fully turbulent propagation phase.
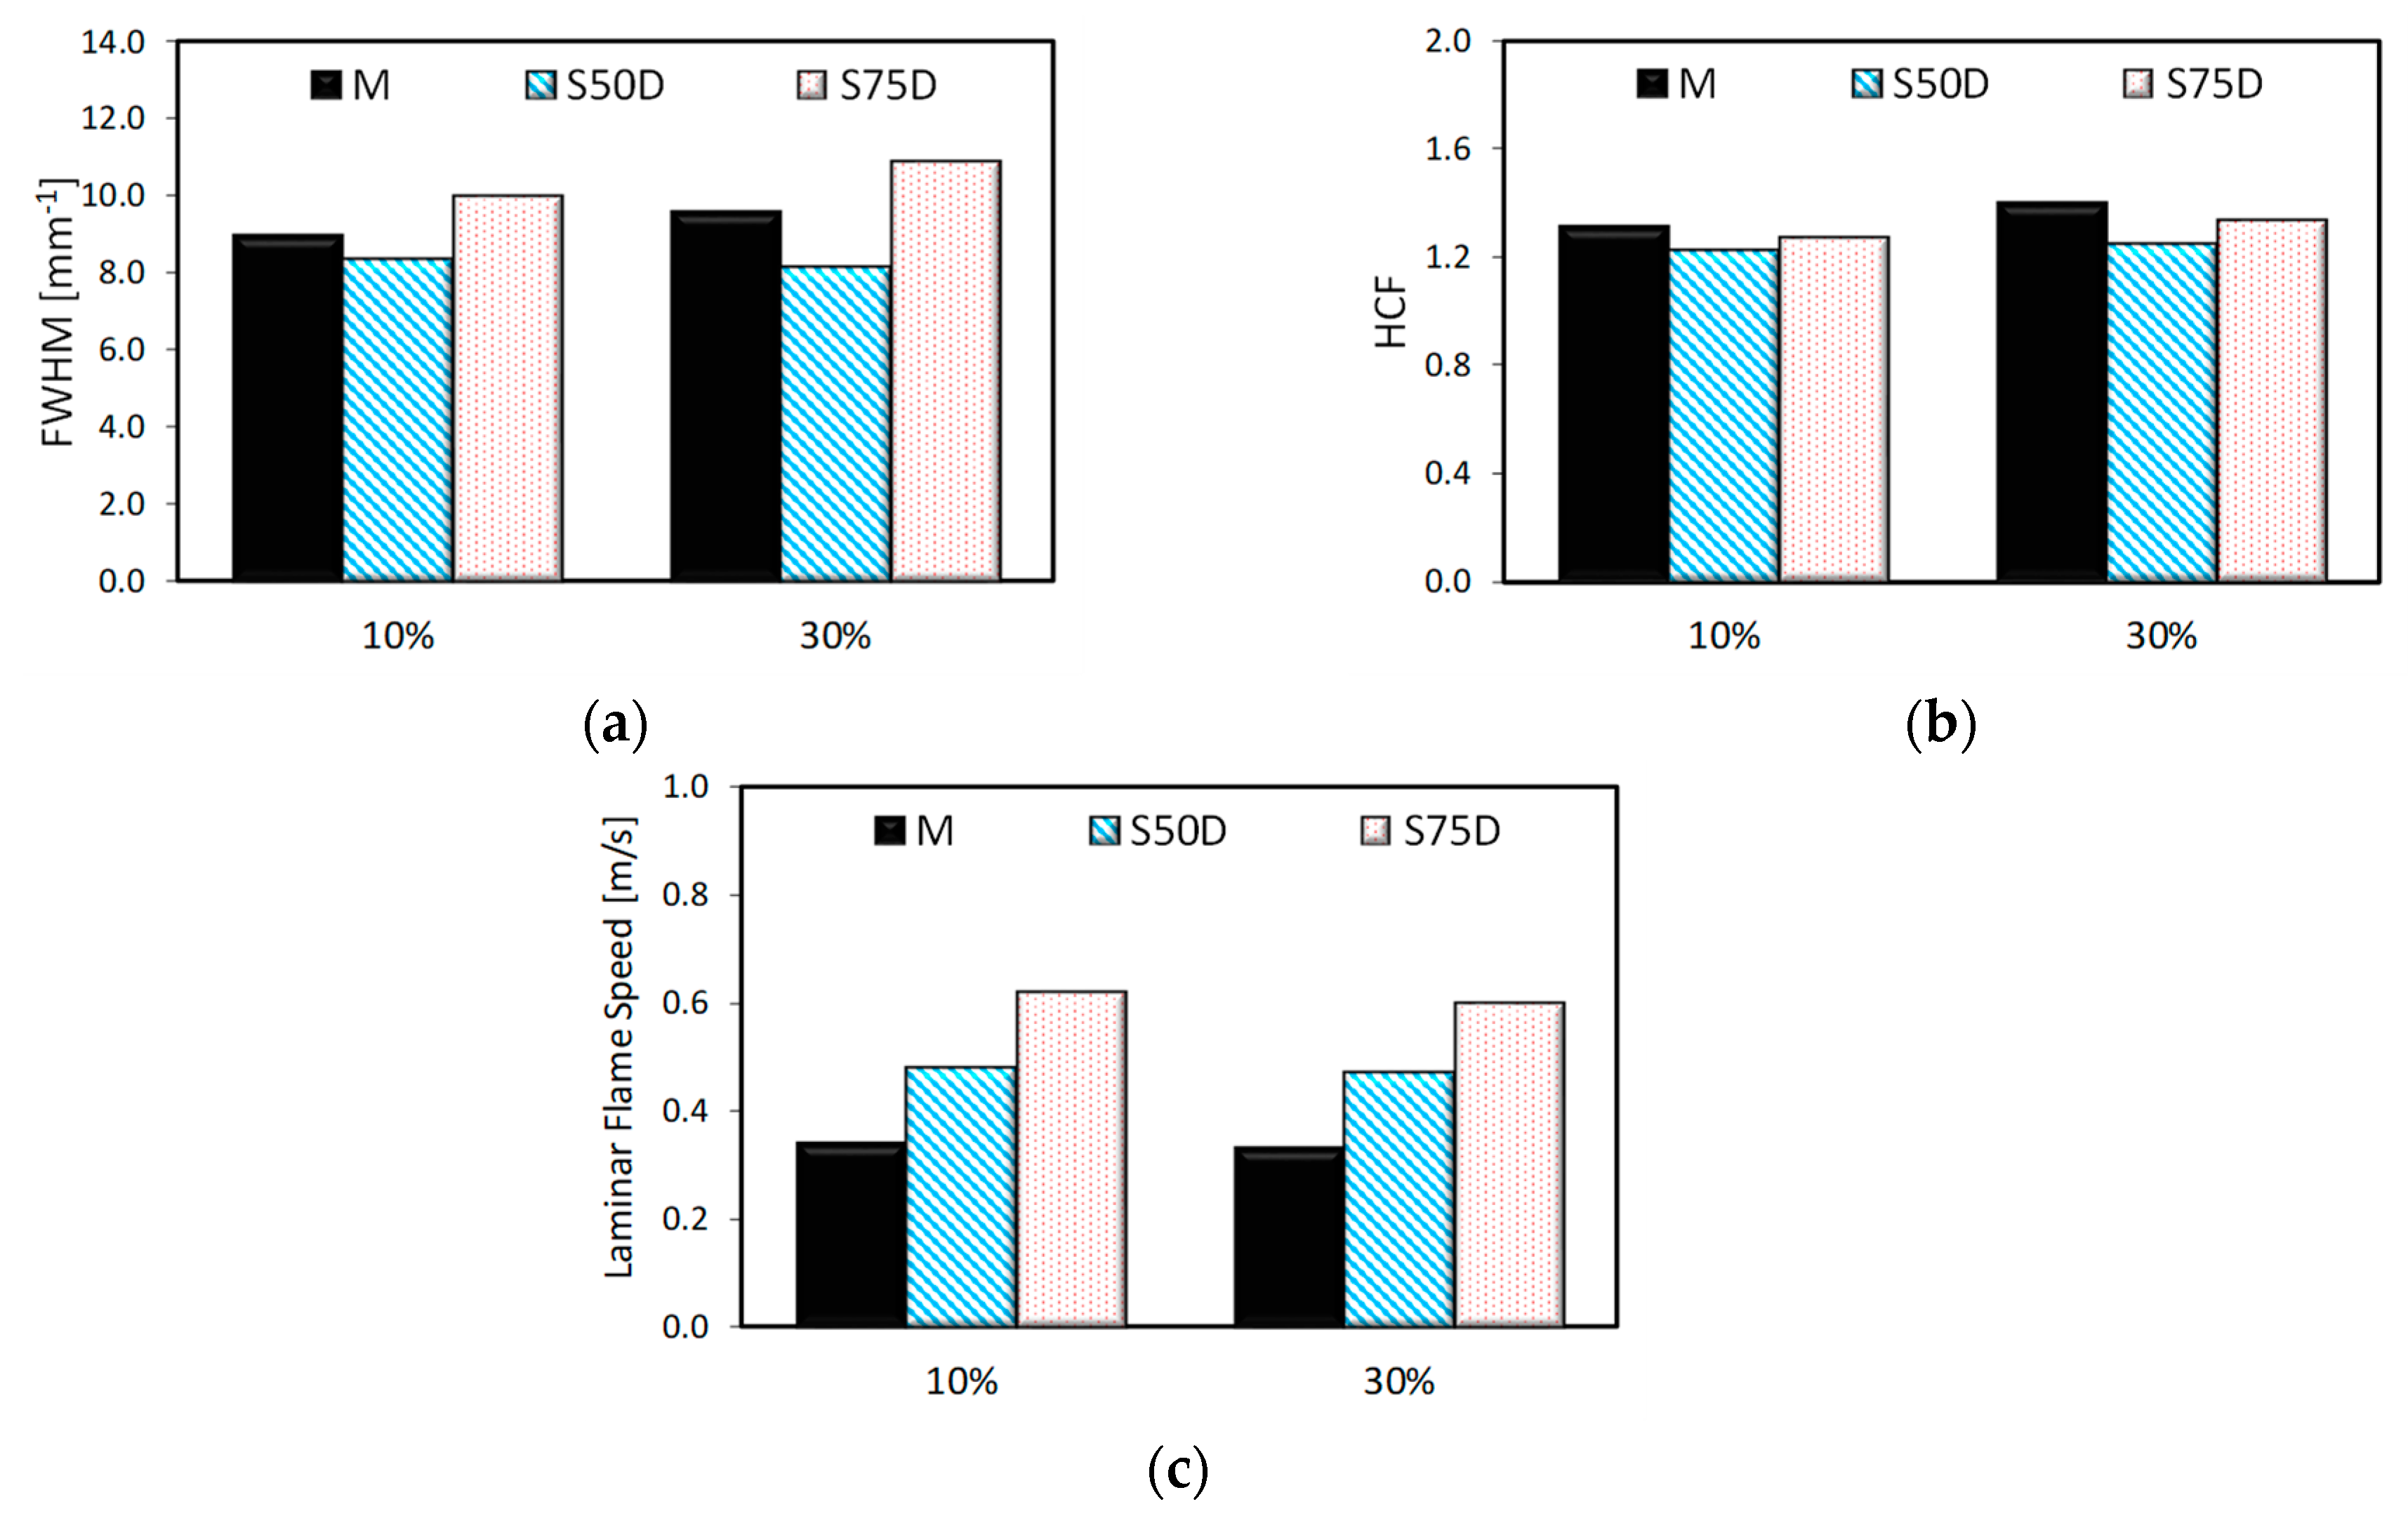
A flame curvature comparison between pure syngas, methane-hydrogen blends and pure methane [20] revealed that higher hydrogen content increases flame wrinkling, as does the air-dilution. In this work, the analysis was focused on comparing real syngas mixtures (fuel diluted) and pure methane during lean fueling. Figure 21a shows a common trend of a reduction in wrinkling for S50D, and then an increase for S75D with respect to methane; this was true for both flame sizes. To improve the analysis, HCF and SL were also inserted (Figure 21b,c, respectively). The graphs suggest that macroscopic flame distortion is related to flame distortion and less to the laminar flame speed. Several works [45,46,47] suggest that higher flame speed reduces wrinkling, due to the fact that the flame front is less affected by the turbulence. Reiterating the discussion on flame-turbulence interaction, one important aspect that needs to be considered is that methane reaches the flame area thresholds later during the cycle compared to the two syngas blends, therefore in a crank angle region with different turbulence intensity. No clear affirmation can be stated with respect to higher or lower intensity near TDC (given the conversion of tumble to turbulence [48]), but the common trend of increased wrinkling later during flame propagation could explain the relatively high value recorded for methane at 10% flame area compared to SD50. The fact that the latter fuel type features the lowest value for both instances emphasizes the importance of the second aspect of flame-turbulence interaction, i.e., combustion chemistry. Calculated laminar flame speeds do not seem to correlate with the observed trends of wrinkling.
On the other hand, flame-induced turbulence also needs to be considered. Even though it is still a matter of debate [49], it is well established that there are basically three mechanisms determining wrinkling [50]: eddy diffusion associated with turbulence in the unburned gases, which tends to increase it; propagation of the flame into the unburned region, which tends to reduce it; and instability, shear and eddy diffusion resulting from flame generated velocity gradients produced by the pressure drop across the combustion zone due to the density ratio, which tends to increase it. Considering these effects, higher laminar flame speed should be associated with less wrinkled flame fronts; on the other hand, it could increase the influence of the first mechanism, as previously iterated. The third effect should play a minor role, given that quite similar density ratios can be expected for all three fuel types. One definite observation is that the actual balance between the three mechanisms is what determines wrinkling trends, and a single explanation clarifies only part of the phenomenon. Looking at flame sensitivity from a more quantitative point of view, methane features an effective Lewis number around unity [51]; therefore, turbulent flame speed is expected to be influenced to a relatively small degree by wrinkling. Changes in the values of this parameter can have a significant impact on stretched laminar flame speed, especially in the first stages of combustion [52]. Even if values relatively close to unity should be expected for syngas as well [53], slight modifications in the effective Lewis number could induce variations of laminar flame speed values. No clear conclusion could be drawn on the observed trends, other than the fact that, given that all cases featured quite close values, turbulence characteristics dominate over fuel chemistry effects with respect to flame wrinkling; nonetheless, an interesting line of future investigations was identified in the form of studying more in detail flame-turbulence interactions in syngas-fueled SI engines.

4. Conclusions

Extensive experimental research on the syngas combustion process was performed. To this end, an optically accessible engine was run in conditions specific to power generation applications, with pure synthetic syngas (S50 and S75) and two representative mixtures of real syngas production (S50D and S75D). Two different H2/CO ratios (50–50% and 75–25%) were considered and 50% dilution (15% CO2 and 35% N2) was used as representative of real syngas mixtures. Moreover, air dilution was changed from stoichiometric up to extreme lean burn for methane combustion in SI engines. This single-component fuel was used as the baseline for all comparisons, due to the extended use of natural gas in ICEs for energy production. Traditional thermodynamic tools were complemented with cycle-resolved visualization over 30 consecutive cycles that featured continuous firing. Global and local morphology parameters were evaluated by applying a custom image processing method, with results averaged over several cycles so as to reduce the effect of CCV specific for SI engines.
Thermodynamic results show performance values for syngas close to methane under lean conditions. Despite the fixed spark timing strategy, the combustion stability indicator was below the limit (3% COVIMEP) for pure and real syngas. The leanest condition (λ = 1.4) with methane fueling was an exception, with a COVIMEP of 3.5%. Moreover, the fuel conversion efficiency was higher for real compared to pure syngas in stoichiometric and intermediate lean conditions. The trend was reverted at λ = 1.4 due to the spark timing strategy fixed for the point of MBT with methane at a stoichiometric air-fuel ratio. The low values of efficiency (20%) were attributed to a significant contribution of the top land region, commonly used in the design of optically accessible ICEs. Exhaust gas measurements confirmed this assumption, with high quantities of the unburned mixture in the exhaust port (high CO concentrations for syngas mixtures and CH4 for methane). On the other hand, NOx increased with the hydrogen content, in line with the observation of higher peak pressure. However, for real syngas, the emission of this pollutant was almost negligible. Therefore, real syngas shows great advantages for the use in SI engines in lean conditions, with acceptable performance, stable combustion process, and low emissions.
The optical results gave more detailed information on the combustion process. Spatial and temporal observations were obtained from this analysis. The addition of hydrogen promotes combustion with higher propagation speed (10 m/s higher for S75 compared to methane), reduces flame distortion (HCF 0.25 lower for S75 with respect to methane) and centered the combustion (3 mm lower displacement along the y-axis with S75 fueling compared to methane). Pure syngas showed better results than real syngas, due to lower fuel dilution. The results also suggest that air and inert gas in the fuel have a similar effect, meaning that both inhibit flame propagation. The results of simulated laminar flame speed show the same trend as that recorded for the measured turbulent speed at the same pressure and temperature conditions. The average ratio between the two types of the parameter was around 10 times. Lastly, local morphology study of the flame front shows that the full width at half maximum (FWHM) increased with hydrogen addition and was to a certain degree correlated with macroscopic flame distortion. The comparison between methane and real syngas mixtures showed a minimum value for S50D and a maximum for S75D, at two different flame sizes.

Author Contributions

S.D.M.-B. and P.T.L. conceived the experiments, designed the trials, performed the measurements, S.D.M.-B., A.I. and S.S.M. analyzed the data and wrote the paper, P.T.L. and P.L.C.-R. coordinated the activities of S.D.M.-B.

Funding

This research received no external funding.

Conflicts of Interest

The authors declare no conflict of interest.

Abbreviations

AFRSTStoichiometric Air fuel ratio
ATDCAfter top dead center
CADCrank angle degree
CCVCombustion cyclic variability
COVIMEPCoefficient of variation of indicated mean effective pressure
DFBGDowndraft fixed bed gasifier
DODDegree of dilution
DOIDuration of Injection
fpsFrame per second
FWHMFull with at the half maximum
HCFHeywood circularity factor
ICEInternal combustion engine
IMEPIndicate mean effective pressure
LHVLow heating value
MMethane
MBTMaximum brake torque
MFBMass fraction burned
NGNatural gas
S50Syngas with composition 50% H2 and 50% CO
S50DSyngas with composition 50% H2 and 50% CO in fuel basis plus 50% of dilution
S75Syngas with composition 75% H2 and 25% CO
S75DSyngas with composition 75% H2 and 25% CO in fuel basis plus 50% of dilution
SASpark advance
SISpark ignition
SLLaminar flame speed
STTurbulent flame speed
UVUltra violet
WOTWide open throttle
λRelative air fuel ratio
σStandard deviation of gaussian curve fitting the wrinkling histogram

References

  1. Koirala, B.P.; Koliou, E.; Friege, J.; Hakvoort, R.A.; Herder, P.M. Energetic communities for community energy: A review of key issues and trends shaping integrated community energy systems. Renew. Sustain. Energy Rev. 2016, 56, 722–744. [Google Scholar] [CrossRef] [Green Version]
  2. Lee, K.; Miguel, E.; Wolfram, C. Experimental Evidence on the Demand for and Costs of Rural Electrification; NBER Working Paper No. 22292; National Bureau of Economic Research: Cambridge, MA, USA, 2016. [Google Scholar]
  3. Atikah, A.; Abdullah, N.; Ha, F.; Inayat, A. Assessing the gasification performance of biomass: A review on biomass gasification process conditions, optimization and economic evaluation. Renew. Sustain. Energy Rev. 2016, 53, 1333–1347. [Google Scholar]
  4. Pacioni, T.R.; Soares, D.; Domenico, M.D.; Rosa, M.F.; Fátima, R.D.; Muniz, P.; José, H.J. Bio-syngas production from agro-industrial biomass residues by steam gasification. Waste Manag. 2016, 58, 221–229. [Google Scholar] [CrossRef]
  5. Shivapuji, A.M.; Dasappa, S. In-cylinder investigations and analysis of a SI gas engine fuelled with H2 and CO rich syngas fuel: Sensitivity analysis of combustion descriptors for engine diagnostics and control. Int. J. Hydrogen Energy 2014, 39, 15786–15802. [Google Scholar] [CrossRef]
  6. Monteiro Magalhaes, E. Combustion Study of Mixtures Resulting From a Gasification Process of Forest Biomass; Ecole Nationale Superieure de Mecanique et d’Aerotechique (ENSMA): Poitiers, France, 2011. [Google Scholar]
  7. Raman, P.; Ram, N.K. Performance analysis of an internal combustion engine operated on producer gas, in comparison with the performance of the natural gas and diesel engines. Energy 2013, 63, 317–333. [Google Scholar] [CrossRef]
  8. Centeno, F.; Mahkamov, K.; Lora, E.E.S.; Andrade, R. V Theoretical and experimental investigations of a downdraft biomass gasifier-spark ignition engine power system. Renew. Energy 2012, 37, 97–108. [Google Scholar] [CrossRef]
  9. Gil, J.; Corella, J.; Aznar, M.P.; Caballero, M.A. Biomass gasification in atmospheric and bubbling fluidized bed: Effect of the type of gasifying agent on the product distribution. Biomass Bioenergy 1999, 17, 389–403. [Google Scholar]
  10. Shivapuji, A.M.; Dasappa, S. Analysis of thermodynamic scope engine simulation model empirical coefficients: Suitability assessment and tuning of conventional hydrocarbon fuel coefficients for bio syngas. Int. J. Hydrogen Energy 2017, 42, 16834–16854. [Google Scholar] [CrossRef]
  11. Couto, N.; Rouboa, A.; Silva, V.; Monteiro, E.; Bouziane, K. Influence of the biomass gasification processes on the final composition of syngas. Energy Procedia 2013, 36, 596–606. [Google Scholar] [CrossRef]
  12. Göransson, K.; Söderlind, U.; He, J.; Zhang, W. Review of syngas production via biomass DFBGs. Renew. Sustain. Energy Rev. 2011, 15, 482–492. [Google Scholar] [CrossRef]
  13. Shivapuji, A.M.; Dasappa, S. Influence of fuel hydrogen fraction on syngas fueled SI engine: Fuel thermo-physical property analysis and in-cylinder experimental investigations. Int. J. Hydrogen Energy 2015, 40, 10308–10328. [Google Scholar] [CrossRef]
  14. Tsiakmakis, S.; Mertzis, D.; Dimaratos, A.; Toumasatos, Z.; Samaras, Z. Experimental study of combustion in a spark ignition engine operating with producer gas from various biomass feedstocks. Fuel 2014, 122, 126–139. [Google Scholar] [CrossRef]
  15. Condition, O. Combustion and Heat Release Characteristics of Biogas under Hydrogen- and Oxygen-Enriched Condition. Energies 2017, 10, 1200. [Google Scholar] [CrossRef]
  16. Kosmadakis, G.M.; Rakopoulos, D.C.; Rakopoulos, C.D. Methane/hydrogen fueling a spark-ignition engine for studying NO, CO and HC emissions with a research CFD code. Fuel 2016, 185, 903–915. [Google Scholar] [CrossRef]
  17. Kosmadakis, G.M.; Moreno, F.; Arroyo, J.; Muñoz, M.; Rakopoulos, C.D. Spark-Ignition Engine Fueled with Methane-Hydrogen Blends. In Green Energy and Technology; Springer: Cham, Switzerland, 2016; Volume Part F2, pp. 405–420. [Google Scholar]
  18. Sahoo, B.B.; Sahoo, N.; Saha, U.K. Effect of engine parameters and type of gaseous fuel on the performance of dual-fuel gas diesel engines—A critical review. Renew. Sustain. Energy Rev. 2009, 13, 1151–1184. [Google Scholar] [CrossRef]
  19. Orbaiz, P.; Brear, M.J.; Abbasi, P.; Dennis, P.A. A Comparative Study of a Spark Ignition Engine Running on Hydrogen, Synthesis Gas and Natural Gas. SAE Int. J. Engines 2013, 6, 23–44. [Google Scholar] [CrossRef]
  20. Martinez, S.; Lacava, P.; Curto, P.L.; Irimescu, A.; Merola, S.S. Effect of Hydrogen Enrichment on Flame Morphology and Combustion Evolution in a SI Engine Under Lean Burn Conditions. In Proceedings of the SAE World 2018, Detroit, MI, USA, 10–12 April 2018; pp. 1–15. [Google Scholar]
  21. Peñaranda, A.; Martinez Boggio, S.D.; Lacava, P.T.; Merola, S.; Irimescu, A. Characterization of flame front propagation during early and late combustion for methane-hydrogen fueling of an optically accessible SI engine. Int. J. Hydrogen Energy 2018, 43, 23538–23557. [Google Scholar] [CrossRef]
  22. Uriz, I.; Arzamendi, G.; Diéguez, P.M.; Gandía, L.M. Chapter 17: Computational Fluid Dynamics as a Tool for Designing Hydrogen Energy Technologies; Elsevier: Amsterdam, The Nethelands, 2013; ISBN 978-0-444-56352-1. [Google Scholar]
  23. Merola, S.S.; Tornatore, C.; Irimescu, A.; Marchitto, L.; Valentino, G. Optical diagnostics of early flame development in a DISI (direct injection spark ignition) engine fueled with n-butanol and gasoline. Energy 2016, 108, 50–62. [Google Scholar] [CrossRef]
  24. Catapano, F.; Di Iorio, S.; Sementa, P.; Vaglieco, B.M. Analysis of energy efficiency of methane and hydrogen-methane blends in a PFI/DI SI research engine. Energy 2016, 117, 378–387. [Google Scholar] [CrossRef]
  25. Mustafi, N.N.; Miraglia, Y.C.; Raine, R.R.; Bansal, P.K.; Elder, S.T. Spark-ignition engine performance with “Powergas” fuel (mixture of CO/H2): A comparison with gasoline and natural gas. Fuel 2006, 85, 1605–1612. [Google Scholar] [CrossRef]
  26. Bika, A.S.; Franklin, L.; Kittelson, D.B. Homogeneous charge compression ignition engine operating on synthesis gas. Int. J. Hydrogen Energy 2012, 37, 9402–9411. [Google Scholar] [CrossRef]
  27. Hagos, F.Y.; Aziz, A.R.A.; Sulaiman, S.A.; Firmansyah, M.R. Effect of fuel injection timing of hydrogen rich syngas augmented with methane in direct-injection spark-ignition engine. Int. J. Hydrogen Energy 2017, 42, 23846–23855. [Google Scholar] [CrossRef] [Green Version]
  28. SMITH G. GRI-Mech 3.0. Gas Res Inst Des Chicago 2018. Available online: www.me.berkeley.edu/gri_mech (accessed on 10 July 2018).
  29. Natarajan, J.; Lieuwen, T.; Seitzman, J. Laminar flame speeds of H2/CO mixtures: Effect of CO2 dilution, preheat temperature, and pressure. Combust. Flame 2007, 151, 104–119. [Google Scholar] [CrossRef]
  30. Heywood, J.B. Internal Combustion Engines; McGraw-Hill: New York, NY, USA, 1988; Volume 39, ISBN 9781260116113. [Google Scholar]
  31. Irimescu, A.; Di Iorio, S.; Merola, S.S.; Sementa, P.; Vaglieco, B.M. Evaluation of compression ratio and blow-by rates for spark ignition engines based on in-cylinder pressure trace analysis. Energy Convers. Manag. 2018, 162, 98–108. [Google Scholar] [CrossRef]
  32. Irimescu, A.; Marchitto, L.; Silvia, S.; Tornatore, C.; Valentino, G. Evaluation of different methods for combined thermodynamic and optical analysis of combustion in spark ignition engines. Energy Convers. Manag. 2014, 87, 914–927. [Google Scholar] [CrossRef]
  33. Merola, S.S.; Sementa, P.; Tornatore, C.; Vaglieco, B.M. Spectroscopic Investigations and High Resolution Visualization of the Combustion Phenomena in a Boosted PFI SI Engine. SAE Int. J. Engines 2009, 2, 1617–1629. [Google Scholar] [CrossRef]
  34. Martinez, S.; Irimescu, A.; Merola, S.; Lacava, P.; Curto-Riso, P. Flame Front Propagation in an Optical GDI Engine under Stoichiometric and Lean Burn Conditions. Energies 2017, 10, 1337. [Google Scholar] [CrossRef]
  35. Marseglia, G.; Costa, M.; Catapano, F.; Sementa, P.; Vaglieco, B.M. Study about the link between injection strategy and knock onset in an optically accessible multi-cylinder GDI engine. Energy Convers. Manag. 2017, 134, 1–19. [Google Scholar] [CrossRef]
  36. Merola, S.S.; Marchitto, L.; Tornatore, C.; Valentino, G.; Irimescu, A. Optical characterization of combustion processes in a DISI engine equipped with plasma-assisted ignition system. Appl. Therm. Eng. 2014, 69, 177–187. [Google Scholar] [CrossRef]
  37. Martinez, S.; Merola, S.; Irimescu, A. Flame Front and Burned Gas Characteristics for Different Split Injection Ratios and Phasing in an Optical GDI Engine. Appl. Sci. 2019, 9, 449. [Google Scholar] [CrossRef]
  38. Heywood, J.B. Internal Combustion Engine Fundamentals; McGraw-Hill: New York, NY, USA, 1988; ISBN 0-07-028637-X 978-0-07-028637-5 0-07-100499-8 978-0-07-100499-2. [Google Scholar]
  39. Di Iorio, S.; Sementa, P.; Vaglieco, B.M. Analysis of combustion of methane and hydrogen-methane blends in small DI SI (direct injection spark ignition) engine using advanced diagnostics. Energy 2016, 108, 99–107. [Google Scholar] [CrossRef]
  40. Gomes, C.A.; da Costa, R.B.R.; Franco, R.L.; Valle, R.M.; Huebner, R. PIV Measurements of In-Cylinder Tumble Flow in a Motored Single Cylinder Optical Research Engine; SAE Technical Paper Series; SAE: Warrendale, PA, USA, 2015. [Google Scholar]
  41. Huang, R.F.; Huang, C.W.; Chang, S.B.; Yang, H.S.; Lin, T.W.; Hsu, W.Y. Topological flow evolutions in cylinder of a motored engine during intake and compression strokes. J. Fluids Struct. 2005, 20, 105–127. [Google Scholar] [CrossRef]
  42. Mandilas, C.; Ormsby, M.P.; Sheppard, C.G.W.; Woolley, R. Effects of hydrogen addition on laminar and turbulent premixed methane and iso-octane-air flames. Proc. Combust. Inst. 2007, 31, 1443–1450. [Google Scholar] [CrossRef]
  43. Ji, C.; Liu, X.; Wang, S.; Gao, B.; Yang, J. Development and validation of a laminar flame speed correlation for the CFD simulation of hydrogen-enriched gasoline engines. Int. J. Hydrogen Energy 2012, 38, 1997–2006. [Google Scholar] [CrossRef]
  44. Martínez-Boggio, S.D.; Curto-Risso, P.L.; Medina, A.; Hernández, A.C. Simulation of cycle-to-cycle variations on spark ignition engines fueled with gasoline-hydrogen blends. Int. J. Hydrogen Energy 2016, 41, 9087–9099. [Google Scholar] [CrossRef]
  45. Emadi, M.; Karkow, D.; Salameh, T.; Gohil, A.; Ratner, A. Flame structure changes resulting from hydrogen-enrichment and pressurization for low-swirl premixed methane–air flames. Int. J. Hydrogen Energy 2012, 37, 10397–10404. [Google Scholar] [CrossRef]
  46. Haq, M.; Sheppard, C.G.; Woolley, R.; Greenhalgh, D.; Lockett, R. Wrinkling and curvature of laminar and turbulent premixed flames. Combust. Flame 2002, 131, 1–15. [Google Scholar] [CrossRef]
  47. Driscoll, J. Turbulent premixed combustion: Flamelet structure and its effect on turbulent burning velocities. Prog. Energy Combust. Sci. 2008, 34, 91–134. [Google Scholar] [CrossRef]
  48. Kang, K.Y.; Baek, J.H. Turbulence characteristics of tumble flow in a four-valve engine. Exp. Therm. Fluid Sci. 1998, 18, 231–243. [Google Scholar] [CrossRef]
  49. Lipatnikov, A.N.; Li, W.Y.; Jiang, L.J.; Shy, S.S. Does Density Ratio Significantly Affect Turbulent Flame Speed? Flow Turbul. Combust. 2017, 98, 1153–1172. [Google Scholar] [CrossRef] [Green Version]
  50. Scurlock, A.C.; Grover, J.H. Propagation of turbulent flames. Symp. Combust. 1953, 4, 645–658. [Google Scholar] [CrossRef]
  51. Brequigny, P.; Halter, F.; Mounaïm-Rousselle, C.; Dubois, T. Fuel performances in Spark-Ignition (SI) engines: Impact of flame stretch. Combust. Flame 2016, 166, 98–112. [Google Scholar] [CrossRef]
  52. Demesoukas, S.; Brequigny, P.; Caillol, C.; Halter, F.; Mounaïm-Rousselle, C. 0D modeling aspects of flame stretch in spark ignition engines and comparison with experimental results. Appl. Energy 2016, 179, 401–412. [Google Scholar] [CrossRef]
  53. Ha, J.; Park, J.; Kwon, O.B.; Lim, I.G.; Yun, J.H.; Keel, S.I.; Park, H.Y.; Kim, T.H. Flame extinction in interacting CO-air and syngas-air premixed flames. J. Mech. Sci. Technol. 2015, 29, 419–428. [Google Scholar] [CrossRef]
Figure 1. (a) Experimental setup of the single cylinder PFI-SI research engine with an optical arrangement (camera and intensifier), and (b) cylinder head bottom view.
Energies 12 01566 g001
Figure 2. Duration of injection used for obtaining the different relative air-fuel ratio at 900 RPM, with SA −7 CAD ATDC and WOT.
Energies 12 01566 g002
Figure 3. Sketch of the image processing steps for the analysis of spark-ignited flame morphology.
Energies 12 01566 g003
Figure 4. (a) Schematic representation of the procedure used for measuring flame curvature, and (b) histogram representative of the curvature frequency distribution and related Gaussian fitting curve evaluated for methane in baseline conditions.
Energies 12 01566 g004
Figure 5. In-cylinder pressure traces averaged for stoichiometric fuelling (λ = 1.0) for: (a) 50% H2 blends and (b) 75% H2 blends, compared with methane.
Energies 12 01566 g005
Figure 6. In-cylinder pressure traces averaged for lean fuelling (λ = 1.4) for: (a) 50% H2 blends and (b) 75% H2 blends, compared with methane.
Energies 12 01566 g006
Figure 7. Indicated mean effective pressure for M, S50, S50D, and S75D at fixed SA (−7 CAD ATDC) and air-fuel dilution from 1.0 to 1.4.
Energies 12 01566 g007
Figure 8. Coefficient of variation of indicated mean effective pressure for M, S50, S50D, and S75D at fixed SA (−7 CAD ATDC) and air-fuel dilution from 1.0 to 1.4.
Energies 12 01566 g008
Figure 9. Fuel conversion efficiency average for M, S50, S50D and S75D at fixed SA (−7 CAD ATDC) and air-fuel dilution from 1.0 to 1.4.
Energies 12 01566 g009
Figure 10. Image sequence of flame evolution at the same flame area (5%, 10%, 20%, 30%, 50% and 60% of the piston cross-section) for a stoichiometric air-fuel ratio (λ = 1.0) with M, S50, and S50D fuelling.
Energies 12 01566 g010
Figure 11. Image sequence of flame evolution at the same flame area (5%, 10%, 20%, 30%, 50% and 60% of the piston cross-section) for a stoichiometric air-fuel ratio (λ = 1.0) with M, S75, and S75D fueling.
Energies 12 01566 g011
Figure 12. Image sequence of flame evolution at the same flame area (5%, 10%, 20%, 30%, 50% and 60% of the piston area) for a lean air-fuel ratio (λ = 1.4) with M, S50, and S50D fueling.
Energies 12 01566 g012
Figure 13. Image sequence of flame evolution at the same flame area (5%, 10%, 20%, 30%, 50% and 60% of the piston area) for a lean air-fuel ratio (λ = 1.4) with M, S75, and S75D fueling.
Energies 12 01566 g013
Figure 14. Average flame front evolution in terms of normalized area (cross-section piston area) and flame propagation speed for stoichiometric air-fuel ratio and five different fuels.
Energies 12 01566 g014
Figure 15. Average flame front evolution in terms of normalized area (cross-section piston area) and flame propagation speed for intermediate lean air-fuel ratio and five different fuels.
Energies 12 01566 g015
Figure 16. Average flame front evolution in terms of normalized area (cross-section piston area) and flame propagation speed for the leanest air-fuel ratio and five different fuels.
Energies 12 01566 g016
Figure 17. Maximum flame propagation speed obtained from average propagation speed data for all fuels and air-fuel ratios.
Energies 12 01566 g017
Figure 18. (a) Measured turbulent flame speed and calculated laminar flame speed and (b) the ratio between turbulent and laminar flame speed for the five different fuels at λ = 1.0 and engine like condition.
Energies 12 01566 g018
Figure 19. (a) Average Heywood Circularity Factor trend at stoichiometric air-fuel ratio (λ = 1.0) and (b) Maximum Heywood Circularity Factor for all air-fuel ratios.
Energies 12 01566 g019
Figure 20. (a) Average evolution of flame centroid with respect to the combustion chamber center at a stoichiometric air-fuel ratio (λ = 1.0) and (b) maximum centroid displacement in the vertical direction for all air-fuel ratios.
Energies 12 01566 g020
Figure 21. (a) Flame curvature, (b) average Heywood Circularity Factor, and (c) laminar flame speed in engine-like conditions for methane and real syngas mixtures at 10% and 30% flame sizes with respect to the piston area, during lean fueling (λ = 1.4).
Energies 12 01566 g021
Table 1. Specifications of the PFI SI single-cylinder research engine.
ParameterSize
Displaced volume530 cm3
Stroke90 mm
Bore82 mm
Connecting Rod144 mm
Compression ratio9.7
Clearance height1.5 mm
Top land height72 mm
Radial clearance Crevice volume Vcv 1.40.5 mm
Crevice volume 1.49.3 cm3
Table 2. Fuel composition on a volume basis.
Fuel.CH4 (%)H2 (%)CO (%)CO2 (%)N2 (%)
M1000000
S500505000
S50D025251535
S750752500
S75D037.512.51535
Table 3. Main properties of the fuels used for the study.
PropertiesMS50S50DS75S75D
LHV (MJ/kg)50.217.55.529.76.1
AFRst (kgair/kgfuel)17.24.591.448.111.73
Adiabatic Peak flame temp (K@1 atm)22232371200523731981
Laminar Flame Speed (m/s)0.351.230.521.770.73
H2/CO-1.01.03.03.0
H2 mass (%)06.72.117.83.7
DODvol%0050050
*1 atm, 293 K and stoichiometric condition.
Table 4. Mass fraction burned position for combustion ignition, kernel development and main phase with respect to the start of spark.
Fuelsλ5% (CAD ASOS)10% (CAD ASOS)50% (CAD ASOS)
M1.0131632
1.2131733
1.4162143
S501.05621
1.26825
1.47927
S50D1.091128
1.2101328
1.4131737
S751.03417
1.24517
1.45618
S75D1.07925
1.281124
1.4121636
Table 5. Exhaust gas emissions measured at lean condition (λ = 1.4).
FuelsCO (ppm)NOx (ppm)CH4 (ppm)
M5451013,824
S50155530760
S50D741920
S75117931150
S75D360320