Article

Improving Reliability Indices of the Autonomous Power System of Crete Island Utilizing Extended Photovoltaic Installations

by
Konstantinos Fiorentzis
1,
Antonios Tsikalakis
1,
Emmanuel Karapidakis
1,
Yiannis Katsigiannis
1,* and
George Stavrakakis
2
1
Department of Electrical and Computer Engineering, Hellenic Mediterranean University, GR-71004 Heraklion, Greece
2
School of Electrical and Computer Engineering, Technical University of Crete, University Campus, GR-73100 Chania, Greece
*
Author to whom correspondence should be addressed.
Energies 2020, 13(1), 64; https://doi.org/10.3390/en13010064
Submission received: 28 November 2019 / Revised: 10 December 2019 / Accepted: 19 December 2019 / Published: 21 December 2019

Abstract

:
Renewable energy sources (RES) have significantly helped in meeting the electricity demand of Crete, with their share in the energy balance to account for about 25% of the annual electricity production for the past five years. The contribution of photovoltaics (PVs) has been especially significant for the past three years, offering 10% in the peak demand, during summertime. This paper investigates what the capacity credit would be, i.e., up to what extent increasing existing PV capacity by about 20% can be considered as certain, to avoid installing thermal power units. In order to do so, probabilistic techniques have been applied to quantify the load that the installed thermal units in the Cretan power system should be able to meet at any time. In addition, the effect of the additional PV capacity to power system’s reliability is evaluated, introducing a new reliability index and taking into account actual data, regarding the planned and unplanned thermal units’ maintenance. Two scenarios have been examined using actual hourly data for load demand, PV, and wind production from the island power system of Crete. In the first scenario, the calculations were carried out considering the operation of the Cretan power system in its current state, while in the second scenario it was assumed that the PV production has been increased by 20%. Furthermore, we examine how the maximum value of capacity credit can be achieved as the PV installations are extended. In this regard, there is an upper limit of the additional PV capacity that leads to the maximum value of capacity credit.

1. Introduction

Investors all over the world have been increasingly interested in installations of generating units that utilize solar power to provide electricity. A higher capacity of photovoltaic (PV) installations was installed globally compared to any other power generation technology in the last two years (2017, 2018), including large hydro and wind power technologies According to a recent study [1], 102.4 GW of grid-connected PV capacity was installed during 2018, as much PV capacity as the world had been cumulatively installed by the end of 2012 (100.9 GW). As a result, the total capacity reached 500 GW. It is estimated that the world’s solar PV capacity could exceed 1 TW by the end of 2022 [1]. Solar thermal installations have also gained interest [2] with installations in Spain [3] and North Africa countries [4] utilizing mainly hybrid natural gas-solar thermal generating units. Recorded progress [5] has been significant both in solar collectors [6] and the optimization of thermodynamic cycles for hybrid power stations of solar thermal and gas turbines [7,8]. However, such installations cannot be as much widespread in any power system as PVs as they are not modular with the exception of solar dishes [9] and face more sitting constraints than PVs. This is the reason for focusing on PVs and their potential reliability impact on island power systems like Crete.
There have been numerous studies regarding the potential benefits of PVs already since 90′s. In [10] the value of PVs for voltage support, loss, and peak reduction, distribution systems are studied while comparisons are made with the conventional and widely used methods for voltage control and loss minimization. In another study [11], the value of PVs for society have been examined from both the consumer and the utility perspective, claiming that the decentralized PV systems have a higher value for the society due to the fact that the customers are involved in their own electricity supply. Generally, the presence of solar electricity resources, such as any other distributed generation, can eliminate or delay the need for investments on transmission or distribution grid level [12]. According to a past study [13], strategically sited PVs provide grid support to substation transformers by reducing their oil temperature due to the lower demand caused by PV.
PVs have greatly helped in electrifying rural areas such as in middle northeast Africa and southeast Asia countries [14], Honduras [15], and desert regions [16], as an alternative to grid extension or fossil fuels. In regions such as Crete and the Australian States of South Australia [17], the match between PV generation and peak load demand during summer period can lead to peak load shaving, which provides reliable network benefits. PV systems can also help reduce peak load demand in end user level and thus reduce the electricity bill [18], even utilizing building-integrated photovoltaics in warm and sunny climates [19]. In another study [20], roof integrated PVs have been applied as a peak electric load reduction strategy. In the island power system of Crete, the installed PV capacity has already reached 98.67 MW [21]. It has been noted that about 10% of the peak demand at each month of the summer period coincided with the annual peak demand and is met by PVs equivalent to two expensive gas turbines. A probabilistic methodology for the economic evaluation of PVs has been presented by some of the authors for Crete [22] and Cyprus [23]. Especially for Crete, the annual benefit in terms of fuel costs has been estimated at more than 100 €/kWp.
Net-metering and virtual net-metering are alternative mechanisms to feed-in-tariffs of small-scale photovoltaics, especially for the public sector. Until now, net-metering installations are 3.6 MW, but due to the interest of many parties, net-metering is expected to hold an active role in the coming years especially in the energy balance of Crete. More precisely, the region of Crete and all the municipalities of the island have decided coordinated application of an integrated plan of PV installations, as a means for reducing their own electricity consumption and the associated energy costs estimated at 150 €/kW-per year [24]. Therefore, in view of the increase of the installed capacity of PVs at about 20% of the currently installed capacity via the legislative framework of net-metering and virtual net-metering, with the active participation of the island’s public authorities, it would be interesting to investigate to what extent this additional PV capacity could replace firm capacity from thermal units. Such an assessment has been proposed for wind power for both microgrids [25] and large power systems [26]. However, the highest level of capacity credit that could be reached by increasing the solar generation plant capacity over the years cannot be answered. Under this perspective, the maximum PV capacity that could be installed to the power system of Crete succeeding the highest level of capacity credit still needs to be determined.
Additionally, the impact of PV generation on various reliability indices for the power system of Crete, such as expected energy not supplied (EENS), loss of load probability (LOLP) will be investigated to show the potential impact of PVs on the generation adequacy of the power system of Crete. Additionally, the methodology applied cannot only quantify the additional firm capacity that is required for obtaining 99.9999% generation adequacy for the island of Crete but to identify under which operating conditions and combinations this may be required. Such information can be very useful for the operator of a power system in order to perhaps rent generation capacity or apply the most appropriate demand side management (DSM) measurements [27,28].
The following methodology has been based on probabilistic techniques and actual data from the island power system of Crete, utilizing MATLAB software. Demand and RES generation have been modeled as random variables while well-known generation adequacy assessment techniques based on forced outage rate (FOR) have been applied. This methodology applies per group of hours and months to account for the inherent seasonal and daily variability of PV generation based also on similar approach, presented by some of the authors [22]. More details on this methodology have been described in Section 2. More details on the power system of Crete are provided in Section 3 and results from this analysis are provided in Section 4, either with or without considering installation of the additional PV capacity. Finally, conclusions are drawn in Section 5.

2. Methodology Followed

This section describes the methodology followed for the estimation of the capacity credit of the additional PV capacity along with their contribution in reducing EENS and improving other reliability indices, as far as generation adequacy is concerned. In order to evaluate these parameters, probabilistic techniques have been used. The analysis has been made by grouping actual hourly data for load demand, PV, and wind power production from the island power system of Crete for the last three years (2016, 2017, and 2018), per month (mo), and per hour type (hr) in order to derive corresponding random variables probability density functions (PDF). The proposed methodology consists of two steps.

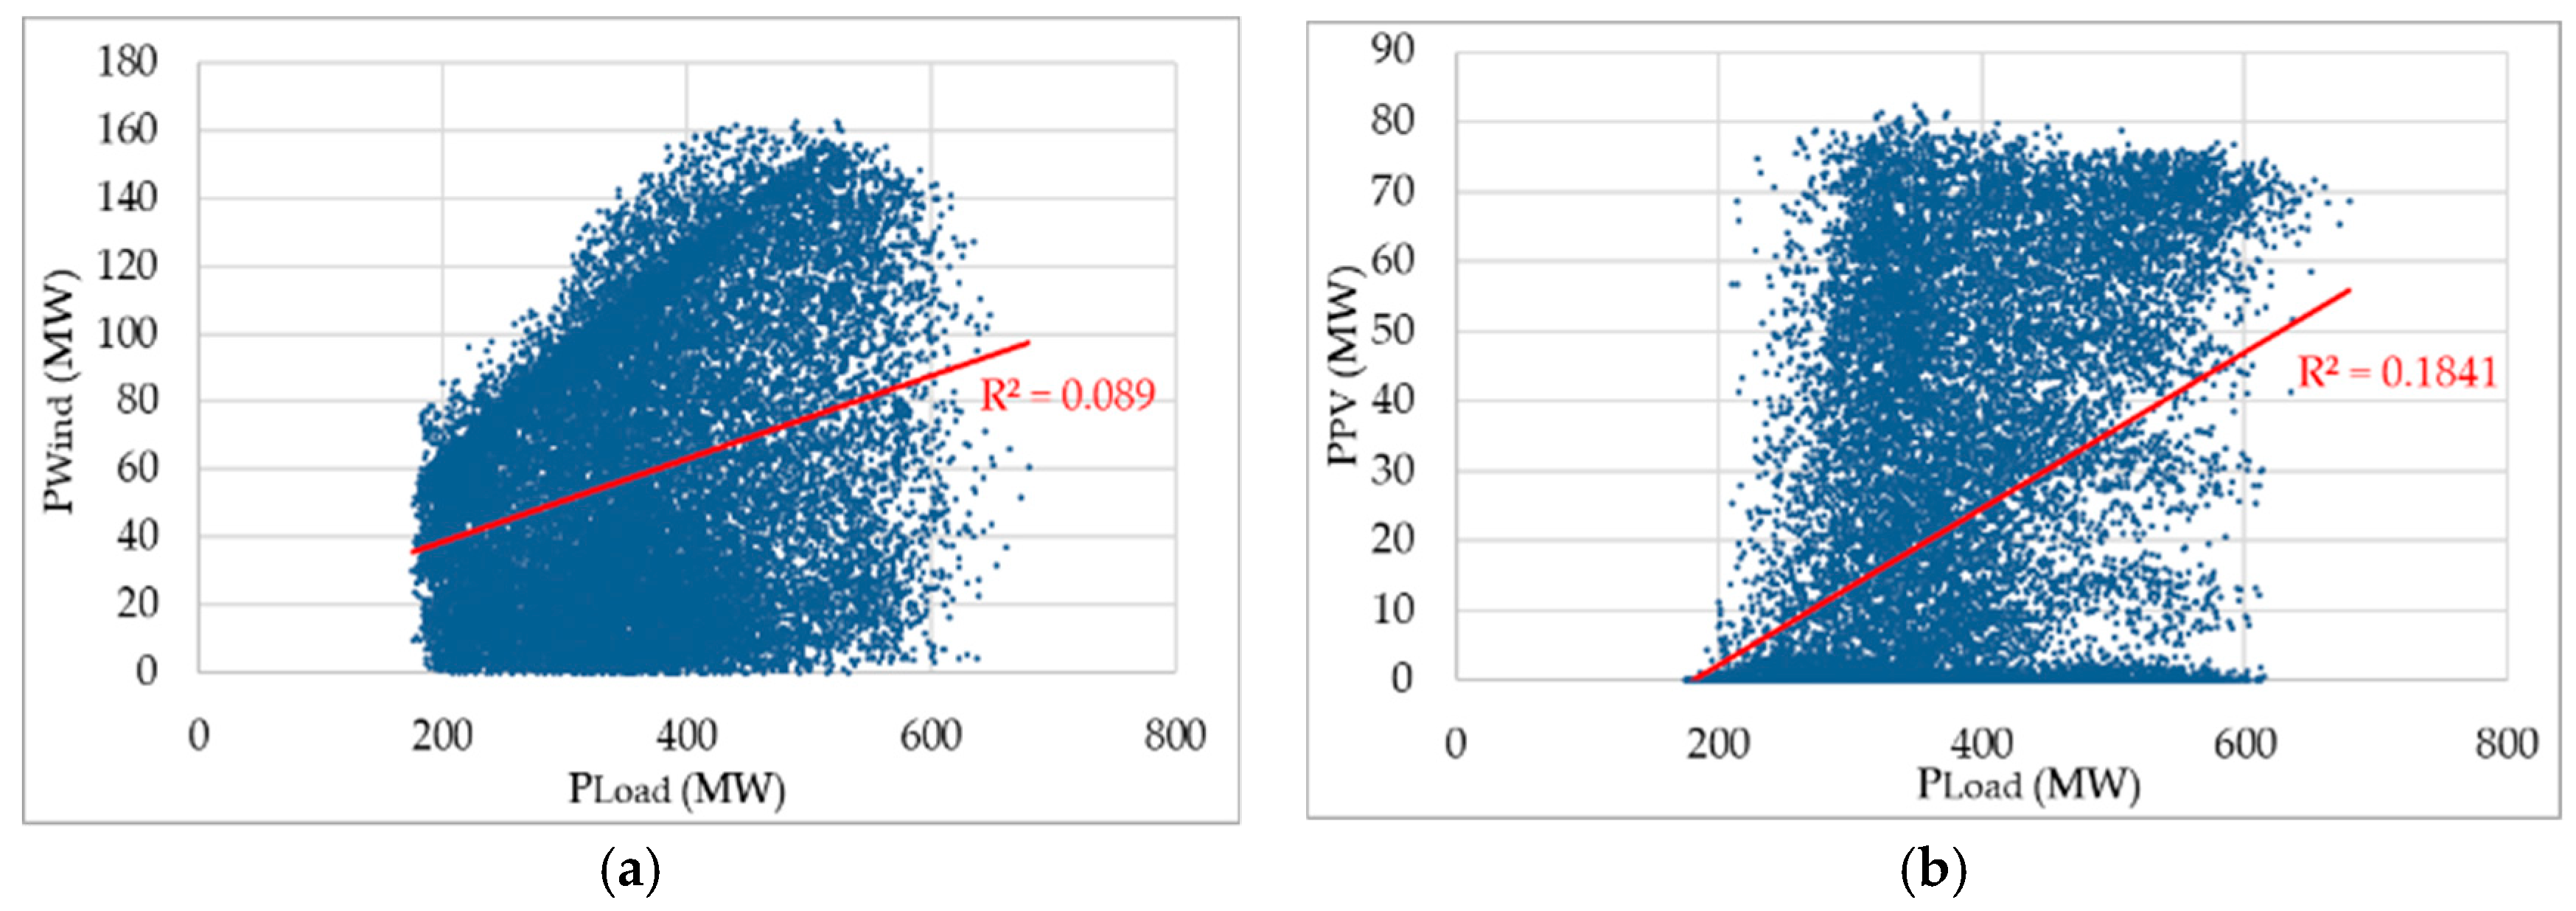
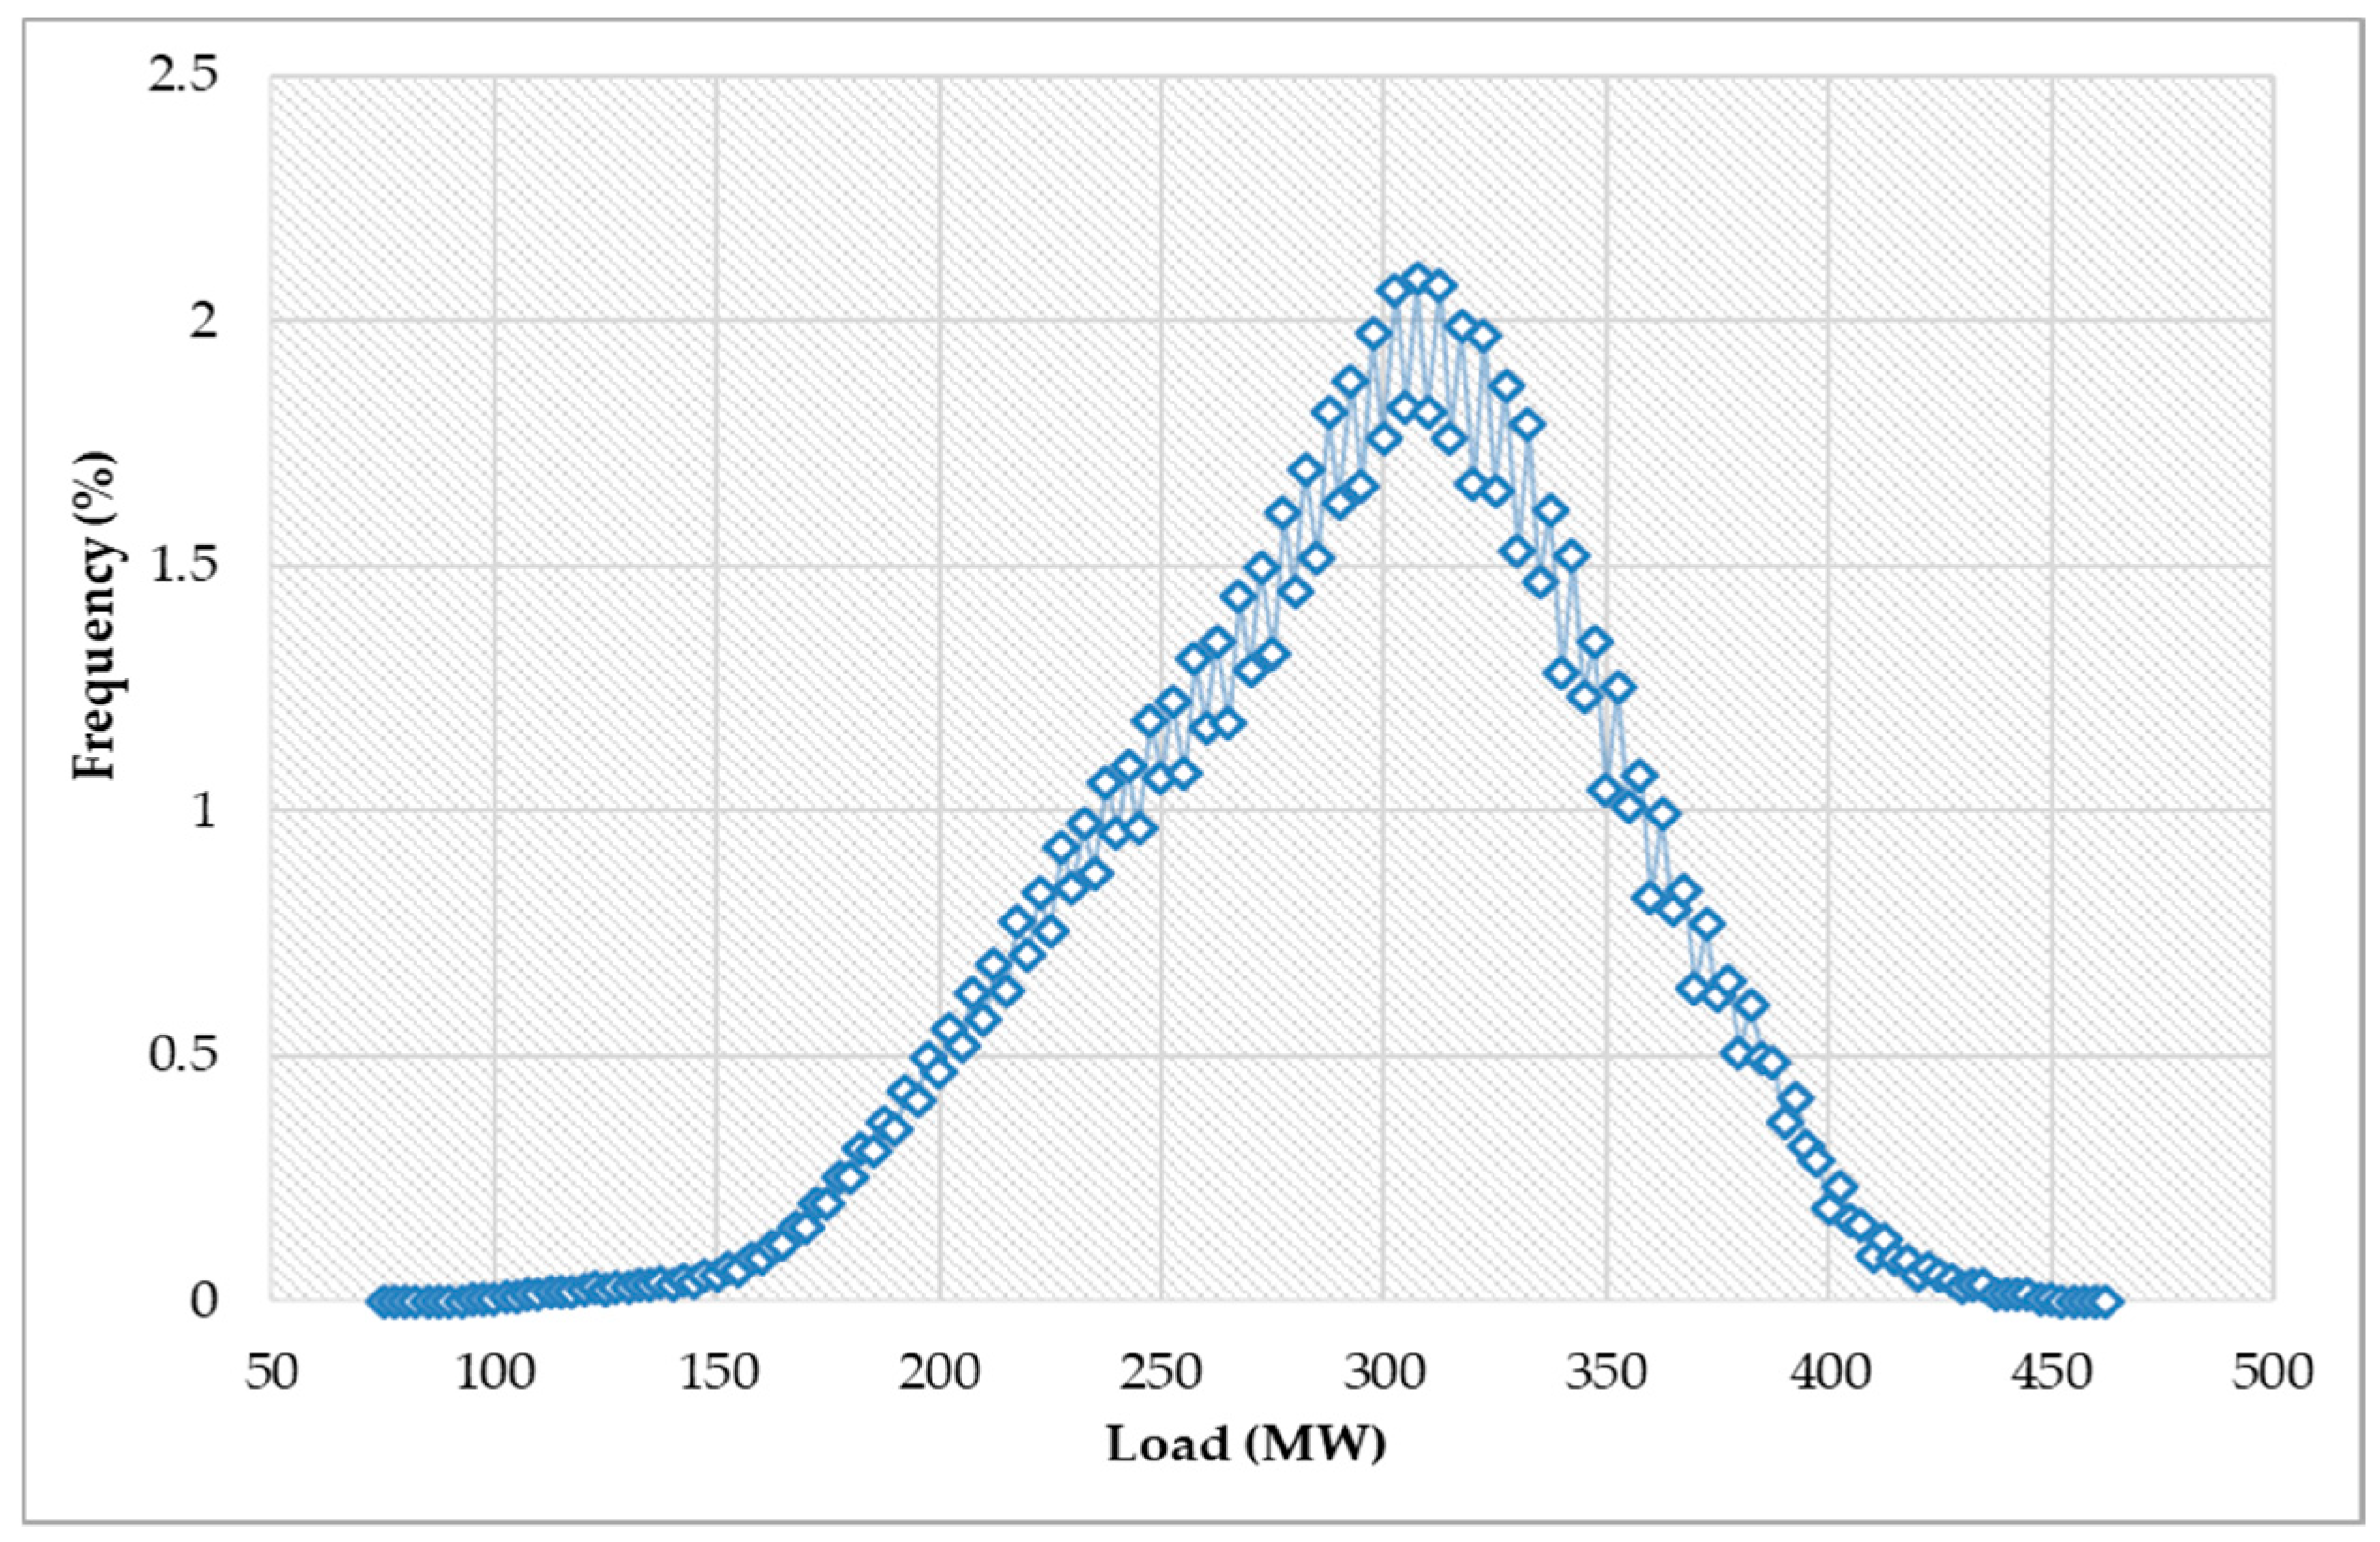
2.1. Derivation of the Expected Thermal Generation Probability Density Function (PDF)

In Crete, as in most island power systems, a single buyer model and feed-in tariff schemes apply. In such a case, the load to be distributed to the thermal units of the power system is provided by Equation (1):
P T h _ u n i t s = P L o a d P W i n d P P V
where PLoad is the actual load demand while PWind and PPV are the wind parks and PV production. The load that the installed thermal unit in the Cretan power system should be able to meet at any time varies. The season or more specifically the month of the year and the type of the day are two important factors that cause significant fluctuations in hourly load demand and RES production. Therefore, this is why the data and hence the results are classified per month and per hour. However, the load to be distributed to the thermal units cannot be accurately estimated as load demand varies considerably over time and weather conditions change. Figure 1 verifies that the examined actual hourly data of load demand (PLoad) and RES generation (PWind, PPV) of the power system of Crete are very lowly correlated. Thus, it is confirmed that the corresponding PDFs PLoad(mo,hr), PWind(mo,hr), and PPV(mo,hr) can be safely considered as independent random variables.
According to the examined hourly data for load demand, PV, and wind power production from the power system of Crete, PTh_units cannot be lower than 0 MW, either for the current conditions or for the basic scenario of additional 20% of PVs. There is almost negligible probability that this will be lower than zero for specific hours in March combined with significant wind power generation probability if the PV capacity reaches 55 MW. In any case, in order to assure that no violation of the technical minimum of the generation units is expected, RES curtailment will take place. This is a policy already followed by the operator of the power system for wind power [29], but under circumstances PV power rejection can be also applied, as there are not yet energy storage systems in Cretan power system. Nevertheless, there have been several studies regarding the installation of energy storage systems on the island power system of Crete such as batteries and large pumped hydro storage systems [30]. In any case, the proposed probabilistic methodology can identify how probable such issues are expected to be in Crete and in any other system.
In this study, the estimation of the random variable representing the load to be served by the conventional units PTh_units, is obtained, as described in Equation (2), as a result of the convolution of the independent pdfs PLoad(mo,hr), PWind(mo,hr), and PPV(mo,hr) [31].
P T h _ u n i t s ( m o , h r ) = P L o a d ( m o , h r ) P W i n d ( m o , h r ) P P V ( m o , h r )
These PDFs have been extracted from hourly data of these three years, defining discrete steps of demand or production for each month and hourly type. The steps for the purposes of this paper are defined as:
  • 10 MW for PLoad(mo,hr)
  • 5 MW for PWind(mo,hr)
  • 2.5 MW for PPV(mo,hr)
The frequency bins for Equation (2) are provided by Equation (3).
f T h _ u n i t s ( m o , h r ) = f L o a d ( m o , h r ) × f W i n d ( m o , h r ) × f P V ( m o , h r )
A typical graph for the final PTh_units(mo,hr) PDF is shown in Figure 2.

2.2. Reliability and Forced Outage Rate

All conventional units of any power system are subject to several random unplanned outages. Generation adequacy of a power system is the assessment of the ability of the conventional units to meet the consumption of the power system, based on reliability indices. The simplest stochastic method for considering the reliability of a production unit is the two-state model [31], provided by Equation (4). This model defines two possible states for each unit. Each generation unit may be either capable of producing at its rated power or not available due to a failure, each case with a corresponding probability. The probability of the unit being available is pi, while the probability of being unavailable is qi, which is called the forced outage rate (FOR):
p i + q i = 1
Therefore, taking into account FOR and PTh_units(mo,hr), a new PDF PLoad_loss (mo,hr), related to the load that available units cannot meet, is calculated by an iterative algorithm.
The system reliability based on generation adequacy can be evaluated, examining this new PDF. EENS, LOLP, and loss of load expectation (LOLE) [32] represent reliability indices. EENS defined by Equation (5) and is a measure of the amount of energy demand, which is expected not to be met by thermal units during a specified time period.
EENS = 0 n P L o a d _ l o s s ( t ) d t
LOLP expresses the case when the available generating capacity exceeds the expected demand. It is a projected value of how high the probability is, in the long run, of the load of a power system is expected to exceed the capacity of the available generating resources. LOLE defines the time for which the load demand is expected to exceed the available capacity within a specified time period (T) and is given by (6).
LOLE ( m o , h r ) = LOLP ( m o , h r ) × T
The need to examine the load demand that cannot be served by the thermal, for a specified time period, thus led to the definition of a new reliability index. Therefore, a new index LWLOLE (load with LOLE) is introduced in this paper and defined by Equation (7), which represents the maximum value of load expected not to be supplied for duration longer than 0.1 s, corresponding to an availability of less than 99.9999%,“ six nines” [33]. This will show how easy it is for the generation system to adapt to the generation shortage, e.g., by renting gen-sets, by demand reduction, by generation expansion, or combination of actions.
LWLOLE ( m o , h r ) = LOLE ( m o , h r ) >   0.1 s e c
As was mentioned, the results of this study have been classified per month and per hour type. Thus, 0.1 s of interrupted power of a specific month and hour correspond to 9.26 × 10⁻⁵% unavailability and 99.9999% availability, given by Equations (8) and (9), respectively. (there are 108,000 s in a month for an hour type).
Unavailability = 0.1 sec 108 , 000 sec = 9.26 × 10 5 %
Availability = 100 % 9.26 × 10 5 % = 99.9999 %

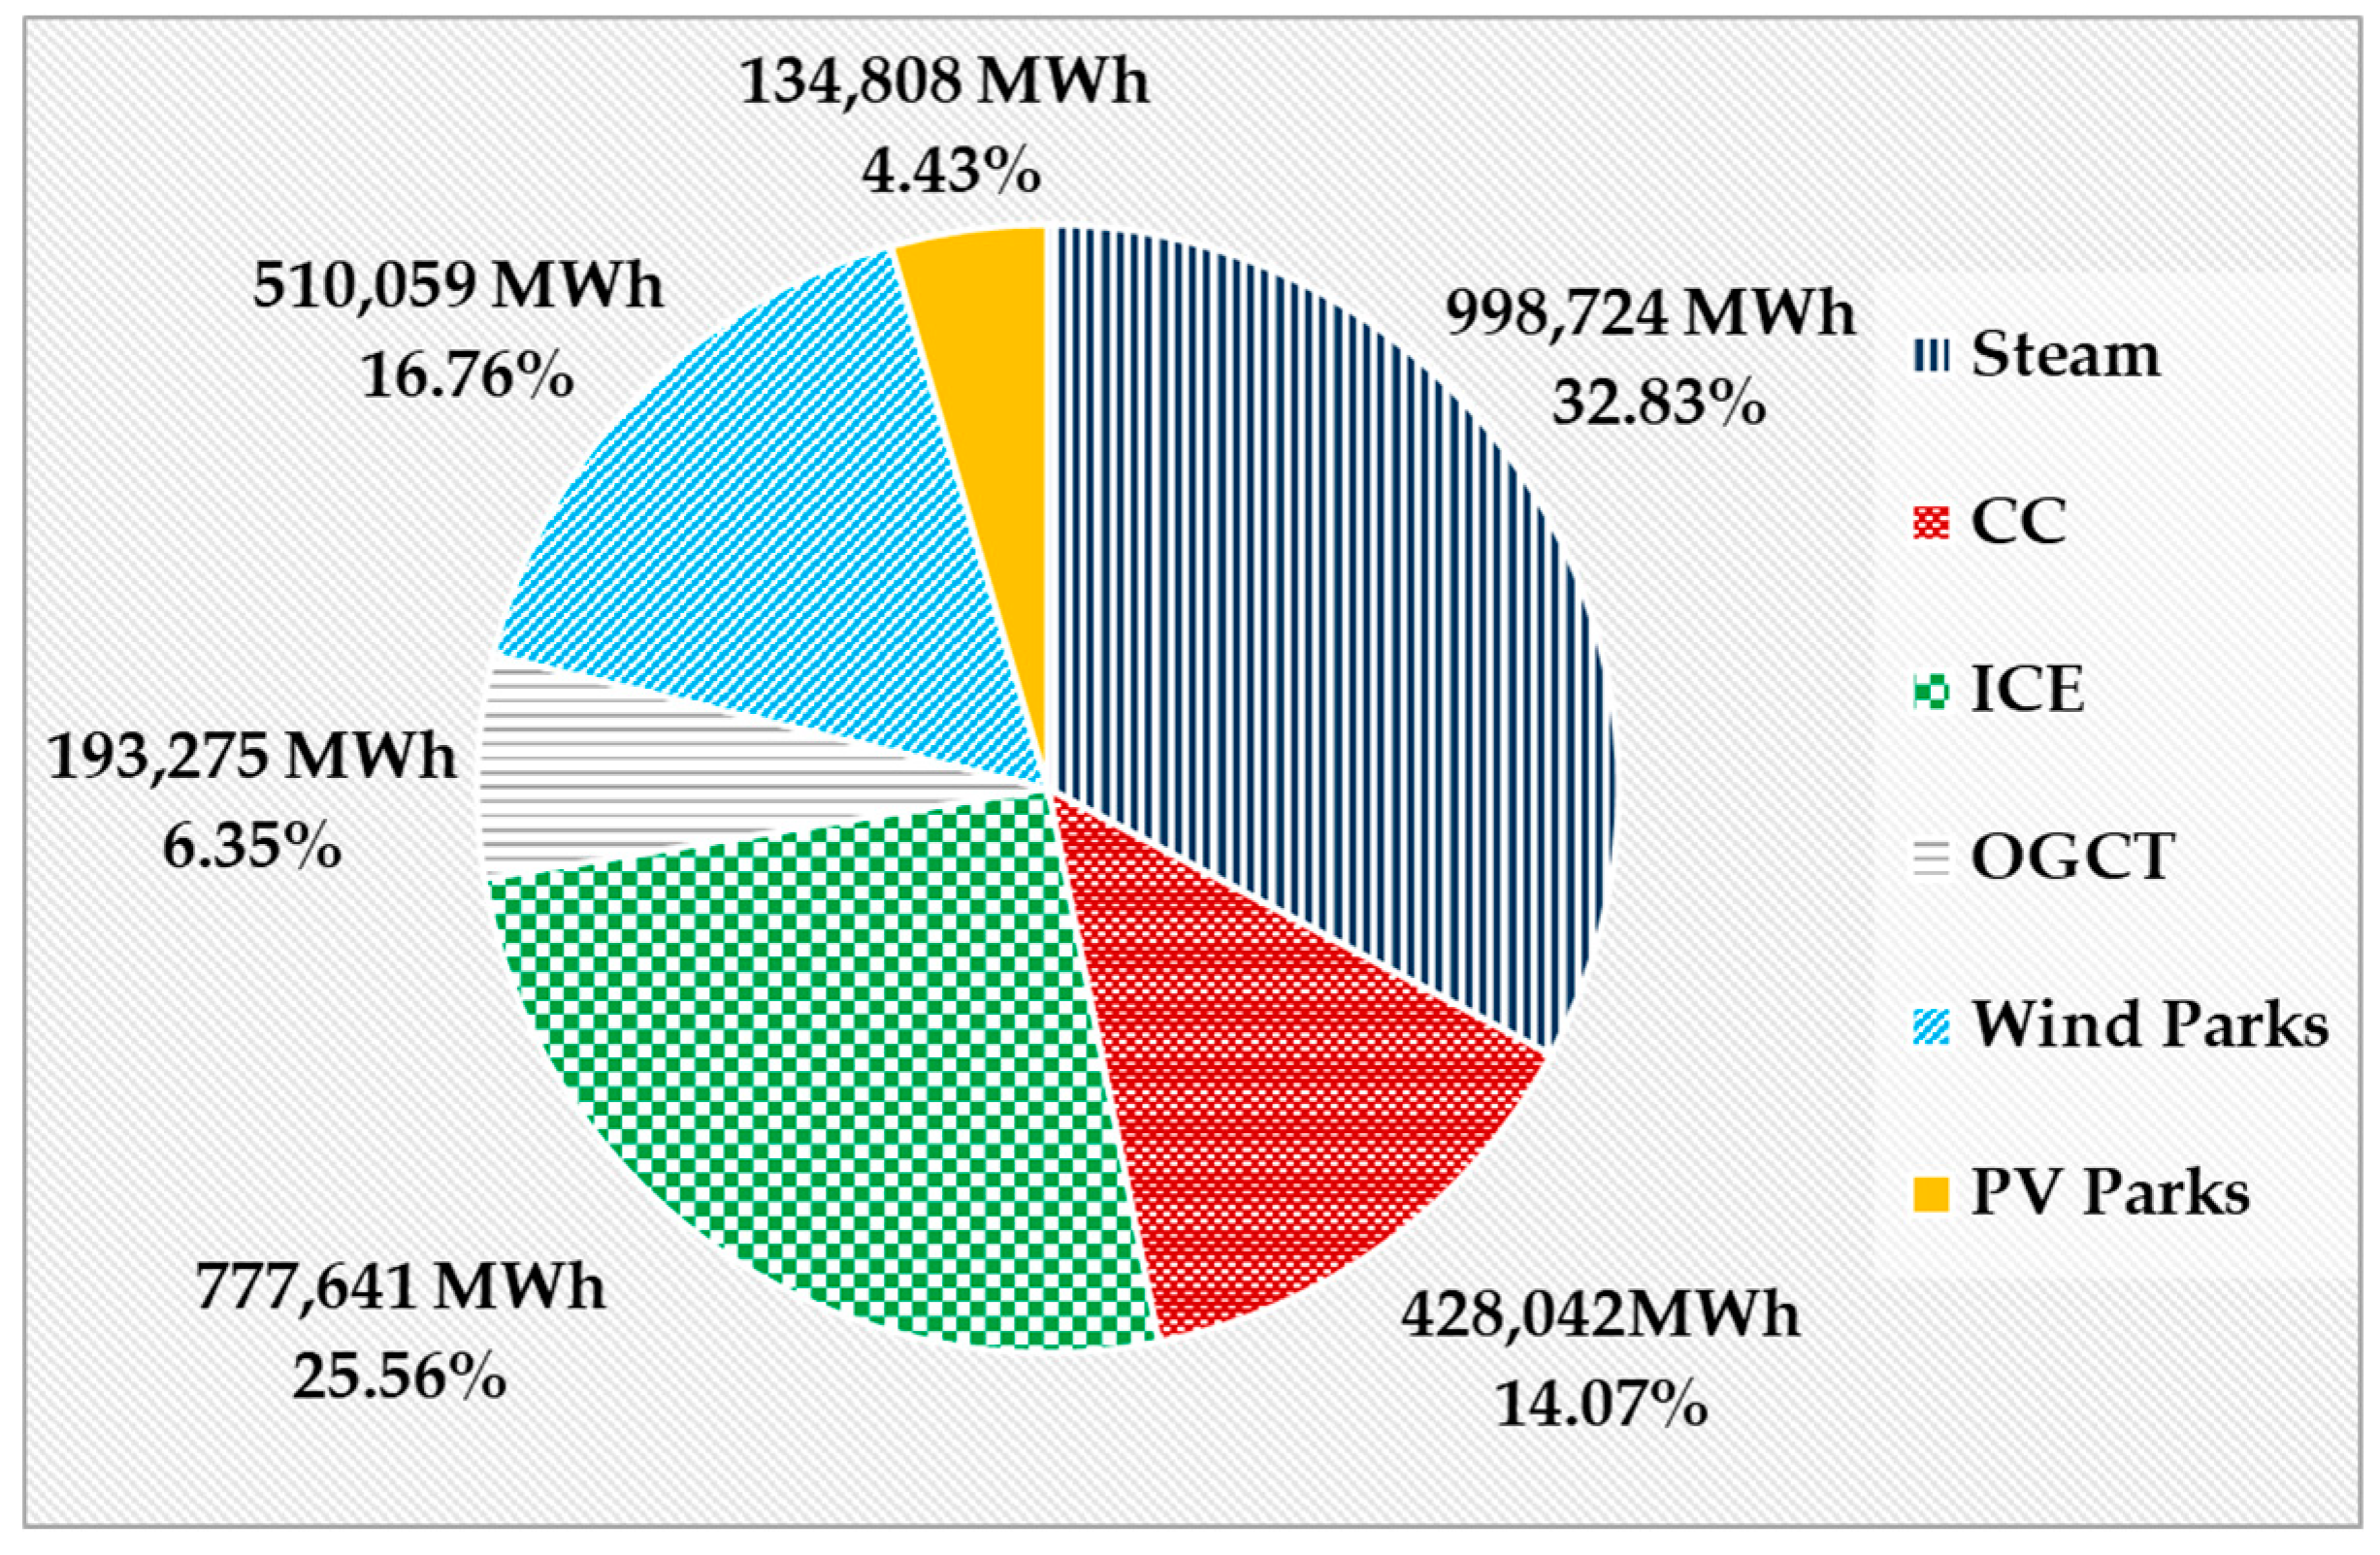
3. The Power System of Crete

Crete is the largest Greek island and the fifth largest island in the Mediterranean Sea. Crete has population of 623,065 people [34]. The population significantly increases during the summer due to tourists influencing the peak demand.
The island of Crete has the largest autonomous power system in Greece with instantaneous peak demand that has reached 707 MW and annual energy demand of 3.2 TWh [21].
A large number of conventional units with different technologies and response characteristics (steam turbines, Internal Combustion Engines (ICE), Open Cycle Gas Turbines (OCGT), and one combined cycle (CC) unit with total capacity of 824.8 MW have been installed in three power stations, namely Xylokamara, Linoperamata and Atherinolakos, on the island as is depicted in Figure 3. In Table 1, the capacity per unit type and power station is provided [35].
Crete is among the regions with the highest solar potentials in Europe, reaching up to 2100 kWh/m2/yr, and also high average wind speed that in many locations exceeds 8.5 m/s. These characteristics make the island an ideal place for the installation of wind and solar technologies [36]. There are more than 1000 small PV parks (mainly of 80 kW each) and 1800 roof PVs (≤10 kW, of about 17 MW) installed. Only five PV parks have capacity higher than 100 kW with a total capacity of about 0.9 MW. The largest has a capacity of 0.3 MW [37]. There are also 38 wind parks with total installed capacity about 200 MW. Currently, the total installed capacity of the RES stations amounts to 296 MW and it is also estimated the development of new RES stations such as hybrid stations, solar thermal stations, and biomass stations. In 2017, the total yearly RES generation amounted to 652.9 GWh, while in 2018 to 644.9 GWh.
The energy production balance of Crete is as shown in Figure 4 [21]. More details about the distribution of demand in each one of the four prefectures of the island can be found in [38].
The latest overview of the autonomous power system of Crete is based on actual operational data from the SCADA system of HEDNO SA. Only for 46 h load demand exceeded 600 MW, while for 942 h the load exceeded 500 ΜW. In Figure 5, the load duration curve for PTh_units of the Cretan Power System for the year 2018 is presented showing that only for 88 h, i.e., for 1% of the year, 520 MW of thermal capacity would be necessary to operate. However, the maximum actual demand to be served by the thermal units, as derived by Equation (2), has a small but not negligible possibility to be as high as 630 MW.

4. Results

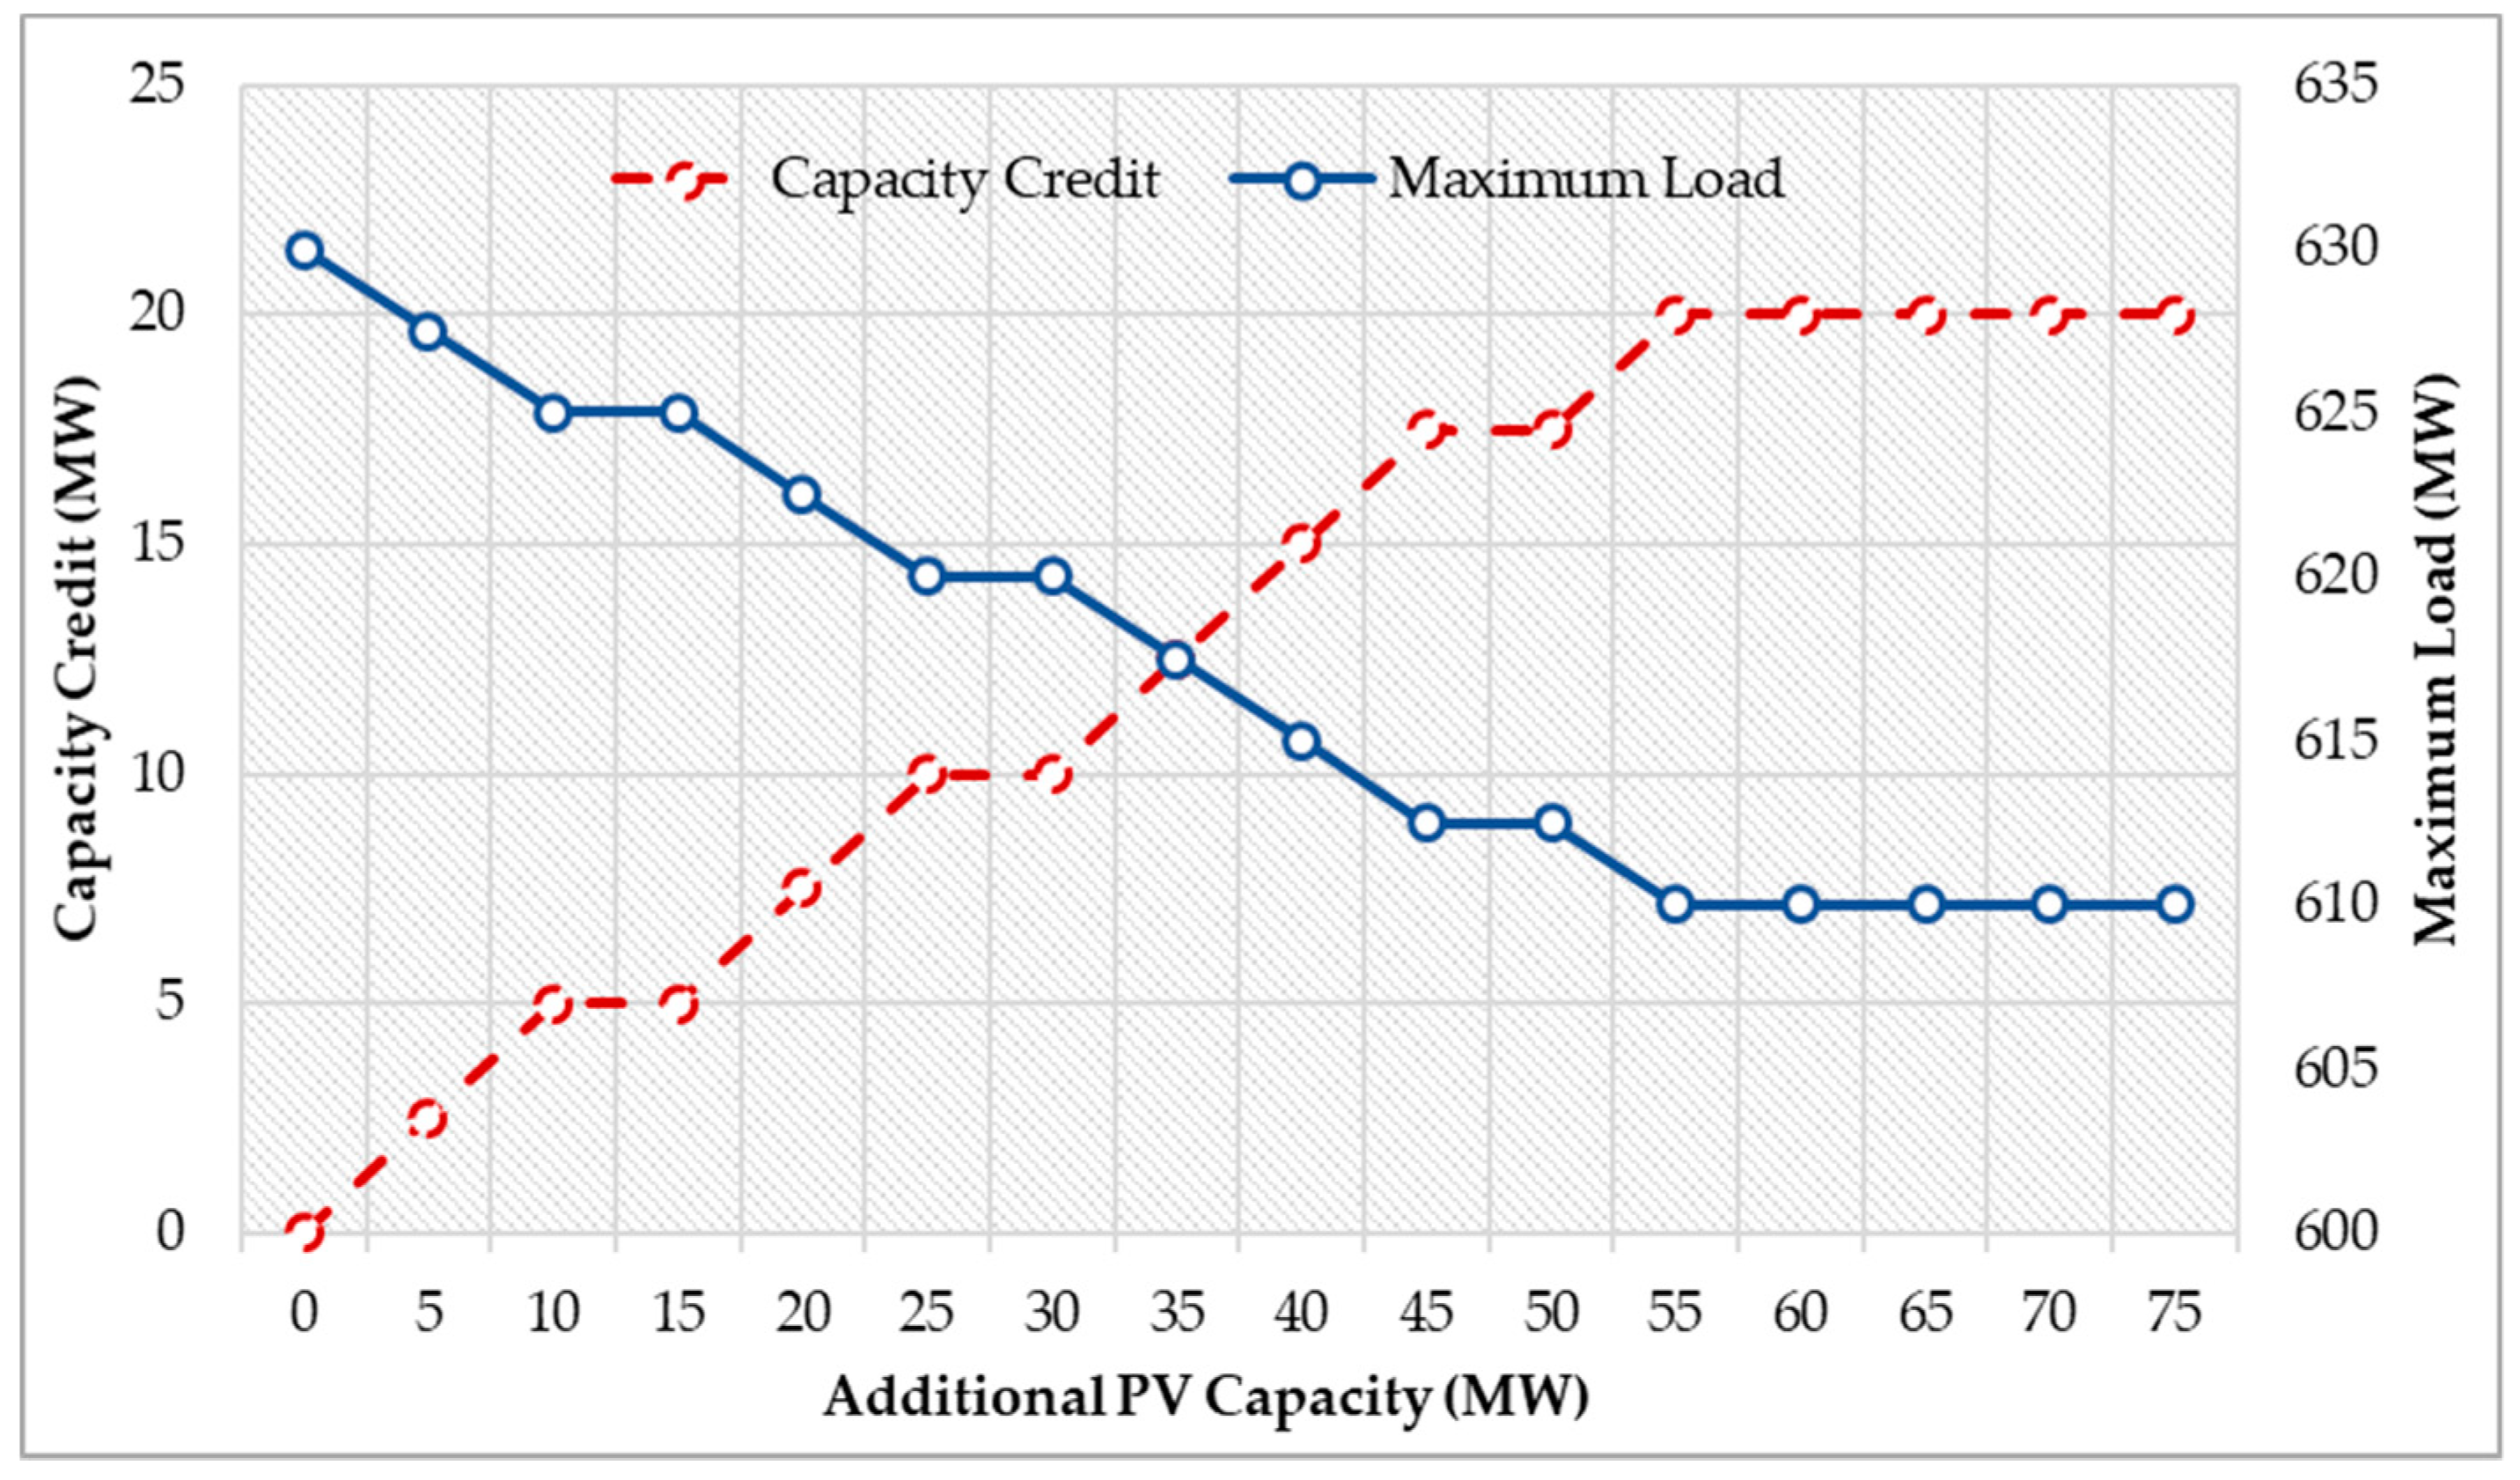
4.1. Capacity Credit Estimation

Examining the results from applying the first part of the methodology (Section 2.1), the effect of 20 MW additional capacity, which is the limit for additional PV capacity provided by the Regulatory Authority of Energy of Greece, is evaluated. This additional capacity decreases the load that the thermal units have to meet for some hours of the day, as well as manages to decrease the maximum monthly capacity required especially during the summer months. Figure 6 depicts the probability that the demand to be met by thermal units is expected to be higher than 600 MW, considering the additional installation of PVs. July has the highest reduction (−24.23%) regarding this criterion, while in June the difference between the two states is almost negligible. In June, in particular in the second half of June, values of load demand greater than 600 MW have been observed, during 20:00–22:00, which is a time period that the solar PV plants cannot marginally contribute to the total generation.
According to the Table 2, the maximum load that thermal units have to meet is by 7.5 MW lower than the respective in the current state of Cretan power system. This load corresponds to the peak demand that the thermal units of the system are expected to meet, thus is estimated that 7.5 MW capacity of firm thermal units could be replaced, because of the additional capacity of PVs.
As stated by Table 2, the peak load demand has been observed in July during 14:00–15:00. By adding PV installations to the system, the required thermal generation keeps decreasing, but up to a certain extent, as the PVs can contribute only during the daytime. PV installation may finally lead to shift the peak load for the thermal units to early night hours, no matter how much their capacity is increased. Figure 7 depicts how the capacity credit and the maximum load to be met by thermal units, are changing through the increment of PV capacity.
The examined variables of capacity credit and maximum load change as the PV capacity is increased, but up to the extent of 55 MW of additional PV installations. In that instance, the maximum capacity credit that can be achieved, reaches the value of 20 MW and as a result the maximum load to be met by thermal units decreases to 610 MW. This maximum load is also observed in July during 20:00–22:00, in case the additional PV capacity exceeds 55 MW.

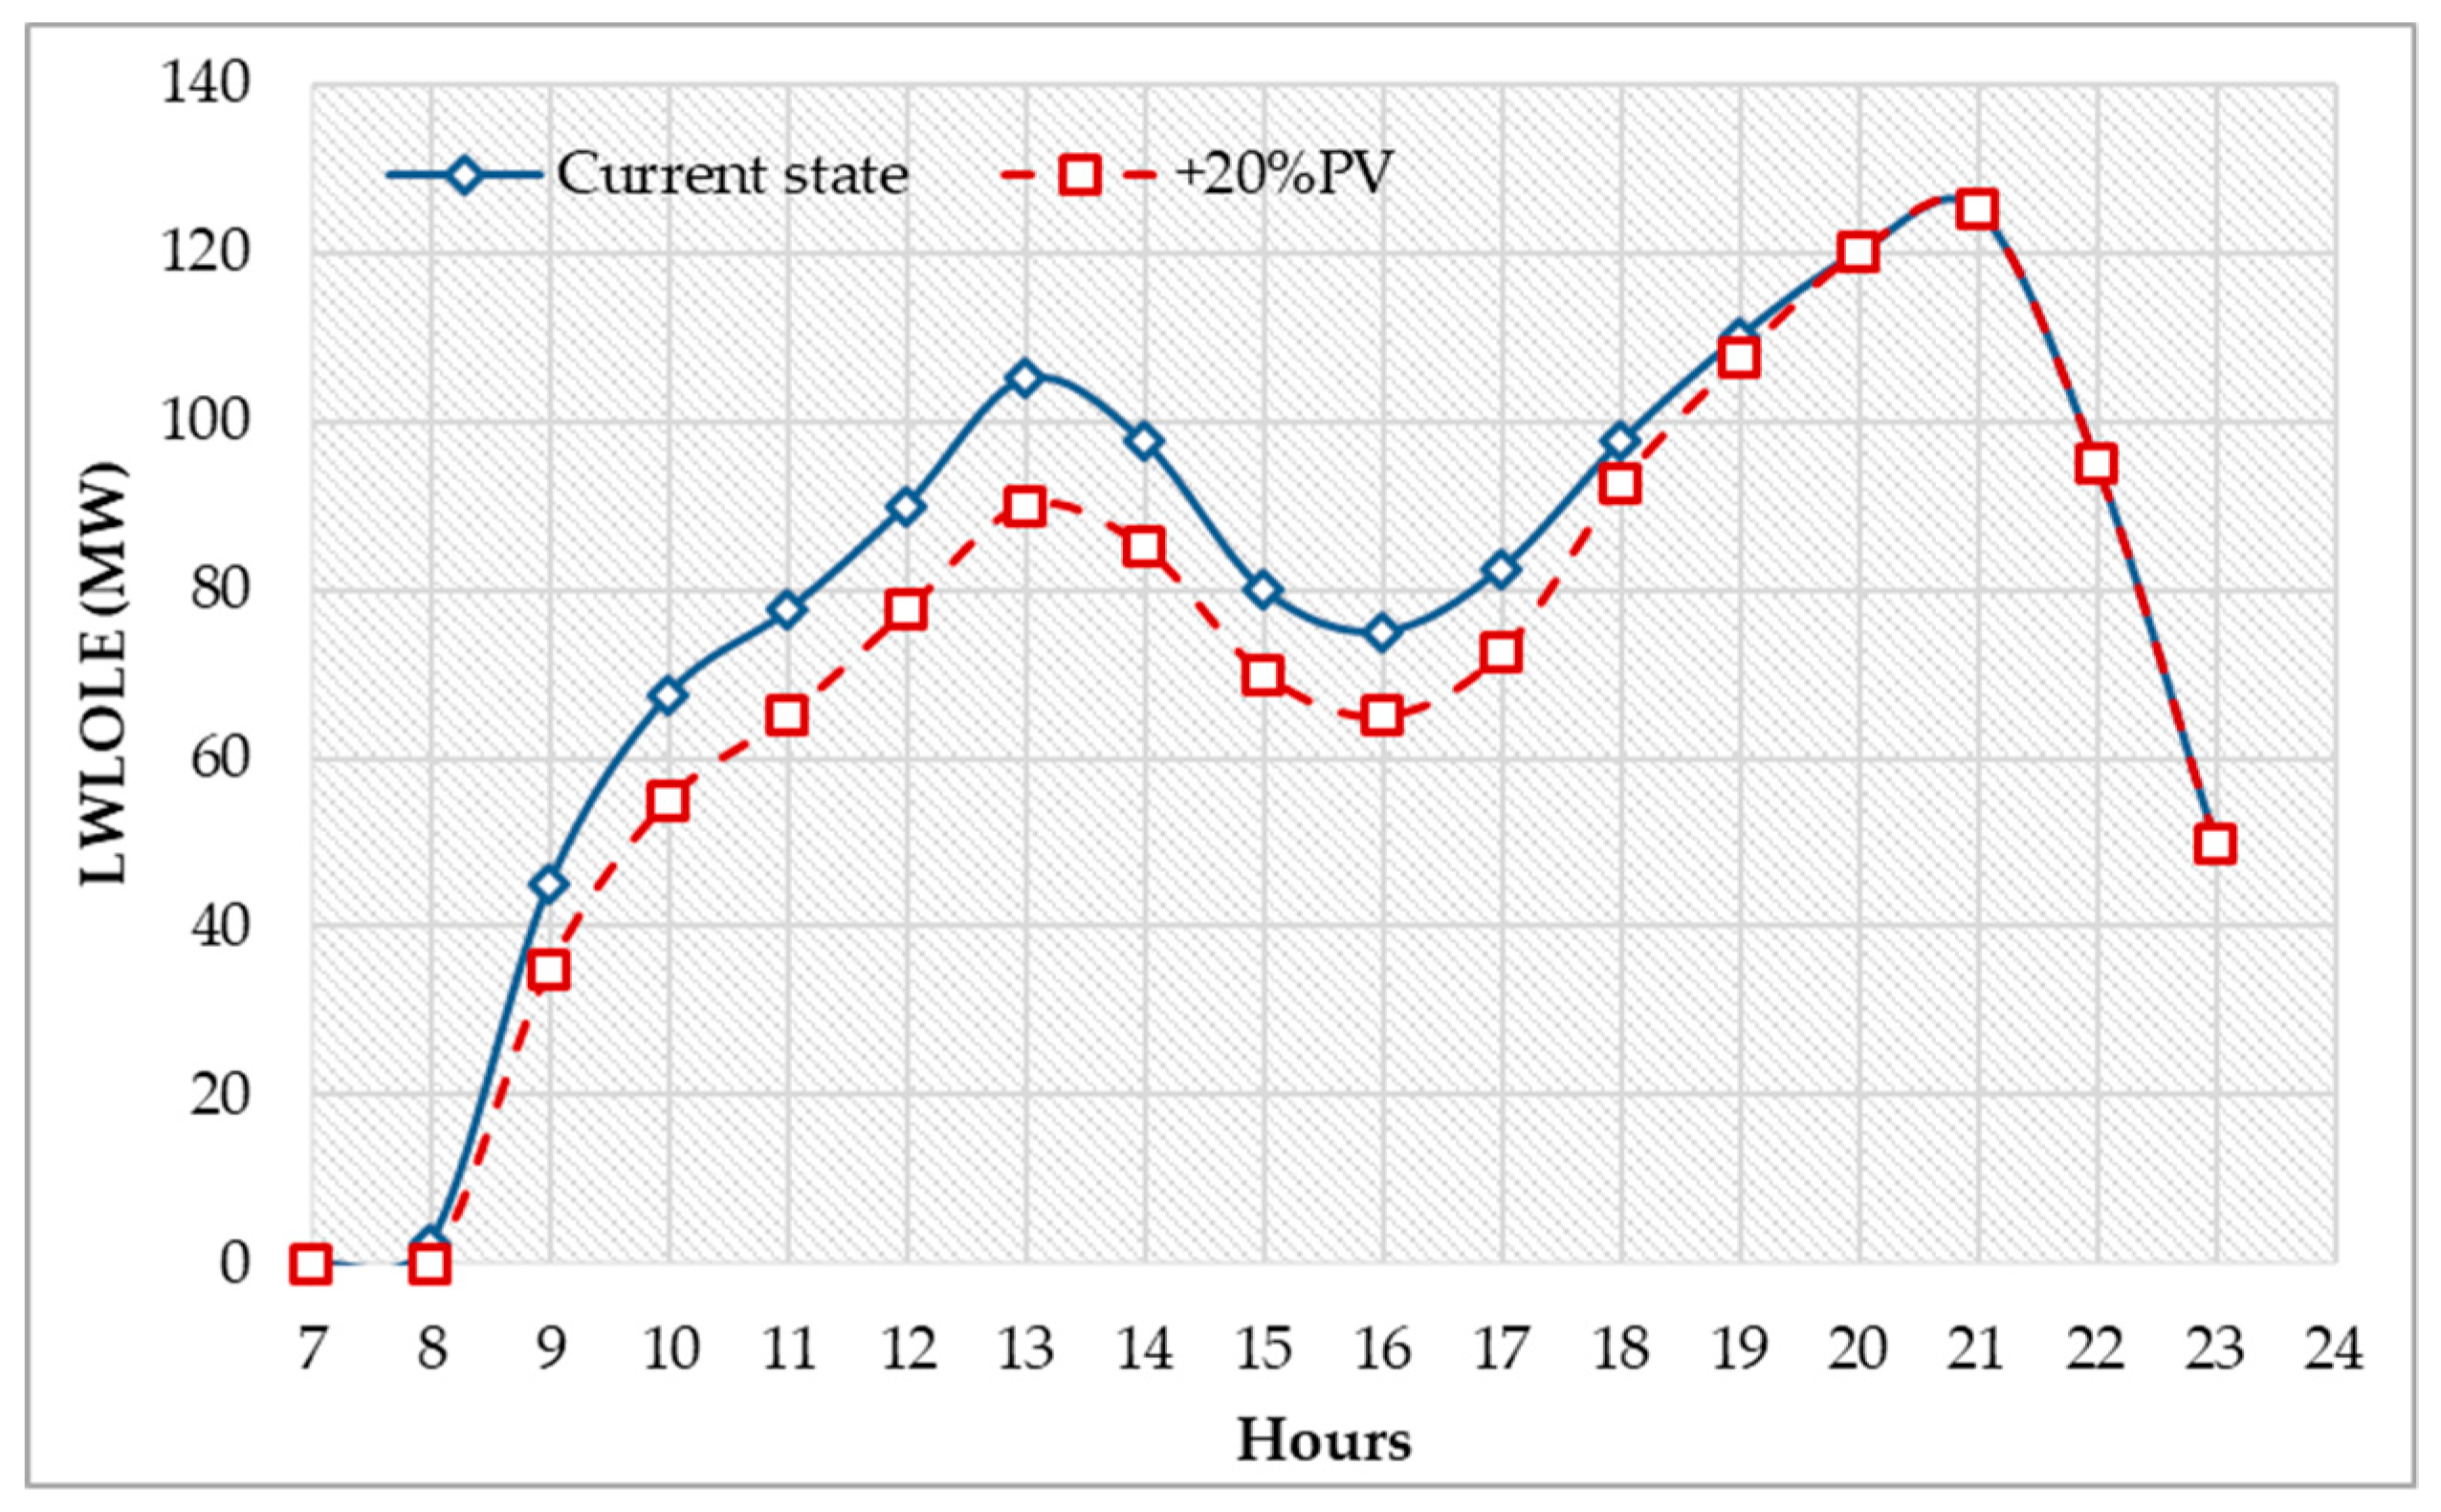
4.2. Reliability Evaluation

Thermal units of the island power system of Crete need to be maintained for some time periods during a year. This requirement leads each unit to scheduled outages which are determined by the administrator of the power system (HEDNO), usually in specific time periods. Autumn and spring are the most appropriate seasons for such maintenance, due to low load demand. In such a case, it is assumed that the steam turbines are committed to service for a long time (month), contrary to diesel and gas turbines whose maintenance lasts less (one or two weeks) per maintenance period. In order to take into account this necessity, for any unit which is under scheduled maintenance, FOR has been set to 1.
In this section, reliability indices of the Cretan power system are evaluated from the generation adequacy of thermal units’ perspective, examining two different scenarios. The results are provided by comparing the reliability indices of the system in its current state and with the assumption that the PV production has been increased by 20%. Figure 8 shows the EENS for five examined months. February and November are two months with low values of load demand. The EENS in the former case is 0.22 MWh while in the latter case was calculated as 1.54 MWh. This significant difference is because of which units are maintained in each case. It was assumed that in February those units could be a diesel unit of the power station of Linoperamata (10 MW) and a gas turbine (27 MW), while in November a part of the combined cycled (52 MW) unit could be out for service in addition to the steam turbines 4, 5 (24 MW each) of the power station of Linoperamata. Lower capacity of the available units during November justifies higher EENS values compared to February. During summer, although FOR is the only probability that was included for generation outages, high load demand leads to high EENS values.
Similar results are obtained for LOLE as is depicted in Figure 9. In July, 20% of additional PV generation could decrease the EENS by 15.93% and the LOLE by 15.71% for the whole month, while in November 0.19% for EENS and 0.25% for LOLE.
It is interesting to examine the change in LOLE during daytime. Figure 10 presents LOLE for July, grouped by hour type. Clearly, a high reduction of LOLE that exceeds 45% during hours 12:00–15:00 can be achieved. That proves the great impact of PV generation on system’s reliability for periods with high solar irradiation. Nevertheless, the maximum LOLE which is summarized for each month in Table 3 cannot be decreased by this additional PV capacity. For all months except February, this maximum value is observed, during the first night hour, when the solar PV cannot produce.
Figure 11 shows the value of LWLOLE in July for each hour type. The effect of additional PV capacity is observed during the daytime with the highest reduction in LWLOLE being achieved at 13:00–14:00 by 15 MW (−14.3%), while 22.2% (−10 MW) reduction in LWLOLE at 09:00–10:00 can also be achieved.
However, this effect cannot decrease the additional firm capacity that is required for obtaining 99.9999% generation adequacy, due to the maximum LWLOLE which appears at night hours as confirmed by Table 4.
It is worth mentioning that by decreasing the reliability requirement of six nines to fewer nines for LWLOLE determination as provided by Equation (7), the values of this index are reduced. More specifically, Figure 12 shows the decrease of the maximum value of LWLOLE for each month by changing the acceptable duration of demand disconnection from 0.1 s to 1 s and 10 s. The new examined cases, for LOLE > 1 s and LOLE > 10 s correspond to 99.999% and 99.99% generation adequacy, respectively.

5. Conclusions

One of the questions that the operators of autonomous power systems have to address for the generation expansion studies of their systems is to what extent volatile RES, such as PVs, can provide capacity credit to the power system they manage. This paper proposes a methodology not only to assess the potential impact of PVs on the capacity credit of a generation system but also to give further insight on assessing the potential impact that additional PV capacity could cause on the various reliability indices for the generation system.
The example case study was the largest autonomous power system in Greece, the island power of Crete, an island with already significant PV capacity reaching 100 MW. For this power system the additional capacity limit for PV is considered by the Regulatory Authority of Energy of Greece equal to 20 ΜW corresponding to increase by 20% of the currently existing PV capacity. The legislative framework of net metering and virtual net metering makes such an assumption rather reasonable in the forthcoming years.
Utilizing probabilistic techniques, MATLAB software and actual hourly data for load demand, PV, and wind power production from the island power system of Crete for the last three years, the potential capacity credit additional capacity of PVs on the island was evaluated. The obtained results showed that 20 ΜW of PVs can offer 7.5 MW capacity credit or can reduce by 1.2% the maximum probable thermal units loading expected to appear during early afternoon hours of July.
This paper makes a step forward to identify the maximum capacity credit that could be achieved, by adding PV installations to the power system of Crete without any other regulatory restriction. Thus, the capacity credit could be extended to the value of 20 MW whether the additional PV installations had been reached the extent of 55 MW. It has to be noted that 55 MW of additional PV capacity is the saturation point for the capacity credit of PVs. In fact, the time period that the maximum thermal units loading has been observed (630 MW in current state), differs in the case that PV installations reach 55 MW and corresponds to the time period of 20:00–22:00 (14:00–15:00 before).
The impact of the additional PV capacity on other reliability indices was then evaluated taking into account actual data on FOR and the typical maintenance schedule. Clearly, reduction in EENS and LOLE for summer months like July can exceed 15.5%. However, this reduction is mainly expected during periods when solar irradiation is apparent and unfortunately EENS and LOLE are rather high during the first hour of the night hours.
Additionally, in this paper, an index in capacity terms (MW), LWLOLE is introduced to reflect the possibility of having inadequate capacity with expected disconnection time higher than 0.1 s for a specific hour of a month. This may show the magnitude of required firm capacity for the power system for each hour. Therefore, this information seems to be beneficial for the operator of the system in order to adapt to the generation shortage, applying the most appropriate corrective actions, such as generation expansion or DSM. This index can be introduced for variable values of time shortage. PVs can decrease significantly this index by up to 15 ΜW during July.
The applied methodology can be replicated by other power systems utilizing data that are usually available to the operators of power systems. It can be estimated that if the evening demand is high, then the PV capacity credit might be even lower than the case of Crete. Moreover, if reliability indices of Crete are to be improved there is clearly the need of using stored energy during the first couple of nighttime hours.
In a future work, this probabilistic method can be used to determine the expected load demand in a lower level, i.e., in substation level, as well as to evaluate its local reliability. This study will give to the operator of the system further information about the loading of each substation in order to apply corrective actions, if necessary, or capacity expansion of substation’s elements such as transformers or transmission lines.

Author Contributions

Conceptualization, A.T.; methodology, A.T.; software, K.F.; validation, K.F., A.T., E.K. and Y.K.; formal analysis, K.F and A.T..; investigation, K.F.; resources, K.F., A.T., E.K. and Y.K.; data curation, A.T., E.K., Y.K. and G.S.; writing—original draft preparation, K.F.; writing—review and editing, K.F., A.T., E.K., Y.K. and G.S.; visualization, K.F. and A.T.; supervision, A.T. and G.S.; project administration, E.K.; funding acquisition, none. All authors have read and agree to the published version of the manuscript. All authors have read and agreed to the published version of the manuscript.

Funding

This research received no external funding.

Conflicts of Interest

The authors declare no conflict of interest.

Nomenclature

CCCombined Cycle
DSMDemand Side Management
EENSExpected Energy Not Supplied
FORForced Outage Rate
HEDNOHellenic Electricity Distribution Network Operator
LOLELoss of Load Expectation
LOLPLoss of Load Probability
LWLOLELoad with Loss of Load Expectation
ICEInternal Combustion Engine
OCGTOpen Cycle Gas Turbine
PVPhotovoltaic
RESRenewable Energy Sources
PDFprobability density function
kWpkiloWatt peak of photovoltaic power
PLoad(mo,hr)Probability density function of load demand
PLoad_loss(mo,hr)Probability density function of the load that available units cannot meet
PPV(mo,hr)Probability density function of photovoltaics production
PTh_units(mo,hr)Probability density function of load to be served by the thermal units
PWind(mo,hr)Probability density function of wind parks production
TTime period
fLoad(mo,hr)Probability density function of frequency of load demand
fPV(mo,hr)Probability density function of frequency of photovoltaics production
fTh_units(mo,hr)Probability density function of frequency of the load to be served by thermal units
fWind(mo,hr)Probability density function of frequency of wind parks production
piProbability of the unit being available
qiProbability of the unit being unavailable

References

  1. SolarPower Europe—Leading the Energy Transition. Available online: https://www.solarpowereurope.org/ (accessed on 17 November 2019).
  2. CSP Today|New Energy Update. Available online: https://analysis.newenergyupdate.com/csp-today (accessed on 8 December 2019).
  3. Praveen, R.P.; Abdul Baseer, M.; Awan, A.B.; Zubair, M. Performance Analysis and Optimization of a Parabolic trough Solar Power Plant in the Middle East Region. Energies 2018, 11, 741. [Google Scholar] [CrossRef] [Green Version]
  4. Malamatenios, C.; Vezirgianni, G.; Giakoumelos, E.; Tsikalakis, A.; Tomtsi, T.; Hatziargyriou, N. Concentrating Solar Power (CSP) Technologies and Applications in the Middle East & North Africa (MENA) Countries. Available online: http://www.oas.gr/wp-content/uploads/2010/09/Concentrating-Solar-Power-CSP-Technologies-and-Applications-in-the-Middle-East-North-Africa-MENA-Countries.pdf (accessed on 8 December 2019).
  5. Behar, O.; Khellaf, A.; Mohammedi, K. A review of studies on central receiver solar thermal power plants. Renew. Sustain. Energy Rev. 2013, 23, 12–39. [Google Scholar] [CrossRef]
  6. Evangelisti, L.; De Lieto Vollaro, R.; Asdrubali, F. Latest advances on solar thermal collectors: A comprehensive review. Renew. Sustain. Energy Rev. 2019, 114, 109318. [Google Scholar] [CrossRef]
  7. Rashid, K.; Safdarnejad, S.M.; Powell, K.M. Process intensification of solar thermal power using hybridization, flexible heat integration, and real-time optimization. Chem. Eng. Process.-Process Intensif. 2019, 139, 155–171. [Google Scholar] [CrossRef] [Green Version]
  8. Rashid, K.; Ellingwood, K.; Safdarnejad, S.M.; Powell, K.M. Designing Flexibility into a Hybrid Solar Thermal Power Plant by Real-Time, Adaptive Heat Integration. Comput. Aided Chem. Eng. 2019, 47, 457–462. [Google Scholar] [CrossRef]
  9. Brellas, K.; Tsikalakis, A.; Kalaitzakis, K. Reducing Solar Dish Park Production Volatility Utilizing Lithium-ion Batteries. Period. Polytech. Electr. Eng. Comput. Sci. 2016, 60, 254–260. [Google Scholar] [CrossRef] [Green Version]
  10. Chowdhury, B.H.; Sawab, A.W. Evaluating the value of distributed photovoltaic generations in radial distribution systems. IEEE Trans. Energy Convers. 1996, 11, 595–600. [Google Scholar] [CrossRef]
  11. Haas, R. The value of photovoltaic electricity for society. Sol. Energy 1995, 54, 25–31. [Google Scholar] [CrossRef]
  12. Gil, H.A.; Joos, G. On the quantification of the network capacity deferral value of distributed generation. IEEE Trans. Power Syst. 2006, 21, 1592–1599. [Google Scholar] [CrossRef]
  13. Hoff, T.; Shugar, D.S. The Value of Grid-Support Photovoltaics to Substation Transformers. Available online: https://www.cleanpower.com/wp-content/uploads/2012/02/047_ValuePVTransformerSupport.pdf (accessed on 17 November 2019).
  14. Tsikalakis, A.G.; Tzouliadaki, T. Chapter 9. Electrification of Rural Areas using Renewable Energy Sources: Review of Best Practices around the World. In Renewable Energy: Economics, Emerging Technologies and Global Practices; Poulikkas, A., Ed.; Nova Publishers: Hauppauge, NY, USA, 2013; pp. 197–246. [Google Scholar]
  15. Lallement, D.M.; Terrado, E.N.; Zhang, Y. Empowering information and communication technologies in isolated areas: Learning from the solar-net villages program in honduras. Renew. Sustain. Energy Rev. 2006, 10, 46–53. [Google Scholar] [CrossRef]
  16. Labed, S. PV Large Scale Rural Electrification Programs and the Development of Desert Regions. In Sustainable Energy Production and Consumption; Barbir, F., Ulgiati, S., Eds.; Springer: Dordrecht, The Netherlands, 2008; pp. 281–292. [Google Scholar] [CrossRef]
  17. Watt, M.E.; Oliphant, M.; Outhred, H.; Collins, R. Using PV to Meet Peak Summer Electricity Loads. Available online: http://www.ceem.unsw.edu.au/sites/default/files/uploads/publications/Watt%20-%20PV%20Peak%20Load%20-%20Solar%202003.pdf (accessed on 6 December 2019).
  18. Jurasz, J.; Campana, P.E. The potential of photovoltaic systems to reduce energy costs for office buildings in time-dependent and peak-load-dependent tariffs. Sustain. Cities Soc. 2019, 44, 871–879. [Google Scholar] [CrossRef]
  19. Braun, P.; Rüther, R. The role of grid-connected, building-integrated photovoltaic generation in commercial building energy and power loads in a warm and sunny climate. Energy Convers. Manag. 2010, 51, 2457–2466. [Google Scholar] [CrossRef]
  20. Sadineni, S.B.; Atallah, F.; Boehm, R.F. Impact of roof integrated PV orientation on the residential electricity peak demand. Appl. Energy 2012, 92, 204–210. [Google Scholar] [CrossRef]
  21. HEDNO. Available online: https://www.deddie.gr/en (accessed on 6 December 2019).
  22. Tsikalakis, A.; Hatziargyriou, N.; Karapidakis, E.; Kymakis, E. Economic Evaluation of Low Photovoltaics (PV) Penetration in Island Power Systems, application to Crete. In Proceedings of the DEMSEE, Conference on the Deregulated Electricity Market issues in South-Eastern Europe Sitia, Crete, Greece, 23–24 September 2010. [Google Scholar]
  23. Poulikkas, A.; Tsikalakis, A.; Hatziargyriou, N. Economic evaluation of low Photovoltaics (PV) penetration in island power systems, application to Cyprus. In Proceedings of the DISTRES, Conference on the promotion of Distributed Renewable Energy Sources in the Mediterranean Region, Nicosia, Cyprus, 11–12 December 2009. [Google Scholar]
  24. REBUS|Interreg Europe. Available online: https://www.interregeurope.eu/rebus/ (accessed on 27 November 2019).
  25. Gusmao, A.; Groissböck, M. Capacity value of photovoltaic and wind power plants in an isolated Mini-grid in the Kingdom of Saudi Arabia. In Proceedings of the Saudi Arabia Smart Grid (SASG), Jeddah, Saudi Arabia, 7–9 December 2015; pp. 1–8. [Google Scholar] [CrossRef]
  26. Ensslin, C.; Milligan, M.; Holttinen, H.; O’Malley, M.; Keane, A. Current methods to calculate capacity credit of wind power, IEA collaboration. In Proceedings of the IEEE Power and Energy Society General Meeting-Conversion and Delivery of Electrical Energy in the 21st Century, Pittsburgh, PA, USA, 20–24 July 2008; pp. 1–3. [Google Scholar] [CrossRef]
  27. Narimani, M.R.; Nauert, P.J.; Joo, J.-Y.; Crow, M.L. Reliability assesment of power system at the presence of demand side management. In Proceedings of the IEEE Power and Energy Conference at Illinois (PECI), Urbana, IL, USA, 19–20 February 2016; pp. 1–5. [Google Scholar] [CrossRef]
  28. Jabir, H.J.; Teh, J.; Ishak, D.; Abunima, H. Impact of Demand-Side Management on the Reliability of Generation Systems. Energies 2018, 11, 2155. [Google Scholar] [CrossRef] [Green Version]
  29. Tsikalakis, A.G.; Hatziargyriou, N.D.; Katsigiannis, Y.A.; Georgilakis, P.S. Impact of wind power forecasting error bias on the economic operation of autonomous power systems. Wind Energy 2009, 12, 315–331. [Google Scholar] [CrossRef] [Green Version]
  30. Katsigiannis, Y.A.; Karapidakis, E.S.; Tsikalakis, A.G.; Katsamaki, A. Large-scale energy storage and dynamic performance of the autonomous power system in Crete Island: A review of the literature. Int. J. Energy 2014, 8, 60–70. [Google Scholar]
  31. Singh, C.; Jirutitijaroen, P.; Mitra, J. Electric Power Grid Reliability Evaluation: Models and Methods; John Wiley & Sons: Hoboken, NJ, USA, 2018; ISBN 978-1-119-48627-5. [Google Scholar]
  32. Billinton, R.; Allan, R.N. Reliability Assessment of Large Electric Power Systems; Springer Science & Business Media: Berlin, Germany, 2012; ISBN 978-1-4613-1689-3. [Google Scholar] [CrossRef]
  33. Brown, R.E. Electric Power Distribution Reliability; CRC Press: Boca Raton, FL, USA, 2017; ISBN 978-0-8493-7568-2. [Google Scholar]
  34. Population and Social Conditions—ELSTAT. Available online: https://www.statistics.gr/en/statistics/pop (accessed on 17 November 2019).
  35. Tsikalakis, A.G.; Katsigiannis, Y.A.; Karapidakis, E.S.; Fiorentzis, K.E. Evaluating the effect of wind-hydro hybrid power stations on the operation of Cretan power system. In Proceedings of the 2017 52nd International Universities Power Engineering Conference (UPEC), Heraklion, Greece, 28–31 August 2017; pp. 1–6. [Google Scholar] [CrossRef]
  36. Stefanakis, J. Crete: An ideal study case for increased wind power penetration in medium sized autonomous power systems. In Proceedings of the IEEE Power Engineering Society Winter Meeting, Conference Proceedings (Cat. No.02CH37309), New York, NY, USA, 27–31 January 2002; Volume 1, pp. 329–334. [Google Scholar] [CrossRef]
  37. Gigantidou, A. Renewable energy sources in Crete. In Proceedings of the IREP Symposium Bulk Power System Dynamics and Control—IX Optimization, Security and Control of the Emerging Power Grid, Rethymnon, Crete, Greece, 25–30 August 2013; pp. 1–3. [Google Scholar] [CrossRef]
  38. Tsikalakis, A.; Thalassinakis, E.; Pylarinos, D. Estimation of Hosting Electric Vehicles Capacity in the Transformers on the Island of Crete. In Engineering and Industry; Trivent Publishing: Budapest, Hungary, 2016; Volume 3, ISBN 978-615-80340-7-4. [Google Scholar] [CrossRef]
Figure 1. Scatter plots for the actual hourly data of the power system of Crete for the last three years (2016–2018). (a) PWind and PLoad; (b) PPV and PLoad; (c) PWind + PPV and PLoad; (d) PPV and PWind.
Energies 13 00064 g001aEnergies 13 00064 g001b
Figure 2. PTh_units(mo,hr) for 12:00 and May for the Cretan power system.
Energies 13 00064 g002
Figure 3. Power stations location.
Energies 13 00064 g003
Figure 4. Power generation breakdown in 2018.
Energies 13 00064 g004
Figure 5. Duration curve for the actual demand to be served by the thermal units. Emphasis on the highest 1% values (HEDNO 2018).
Energies 13 00064 g005
Figure 6. Expectation of the demand to be met by thermal units to exceed 600 ΜW.
Energies 13 00064 g006
Figure 7. Capacity credit and maximum load to be met by thermal units, increasing PV capacity.
Energies 13 00064 g007
Figure 8. Expected energy not supplied for five representative months.
Energies 13 00064 g008
Figure 9. Sum of loss of load expectation for each representative month.
Energies 13 00064 g009
Figure 10. Loss of load expectation for each hour in July.
Energies 13 00064 g010
Figure 11. Load with loss of load expectation >0.1 s for each hour in July.
Energies 13 00064 g011
Figure 12. Max LWLOLE for three different examined time periods.
Energies 13 00064 g012
Table 1. Installed capacity (in MW) per unit type and power station.
Power StationSteamICEOCGTCCTotal
Linoperamata111.349.2118.6-279.1
Xylokamara--202.2132.3334.5
Atherinolakos93118.2--211.2
Total capacity204.3167.4320.8132.3824.8
Table 2. Maximum load to be met by thermal units (MW).
MonthsCurrent State+20% PVHour
June61061020:00–22:00
July630622.514:00–15:00
August610602.513:00–14:00
Table 3. Maximum loss of load expectation (LOLE) for each month and hour type.
MonthsMax LOLE (s)Hour
February16.6519:00–20:00
June47.2121:00–22:00
July90.0421:00–22:00
August88.4020:00–21:00
November99.2518:00–19:00
Table 4. Maximum load with loss of load expectation (LWLOLE) > 0.1 s for each month.
MonthsMax LWLOLE (MW)Hour
February9019:00–20:00
June11520:00–22:00
July12521:00–22:00
August12520:00–21:00
November11018:00–19:00

