Article

FRA Diagnostics Measurement of Winding Deformation in Model Single-Phase Transformers Made with Silicon-Steel, Amorphous and Nanocrystalline Magnetic Cores

Department of Electrical and Power Engineering, AGH University of Science and Technology, ul. Mickiewicza 30, 30-059 Kraków, Poland
Energies 2020, 13(10), 2424; https://doi.org/10.3390/en13102424
Submission received: 23 March 2020 / Revised: 30 April 2020 / Accepted: 6 May 2020 / Published: 12 May 2020
(This article belongs to the Special Issue Electric Machinery and Transformers)

Abstract

:
The power transformer is a key object in the electrical power system. The working principle hasn’t changed since its discovery. The main work nowadays is focused on the rising of the reliability of transformers and lowering power losses. The replacement of new materials instead of conventionally used ones can provide a solution. This procedure can improve factors, like a reduction of power losses, but also influence others normally neglected, like proper work in higher frequencies. The article presents the measurement results of the frequency characteristics of model test coils made with different magnetic materials cores (silicon steel, amorphous material, and nanocrystalline material), the measurements based on the sweep frequency response analysis (SFRA) method used for the determination of chosen frequency characteristics. The analysis presents the impact of different coil deformation levels on frequency characteristics. Results show that the replacement of conventional silicon steel with thinner high permeability materials can modify the state-of-the-art frequency response analysis (FRA) interpretation guidelines. The replacement of a new type of magnetic material as a magnetic core in the existing design of power transformer should lead to a full analysis of its behavior in the high-frequency domain.

Graphical Abstract

1. Introduction

These days, power systems are standing in front of numerous challenges focusing on improvement of environmentally friendly factors like higher efficiency and reliability, developing smart operation in generation, transmission, and distribution systems [1]. This trend implies a modification of the current design of power equipment and a demand for new algorithms for relays and diagnostic techniques. A power system has a complex structure, consisting of numerous components that have an important role in its operation. One of the most important devices due to functionality and costs are power transformers. Power transformers are necessary units in AC power systems. The general design defined by physical principles hasn’t changed since the first commercially produced unit. Modifications in the field of used materials in electrical insulation and magnetic circuit are visible. Most of the units have oil-paper electrical insulation with aluminum or copper windings placed on the silicon steel (cold rolled grain oriented) magnetic core. For this design, diagnostics methods are well defined. The guidelines can be found in technical brochures by IEC, IEEE, or CIGRE. Replacement of conventional material can cause more optimal operation (lower losses, lower failure rate, higher operating temperature) but also influence on the interpretation of diagnostics procedures like identification of faults with dissolved gas analysis (DGA) [2], behavior in high-frequency spectrum analysis [3] or level of inrush current [4].
Long term uninterrupted operation of power equipment, which reflects the operation of the whole power system, depends on proper maintenance strategies in the power distribution company [1]. The actual condition state of the object influences exploitation decisions. One of the ways to determine the current state of the device is to perform a diagnostic test. Power transformers are subjected to different measurements that show their actual condition [1,5,6,7]. Diagnostic techniques can be divided into two group’s off-line and on-line methods. Off-line methods are related to time-based maintenance (TBM) strategies. The off-line methods are performed onsite in some regular periods determined by the electric company operation manual. Most of the off-line tests are done annually. In some cases, especially for older units, the one-year interval is not sufficient to predict the failure. Another asset of off-line methods is to disconnect the unit before measurement, which can impact continuous power delivery and can weak redundancy in the system. On-line type diagnostics are helping condition-based maintenance (CBM) and on-line condition maintenance (OLCM) methods in a proper analysis of the current state of a transformer, unfortunately not every parameter can be monitored in an on-line way [1]. Most common in use as an on-line tool is the DGA method [2,5,6] and partial discharge (PD) measurement [2], as work is still being done to introduce FRA as an on-line method [8,9,10,11].
The frequency response analysis method is a useful tool to determine actual changes in the winding, core, bushing, or tap changer structure bypassing the tank disassembly process [12,13,14]. FRA base on the existence of mutual couplings between every element in transformer, especially inductive couplings between turns determined by turn geometry, magnetic material property and its position in space, capacitive couplings exist between every part which can become equipotential and are determined by dielectric insulation characteristics and geometry [7]. This complex RLCM circuit has a unique pattern that reveals resonances in the wideband frequency spectrum. Observed differences in frequency characteristics compared to reference fingerprints are an indicator of the active part structure deformation. Many international organizations like IEC [12], IEEE [13], or CIGRE [14] have standards or technical specifications dealing with requirements and guidelines for FRA diagnostic. The FRA analysis base on the measurement of the frequency characteristics of test objects. These characteristics can be obtained by the SFRA (sweep frequency response analysis) [7,11,15] or LVI (low voltage impulse) method [5,8,11]. The four main test setups are defined for the measure of inductive and capacitive couplings in open and short-circuit connections [12,13,14]. The key point in the FRA method is a comparative analysis of the results, which reveals the differences between actual and fingerprint characteristics. The proper analysis of results can identify the type of fault to that occurred in a diagnosed power transformer. The trend of research is to introduce indicators based on different statistical quantities, which helps in the identification of fault type that occurred in the transformer [8,16,17,18,19]. The work is still focused on the analysis of windings displacement and deformation impact on the frequency characteristics changes [7,8,16,20,21,22]. Helping hand to understand the relation between mechanical defect and variations in measured characteristics gives computer simulations of suitable winding model [23,24]. The important assumption in the mathematical description of transformer winding for FRA modeling analysis is to model proper behavior of magnetic core in the analyzed spectrum. The behavior of permittivity decay and high-frequency losses influence the magnetic coupling existing between turns and layers of the coil [25,26].
The IEC 60076-18:2012 standard introduces a measurement frequency spectrum from 20 Hz to 2 MHz and divides this region into four sub-spectra. The differences between characteristics in these regions are related to different phenomena. The first frequency band (up to 2 kHz) related with core magnetizing inductance, the second (2–20 kHz) with the interaction between windings (arrangement and connections), the third (20 kHz–1 MHz) with winding structure (leakage inductances, ground capacitances) parameters, the last (above 1 MHz) related with measurement setup and leads connections. One of the main assumptions of this method is to treat a power transformer as an LTI (linear time-invariant) class object [11], this is fulfilled for a low voltage measurement (below saturation level of the magnetic core). For conventional transformer design, the silicon steel magnetic core is conducting flux up to several kilohertz (20–100 kHz), this upper limit is determined by material thickness, permeability, and physical structure [12,13,14,25,26,27]. The magnetic core plays an important role in FRA diagnostics [20,23] while it provides magnetic coupling between windings. For frequencies above cutoff magnetic core frequency fw coupling existing between windings is determined by air-core coupling, and for windings placed on different columns can be neglected. For frequencies below fw, the magnetic coupling between parts of the core is strong and can be the origin of changes in measured frequency spectra. These changes can be caused by deformation in winding placed at other parts of the core [28,29,30,31]. The magnetization level of the magnetic core has to be taken into consideration while taking measurements for FRA analysis [27]. The replacement of magnetic core material, for amorphous material with a low level of power losses [25], can impact sub-bands frequency limits and state-of-the-art fault indicators [17,18,19,20,21,22,23,24,25,26,27,28,29,30,31,32]. The literature also shows spinel ferrites as promising for the production of transformer cores. The main advantage of such oxide magnetics, along with their low coercively and high permeability values at high frequencies are the constancy of their chemical composition, which preserves the magnetic parameters from degradation [33].
Amorphous materials are widely known substitute material for silicon steel in magnetic cores [30,32]. Its outstanding magnetic performance indicates the reduction of no-load losses in magnetic circuits [25,32,34]. The manufacturing process of amorphous material provides films with very thin structure (in the range of several µm), high permittivity (µr > 105), and mechanical properties like high brittleness and hardness [32]. Due to its excellent magnetic properties, low level of electrical resistivity (several µΩ∙cm), and small thickness, are good materials for higher frequency applications [34,35,36,37]. Amorphous and nanocrystalline magnetic materials have relatively high Woolman cut-off frequencies. The good penetration of HF magnetic flux is by a low level of eddy currents and skin depth effect [25]. The application of amorphous material as magnetic cores is in fields of distribution power transformers [32,34,38], transformers used in aerospace electric systems [39], power metering devices [40] or general electrical machines [41]. Amorphous or nanocrystalline materials, due to its good high-frequency behavior, are used in the damping of fast transients in high voltage applications [42].
This article presents the measurement results of the frequency characteristics of the coil system placed on the different magnetic cores. The Sweep Frequency Response Analysis (SFRA) method was used for the determination of frequency characteristics. The different deformations of coils were implemented for which the frequency characteristics were measured. The analysis covers the impact of magnetic core material on measurement results. The results show that the current knowledge about the interpretation of changes in FRA diagnostic monitoring should be distinguished by the material type. The division is between silicon steel magnetic core transformers and high-frequency magnetic core objects. The most observed differences are for frequency bands in which magnetic core impact and interaction between winding is dominant. This work shows possible differences of the FRA diagnostics in the case of the test object with amorphous or nanocrystalline magnetic cores and helps to understand the mechanism standing behind the changes of characteristics.

2. Methodology

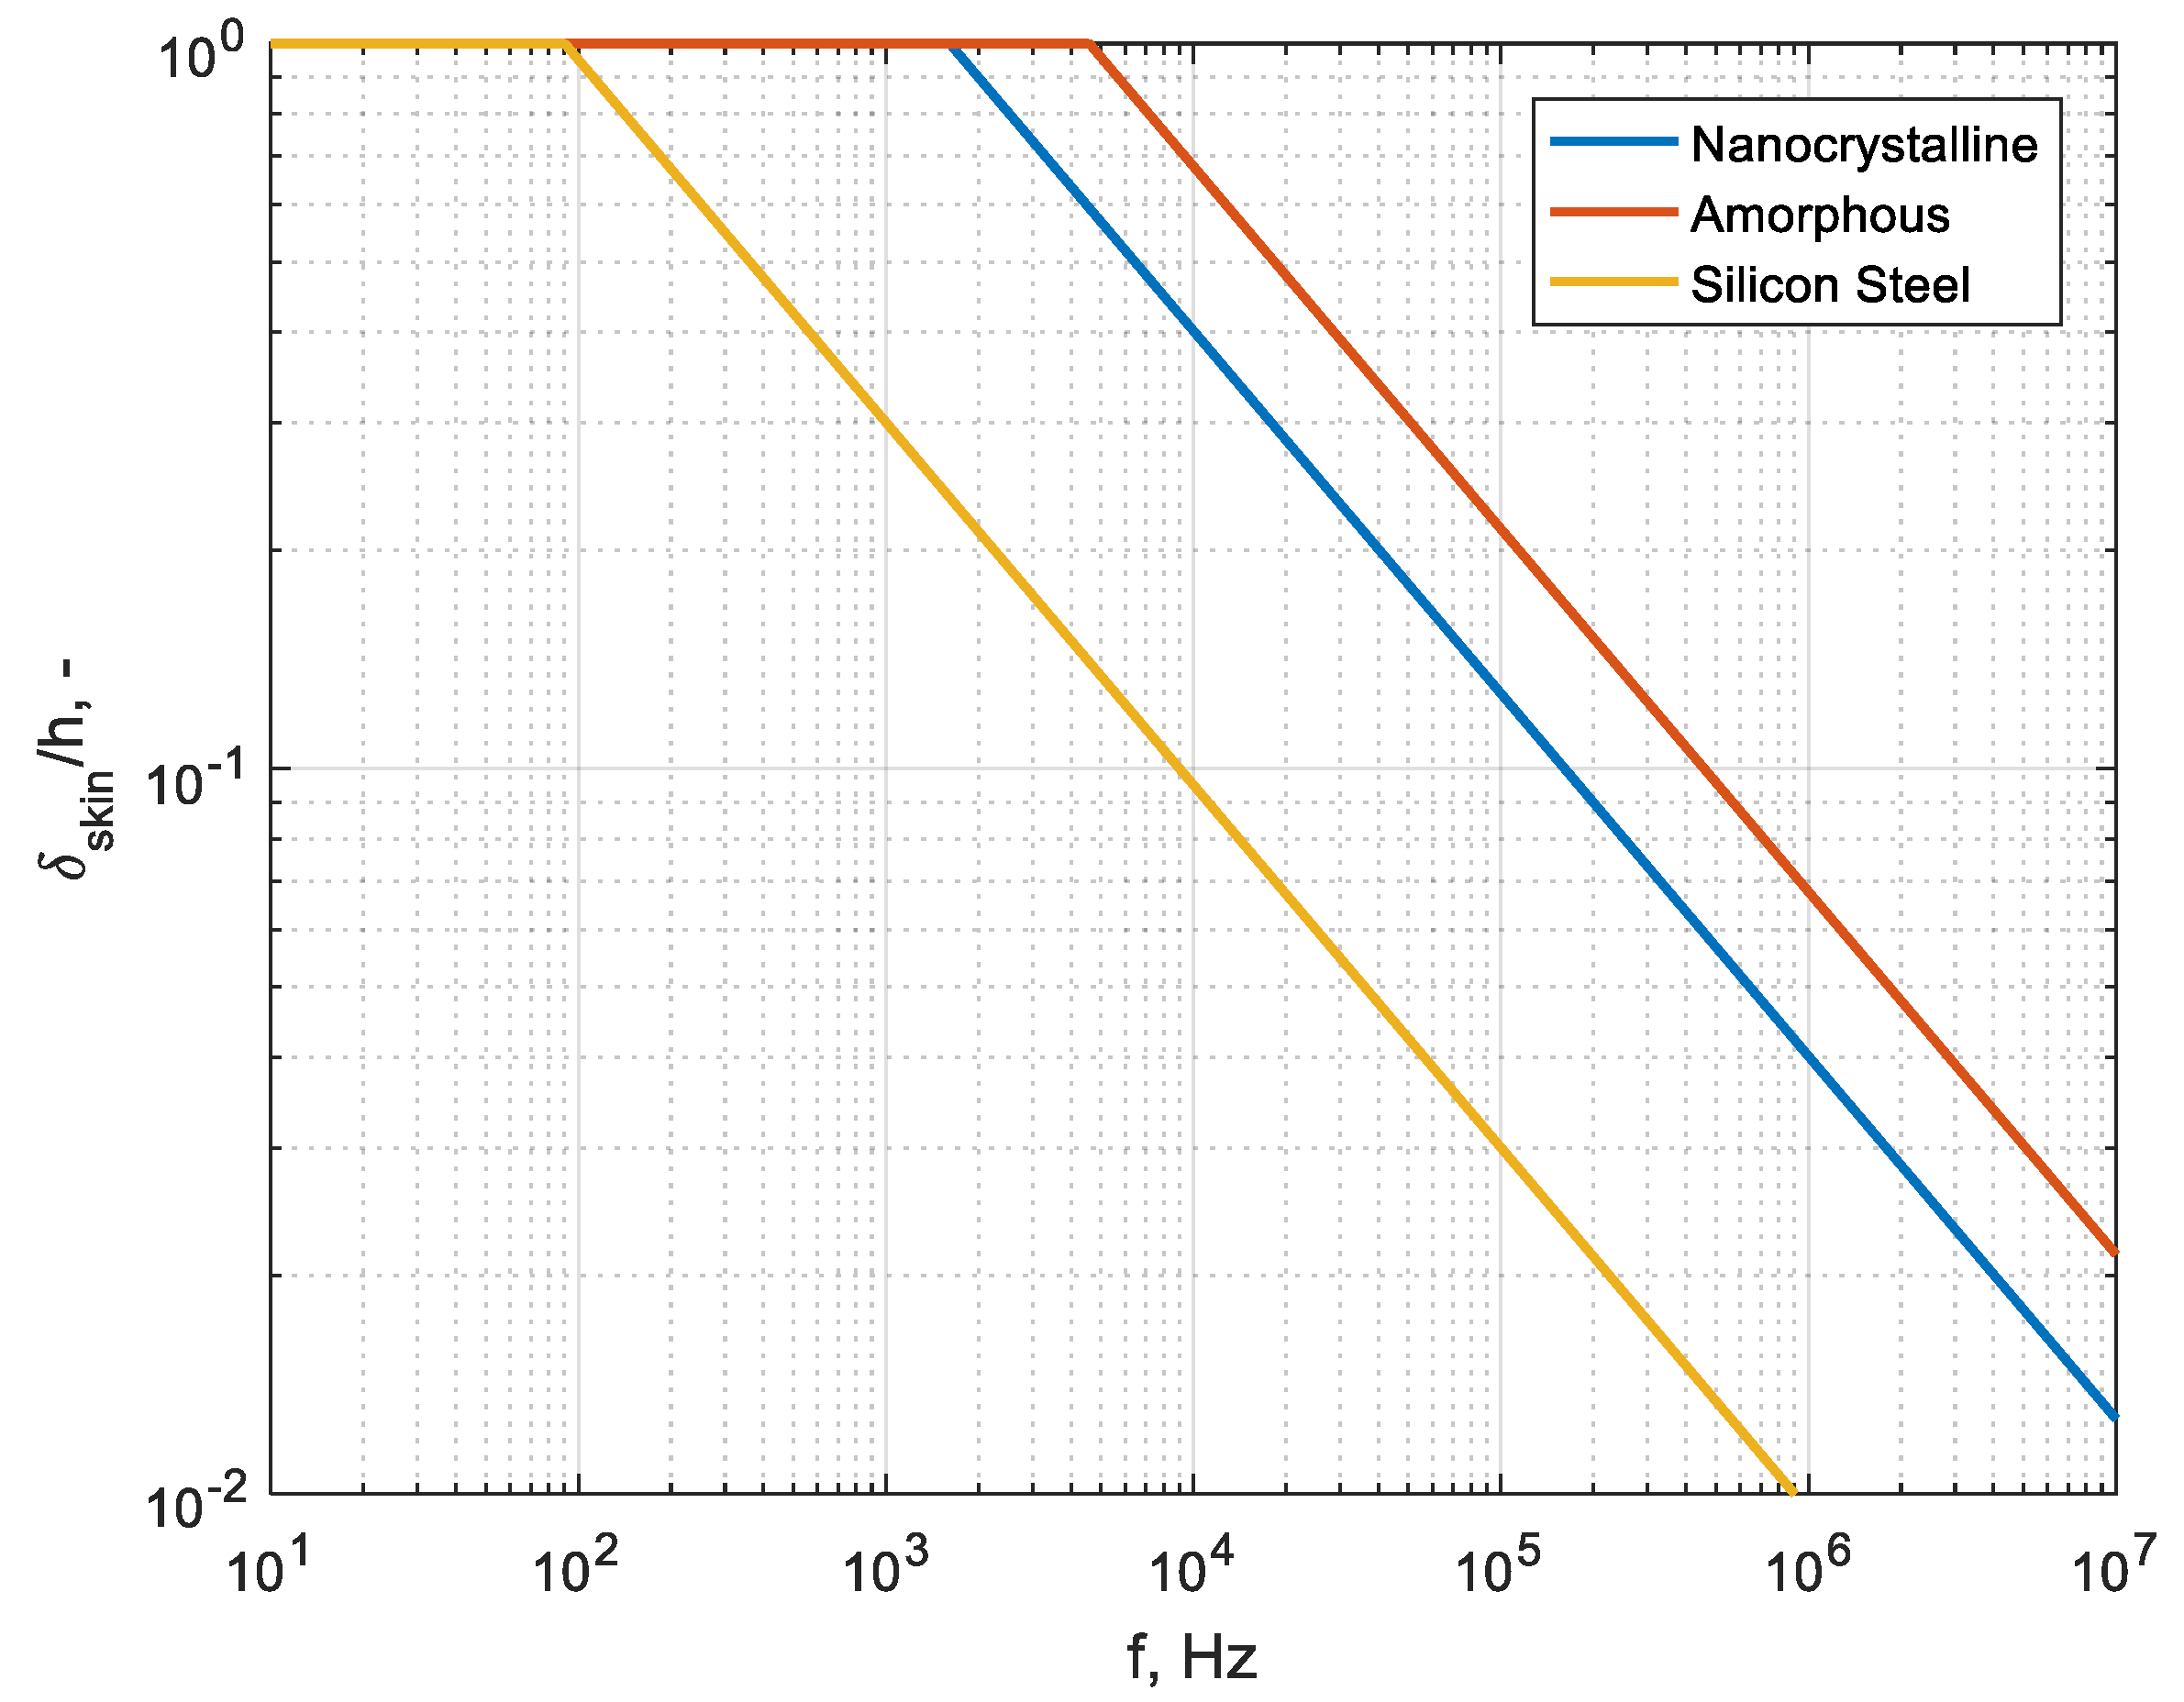
2.1. Characterization of Used Materials

The aim of investigations was a comparison of different magnetic materials behavior in case of high-frequency measurements of coil characteristics. Magnetic materials differ in terms of physical structure, magnetic and electric properties, and thickness. The silicon steel (cold rolled grain oriented) was used as the reference material. The silicon steel has a crystalline structure with anisotropic properties in the magnetization direction [25]. The materials used for comparison were an amorphous thin film and a nanocrystalline film magnetic core. These materials differ strongly in the case of a physical structure and physical properties [25,32]. Figure 1 shows the magnetization characteristic of materials under test. Figure 2 shows the relation of permeability in the magnetic field domain. Silicon steel has a high saturation point and permittivity level in the range of approximately 104. Amorphous and nanocrystalline materials are characterized by a lower saturation level and minimum one order higher permittivity level.

2.2. Test Objects

For the analysis of diagnostics possibilities of winding deformation in transformers equipped with silicon steel, amorphous material, and a nanocrystalline material magnetic core, a model test object was developed. The methodology used in the analysis was the following: construction of coil N1 and coil N3 on the first column of the core, construction of coil N2 on the opposite column of the magnetic core (Figure 3). The deformation was implemented in the coil N3, while compressing of the coil and buckling was applied. The deformation of coil N3 will reveal the impact on the fault on the coupled windings.
Constructed coils were developed as layer coils. Parameters of used magnetic cores are present in Table 1. Construction of the same coil type on different magnetic cores reveals the impact of tested magnetic material on the high-frequency behavior of the test objects, the influence of the coil geometry is neglected. The main aim of the measurements is to show the impact of high-frequency magnetic flux conduction on FRA measurement results. The different behavior of used magnetic materials leads to a different interpretation of diagnostic results, in mechanical condition analysis by FRA measurements. Figure 3 presents the sketch of a test object used in investigations. The equivalent magnetic and electric circuit of the test object is presented in Figure 4. Capacitances C1 and C2 are related to equipotential surfaces between turns and between layers. The mutual capacitance C12 exists between two coils galvanically separated. The capacitive couplings have origin in dielectric properties of insulation material and geometry. Mutual inductance M12 results from the sum of magnetic fluxes in the magnetic core material. In case of material saturation or at higher frequencies, mutual inductance M12 is related to the air magnetic flux. Coils L1 and L3 placed on the same part of the magnetic core are linked by magnetic flux flowing inside magnetic material. Due to their concentric position, magnetic flux without magnetic core has an air-core coupling. Coils L1 and L2 placed on different parts of the magnetic circuit are linked with magnetic flux related to magnetic material core, due to the distance between coils and air coupling being weak.
The parameters of coils placed on magnetic material cores are related to feeding frequency voltage. Due to skin effect, magnetic flux penetrates the magnetic core at various depths, which reflects on the coil parameters like inductance and magnetic coupling between turns and coils. For low-frequency stimulation, material permeability is equal to initial permeability, with frequency rise the permeability decrease due to damping caused by eddy currents induction in conductive magnetic material and physical relaxation processes of domains. Magnetic flux penetration depth is related to initial permeability (1) and resistivity of the analyzed material, on the other hand, the permeability of magnetic core (2) results from skin depth inside core sheets. Analyzed cores have laminated tapes with thickness h (see Table 1). The Woolman frequency [25] is a cut-off frequency beyond which magnetic flux does not cover the whole magnetic core layer.
d s k i n ( f ) = h 2 f w f = ρ π f μ 0 μ i
μ ( f ) = 1 h ρ μ i π μ 0 f = d s k i n h μ i
where ρ is material resistivity, Ωm, μ i is permeability of material in low frequencies, -, μ 0 is permeability of vacuum, H/m, f w is Woolman frequency, Hz, h defines material thickness, m, d s k i n is skin depth or penetration depth of magnetic flux, m.
Figure 5 shows the calculated skin depth for analyzed materials normalized to half of the material thickness. Analysis of results confirms that tested silicon steel core has the lowest cut-off frequency, in this case, is slightly above the power frequency fw = 91 Hz, for the tested amorphous core is 4878 Hz, and for the tested nanocrystalline material fw equals 1600 Hz. Different characteristics of skin depth penetration lead to the different behavior of test objects at higher frequencies. Analysis of calculated permeability (Figure 6) normalized to initial permeability of silicon steel also confirms that silicon steel conduct magnetic flux only up to several kHz (~9.1 kHz). The reference value of the permeability ratio for which frequencies are compared was μ / μ s t e e l = 0.1 . The nanocrystalline and amorphous material permeability in comparison to silicon steel is almost three decades shifted in the frequency domain (Figure 6). In the case of high-frequency flux penetration, the analyzed nanocrystalline magnetic core has the highest upper-frequency limit, more than 10 MHz.

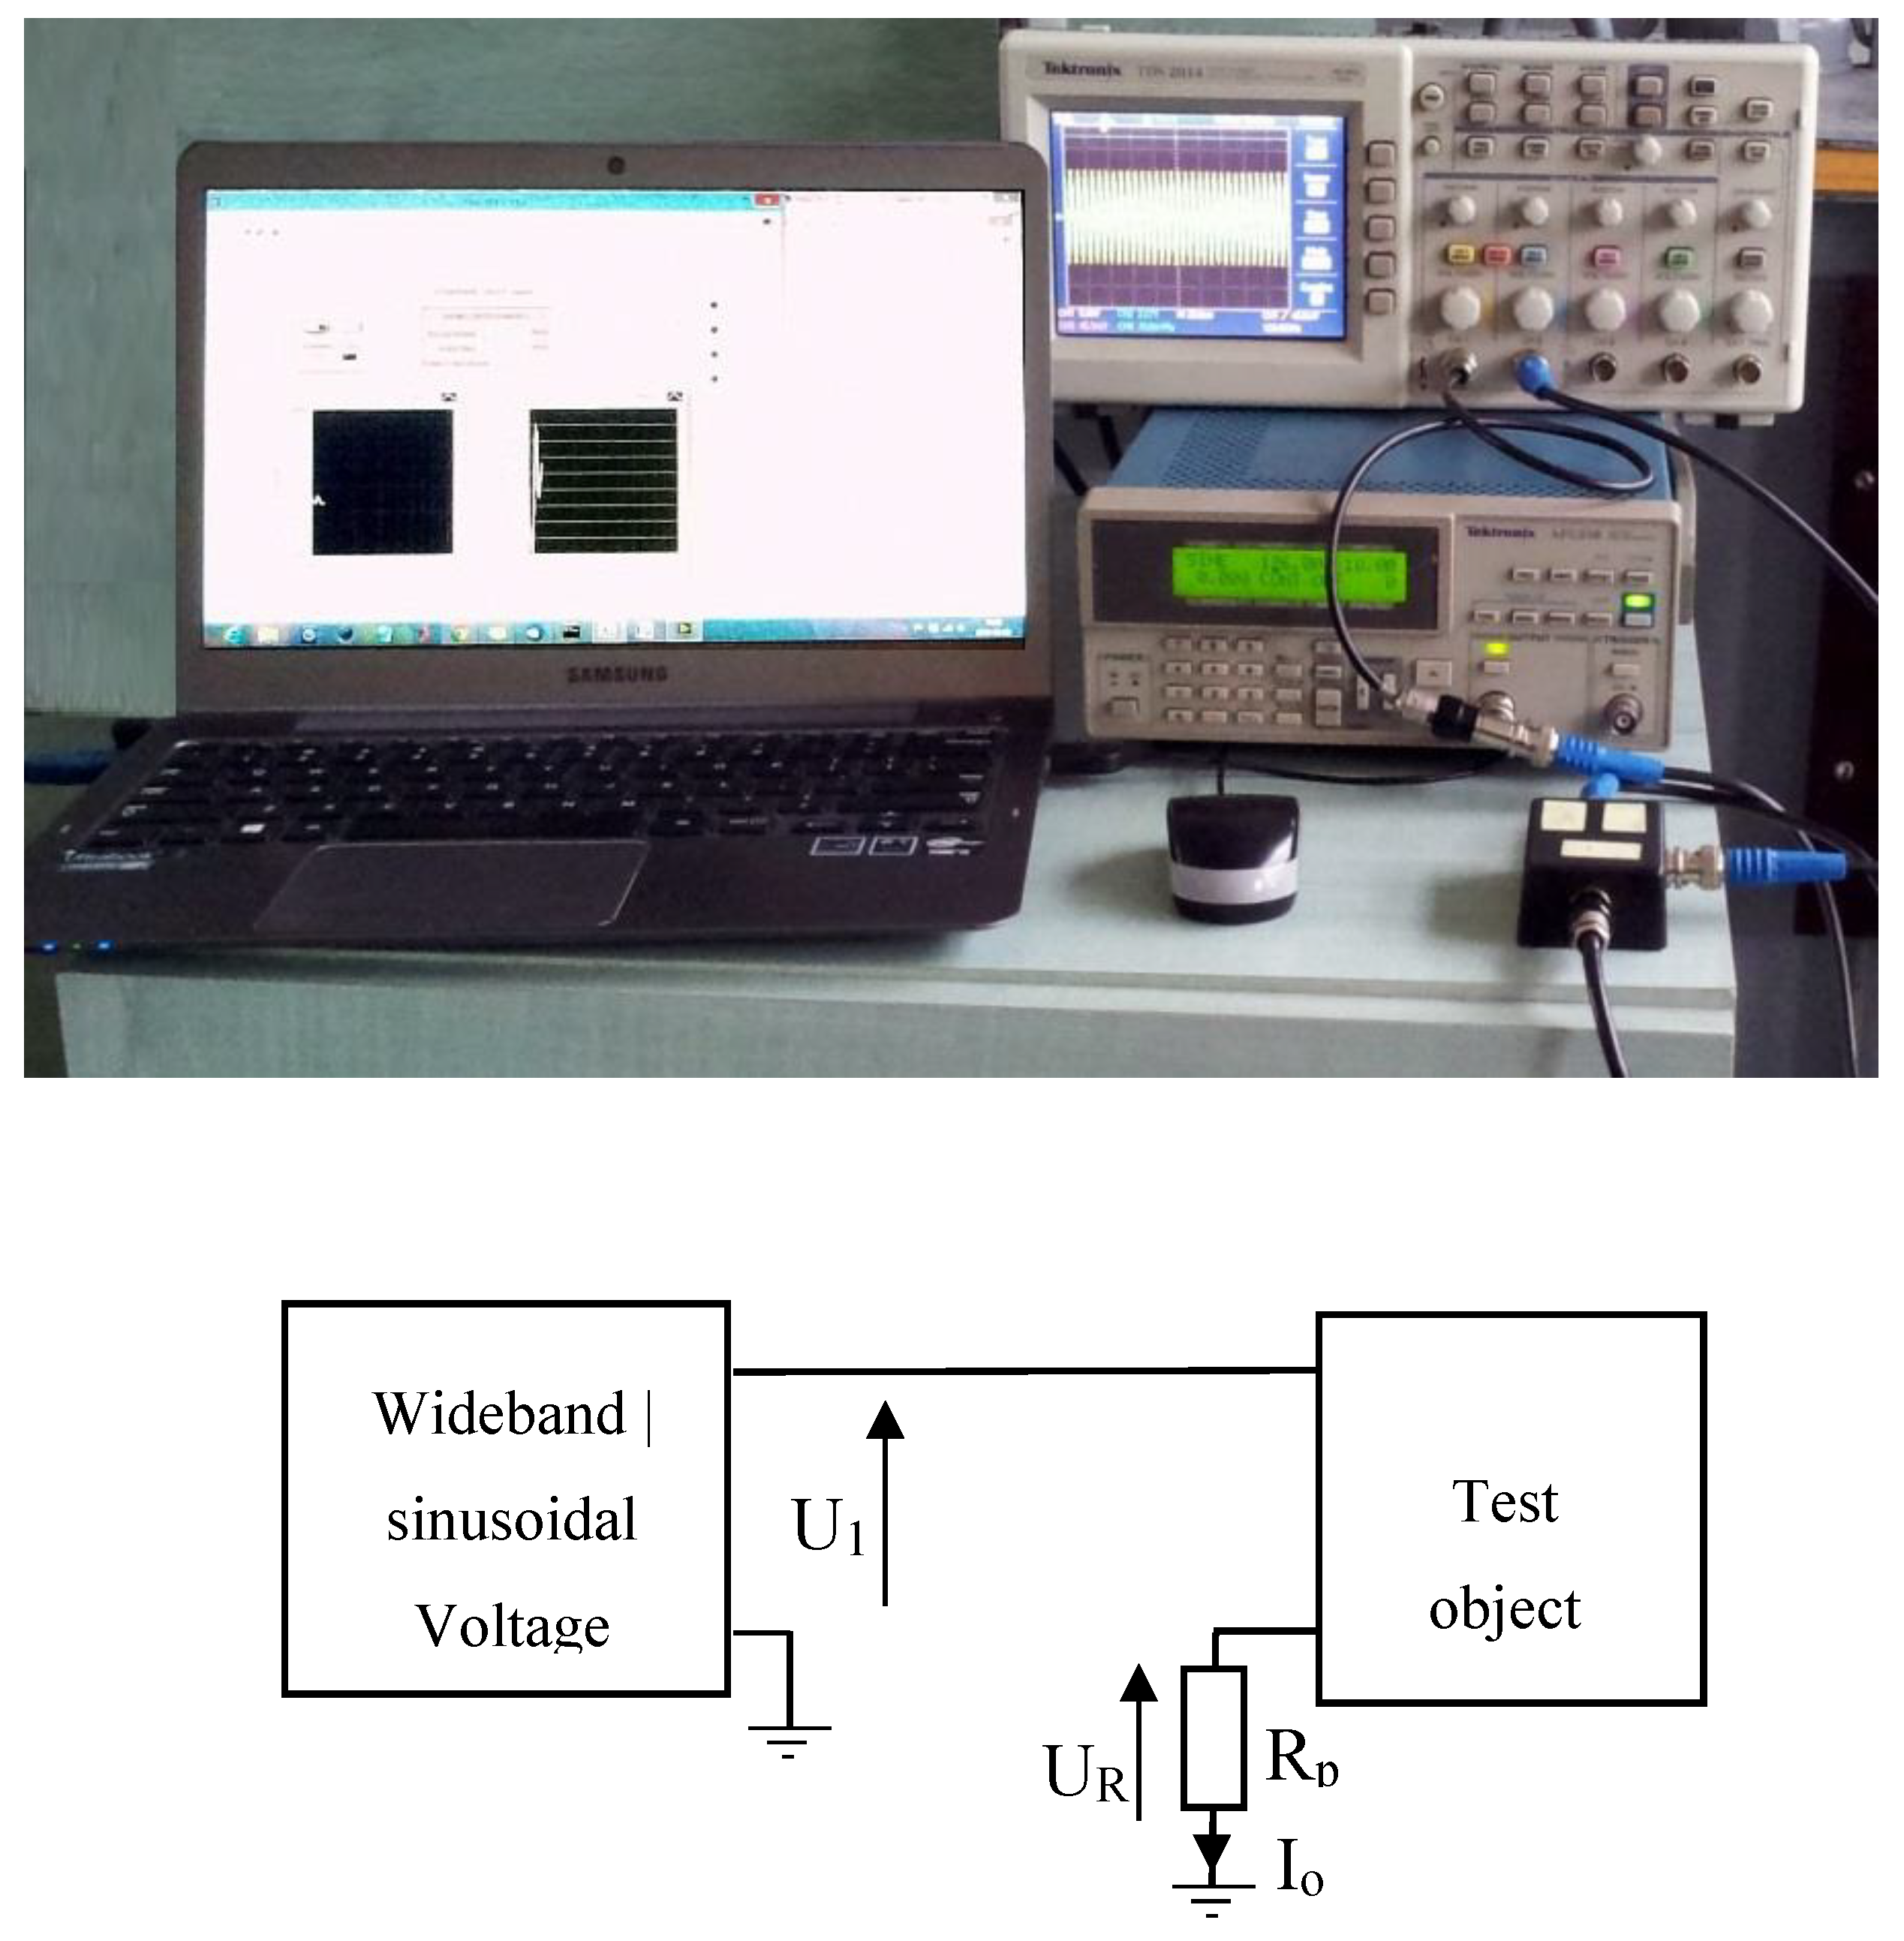
2.3. Measurement Stand

The base for the analysis were measurements of the high-frequency admittance and the voltage ratio. The laboratory stand used in investigations is presented in Figure 7. This stand consists of TEKTRONIX TDS1012 Oscilloscope, AFG 310 waveform generator, and computer. The equipment was connected through GPIB bus to control and data transfer. Components of the system were designed for measurements up to 5 MHz. Admittance calculations were performed on voltage drop measurements at non-inductive 50 Ω resistor. Control algorithms for the sweep frequency response analysis (SFRA) method are implemented in LabView Software. Amplitude and phase of particular measurement were calculated according to relations below [3]:
Y = I U = U R R p U 1 U R
φ = atan ( c o v ( U R , U 1 U R ) c o v ( U R , U R ) c o v ( U 1 U R , U 1 U R ) )
where cov(x,y) is a covariance function between signal x and y, UR is voltage measured at measuring resistor, U1 is feeding voltage.

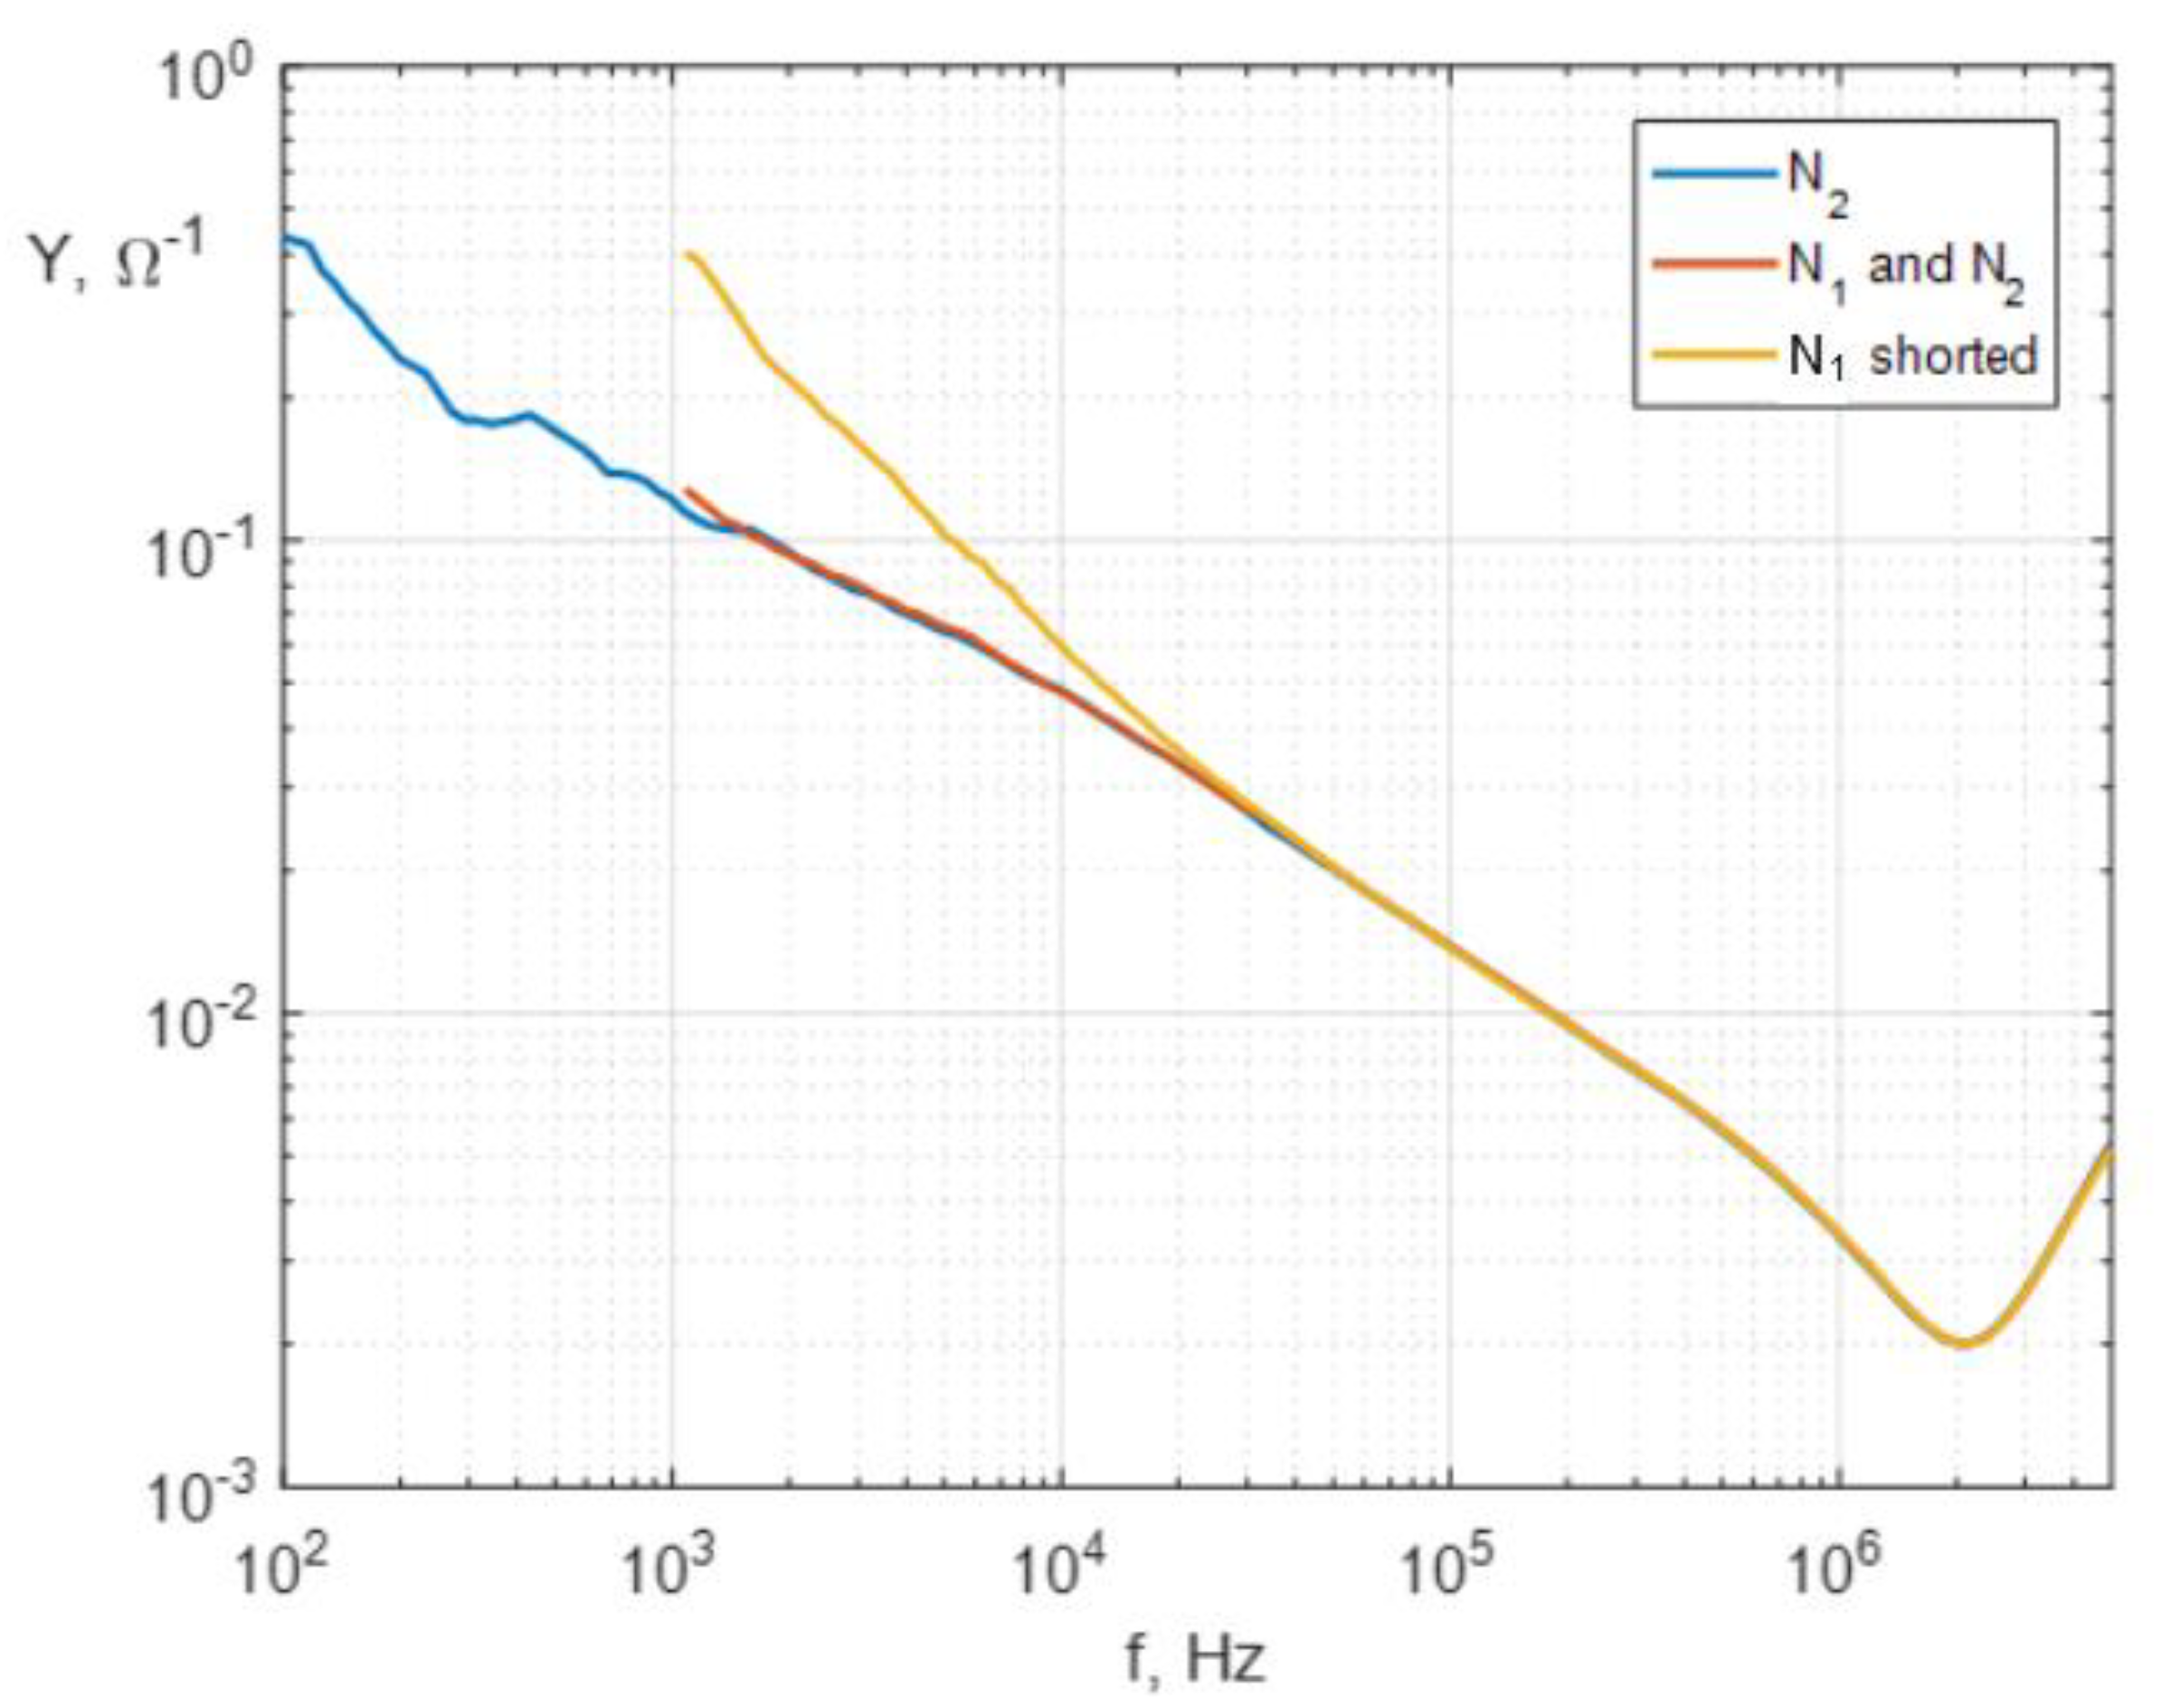
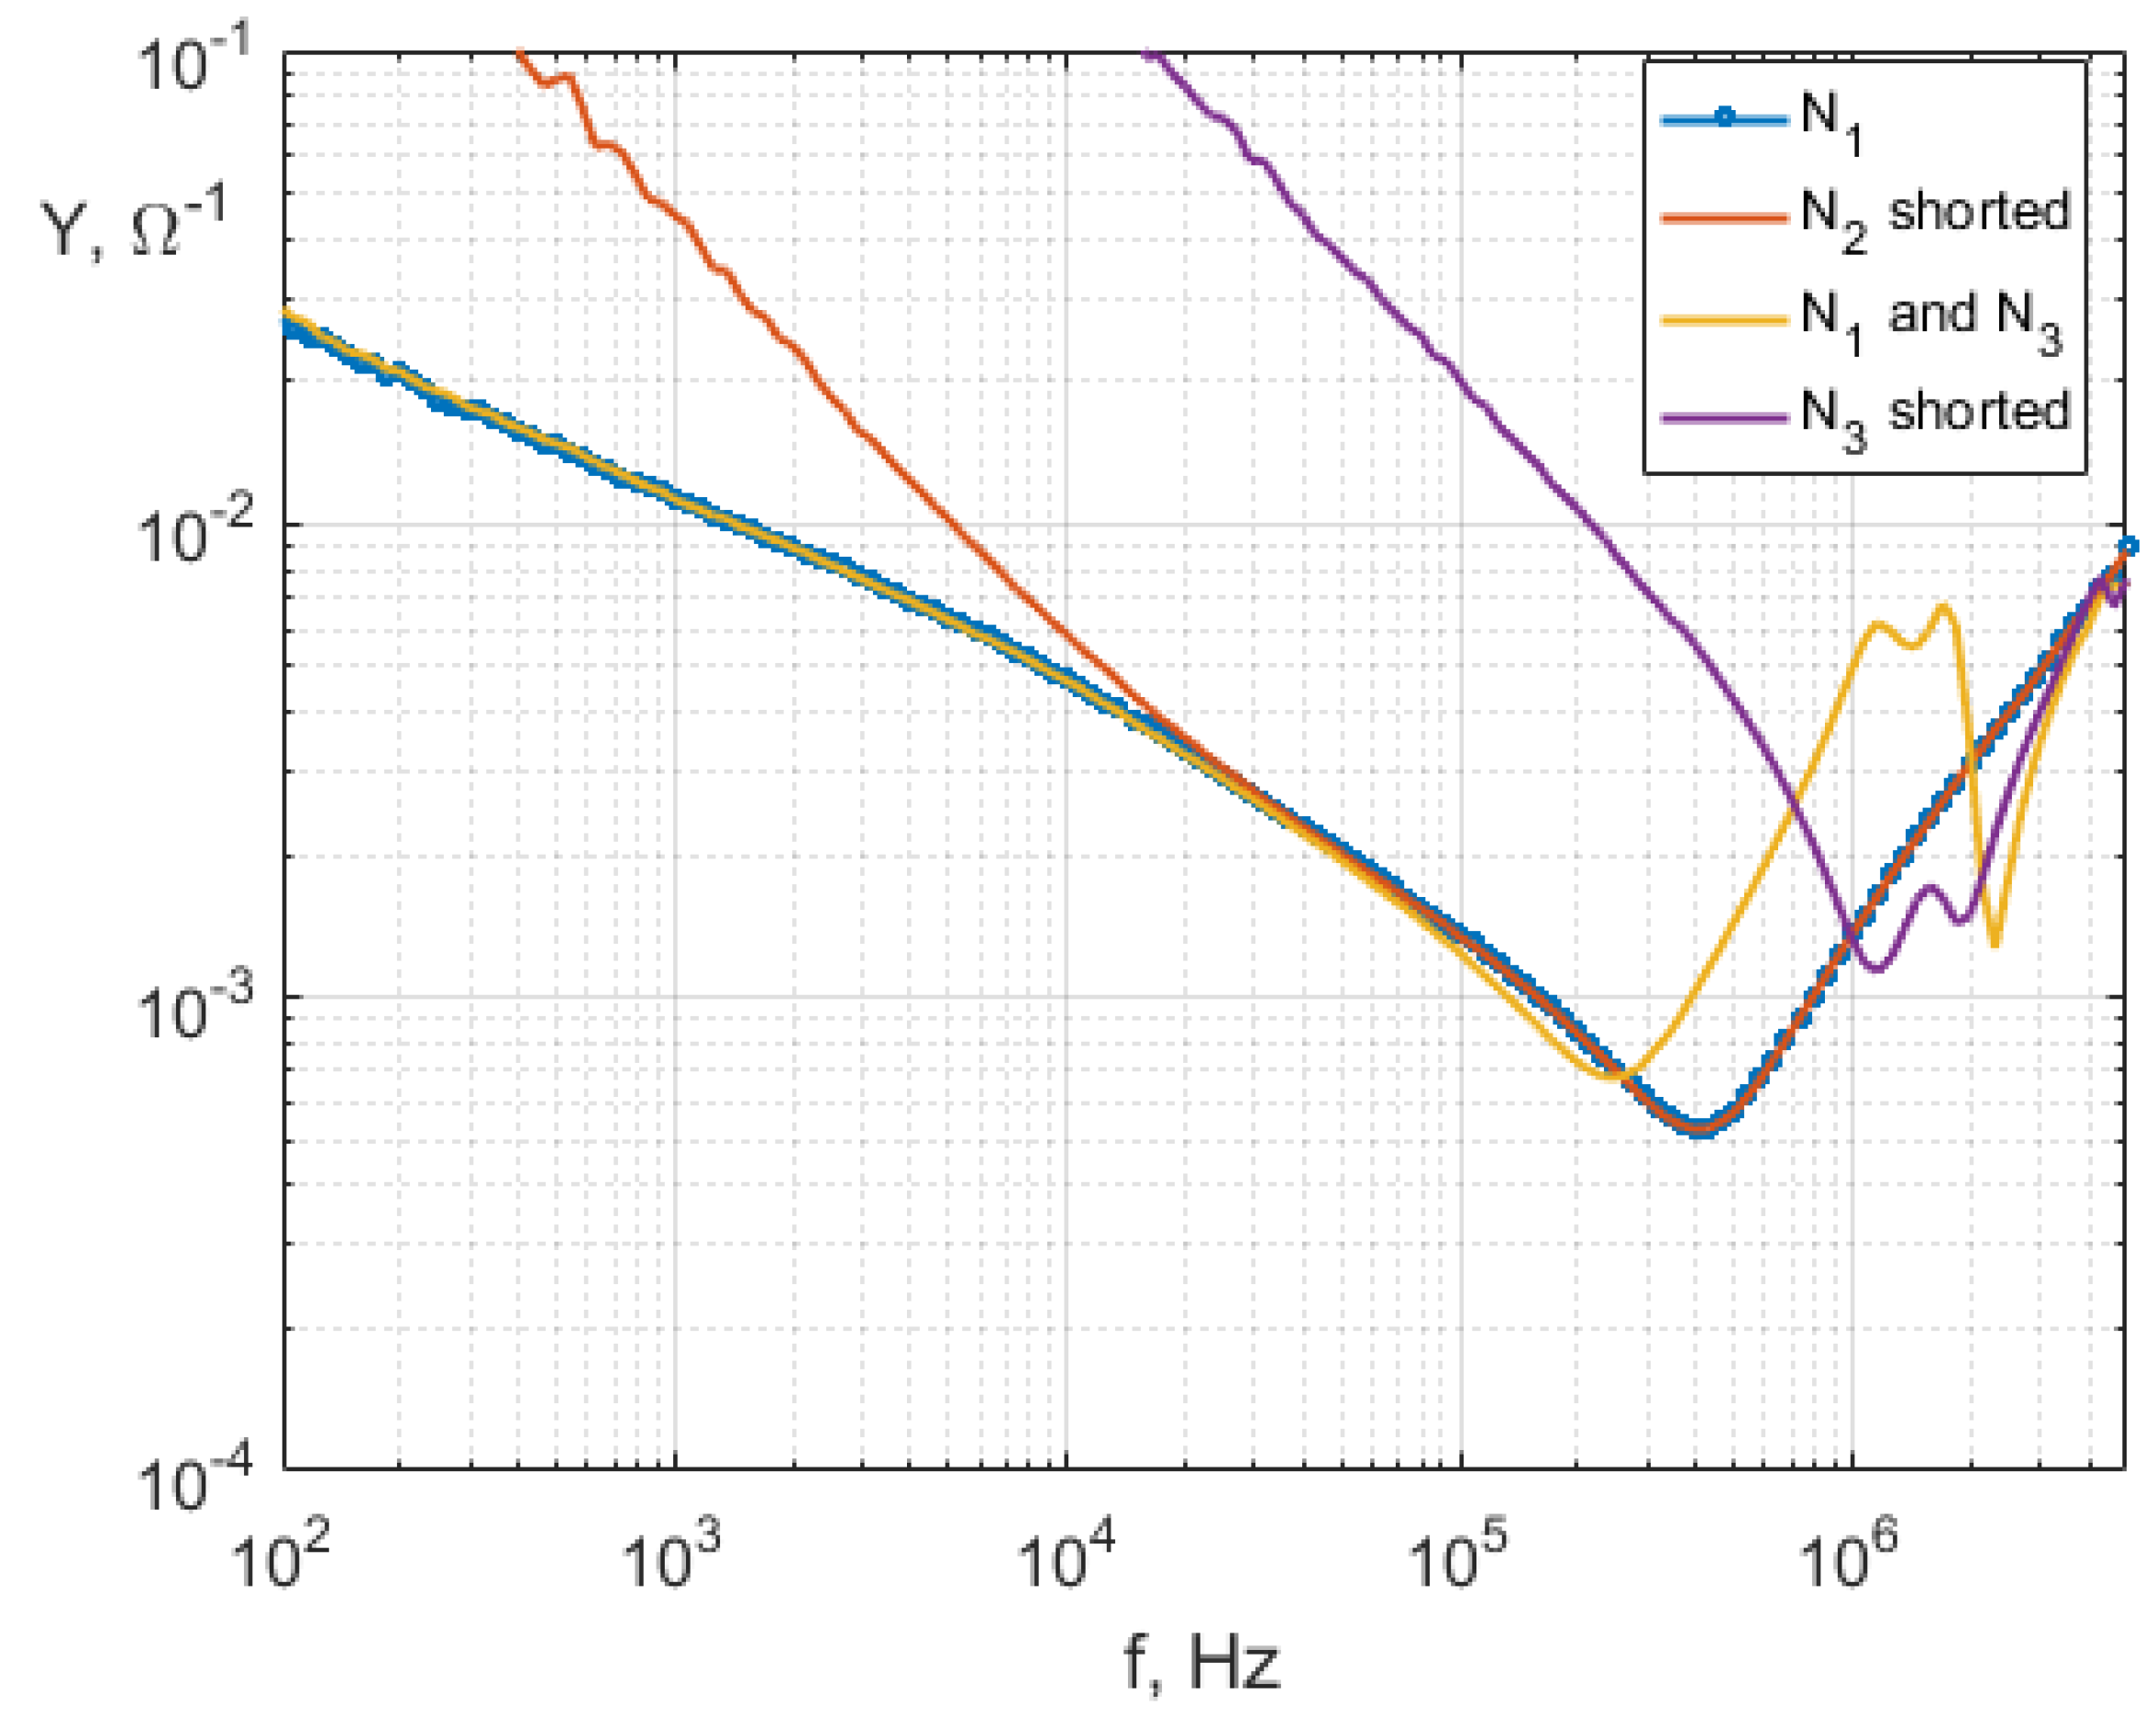
3. Measurement Results and Discussion

This section presents measurement results taken on the model objects with different magnetic core materials. The analysis covers wideband admittance and the ratio of the voltage induced in the coupled winding measurement. The main investigation focus on the analysis of frequency characteristics changes during coils deformation. Deformation implemented in coil N3 based on the elongation of the coil alongside the winding. Three levels of deformation were provided. Deformation 1%–2.5% of winding height elongation, deformation 2%–5% of winding height elongation, and deformation 3%–7.5% of winding height elongation. An additional aim of the analysis was to show high-frequency magnetic flux transmission through the material and the impact of additional coils placed on the same core on frequency characteristics. Measurements were taken with sinusoidal feeding voltage with frequency changes from 100 Hz up to 2 MHz. Source voltage was set to 2 V, for this voltage level model objects were not saturated and are threaten as linear time-invariant objects (LTI). The measurements were taken as described in Section 2.2. The admittance of single coil placed on the core is linked to the inductance of the coil and capacitive couplings between turns, layers, and core. Characteristic of inductance is related to magnetic material properties, on which coil is wounded, such as thickness, polarization, losses, physical structure, etc. Properties of the insulation system influence the characteristics of capacitance. Insulation material used for coil construction has a uniform structure, thus permittivity is constant in the analyzed frequency range. Measurements were performed on an object with the magnetic core made from conventional material, like silicon steel. The comparison was made to similar objects with an amorphous material core, which is used in high-efficiency power transformers or instruments transformers, and with the nanocrystalline core. Measured characteristics were compared to the reference case with no deformation.

3.1. Model with Silicon Steel Magnetic Core

The characteristics presented in this section refers to the model with the silicon steel magnetic core. The first part of the investigation covers the impact of the magnetic material type on the frequency characteristics. Figure 8 presents a comparison of admittance measured for the single-coil model (N2) and two coils model (N1, N2), which are wounded at different parts of the core model (Figure 3). Additionally, admittance characteristics with shorted coil N1 are presented. Admittance is measured only for coil N2. As can be seen, characteristics of single coil and cases with coil N1 open are almost identical in the analyzed frequency spectrum. Characteristic with shorted coupled coil N1 shows only differences in the frequency band up to 30 kHz, in this region magnetic flux form coil N1 counteracts on magnetic flux in coil N2 what cause inductance decrease. Silicon steel can transmit the magnetic flux only up to several kilohertz, in an analyzed case up to 30 kHz, which corresponds to permeability characteristic drop see Figure 6. An additional winding placed on a different part of the magnetic core doesn’t affect the frequency characteristic of the primary coil above several kHz. The magnetic coupling between these two coils is created by the magnetic flux in the core material.
Characteristics in Figure 9 presents the measurement result of admittance of coil N1 taken for the object with single-coil (N1) and object with two coils (N1, N3) placed directly on coil N1. This placement simulates the case of a single-phase transformer with primary and secondary windings on the same column. The figure also presents the characteristics of admittance with shorted coil N2 and with shorted coil N3.
Differences in characteristics of single-coil N1 and coil N3 placed on coil N1 (Figure 9) appears above the resonant frequency value, and for frequencies for which N1 winding has capacitive character. The single-coil N1 case has a resonant frequency equal to fr ~ 400 kHz. For the case with coil N3 placed on coil N1 resonant frequency fr of the coil, N1 drops to 220 kHz. The reduction of the frequency is caused by the higher capacitance of the whole system. The characteristic deviations are not observed up to the resonant frequency of coil N1 in (N1, N3 coil) case, while the magnetic flux does not cause current flow in the secondary coil N3. Above the resonant frequency of the coil N3, the capacitance of the test model seen from N1 side is higher than in the case of the single-coil N1 system. Placement of two coils on the same part of the core (N1, N3) reveals magnetic coupling caused by the magnetic core and by the air coupling which remains active when the high-frequency magnetic flux is displaced from the silicon steel core. This case shows that changes of coil admittance are caused by self-parameters of coil and parameters of the coupled coil. The ferromagnetic coupling is determined by parameters of the magnetic core and air coupling, which depends on the placement of the coil and appears for higher frequencies for which magnetic flux doesn’t penetrate magnetic core material (1).
Admittances of coil N1 measured for shorted coils N2 and N3 reveal frequencies for which coils are coupled with magnetic flux. The coil’s N2 magnetic flux, related to the core, impacts the characteristics up to 30 kHz. For the coil N3 magnetic core and air flux influences the characteristics of N1 up to resonant frequency 1.4 MHz.
The characteristics presented in Figure 10 shows the measurement results of voltages induced in coupled windings. The induced voltages were measured in coil N1 during feeding coil N2 and in coil N1 during feeding coil N3. The sinusoidal signal used in measurement allows interpreting the results as changes of magnetic flux in the coupled coil. Additionally, the relation of the skin depth to material thickness was shown in Figure 10.
The analysis of results presented in Figure 10 shows that magnetic flux from coil N2 induces voltages in coil N1 up to 30 kHz (assumed 6 dB bandwidth). At the 30 kHz the permittivity drops to 5.5% of initial value (Figure 6). Behavior of inducted voltage in coil N1 corresponds to the decrease of calculated skin depth in this material, and matches the results obtained from admittances measurement (Figure 8 and Figure 9). The Woodman frequency calculated for this material equals to 91 Hz (Table 1). The results confirm that silicon steel transmits magnetic flux only up to several kilohertz (depending on the thickness and its electric and magnetic properties). The characteristic of the voltages induced in coil N1 caused by the magnetic flux from coil N3 has a higher upper-frequency limit, while a high level of voltage (equal to turn ratio) is induced in winding N1 up to resonance peak (for this system fr = 0.9 MHz). This mechanism is related to magnetic flux coupling provided by the magnetic core and air coupling between coils.
The case of model object with silicon steel magnetic core shows that two coils can interact with others only when resonant frequencies lay below the cut-off frequency of magnetic material or in a case when two windings are placed on the same part of the magnetic core.
The second case of investigations covers the impact of coil deformation on the frequency characteristics of the coil system placed on the silicon steel magnetic core. The measured results are compared to the reference case of healthy coil N3. Results presented in Figure 11, Figure 12 and Figure 13 shows respectively admittances of coil N1 placed on the same column, like coil N3, which is deformed, the admittance of coil N2 placed at the opposite leg of the silicon steel core, and the admittance of deformed coil N3. The analysis of the result shows the deformation of coil N3 impacts the inter-turn capacitance of coil N3 (Figure 13), as changes of characteristics near its resonant frequency (192 kHz). It can be noticed that the frequency characteristics below resonant frequency are shifted, this is related to the lower magnetic coupling provided by the magnetic core, caused by the higher distances between turns. This effect is magnified, especially for higher frequencies for which permeability of silicon steel is lower (Figure 6). The admittance of the coil N1, which is coupled by magnetic core flux, air flux, and capacitive coupling, is also affected in this investigation, mostly in the frequency region where is a high capacitive coupling between coils (f > 900 kHz). Characteristics of coil N2 are not affected by the deformation of coil N3, because of the lack of magnetic coupling between these two coils at higher frequencies and very weak capacitive coupling.

3.2. Model with Amorphous Magnetic Core

Results presented in this part show the impact on changes in frequency characteristics of model coils placed on the amorphous magnetic core. The methodology of measurements is the same as in Section 3.1.
The admittance frequency characteristics measured for the configuration of single-coil (N2) and two coils (N1, N2) placed on different parts of the magnetic core are presented in Figure 14. The characteristic for single-coil (N1), and two coils (N1, N3) placed at the same part of core are shown in Figure 15. Both cases show differences in the characteristics of a single coil system and two coil systems. The first resonant frequency is lowered, in the case of two coils on the different columns of the magnetic core (Figure 14 f1 = 200 kHz drops to f2 = 105 kHz). In the case of coils placed at the same column of the magnetic core (Figure 15), the resonant frequency f1 = 200 kHz drops to f2 = 67 kHz. The drop in the resonant frequency is caused by the rise of the capacitance in the system. In the case with coils placed on the different columns, the capacitance of coil N1 is increased by the self-capacitance of coil N2, stimulated by the HF magnetic flux. For the case with coils placed on the same column, capacitance is increased with the capacitive coupling between coils. The maximal resonant peaks appearing in both figures are related to parallel resonance (and maximal induced current flow in a coupled coil Figure 4). Figure 14 and Figure 15 present measurements of admittances in the case with coupled winding shorted. For both configurations, differences in the whole analyzed spectrum are observed. The frequency bands in which the measured coil has capacitive character are not affected (f > above 1 MHz). Obtained results confirm that for the case of coils placed on the different parts of the magnetic core, high-frequency magnetic flux is transmitted through amorphous material.
The different behavior of admittance frequency characteristics of coils, in comparison to the silicon steel model, is by the different physical phenomena in these two materials (Figure 5 and Figure 6). The magnetic flux flowing through the core with amorphous material is transmitted for higher frequencies. The calculated Woolman frequency for the analyzed amorphous core is higher than for silicon steel and equals to 4578 Hz. The calculated permittivity spectrum is shifted more than three decades than for the silicon steel (Figure 6). The calculations confirm the measurements of the voltage induced in coupled coils (Figure 16) placed on the different columns of core (N1, N2) and for the same columns of the core (N1, N3). The voltage ratio in both cases is equal to the turn ratio due to strong magnetic coupling up to a resonant frequency of winding at which voltage is measured.
Results presented in this section show that amorphous materials have significantly higher cut off frequencies and transmit magnetic flux in higher frequencies more effectively, for an analyzed model, up to more than 100 kHz, in comparison to model with silicon steel (see Figure 6). The lower resonant frequencies of voltages induced in the winding, than in silicon steel cases, are by higher inductance caused by higher permeability of amorphous material in a wideband spectrum ( f r = 1 / ( 2 π L C )).
Results shown in Figure 17, Figure 18 and Figure 19, presents admittances of coils during the deformation of coil N3. Results presented in Figure 17, behave similarly to results seen in case with a silicon steel magnetic core. Admittance of coil N1, placed on the same column of the magnetic core, is influenced by the changes of the geometry of coil N3. The most visible differences are seen above resonant frequency (approx. 80 kHz). This frequency band is correlated with the interaction between winding. For the same column coils, interaction is realized by capacitive coupling and magnetic coupling between windings. Results presented in Figure 18 shows the behavior of admittance of coil N2 placed at another column of the amorphous core. These characteristics behave differently than in the case with a silicon steel magnetic core. The N2 characteristics are affected by deformations of coil N3. The most important changes are appearing in the frequency band between 80 kHz and 450 kHz. These changes are caused by the high magnetic coupling existing between these two coils, provided by the properties of amorphous material. The changes in the frequency characteristics of coil N3 are only observed for the part related to the capacitance of the coil (>65 kHz).

3.3. Model with Nanocrystalline Magnetic Core

The last analyzed test object case takes into consideration the magnetic core made with nanocrystalline magnetic material (Table 1, Figure 3). Admittance characteristics for single-coil N1 and coil N2 placed on an opposite column of the core are presented in Figure 20. For the case with coils N1, N3 placed on the column, results are presented in Figure 21.
Presented results show similar behavior of analyzed thin-film nanocrystalline magnetic core to amorphous core presented in Section 3.2. Coils placed on the same part of the core and at different columns interact with each other in the high-frequency spectrum, increasing the capacitance of the whole system. The high capacitance impact on admittance characteristics, shifting resonant frequencies and revealing additional resonances in-band above 200 kHz, related to the resonance of coupled windings. The lower resonant frequency of single coils is due to the higher permeability of this material (Figure 2 and Figure 6). The results confirm that nanocrystalline magnetic material carries magnetic flux for frequencies above 1 MHz.
The impact of coil N3 deformation on FRA admittance measurement are presented in Figure 22, Figure 23 and Figure 24. The admittance characteristics of deformed coil N3 (Figure 24) reveals changes only above the resonant frequency (fr = 6 kHz). The most differences are noticeable in the characteristics of coil N1 placed in the same column (Figure 22). The differenced of coil N1 characteristics appear for frequencies higher than 9 kHz. Characteristics of the coil N2 placed at the different columns are strongly affected by the deformation of N3, the most visible changes are in the frequency band 7–500 kHz.
Table 2 presents a comparison of measured frequency characteristic changes in frequency bands defined by the IEC standard [2]. It can be seen that for analysis of the same level of deformation of windings, differences in measured spectra for tested objects appear in different regions. The first region with frequencies up to 2 kHz is not affected by the winding deformations. The changes in frequency characteristics of windings placed on the same column as deformed winding are caused by the high magnetic coupling. In the case of silicon steel at higher frequencies, air coupling is dominant. The HF magnetic material coupling for the amorphous and nanocrystalline material cause also differences in frequency characteristics of windings placed at the different columns than the deformed winding, this phenomenon is not observed for the silicon steel object.
Table 3 presents the frequency limits in which differences, in measured frequency characteristics for the analyzed materials, are observed. Mostly the deformation of the winding causes the differences above the first resonant frequency. For this resonance the test system is seen as a capacitive object. The results for the deformed winding (N3) placed on the silicon steel shows that the differences are also visible in the frequencies corresponding to the inductive character of the winding. This is caused by the changes in the magnetic coupling between adjacent turns. This effect is not observed in the amorphous and nanocrystalline material due to its high permittivity and higher Woolman cut-off frequency.

4. Conclusions

This article presents novel results of modern magnetic material’s impact on the behavior of coils system in the high-frequency measurements. Silicon steel is the most widely used material in electrical power engineering, is well known for its behavior in diagnostic procedures, e.g., determination of the mechanical condition of winding and core by the FRA method. The lack of high-frequency magnetic flux transmission caused by high skin penetration depth into silicon steel sheets reduces the induction of HF voltages in coils placed on different parts of the core. An application of new types of magnetic materials like amorphous or nanocrystalline can lead to misinterpretation of diagnostic factors in fault type recognition by current state-of-the-art guidelines. The assumption that magnetic core in power transformers impact frequencies up to several kHz has to be extended, for amorphous and nanocrystalline transformers in the range up to MHz. Commonly seen in standards and scientific articles, frequency characteristics region division has to be updated, mainly in the band correlated with magnetic core influence and the interaction between windings.
The deformation of coils is observed in admittance characteristics changes. In the case of the silicon steel magnetic core, the admittances of coils are affected only by the deformation of the coils at the same column. In analyzed cases with amorphous and nanocrystalline cores changes of frequency characteristic for frequencies above first resonant frequencies can be caused by deformations of coupled coils and can be not provided by the analyzed coil. The coils placed at another part of the magnetic core to defected coils are also subjected to changes of admittances due to high magnetic coupling at higher frequencies. Most changes are observed in a frequency band above the first resonant frequency which is related to the construction of coil and parameters of the magnetic core. Determination of frequency characteristic of winding placed on amorphous magnetic core or nanocrystalline magnetic core for frequency response analysis diagnostics in test type configuration with all other terminals floating can lead to a misinterpretation of the current state of this winding. The misinterpretation can consist of an erroneous assessment of the winding fault caused by the interaction of windings placed on other columns of the core.

Funding

This research received no external funding.

Conflicts of Interest

The author declares no conflict of interest.

References

  1. CIGRE. Guide for Transformer Maintenance; CIGRE Technical Brochure No. 445; CIGRE: Paris, France, 2011. [Google Scholar]
  2. IEEE. IEEE Guide for Interpretation of Gases Generated in Natural Ester and Synthetic Ester-Immersed Transformers; IEEE Std C57.155-2014; Institute of Electrical and Electronics Engineers (IEEE): Piscataway, NJ, USA, 2014; pp. 1–52. [Google Scholar]
  3. Florkowski, M.; Furgał, J.; Kuniewski, M. Propagation of overvoltages in distribution transformers with silicon steel and amorphous cores. IET Gener. Transm. Distrib. 2015, 9, 2736–2742. [Google Scholar] [CrossRef]
  4. Sima, W.; Liu, Y.; Sun, P.; Zhou, Y.; Peng, D.; Yang, M. The Effect of Different Core Materials on Transformer Inrush Currents. In Proceedings of the 2018 IEEE International Magnetics Conference (INTERMAG), Singapore, 23–27 April 2018; pp. 1–4. [Google Scholar]
  5. Tenbohlen, S.; Coenen, S.; Djamali, M.; Müller, A.; Samimi, M.H.; Siegel, M. Diagnostic Measurements for Power Transformers. Energies 2016, 9, 347. [Google Scholar] [CrossRef]
  6. Piotrowski, T.; Rózga, P.; Kozak, R. Comparative Analysis of the Results of Diagnostic Measurements with an Internal Inspection of Oil-Filled Power Transformers. Energies 2019, 12, 2155. [Google Scholar] [CrossRef] [Green Version]
  7. Florkowski, M.; Furgał, J. Transformer winding defects identification based on a high frequency method. Meas. Sci. Technol. 2007, 18, 2827–2835. [Google Scholar] [CrossRef]
  8. Khalilisenobari, R.; Sadeh, J.; Borsi, H. Frequency response analysis (FRA) of transformers as a tool for fault detection and location: A review. Electr. Power Syst. Res. 2018, 155, 172–183. [Google Scholar] [CrossRef]
  9. Alsuhaibani, S.; Khan, Y.; Beroual, A.; Malik, N.H. A Review of Frequency Response Analysis Methods for Power Transformer Diagnostics. Energies 2016, 9, 879. [Google Scholar] [CrossRef] [Green Version]
  10. Gomez-Luna, E.; Gonzalez-Garcia, C.; Mayor, G.A.; Guerra, J.P. Current Status and Future Trends in Frequency-Response Analysis with a Transformer in Service. IEEE Trans. Power Deliv. 2013, 28, 1024–1031. [Google Scholar] [CrossRef]
  11. Kuniewski, M.; Zydron, P. Analysis of the Applicability of Various Excitation Signals for FRA Diagnostics of Transformers. In Proceedings of the 2018 IEEE 2nd International Conference on Dielectrics (ICD), Budapest, Hungary, 1–5 July 2018; pp. 1–4. [Google Scholar]
  12. IEC. 60076-18 Edition 1.0 2012-07 Power Transformers—Part 18: Measurement of Frequency Response; IEC: Geneva, Switzerland, 2012. [Google Scholar]
  13. IEEE. IEEE Guide for the Application and Interpretation of Frequency Response Analysis for Oil-Immersed Transformers; IEEE C57.149-2012; Institute of Electrical and Electronics Engineers (IEEE): Piscataway, NJ, USA, 2013. [Google Scholar]
  14. CIGRE. Mechanical-Condition Assessment of Transformer Windings Using Frequency Response Analysis (FRA); CIGRE Technical Brochure No. 342; CIGRE: Paris, France, 2008. [Google Scholar]
  15. Kumar, A.; Singh, S.K.; Negi, J.; Husain, Z.; Jarial, R. Core Magnetization Effect in Sweep Frequency Response Analysis for Transformer Diagnosis. In Proceedings of the 2015 Second International Conference on Advances in Computing and Communication Engineering, Dehradun, India, 1–2 May 2015; pp. 112–117. [Google Scholar]
  16. Zhang, Z.; Gao, W.; Kari, T.; Lin, H. Identification of Power Transformer Winding Fault Types by a Hierarchical Dimension Reduction Classifier. Energies 2018, 11, 2434. [Google Scholar] [CrossRef] [Green Version]
  17. Samimi, M.H.; Tenbohlen, S. FRA interpretation using numerical indices: State-of-the-art. Int. J. Electr. Power Energy Syst. 2017, 89, 115–125. [Google Scholar] [CrossRef]
  18. Bagheri, M.; Phung, B.; Blackburn, T. Transformer frequency response analysis: Mathematical and practical approach to interpret mid-frequency oscillations. IEEE Trans. Dielectr. Electr. Insul. 2013, 20, 1962–1970. [Google Scholar] [CrossRef]
  19. Banaszak, S.; Szoka, W. Cross Test Comparison in Transformer Windings Frequency Response Analysis. Energies 2018, 11, 1349. [Google Scholar] [CrossRef] [Green Version]
  20. Bagheri, M.; Lu, M.; Hashemi, M.; Phung, B.T. Transformer frequency response: A new technique to analyze and distinguish the low-frequency band in the frequency response analysis spectrum. IEEE Electr. Insul. Mag. 2018, 34, 39–49. [Google Scholar] [CrossRef]
  21. Gutten, M.; Korenčiak, D.; Kučera, M.; Janura, R.; Glowacz, A.; Kantoch, E. Frequency and time fault diagnosis methods of power transformers. Meas. Sci. Rev. 2018, 18, 162–167. [Google Scholar] [CrossRef] [Green Version]
  22. Smugala, D.; Bonk, M.; Ziemski, R. Single-phase magnetic cores’ faults diagnosis using FRA approach. Measurement 2018, 114, 428–435. [Google Scholar] [CrossRef]
  23. Gawrylczyk, K.M.; Trela, K. Frequency Response Modeling of Transformer Windings Utilizing the Equivalent Parameters of a Laminated Core. Energies 2019, 12, 2371. [Google Scholar] [CrossRef] [Green Version]
  24. Cheng, B.; Crossley, P.; Wang, Z.; Jarman, P.; Fieldsend-Roxborough, A. Interpretation of FRA Results through Low Frequency Transformer Modelling. In Proceedings of the 2019 2nd International Conference on Electrical Materials and Power Equipment (ICEMPE), Guangzhou, China, 7–10 April 2019; pp. 592–595. [Google Scholar]
  25. Hilzinger, R.; Rodewald, W. Magnetic Materials, Fundamentals, Products, Properties, Applications; Publics; Publics Publishing: Erlangen, Germany, 2012; ISBN 978-3-895-78352-4. [Google Scholar]
  26. Abeywickrama, K.G.N.B.; Podoltsev, A.; Serdyuk, Y.V.; Gubanski, S.M. Computation of Parameters of Power Transformer Windings for Use in Frequency Response Analysis. IEEE Trans. Magn. 2007, 43, 1983–1990. [Google Scholar] [CrossRef]
  27. Abeywickrama, N.; Serdyuk, Y.; Gubanski, S. Effect of Core Magnetization on Frequency Response Analysis (FRA) of Power Transformers. IEEE Trans. Power Deliv. 2008, 23, 1432–1438. [Google Scholar] [CrossRef]
  28. Samimi, M.H.; Tenbohlen, S.; Akmal, A.A.S.; Mohseni, H.; Mohsseni, H. Effect of Different Connection Schemes, Terminating Resistors and Measurement Impedances on the Sensitivity of the FRA Method. IEEE Trans. Power Deliv. 2016, 32, 1713–1720. [Google Scholar] [CrossRef]
  29. Wang, Z.; Li, J.; Sofian, D. Interpretation of Transformer FRA Responses—Part I: Influence of Winding Structure. IEEE Trans. Power Deliv. 2009, 24, 703–710. [Google Scholar] [CrossRef]
  30. Sofian, D.M.; Wang, Z.; Li, J. Interpretation of Transformer FRA Responses—Part II: Influence of Transformer Structure. IEEE Trans. Power Deliv. 2010, 25, 2582–2589. [Google Scholar] [CrossRef]
  31. Li, C.X.; Zhu, T.Y.; Xia, Q.; Yao, C.G.; Zhao, Z.Y.; Li, C.; Zhu, T.; Zhao, Z.; Yao, C. Influence of untested winding in FRA test for winding diagnosis. IET Gener. Transm. Distrib. 2018, 12, 1704–1711. [Google Scholar] [CrossRef]
  32. Richardson, B. Amorphous metal cored transformers Justifying Their Use. In Proceedings of the IEE Colloquium on Magnetic Ribbons and Wires in Power, Electronic and Automotive Applications, London, UK, 23 November 1990; pp. 1–4. [Google Scholar]
  33. Almessiere, M.A.; Slimani, Y.; Güngüneş, H.; Kostishyn, V.G.; Trukhanov, S.V.; Trukhanov, A.V.; Baykal, A. Impact of Eu3+ ion substitution on structural, magnetic and microwave traits of Ni–Cu–Zn spinel ferrites. Ceram. Int. 2020, 46, 11124–11131. [Google Scholar] [CrossRef]
  34. Hasegawa, R. Impact of amorphous metal based transformers on efficiency and quality of electric power distribution. In Proceedings of the 2001 Power Engineering Society Summer Meeting (Cat. No.01CH37262), Vancouver, BC, Canada, 15–19 July 2001; Volume 3, pp. 1820–1823. [Google Scholar]
  35. Sarker, P.C.; Islam, R.; Guo, Y.; Zhu, J.; Lu, H.-Y. State-of-the-Art Technologies for Development of High Frequency Transformers with Advanced Magnetic Materials. IEEE Trans. Appl. Supercond. 2018, 29, 1–11. [Google Scholar] [CrossRef] [Green Version]
  36. Grybos, D.; Leszczynski, J.; Swieboda, C.; Kwiecień, M.; Rygal, R.; Soiński, M.; Pluta, W.A. Magnetic properties of composite cores made of nanocrystalline material for high frequency inductors and transformers. In Proceedings of the 2018 Innovative Materials and Technologies in Electrical Engineering (i-MITEL), Sulecin, Poland, 18–20 April 2018; pp. 1–6. [Google Scholar] [CrossRef]
  37. Kimura, N.; Morizane, T.; Iyoda, I.; Nakao, K.; Yokoyama, T. Middle Frequency Solid State Transformer for HVDC Transmission from Offshore Windfarm. In Proceedings of the 2018 International Power Electronics Conference (IPEC-Niigata 2018-ECCE Asia), Niigata, Japan, 20–24 May 2018; pp. 2914–2920. [Google Scholar]
  38. Kurita, N.; Nishimizu, A.; Kobayashi, C.; Tanaka, Y.; Yamagishi, A.; Ogi, M.; Takahashi, K.; Kuwabara, M. Magnetic Properties of Simultaneously Excited Amorphous and Silicon Steel Hybrid Cores for Higher Efficiency Distribution Transformers. IEEE Trans. Magn. 2018, 54, 1–4. [Google Scholar] [CrossRef]
  39. Ismagilov, F.R.; Kiselev, M.A.; Vavilov, V.E.; Gusakov, D.V. Design Algorithm of an Aircraft Power Generation System. IEEE Trans. Aerosp. Electron. Syst. 2019, 55, 2899–2910. [Google Scholar] [CrossRef]
  40. Volokhin, V.V.; Diahovchenko, I. The use of nanocrystalline and amorphous materials for electric energy metering improvement and reducing the effects of external magnetic fields. In Proceedings of the 2016 International Conference on Nanomaterials: Application & Properties (NAP), Lviv, Ukraine, 14–19 September 2016; pp. 02NEA03-1–02NEA03-3. [Google Scholar]
  41. Rahaman, M.; Sandhu, K.S. Energy Efficient magnetic materials for Electrical Machines. In Proceedings of the 2019 5th International Conference on Advanced Computing & Communication Systems (ICACCS), Coimbatore, India, 15–16 March 2019; pp. 642–646. [Google Scholar]
  42. Szewczyk, M.; Piasecki, W.; Stosur, M.; Florkowski, M.; Riechert, U. Damping of VFTO in Gas-Insulated Switchgear by a New Coating Material. IEEE Trans. Power Deliv. 2016, 31, 2553–2558. [Google Scholar] [CrossRef]
Figure 1. Magnetization characteristic of materials used as a magnetic core in power transformers.
Energies 13 02424 g001
Figure 2. Permittivity characteristics of materials used as a magnetic core in power transformers.
Energies 13 02424 g002
Figure 3. Scheme of test object used in the analysis, N1, N2, N3—coils, lfe—mean magnetic path, Φ—magnetic flux, Sfe—a cross-section of magnetic core material.
Energies 13 02424 g003
Figure 4. Equivalent scheme of (a) magnetic circuit and (b) simplified electric circuit for test object (Figure 3), N1, N2, N3—coils, Y—the reluctance of yokes, C—the reluctance of columns, ϕ m —main magnetizing flux in magnetic core, ϕ m —magnetizing flux in core and between air-coupled N1, N3 coils, ϕ L 1 , ϕ L 2 , ϕ L 3 —leakage flux for coils N1, N2, N3 respectively, L1, L2—self-inductance of coils, M12—mutual inductance between coils, C1, C2—self-capacitance of coils, C12—mutual capacitance between coils.
Energies 13 02424 g004
Figure 5. The ratio of magnetic flux depth penetration to material thickness, calculated for different core materials.
Energies 13 02424 g005
Figure 6. Calculated permeability characteristics of analyzed samples in the wide frequency range, considering the skin depth, results normalized to silicon steel low frequency permeability.
Energies 13 02424 g006
Figure 7. View of measurement stand (up) and single line diagram of measurement scheme (down).
Energies 13 02424 g007
Figure 8. Admittance frequency characteristics of N2 winding placed on silicon steel magnetic core, with a different configuration of N1 winding, coils placed at the different core leg.
Energies 13 02424 g008
Figure 9. Admittance frequency characteristics of N1 winding placed on the silicon steel magnetic core, with different winding configurations of N2 and N3.
Energies 13 02424 g009
Figure 10. Frequency characteristics of voltages ratio induced in coupled winding (N1) placed at silicon steel magnetic core while feeding winding coil N2 or N3, performed with SFRA method.
Energies 13 02424 g010
Figure 11. Admittance frequency characteristics of N1 winding, during deformation of N3 winding placed at the same core leg, test object with silicon steel core.
Energies 13 02424 g011
Figure 12. Admittance frequency characteristics of N2 winding, during deformation of N3 winding placed at the different core leg, test object with silicon steel core.
Energies 13 02424 g012
Figure 13. Admittance frequency characteristics of N3 winding during its deformation, test object with silicon steel core.
Energies 13 02424 g013
Figure 14. Comparison of the admittance frequency characteristic of N2 coil placed on the amorphous magnetic core with a different configuration of N1 coil, coils placed at the different core leg.
Energies 13 02424 g014
Figure 15. Comparison of the admittance frequency characteristic of N1 coil placed on the amorphous magnetic core with different configuration coil N3.
Energies 13 02424 g015
Figure 16. Comparison of the frequency characteristic of induced voltages in coupled coils placed on the amorphous magnetic core on the different leg (N1, N2) and on the same leg (N2, N3).
Energies 13 02424 g016
Figure 17. Admittance frequency characteristics of N1 winding, during deformation of N3 winding placed at the same core leg, test object with amorphous magnetic core.
Energies 13 02424 g017
Figure 18. Admittance frequency characteristics of N2 winding, during deformation of N3 winding placed at the different core leg, test object with amorphous magnetic core.
Energies 13 02424 g018
Figure 19. Admittance frequency characteristics of N3 winding during its deformation, test object with amorphous magnetic core.
Energies 13 02424 g019
Figure 20. Comparison of admittance frequency characteristic of N2 coil placed on nanocrystalline magnetic core with different configuration of N2 coil.
Energies 13 02424 g020
Figure 21. Comparison of admittance frequency characteristic of N1 coil placed on nanocrystalline magnetic core with N3 with different configuration.
Energies 13 02424 g021
Figure 22. Admittance frequency characteristics of N1 winding, during deformation of N3 winding placed at the same core leg, nanocrystalline core.
Energies 13 02424 g022
Figure 23. Admittance frequency characteristics of N2 winding, during deformation of N3 winding placed at the different core leg, nanocrystalline core.
Energies 13 02424 g023
Figure 24. Admittance frequency characteristics of N3 winding during its deformation, nanocrystalline core.
Energies 13 02424 g024
Table 1. Parameters of test objects.
ParameterAmorphous CoreNanocrystalline CoreSilicon Steel Core
mean magnetic length, m0.32950.32950.33
Cross-section area of material, mm2241.4241.4241
Thickness of ribbon or sheet, mm0.040.040.38
Resistivity Ωm130 × 10−8118 × 10−849 × 10−8
Wolman frequency fw, Hz4578160091
Table 2. Impact of coil deformation on changes of measured characteristics in frequency bands defined in IEC 60076-18 [12].
Frequency BandSilicon Steel CoreAmorphous CoreNanocrystalline Core
Winding Placement
The Same ColumnOpposite ColumnThe Same ColumnOpposite ColumnThe Same ColumnOpposite Column
up to 2 kHzNoNoNoNoNoNo
2–20 kHzNoNoNoNoYesYes
20 kHz–1 MHzYesNoYesYesYesYes
above 1 MHzOnly in Coupled coilNoYesNoYesNo
Table 3. Frequency ranges in which differences in characteristics caused by deformation of winding N3 are observed.
Core/WindingN1N2N3
Silicon steel>192 kHz
above main resonance
None2–300 kHz
Up to main resonance
Amorphous core>80 kHz
above main resonance
80–450 kHz
between two resonances
>65 kHz
above main resonance
Nanocrystalline core>9 kHz
above main resonance
7–500 kHz
between two resonances
>6 kHz
above main resonance

