Abstract
Substation connectors, like many other high-voltage products, are tested once manufactured. However, the corona behavior of aged specimens can differ from that exhibited by newer ones, thus generating detrimental technical and environmental effects. Manufacturers need to know the long-term corona behavior of substation connectors to offer their customers maximum safety and transparency about such critical products. This paper analyzes the ageing effect on the surface roughness and the visual corona extinction voltage of sand-cast aluminum connectors, which were artificially aged in a salt spray chamber for different periods. The experimental results show an important variability of the surface roughness and corona extinction voltage (CEV) among connectors with the same ageing level due to the sand-casting manufacturing process. The results in this paper also show a slight increase in the surface roughness with the ageing period, although there is not a clear pattern between the applied ageing level and the experimental CEV value. It is concluded that the inherent variability among connectors due to the sand-cast process has more influence than the ageing effect itself.
1. Introduction
Corona is a partial discharge in air that occurs under a non-uniform electric field [1] close to the areas of highest electrical stress of high-voltage electrodes such as conductors or connectors when the electric field strength exceeds a threshold value [2]. It is already known that the generation of corona depends on several causes, including electrode geometry, spatial factors, and surface contamination. Therefore, important parameters influencing corona appearance are the geometrical radius of the surface [3,4], as well as surface condition and roughness [5]. Small radii geometries and configurations with sharp points or edges are more prone to corona occurrence due to the concentration of the electric field lines [6]. Partial discharges and corona generate undesirable effects, such as power losses, acoustic noise, radio interference voltage, very high frequency (VHF) and ultra high frequency (UHF) radiation [7] and chemical reactions. Corona activity also generates electromagnetic waves in the ultraviolet (UV) and visible spectrum, specifically in the blue range [8].
Conductors and bundle conductors for overhead power lines are operated at high electrical stress, although this is restricted to limit corona losses. The surface electric field strength is limited to 16 kVRMS/cm for lines rated above 110 kV [9,10], 17.4–20 kVRMS/cm for 400 kV AC power lines [11], although in ± 800 kV DC power lines it can be around 24 kV/cm [12]. In [13], it was proven that sand and dust can increase corona activity. It is known that the surface condition can impact corona activity on transmission line conductors, since rough surface conditions may distort the electric field at the surface of the conductors [14].
Different studies have analyzed the effects of surface condition on corona performance of electrical conductors, sometimes obtaining contradictory results. Small aluminum conductors were studied in [15], concluding that ageing could be beneficial to the conductor surface, since corona activity reduces with time because surface condition improves. The ageing of aluminum conductors was studied in [16], after a four months natural ageing period, observing that 8 kHz acoustic noise of the aged conductors decreased, whereas the corona inception voltage (CIV) increased. In [5], extremely polluted conductors were studied, concluding that CIV values of aged conductors were lower, whereas corona induced currents were larger compared to those of new conductors. Other studies [14,17] confirmed that extremely rough conductor surfaces exhibit lower CIV values and greater radio and audible noise levels compared to new conductors. Bian et al. analyzed the audible corona noise generated by aged transmission line conductors, thus concluding that they generate more noise compared to new conductors, especially during light rain and foggy weather [2]. It seems that surface condition can play an important role on corona activity of high-voltage conductors [18], since surface roughness can reduce the insulation strength of the high-voltage electrode due to the changes produced in the macroscopic electric field distribution [19], although electrode geometry plays a leading role.
Substation connectors interconnect different elements of the substation, thus being critical elements in the substation since the failure of such simple devices can lead to costly and catastrophic consequences [20]. Therefore, it is very important to ensure the long life and reliability of such simple products. Connector ageing is a complex and long process, which can be affected by multiple factors, such as environmental conditions, exposure to contaminants, surface deposits, or dirt, among others. Since corona is an undesired phenomenon that produces damaging and harmful effects, substation connectors’ manufacturers are very interested in knowing the long term corona behavior and performance of these products. This allows manufacturers to offer customers maximum safety and transparency regarding the behavior of the connectors.
This work analyzes the ageing effect on the corona behavior of A356 sand-cast connectors, since A356 is the most applied aluminum alloy in substation connectors [21,22]. Sand casting is a widely applied manufacturing process to produce different parts of aluminum alloys, since it offers simplicity in manufacturing at a competitive cost [23]. However, the casting quality is negatively affected by different control variables. The traditional sand-casting practice produces defects, such as oxide films, porosity, different inclusions [24], and greater surface roughness [19], compared to other casting methods, resulting in poor surface and mechanical properties [23]. Apart from porosity and surface roughness related issues, sand-cast products exhibit low dimensional accuracy due to the sand shrinking, and poor surface finish because of the sand texture. The combination of porosity, poor surface finish, greater surface roughness, and low dimensional accuracy can play an important role on corona performance of new and aged sand-cast substation connectors, so it is worthy of investigation. In addition, the results obtained for cylindrical conductors with smoother surfaces cannot be directly applied to substation connectors, since the geometries of the latter are more complex and irregular, and geometry has important effects on CIV/CEV values and corona activity. Therefore, specific studies for power connectors are required to determine the corona performance for long-term operation. These studies should focus on the relationship between the state of the surface and corona activity. To this end, experimental work is required, since to the best authors’ knowledge, there are no studies related to long-term corona performance of aged power connectors, so this study contributes to this area.
The rest of the article is organized as follows. Section 2 presents the analyzed specimens as well as the applied ageing levels. Surface roughness parameters, together with the measurement methodology used in this work, are presented in Section 3. Section 4 describes the experimental setup and the visual corona discharge tests, whereas Section 5 reports the experimental results. Finally, Section 6 summarizes and concludes the paper.
2. The Analyzed Substation Connectors and the Artificial Ageing Tests
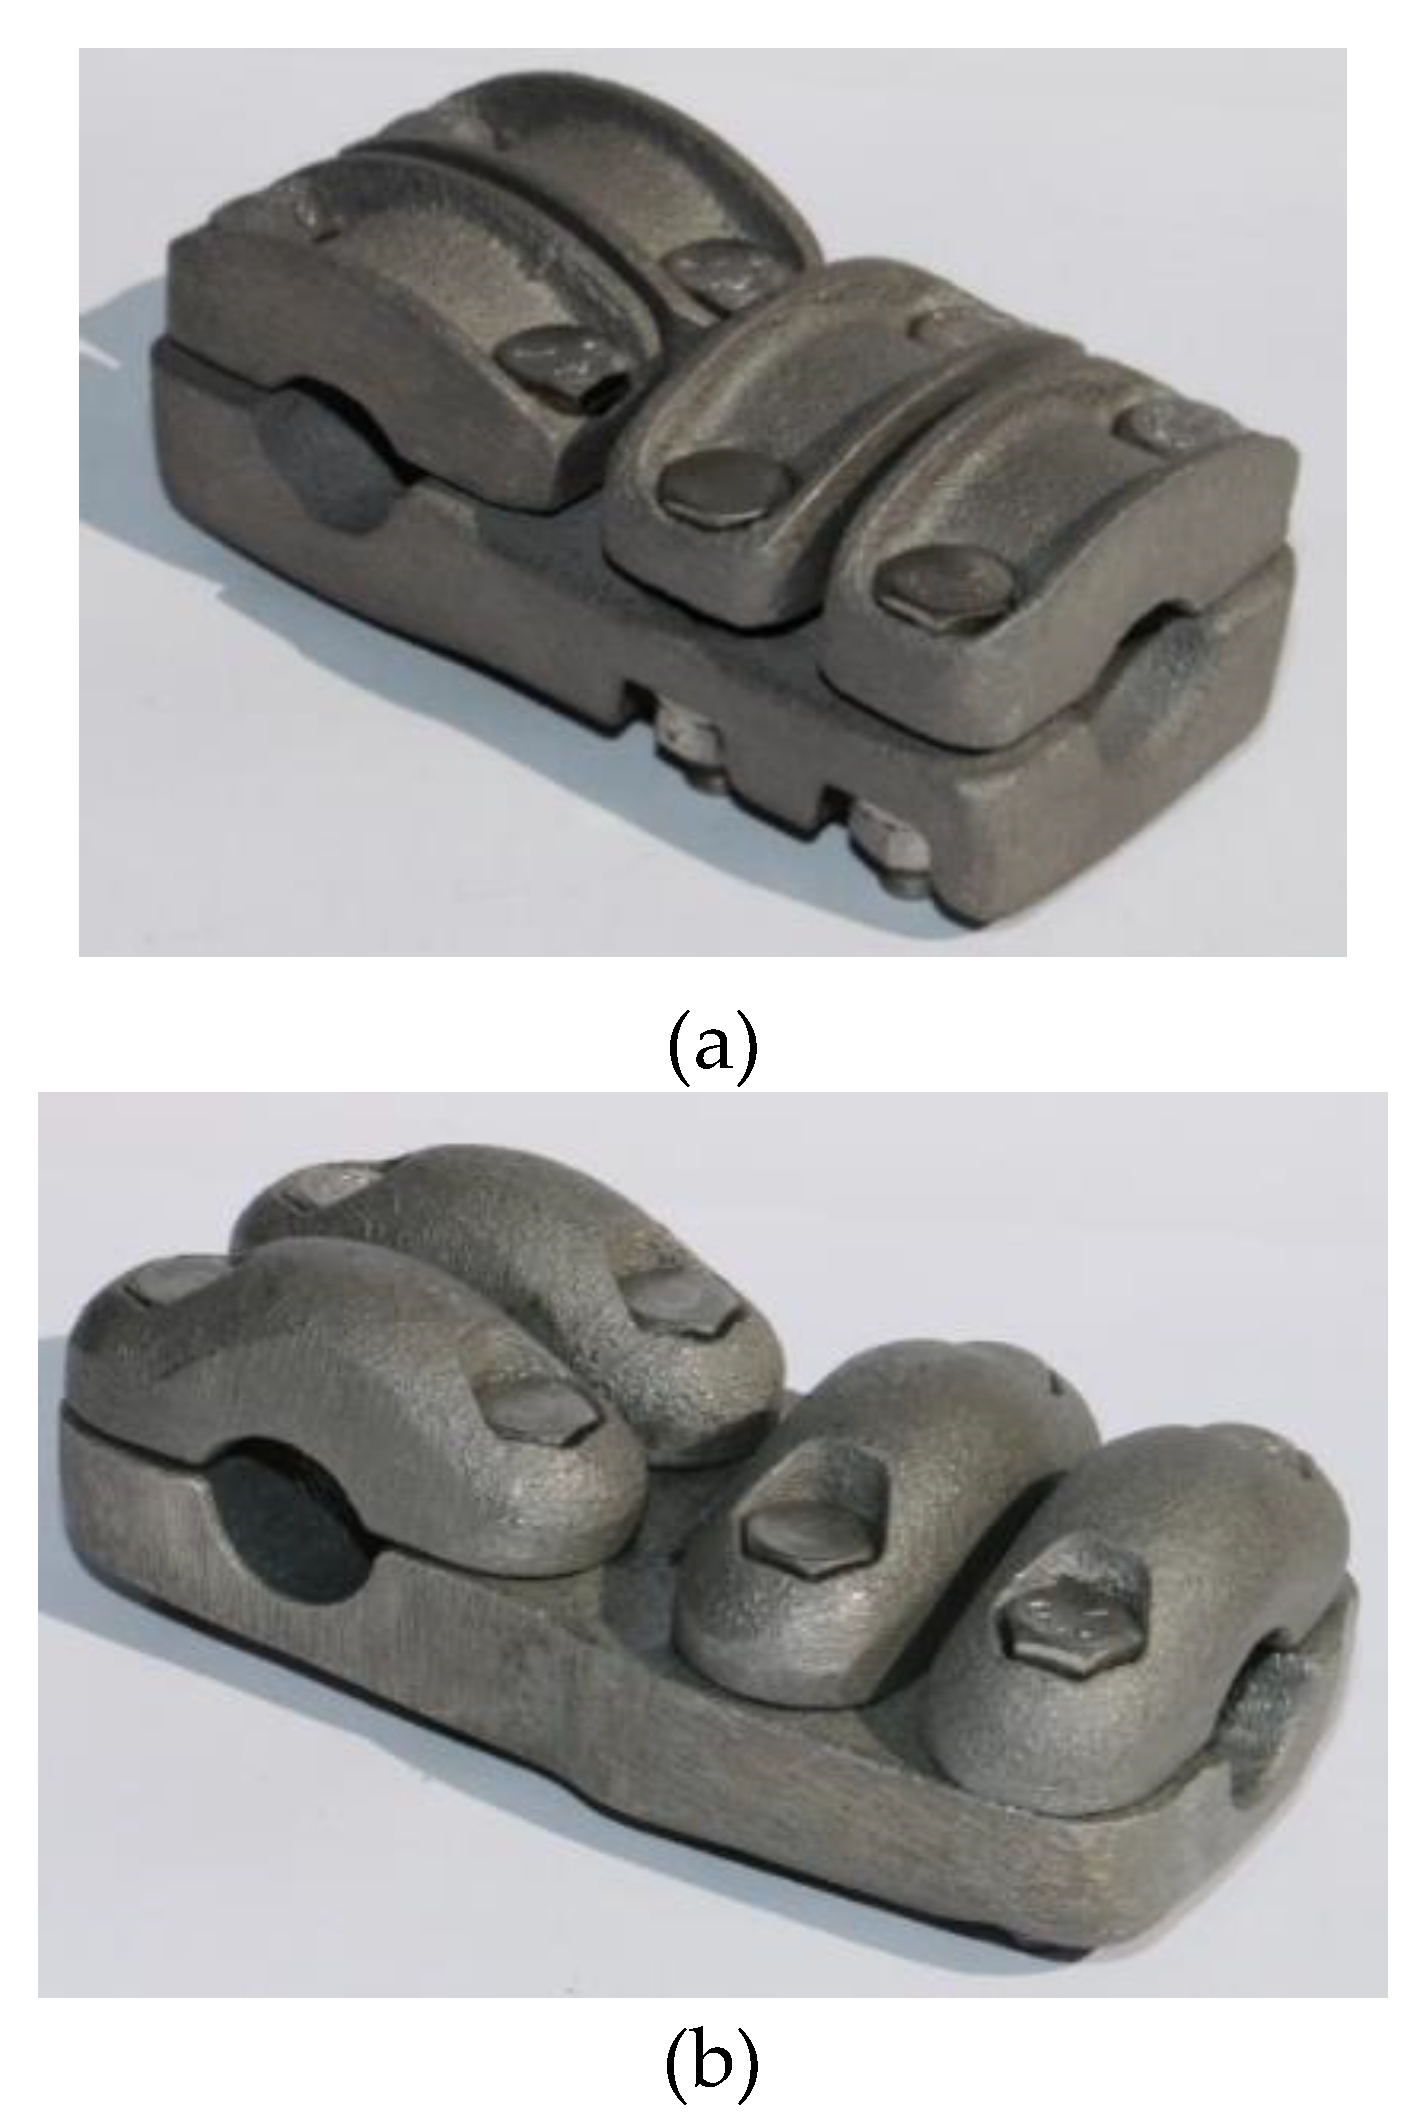
This section describes the T-type electrical connectors analyzed in this work. T-type connectors connect two stranded aluminum conductors together, as shown in Figure 1. The analyzed connectors are from the catalogue of SBI Connectors (SBI Connectors, Sant Esteve Sesrovires, Spain), and are made of hypo-eutectic sand-cast A356 aluminum alloy.
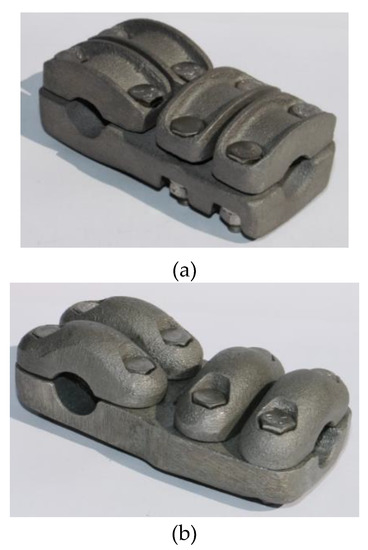
Figure 1.
Studied substation connectors from SBI Connectors catalogue. (a) Type T, J line; (b) Type T, S line.
The substation connectors analyzed in this work were aged according to the specification of the ISO 9227-2017 standard, Corrosion tests in artificial atmospheres—Salt spray tests, which specifies the procedure, reagents and apparatus required to conduct neutral salt spray tests to assess the resistance-to-corrosion of metallic materials [25].
The salt solution was prepared in accordance with the ISO 9227-2017 standard using low conductivity distilled water (<20 μS/cm at 25 ± 2 °C) to produce a concentration of sodium chloride in the range of 45–55 g/L, as specified in the ASTM B117-19 salt spray test standard [26]. It was carried out by dissolving approximately 5 parts by mass of NaCl into 95 parts of distilled water. Salt fog collection rates were measured to ensure they were within the standard range of 1–2 mL/hr/80 cm2. The chamber temperature was adjusted at a constant value of 35 ± 2 °C.
A salt spray corrosion chamber (CCI manufacturer, CCA model, 400 L inner volume, fulfilling the requirements of the ASTM B117-19 standard) was used to conduct the ageing tests.
A total of 24 T-type substation connectors were analyzed, 12 of the J line and the remaining 12 of the S line, which were aged according to 4 ageing levels, as detailed in Table 1.

Table 1.
Ageing levels and tested connectors. This table is valid for connectors J-line and S-line.
Before being introduced into the chamber, the connectors were cleaned using a clean soft brush and distilled water. After the cleaning, they were rinsed with clean distilled water and dried. Next, the test specimens were vertically placed inside the salt spray chamber, as shown in Figure 2b, with care taken to not to place them in the direct travel direction of the spray from the nozzles of the atomizer.

Figure 2.
(a) Salt spray chamber. (b) Layout of the test specimens to be placed inside the salt spray chamber. (c) Brush used to clean the connectors once removed from the salt spray chamber. (d) New conductor, ageing A0. (e) Aged conductor after 750 h (A750) in the salt spray chamber once cleaned, ageing A2.
After conducting the ageing tests using the salt spray corrosion chamber, the connectors were removed from the chamber and cleaned with distilled water using a brush, in order to remove the superficial residues of spray solution from the surface of the connectors. Finally, the samples were dried immediately in a stream of air [25]. The application of a chemical cleaning to the connectors was avoided, as suggested in the ASTM B117-19 standard [26], in order to protect the structure of the surface layer of the connectors. After this cleaning and drying procedure, the connectors were ready to be tested.
3. The Surface Roughness Measurements
The substations connectors analyzed in this work were manufactured by sand casting. They are made with A356 Al alloy with T6 heat treatment, whereas the accompanying all aluminum alloy conductors (AAAC) are made of 1350 Al alloy [27] and have a diameter of 15.8 mm. As the name indicates, sand casting uses a special kind of fine sand as the mold material. Sand casting is commonly applied in foundries for industrial application because it is a relatively cheap process. Sand casting is probably the most common process to produce substation connectors. However, as explained, sand-cast products present several disadvantages, such as high porosity compared to machined components, low dimensional accuracy due to the sand shrinking, and poor surface finish because of the sand texture. Therefore, sand-cast connectors tend to present defects such as porosity, shrinkage, surface and pouring metal defects. It is well known that surface finish can impact both surface roughness and corona performance. Sand-casting processes lead to surface roughness in the order of 5.3–50 μm [19].
Surface roughness measurements were carried out by means of a diamond tip stylus profiler with tip radius of 2 µm, a measuring force of 0.75 mN and a measuring range along the X axis of 17.5 mm (surface roughness tester Mitutoyo Surftest 211; Kawasaki, Japan) using a roughness calibration specimen with Ra = 3 µm. The Mitutoyo Surftest 211 stylus profiler allows direct and fast measurements of the Ra, Rq and Rz parameters in accordance with the EN-ISO 4287 standard [28]. During measurements, the stylus profiler tip raises and lowers from an initial reference level because of the valleys and peaks profile of the connector surface.
The following paragraphs describe the main parameters used in this work for characterizing surface roughness of the analyzed substation connectors.
Parameter Ra [μm] is defined as the average value of the absolute roughness [27],
where n is the number of measurements along the sampling length L, and zi is the height value of the roughness associated to the i-th point.
Parameter Rq [μm] is the root-mean-square value of the roughness,
Finally, parameter Rz [μm] is the mean maximum height of the measured profile,
Rpi and Rvi being, respectively, the i-th highest peak, and the i-th deepest valley.
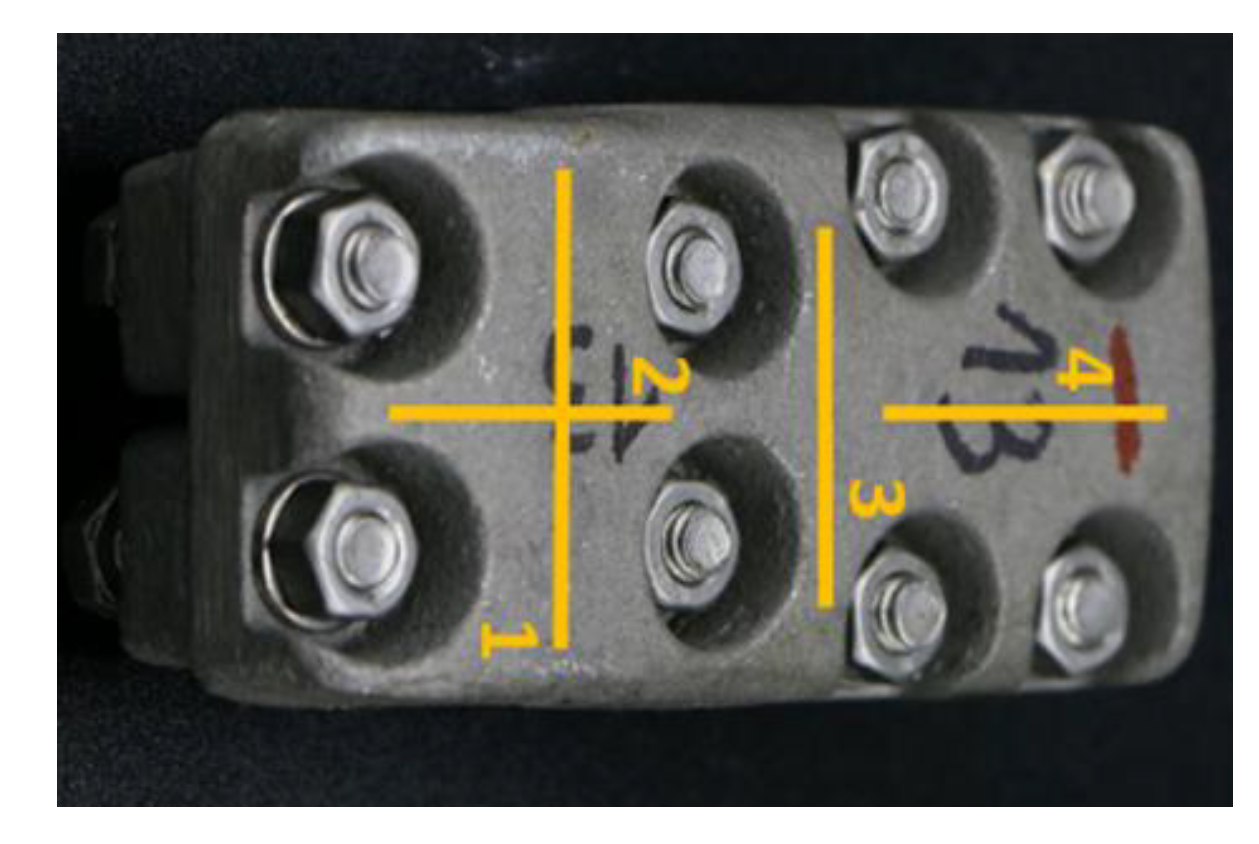
Parameters Ra, Rq and Rz were measured along four flat and straight paths marked in the bottom surface of the connector, which are highlighted in Figure 3. Afterwards, the mean values of the three parameters were obtained by averaging the values in all points of the four roughness profiles provided by the Mitutoyo Surftest 211 stylus profiler.
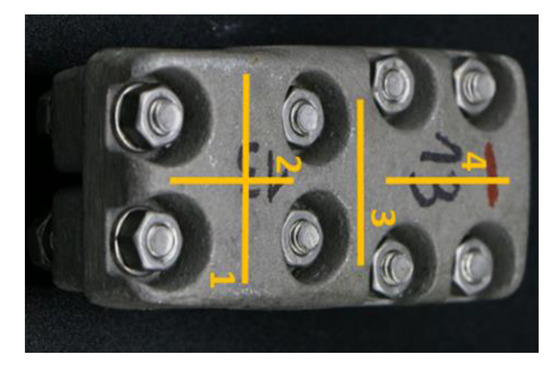
Figure 3.
Straight flat lines where the surface roughness measurements were completed.
4. The Corona Tests in the High-Voltage Laboratory
This section describes the visual corona tests carried out in the AMBER high-voltage laboratory of the Universitat Politècnica de Catalunya (Terrassa, Spain). Similarly to what was undertaken in [20], experimental visual corona tests were carried out by means of a calibrated 130 kV high-voltage generator (BK-130 from Phenix technologies, Accident, Maryland USA), two calibrated 120 kV DC generators (4129-10 model from Phenix technologies, Accident, Maryland USA) with positive and negative outputs, respectively, and a digital camera (Canon EOS-70D resolution incorporating a 20.2 Mpixels CMOS APS-C sensor, 18–135 mm F3.5-5.6 IS STM lenses with super spectra coatings). Visual corona tests were performed in the laboratory in total darkness. Long exposure photographs were taken (60 seconds exposition, ISO-400 sensitivity, aperture f/5.6, tungsten color temperature, long exposure noise reduction filter activated in the camera menu) to improve the performance of the digital photographs in detecting the corona activity. In a previous study [29], it was demonstrated that digital photographs taken under the described conditions have similar sensitivity than that provided by a conventional partial discharge (PD) detector, with the advantage that visual corona photographs allow for the locating of the corona discharge points on the surface of the connectors.
Visual corona tests were performed according to the test procedure found in the IEEE 1829-2017 report [30]. The voltage was gradually increased starting from 0 kV at an approximate rate of 2 kV/s [31] until corona activity was identified on the test object, this being the visual corona inception voltage (CIV). Then, the voltage was increased by approximately 10% and maintained for 60 seconds. Next, the applied voltage was slowly reduced until corona extinction, this value being the corona extinction voltage (CEV). This process was repeated three times for each connector and type of applied voltage (AC, positive and negative DC), while completing a photographic report of each tested specimen.
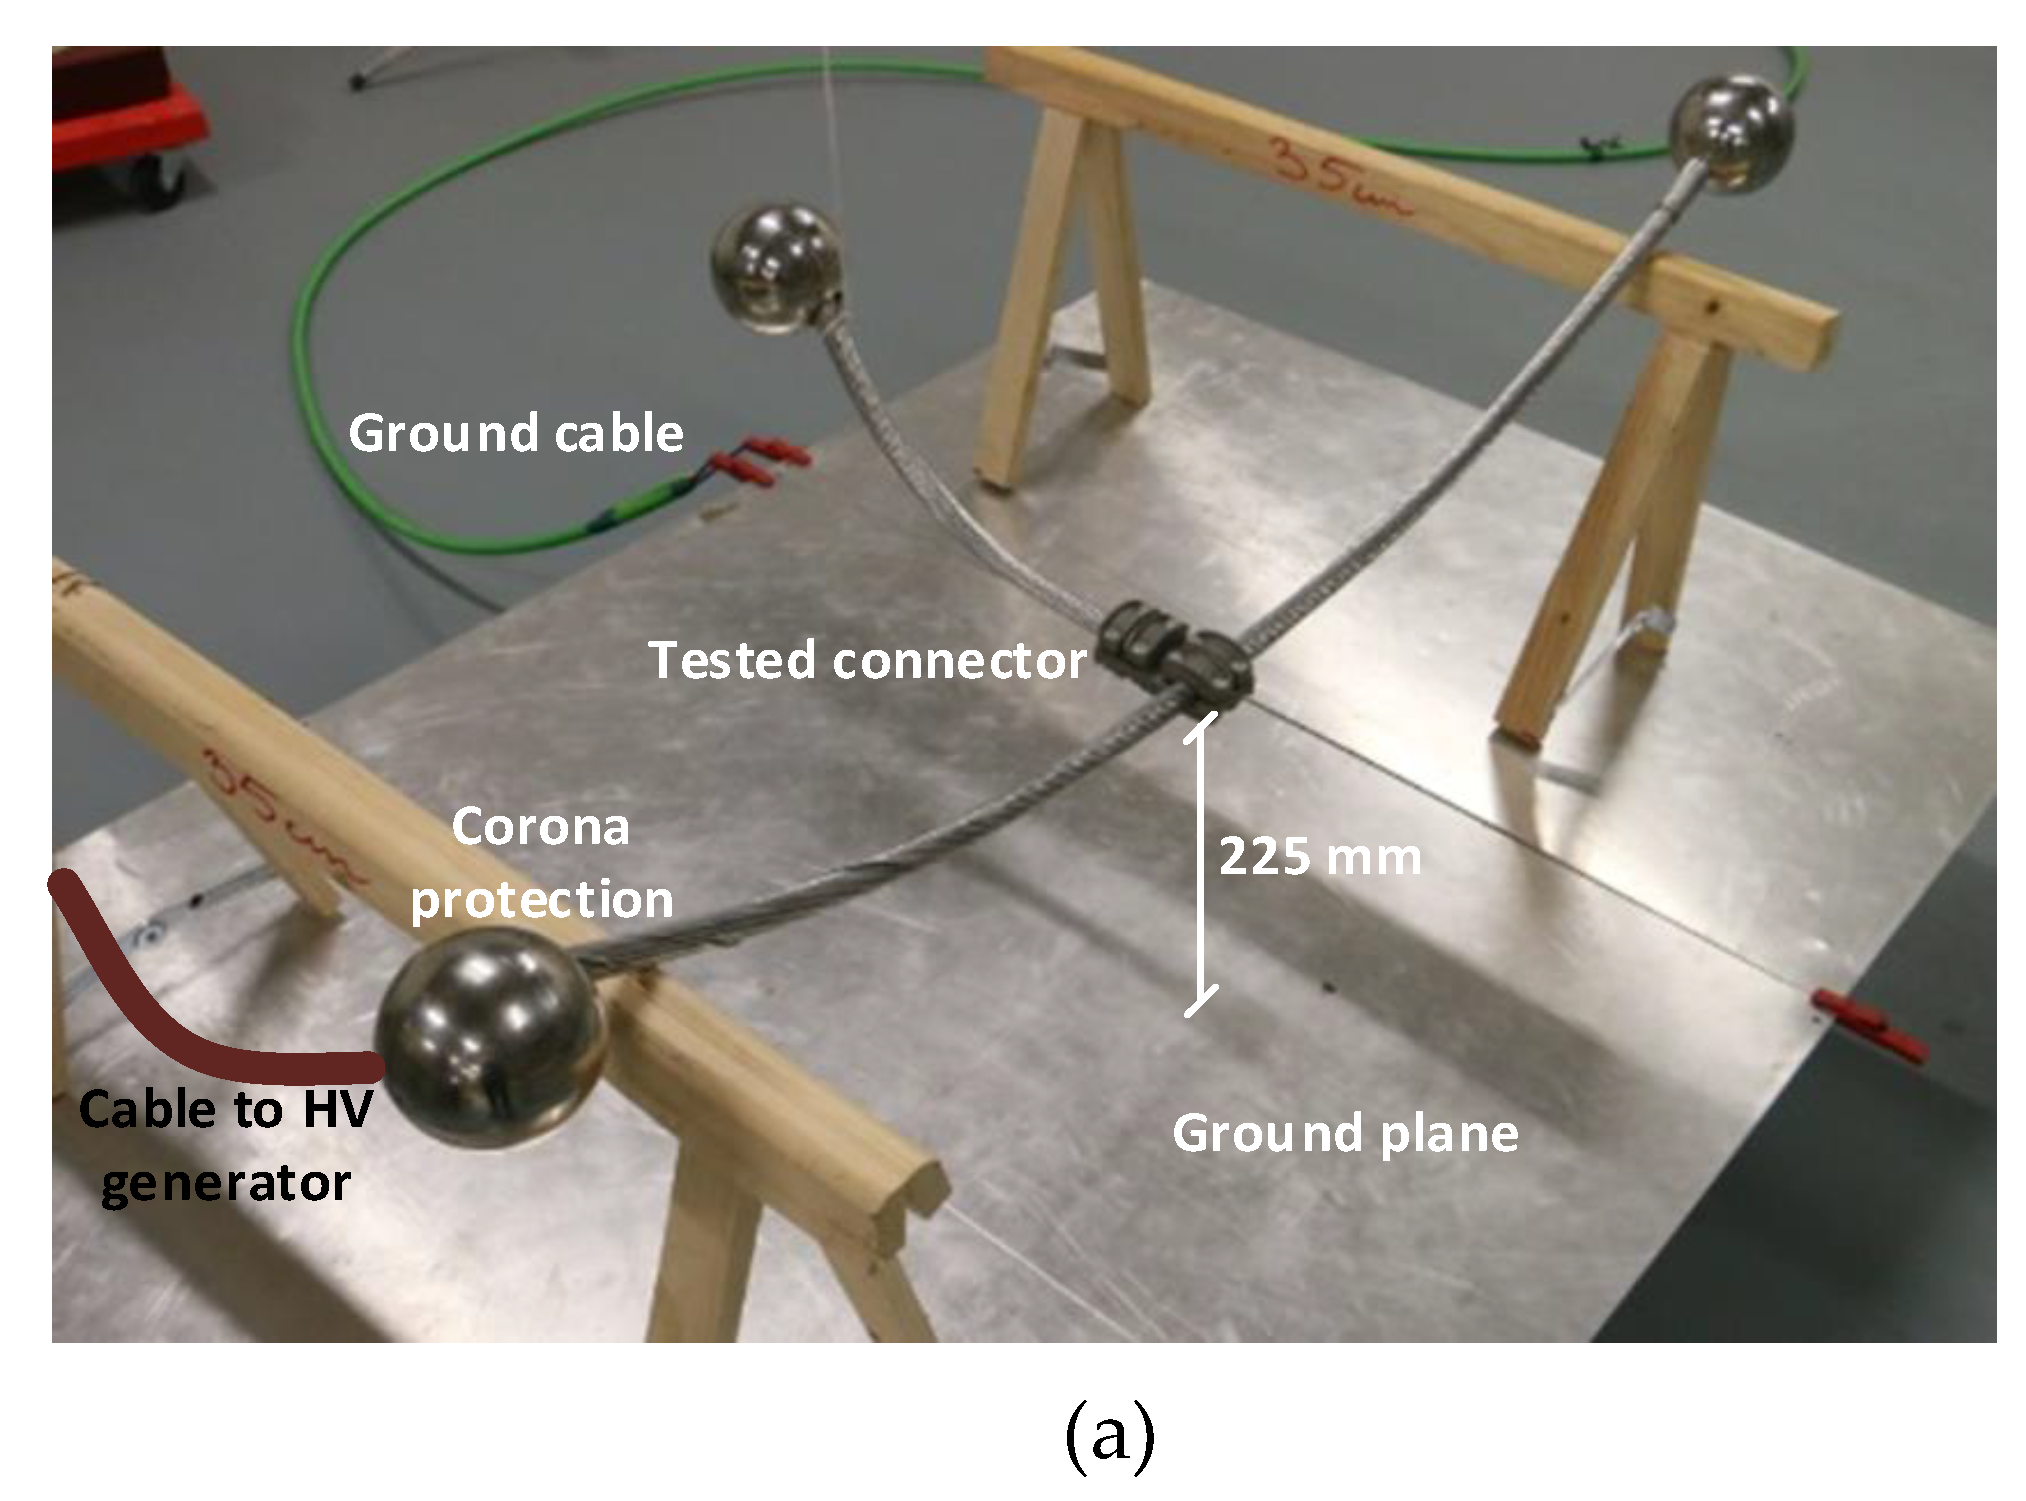
Experimental corona tests were performed with the connectors placed at a reduced height above the metallic ground plane, as proposed in [20]. This approach allows performing the tests in a small-size high-voltage laboratory, thus drastically simplifying the time required to assemble the experimental setup, reducing the voltage applied and the cost of the high-voltage generators required, while ensuring corona occurrence. The bottom flat surface of the connectors was placed at a height of 225 mm above the ground plane in order to force the electric field to reach the CEV value when operating below 120 kV. The experimental layout to determine the CEV value is shown in Figure 4.
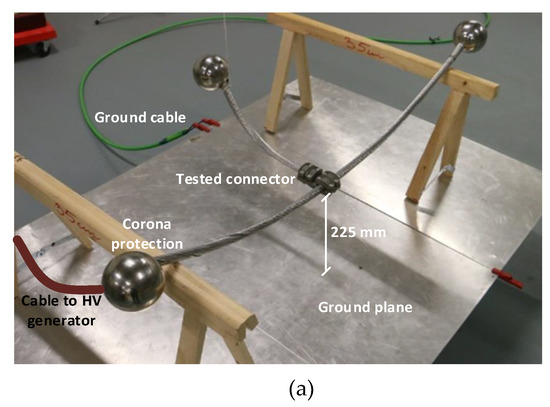
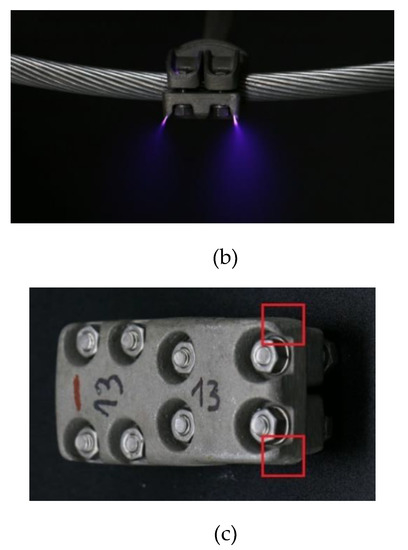
Figure 4.
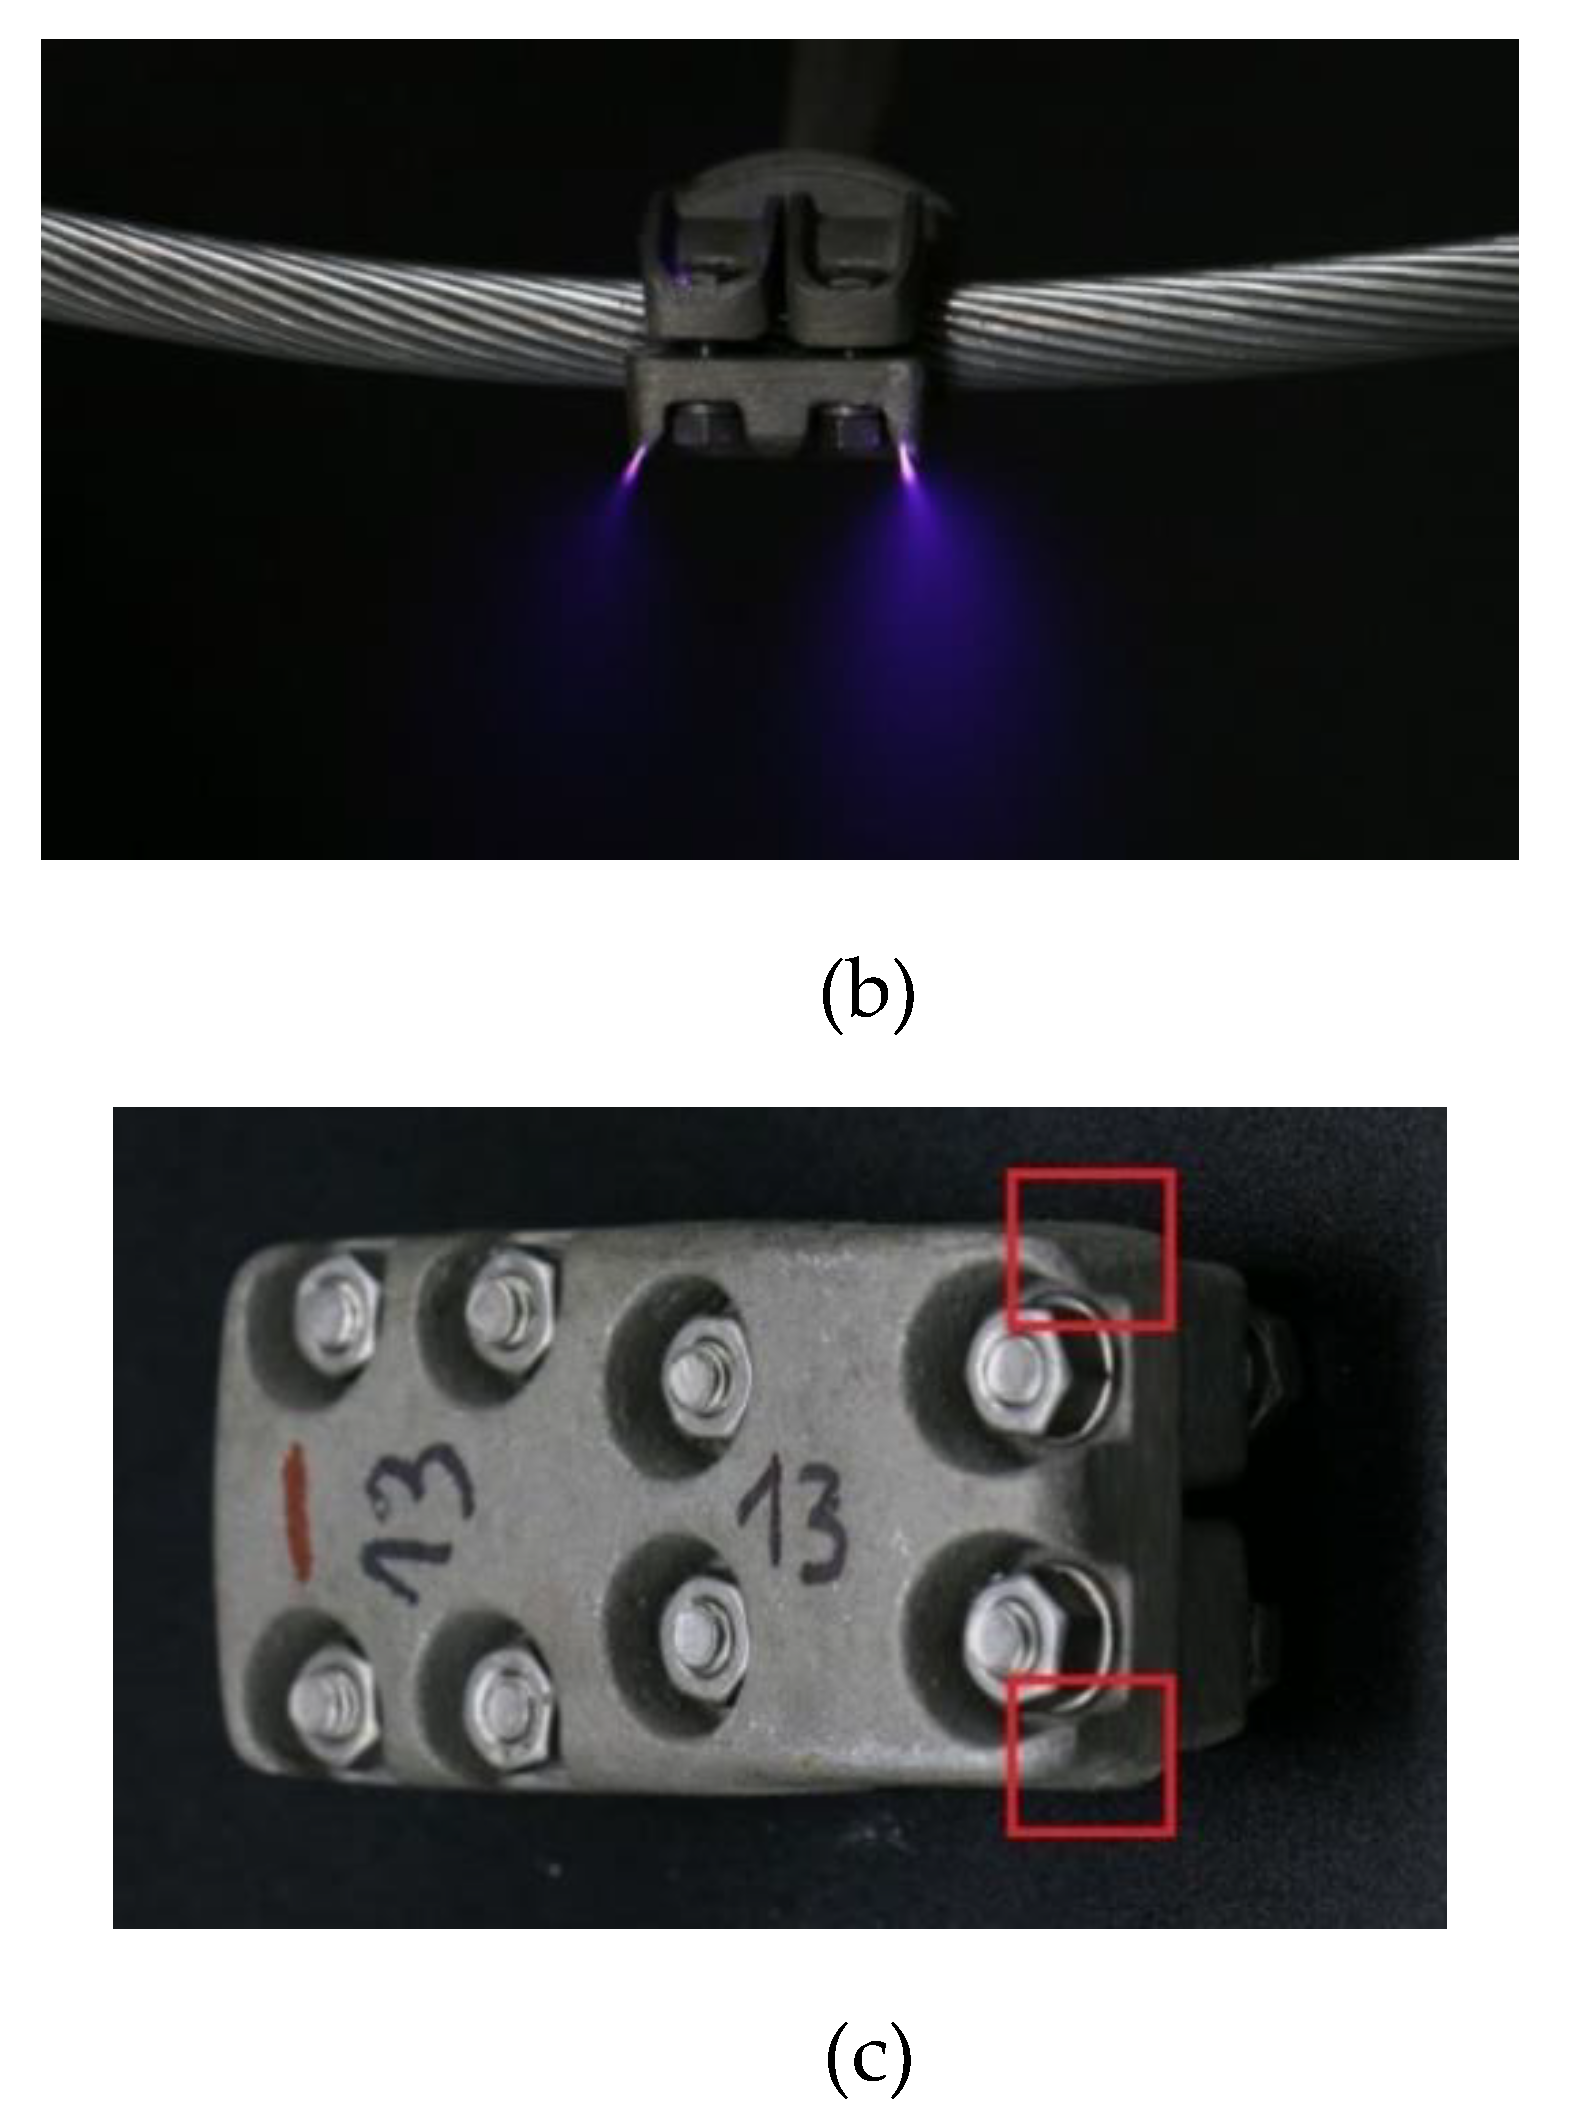
Visual corona tests carried out at the high-voltage laboratory. (a) Layout of the experimental setup. (b) Visual corona test performed to a J-line T-type substation connector under positive DC supply. (c) Identification of the areas of the connector more prone to corona activity due to the reduced curvature radius [20].
5. Experimental Results
This section presents the experimental results performed in this work, including the surface roughness measurements and the results of the visual CEV tests.
5.1. Surface Roughness Results
Table 2 and Table 3 summarize, respectively, the maximum, minimum and mean values of the Ra, Rq and Rz parameters along the four paths of each connector shown in Figure 3.

Table 2.
T-type J-line connectors. Results of the surface roughness measurements.

Table 3.
T-type S-line connectors. Results of the surface roughness measurements.
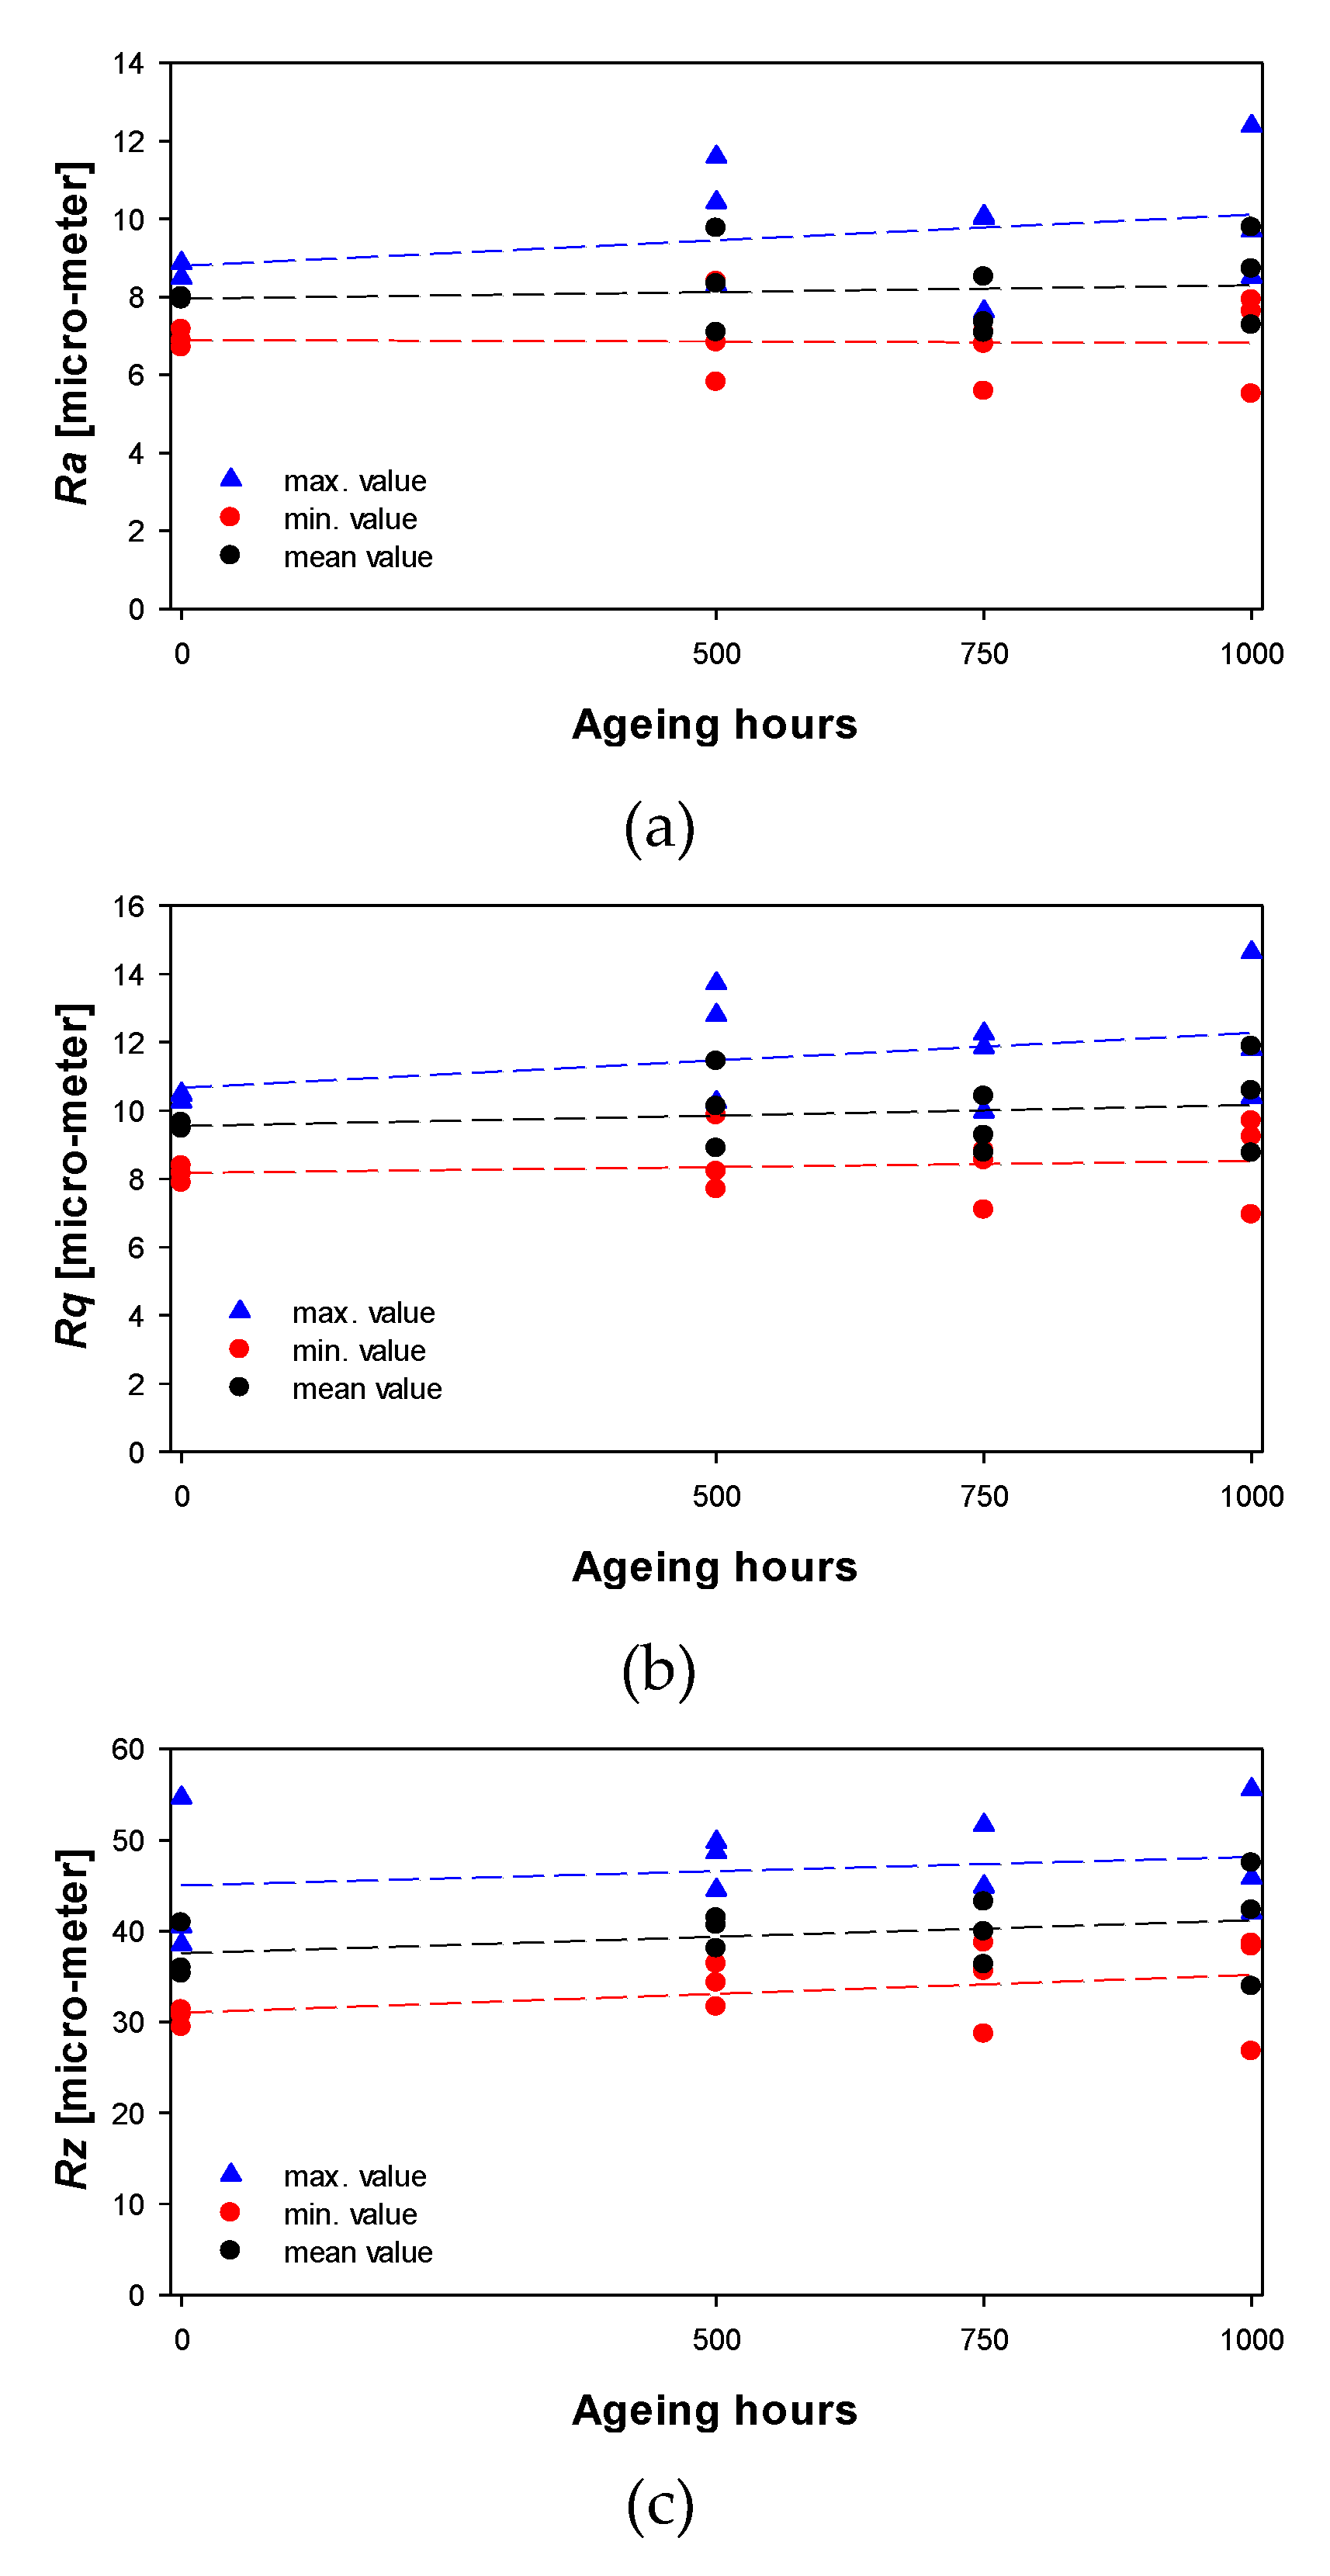
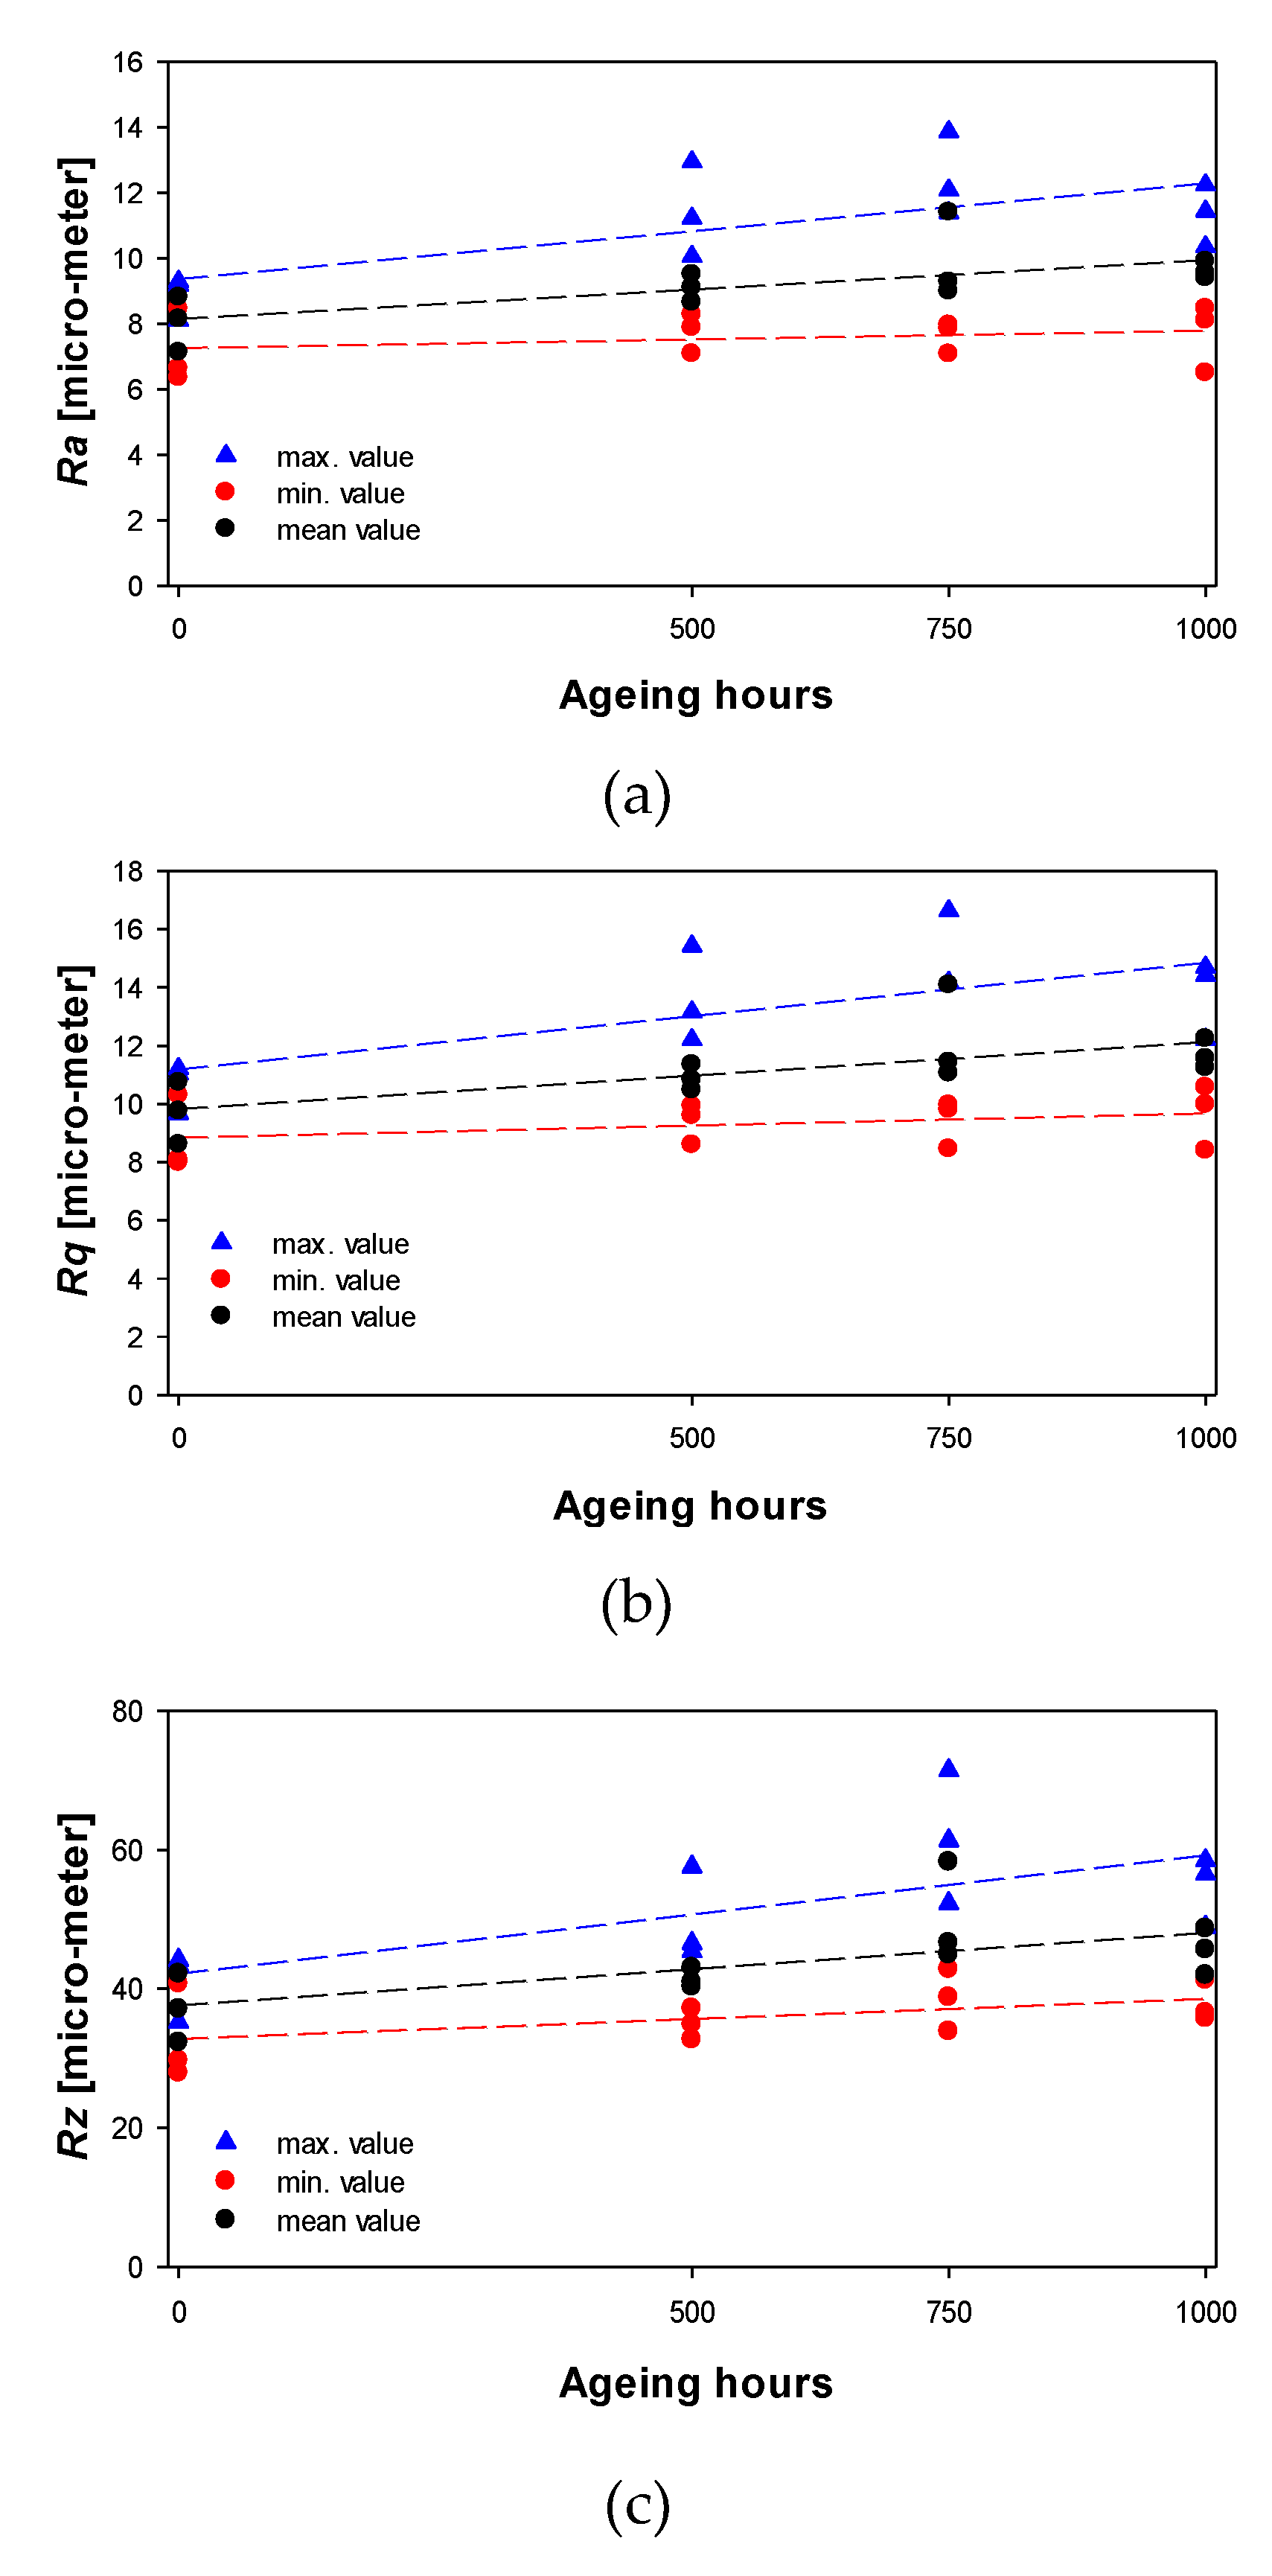
Figure 5 and Figure 6 display the values summarized in Table 2 and Table 3 in a graphic format, as well as the tendency lines obtained by applying a linear regression.
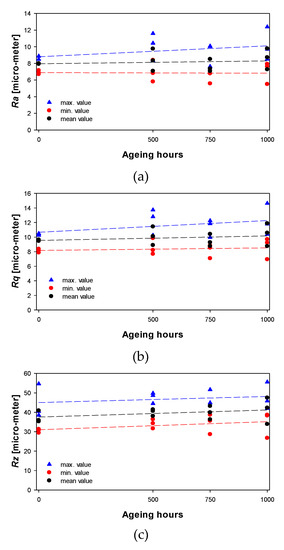
Figure 5.
J-line connectors. Surface roughness measurements. Dashed lines are the tendency lines. (a) Ra. (b) Rq. (c) Rz.
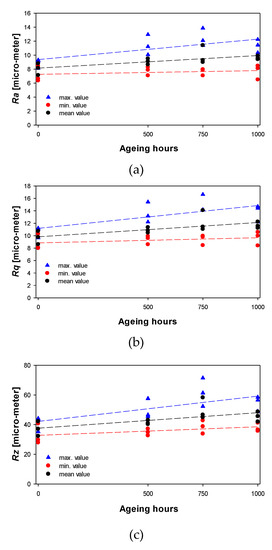
Figure 6.
S-line connectors. Surface roughness measurements. Dashed lines are the tendency lines. (a) Ra. (b) Rq. (c) Rz.
The results in Figure 5 and Figure 6 show an important variability of the surface roughness parameters Ra, Rq and Rz among connectors with the same ageing level, although new connectors (A0) have lower roughness-parameter dispersion among different connectors, specifically for their maximum values. However, the tendency lines show a slight increase in the surface roughness with ageing level.
5.2. Visual CEV Tests
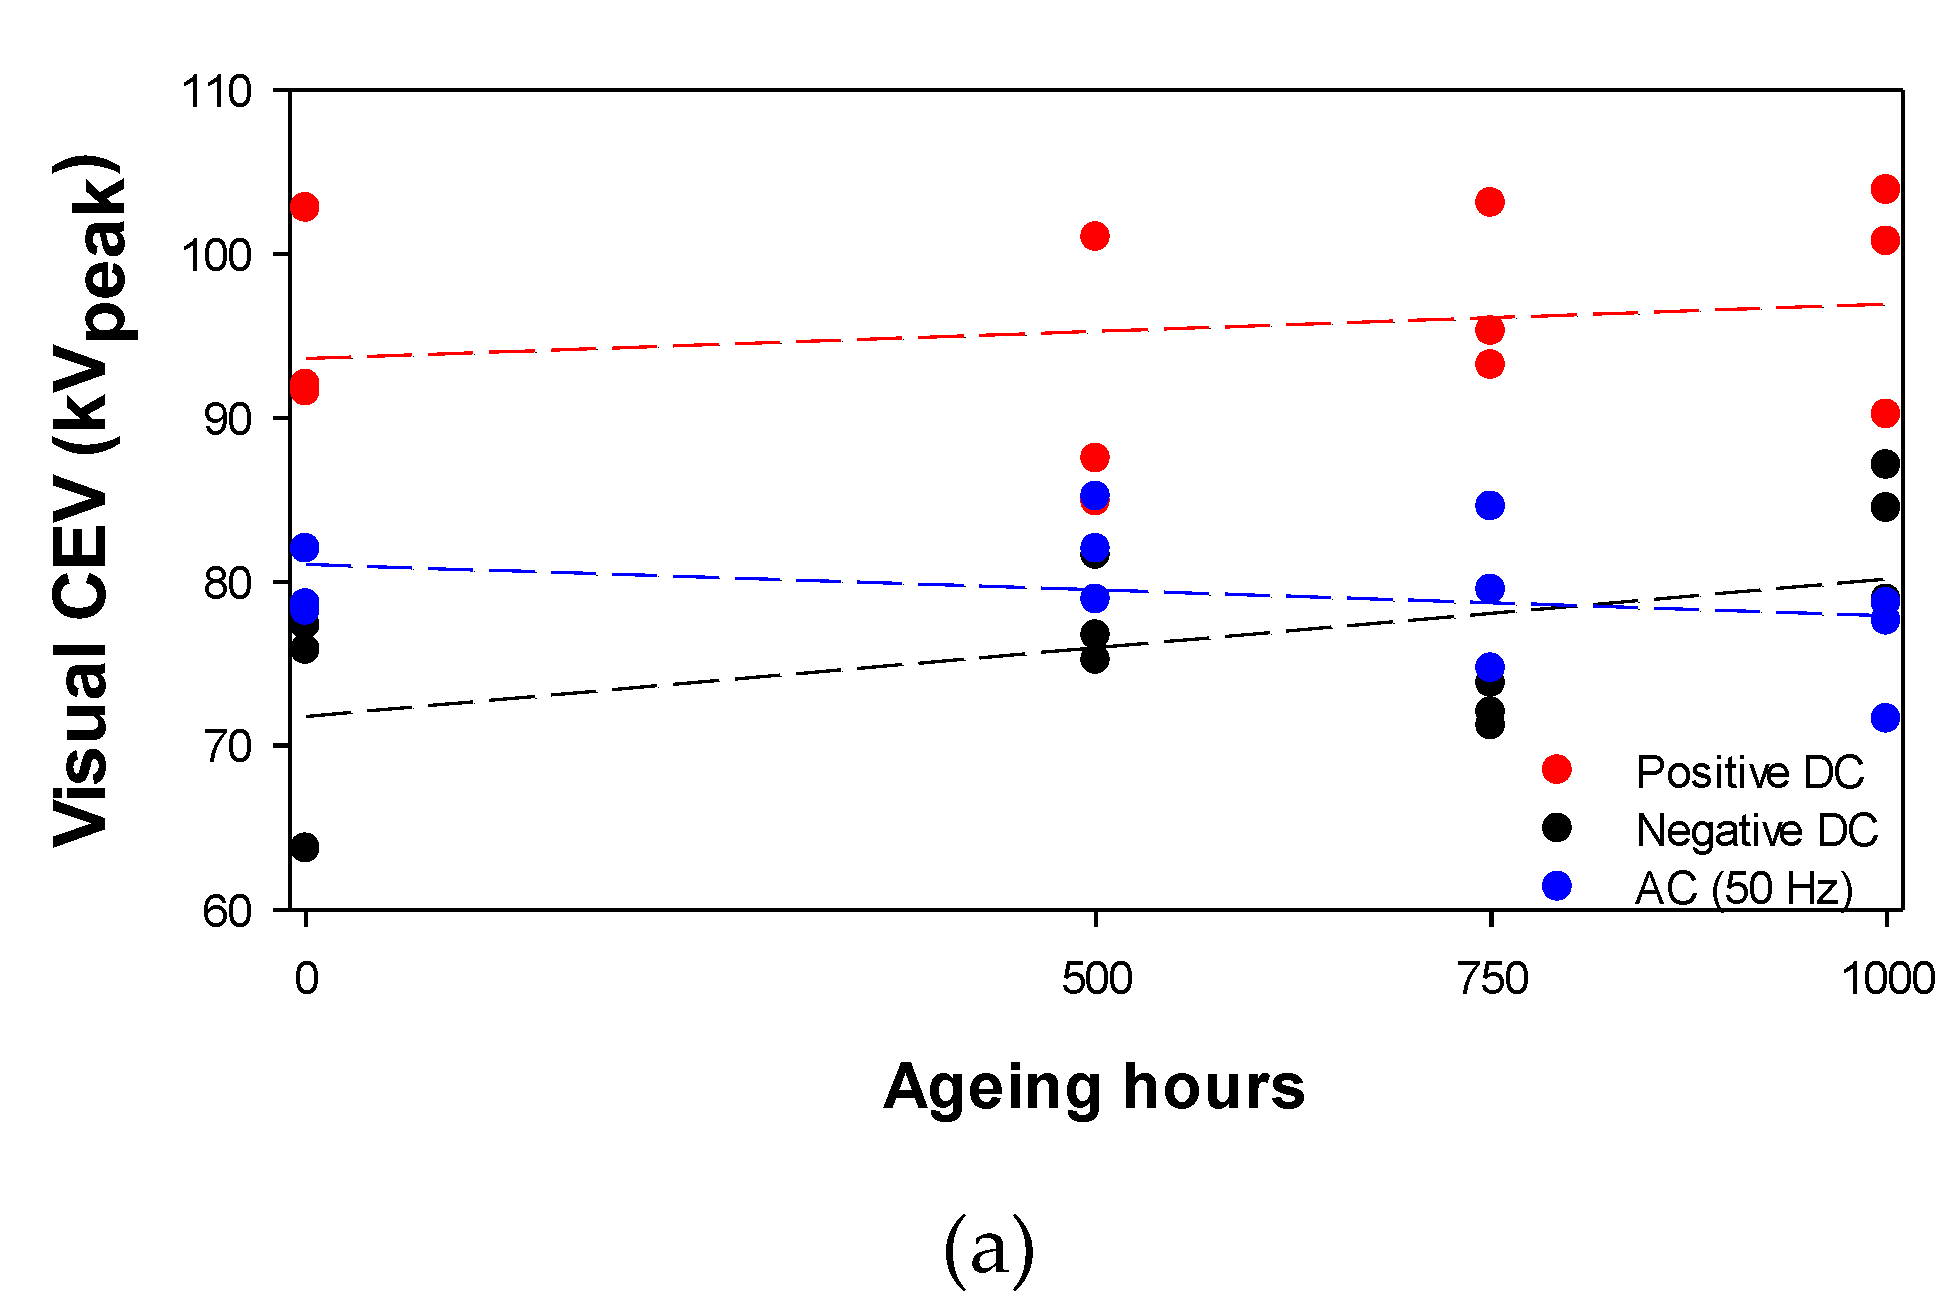
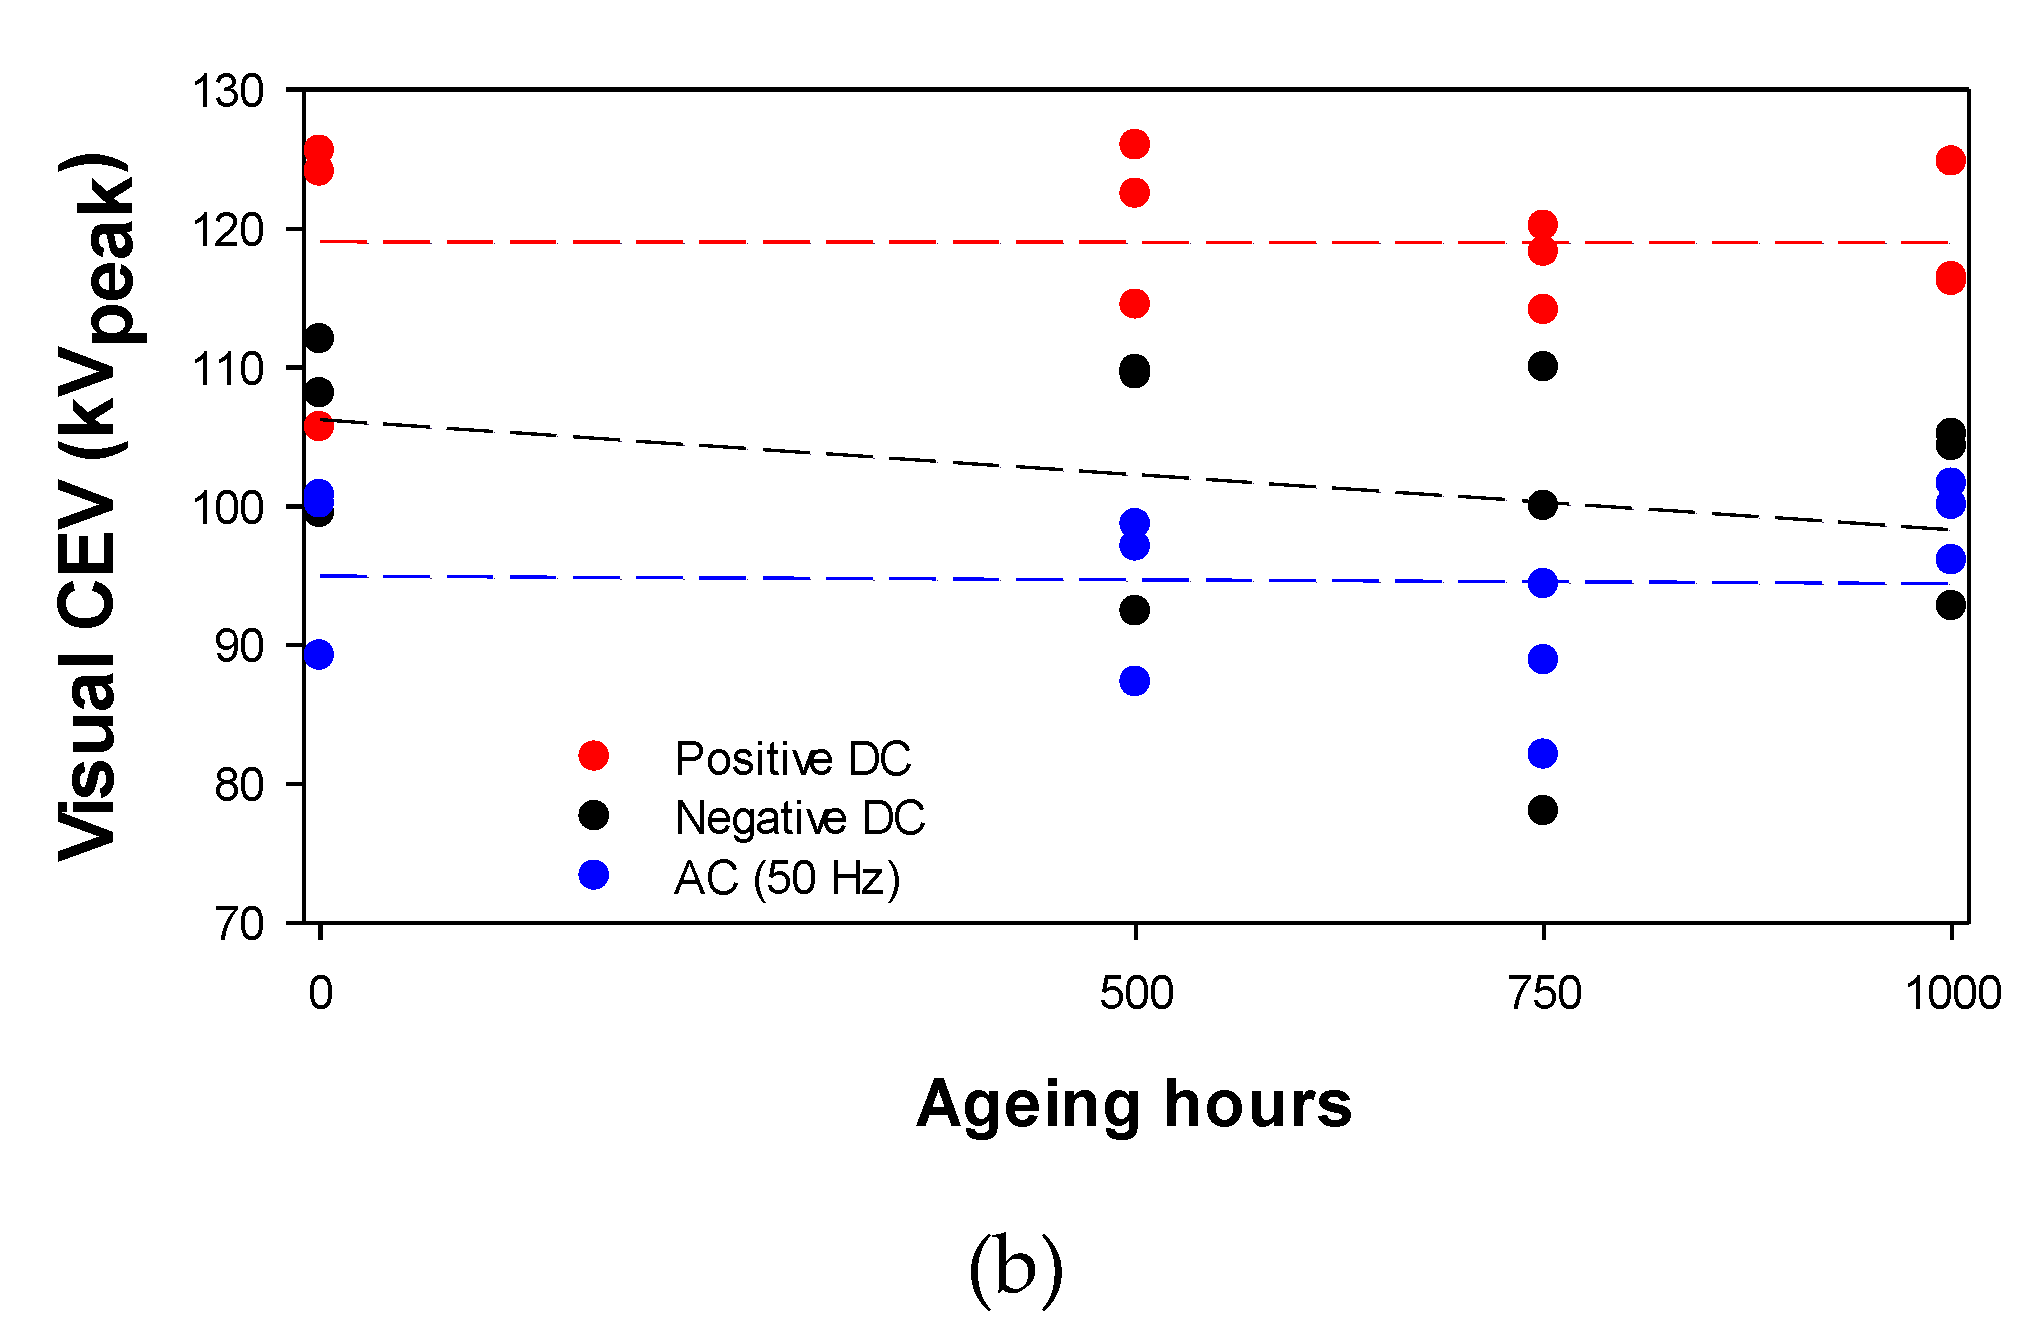
It is a recognized fact that CEV values depend on the local atmospheric conditions, i.e., pressure, temperature, and absolute humidity. Specifically, ambient pressure has a deep impact on CEV values [8,32]. Thus, when testing under variable atmospheric conditions, the obtained CEV values must be corrected to those of the standard reference atmosphere (P = 101.3 kPa, T = 20 °C, and H = 11 g/m3), as suggested in the IEEE Std 4-2013 standard [31], which was carried out in this work. Table 4 and Table 5 and Figure 7 summarize the results of the visual corona tests.

Table 4.
T-type J-line connectors. Corrected corona extinction voltage (CEV) values.

Table 5.
T-type S-line connectors. Corrected CEV values.
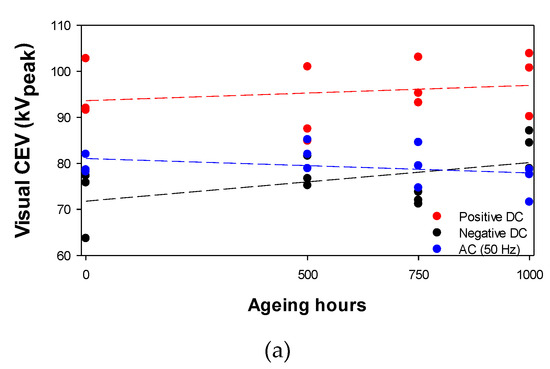
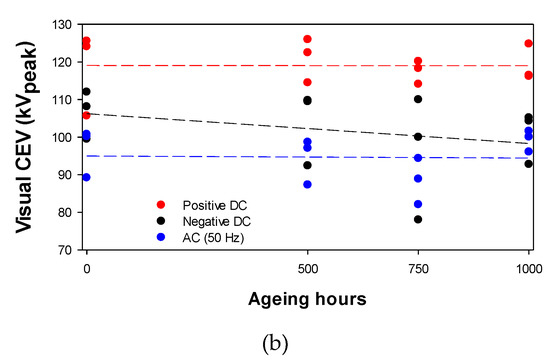
Figure 7.
Corrected visual CEV values. T-type connectors. Dashed lines are the tendency lines obtained from a linear regression. (a) J-line connectors. (b) S-line connectors.
Substation connectors are designed to withstand a voltage level at least 10% above the nominal voltage [33]. They are also designed so that the electric field strength at any point of their surface is always below 30%–40% the minimum electric field strength required to generate corona. Therefore, the CEV deviations of the different connector replicas shown in Table 4 and Table 5 are not critical to generate unwanted corona effect at the rated operating voltage.
The results summarized in Table 2 and Table 3 and Figure 7a show that there is not a clear pattern between the applied ageing level, and the visual CEV value. There is a possible explanation of this behavior. On one hand, the dimensions of the geometric radii of the connector are much greater (in the order of several mm) than those of the surface roughness (in the order of several μm). On the other hand, the roughness is not very affected by ageing due to the specific characteristics of the sand-casting process, which causes a rather poor surface finish. In addition, the geometry of substation connectors is optimized against corona, so they have larger dimensions and a more complex geometry than those of the line conductors, thus hindering corona occurrence. Therefore, the variability among connectors due to the sand casting process seems to have more influence than the ageing effect itself.
6. Conclusions
Substation connectors’ manufacturers are very interested in knowing the long-term corona behavior of their products since corona is an undesired phenomenon that produces undesired and harmful effects. This allows for manufacturers to offer customers maximum safety and transparency regarding the behavior of the connectors.
This paper studied the ageing effect on the surface roughness and the visual corona extinction voltage of sand-cast aluminum connectors. Different aluminum connectors were artificially aged in a salt spray chamber during different periods, i.e., 0 h, 500 h, 750 h, and 1000 h, thus obtaining four ageing levels.
The experimental results presented in this paper show that the surface roughness tends to slightly increase with the ageing level of the connectors. However, surface roughness measurements show an important variability in the surface roughness parameters among connectors with the same ageing level, although new connectors (ageing 0) present slightly less variability of the roughness parameters Ra, Rq and Rz, in particular for their maximum values. However, visual CEV tests revealed that there is not a clear pattern between the applied ageing level and the experimental CEV value. This is attributed to the fact that, on one hand, the geometric radii of the connectors are in the order of several millimeters, whereas the surface roughness is in the order of several micrometers, thus having little impact on corona inception conditions. On the other hand, it was verified that surface roughness is not very affected by ageing due to the particular characteristics of sand-cast connectors, which exhibit a rather poor surface finish. Finally, substation connectors are self-protected against corona appearance due to the specific geometric design (large dimensions and complex geometry compared with those of the line conductors) that is optimized against corona under rated operating conditions. It is concluded that the inherent variability among connectors, mostly due to the sand-casting process, seems to have more influence than the ageing effect itself.
Author Contributions
Conceptualization, J.-R.R.; methodology, J.-R.R. and Á.G.-P.; formal analysis, M.M.-E. and S.B.; investigation, J.-R.R., M.M.-E. and Á.G.-P.; writing—original draft preparation, J.-R.R.; writing—review and editing, Á.G.-P. and S.B. All authors have read and agreed to the published version of the manuscript.
Funding
This research was partially funded by Ministerio de Ciencia e Innovación de España, grant number RTC-2017-6297-3 and by the Generalitat de Catalunya, grant number 2017 SGR 967.
Conflicts of Interest
The authors declare no conflict of interest.
References
- Wang, D.; Du, L.; Yao, C. Statistical Study on Space Charge effects and Stage Characteristics of Needle-Plate Corona Discharge under DC Voltage. Energies 2019, 12, 2732. [Google Scholar] [CrossRef]
- Bian, X.; Yu, D.; Chen, L.; MacAlpine, J.M.K.; Wang, L.; Guan, Z.; Chen, F. Influence of aged conductor surface conditions on AC corona discharge with a corona cage. IEEE Trans. Dielectr. Electr. Insul. 2011, 18, 809–818. [Google Scholar] [CrossRef]
- Hernández-Guiteras, J.; Riba, J.-R.; Romeral, L. Redesign process of a 765 kVRMS AC substation connector by means of 3D-FEM simulations. Simul. Model. Pract. Theory 2014, 42, 1–11. [Google Scholar] [CrossRef]
- Hernández-Guiteras, J.; Riba, J.-R.; Casals-Torrens, P. Determination of the corona inception voltage in an extra high voltage substation connector. IEEE Trans. Dielectr. Electr. Insul. 2013, 20, 82–88. [Google Scholar] [CrossRef]
- Suda, T.; Hirayama, Y.; Sunaga, Y. Aging effects of conductor surface conditions on dc corona characteristics. IEEE Trans. Power Deliv. 1988, 3, 1903–1912. [Google Scholar] [CrossRef]
- Chudnovsky, B. Electrical Power Transmission and Distribution; CRC Press: London, UK, 2012. [Google Scholar]
- Rodrigo-Mor, A.; Muñoz, F.; Castro-Heredia, L. A Novel Antenna for Partial Discharge Measurements in GIS Based on Magnetic Field Detection. Sensors 2019, 19, 858. [Google Scholar] [CrossRef]
- Riba, J.-R.; Gómez-Pau, Á.; Moreno-Eguilaz, M. Experimental Study of Visual Corona under Aeronautic Pressure Conditions Using Low-Cost Imaging Sensors. Sensors 2020, 20, 411. [Google Scholar] [CrossRef]
- Electric Power Research Institute Transmission Line Reference Book 345 kV and Above, 2014 ed.; Electric Power Research Institute (EPRI): Palo Alto, CA, USA, 2014.
- Riba, J.-R.; Larzelere, W.; Rickmann, J.; Riba, J.-R.; Larzelere, W.; Rickmann, J. Voltage Correction Factors for Air-Insulated Transmission Lines Operating in High-Altitude Regions to Limit Corona Activity: A Review. Energies 2018, 11, 1908. [Google Scholar] [CrossRef]
- Carsimamovic, A.; Mujezinovic, A.; Carsimamovic, S.; Bajramovic, Z.; Kosarac, M. Electric Field Calculation on Surface of High-Voltage Transmission Line Conductors. In Lecture Notes in Networks and Systems; Springer: Berlin, Germany, 2018; Volume 28, pp. 941–951. [Google Scholar]
- Qin, H.; Lichun, S.; Xingliang, J.; Rong, X.; Qianfei, Y.; Shikun, Z. Calculation of conductors’ surface electric field of ±800kV UHVDC transmission lines with optimized charge simulation method. In Proceedings of the 2008 International Conference on High Voltage Engineering and Application, ICHVE 2008, Chongqing, China, 9–12 November 2008; pp. 362–365. [Google Scholar]
- Liu, Y.-P.; Zhu, L.; Lu, F.; Huang, Z. Corona Onset Characteristics of the 750-kV Bundle Conductor in Sand and Dust Weather in High-Altitude Area. IEEE Trans. Power Deliv. 2014, 29, 615–623. [Google Scholar] [CrossRef]
- Bian, X.; Chen, L.; Yu, D.; Wang, L.; Guan, Z. Impact of surface roughness on corona discharge for 30-year operating conductors in 500-kV ac power transmission line. IEEE Trans. Power Deliv. 2012, 27, 1693–1695. [Google Scholar] [CrossRef]
- Laforest, J.J.; Whepley, E.A. Radio Noise Aging Characteristics of Small Aluminum Conductors. Trans. Am. Inst. Electr. Eng. Part III Power Appar. Syst. 1962, 81, 424–427. [Google Scholar] [CrossRef]
- Booker, J.R. Natural aging of non-energized aluminum conductors. IEEE Trans. Power Deliv. 1986, 1, 269–274. [Google Scholar] [CrossRef]
- Ma, M.; Zhao, Y.; Guan, Z.; Wang, L. The influence of contaminations on HVDC conductor corona characteristics. In Proceedings of the Annual Report—Conference on Electrical Insulation and Dielectric Phenomena, CEIDP, Vancouver, BC, Canada, 14–17 October 2007; pp. 537–541. [Google Scholar]
- Yi, Y.; Wang, Y.; Wang, L. Conductor Surface Conditions Effects on Audible Noise Spectrum Characteristics of Positive Corona Discharge. IEEE Trans. Dielectr. Electr. Insul. 2016, 23, 1872–1878. [Google Scholar] [CrossRef]
- McAllister, I.W. On the Concept of Electrode Surface Roughness with Reference to Discharge Phenomena in Strongly Electronegative Gases. IEEE Trans. Electr. Insul. 1986, EI-21, 659–662. [Google Scholar] [CrossRef][Green Version]
- Abomailek, C.; Riba, J.-R.; Casals-Torrens, P. Feasibility Analysis of Reduced-Scale Visual Corona Tests in High Voltage Laboratories. IET Gener. Transm. Distrib. 2018, 13, 2543–2549. [Google Scholar] [CrossRef]
- Capelli, F.; Riba, J.-R.; Pérez, J. Three-Dimensional Finite-Element Analysis of the Short-Time and Peak Withstand Current Tests in Substation Connectors. Energies 2016, 9, 418. [Google Scholar] [CrossRef]
- Abomailek, C.; Capelli, F.; Riba, J.-R.; Casals-Torrens, P. Transient thermal modelling of substation connectors by means of dimensionality reduction. Appl. Therm. Eng. 2017, 111, 562–572. [Google Scholar] [CrossRef]
- Ishfaq, K.; Ali, M.A.; Ahmad, N.; Zahoor, S.; Al-Ahmari, A.M.; Hafeez, F. Modelling the Mechanical Attributes (Roughness, Strength, and Hardness) of Al-alloy A356 during Sand Casting. Materials 2020, 13, 598. [Google Scholar] [CrossRef]
- Ran, G.; Zhou, J.E.; Wang, Q.G. Precipitates and tensile fracture mechanism in a sand cast A356 aluminum alloy. J. Mater. Process. Technol. 2008, 207, 46–52. [Google Scholar] [CrossRef]
- International Organization for Standardization. ISO—ISO 9227:2017—Corrosion tests in artificial atmospheres—Salt Spray Tests; International Organization for Standardization: Geneva, Switzerland, 2017; pp. 1–18. [Google Scholar]
- ASTM. B117—19 Standard Practice for Operating Salt Spray (Fog) Apparatus; ASTM: West Conshohocken, PA, USA, 2019; pp. 1–11. [Google Scholar]
- Capelli, F.; Riba, J.; Ruperez, E.; Sanllehi, J. A Genetic-Algorithm-Optimized Fractal Model to Predict the Constriction Resistance From Surface Roughness Measurements. IEEE Trans. Instrum. Meas. 2017, 66, 2437–2447. [Google Scholar] [CrossRef]
- ISO 4287:1997. Geometrical Product Specifications (GPS)—Surface texture: Profile method—Terms, Definitions and Surface Texture Parameters; ISO: Geneva, Switzerland, 1997; Volume 25. [Google Scholar]
- Riba, J.-R.; Abomailek, C.; Casals-Torrens, P.; Capelli, F. Simplification and cost reduction of visual corona tests. IET Gener. Transm. Distrib. 2018, 12, 834–841. [Google Scholar] [CrossRef]
- IEEE Std 1829-2017—IEEE Guide for Conducting Corona Tests on Hardware for Overhead Transmission Lines and Substations; IEEE: Piscataway, NJ, USA, 2017.
- IEEE Standard for High-Voltage Testing Techniques; IEEE Std 4-2013 (Revision IEEE Std 4-1995); IEEE: Piscataway, NJ, USA, 10 May 2013; pp. 1–213.
- Riba, J.-R.; Gómez-Pau, Á.; Moreno-Eguilaz, M.; Bogarra, S. Arc Tracking Control in Insulation Systems for Aeronautic Applications: Challenges, Opportunities, and Research Needs. Sensors 2020, 20, 1654. [Google Scholar] [CrossRef] [PubMed]
- ANSI/NEMA CC1. In Proceedings of the Electric Power Connection for Substation, Wuhan, China, 26–29 May 2009.
© 2020 by the authors. Licensee MDPI, Basel, Switzerland. This article is an open access article distributed under the terms and conditions of the Creative Commons Attribution (CC BY) license (http://creativecommons.org/licenses/by/4.0/).

