Article

Current State and Future Prospective of Repowering Wind Turbines: An Economic Analysis

Department of Agriculture and Food Sciences, Neubrandenburg University of Applied Sciences, 17033 Neubrandenburg, Germany
*
Author to whom correspondence should be addressed.
Energies 2020, 13(12), 3048; https://doi.org/10.3390/en13123048
Submission received: 12 May 2020 / Revised: 3 June 2020 / Accepted: 8 June 2020 / Published: 12 June 2020
(This article belongs to the Special Issue European Energy Policy at a Crossroads)

Abstract

:
For over two decades, the construction of wind turbines in Germany has been supported by guaranteed feed-in tariffs determined by the Renewable Energy Sources Act (EEG), the primary goal of which is climate protection, in addition to reducing the country’s dependence on the import of (finitely available) fossil fuels. After China and the United States, Germany ranks third worldwide in the production of wind energy. The number of onshore wind turbines in Germany has risen to approximately 30,000 plants, of which approximately 10,000 wind turbines will fall out of the guaranteed EEG funding window in the next one to two years. There are basically two alternatives for these wind turbines: either continuing operations, with the sale of electricity at relatively low and fluctuating electricity stock prices, or repowering, which opens access to the fixed feed-in tariffs for another 20 years. However, repowering has the disadvantages that an approval process must be carried out and the investor must participate in a tender. There is no guarantee for the granting of a building permit; economically feasible operations also depend on the fact that one can win a contract without the submitted price being set too low. This area of tension is illustrated by a wind farm in Mecklenburg-Western Pomerania and analysed economically. The investment in new, more efficient, and larger wind turbines currently promises a high return. The profitability of the investment in wind turbines is determined using the net present value (NPV) method. In addition, a risk analysis is carried out using stochastic simulation. As a result, the feed-in tariff contributes to over 95% of the variance in the net present value (NPV).

1. Introduction

Climate change and the associated energy turnaround towards renewable energies (RE) are currently hotly debated topics. Governments, parliaments, and the population worldwide have been pushing for measures to be implemented, in order to limit global warming—as per the agreement reached in Paris in December 2015—to well below 2 degrees below pre-industrial values [1]. For this purpose, energy production from fossil sources should be reduced and replaced by renewable energies (RE). In Germany, electricity from renewable energies is set to increase to 80% by 2050 [2] where the Renewable Energy Sources Act (Erneuerbare-Energien-Gesetz—EEG) has been promoting energy generation primarily from wind, sun, and biomass for over two decades. In 2018, wind energy was the leading RE, with a 17.1% share in total electricity production [3]. This article examines the economic viability of investments; in particular, the repowering of older wind turbines. First, the development of the wind industry is discussed.
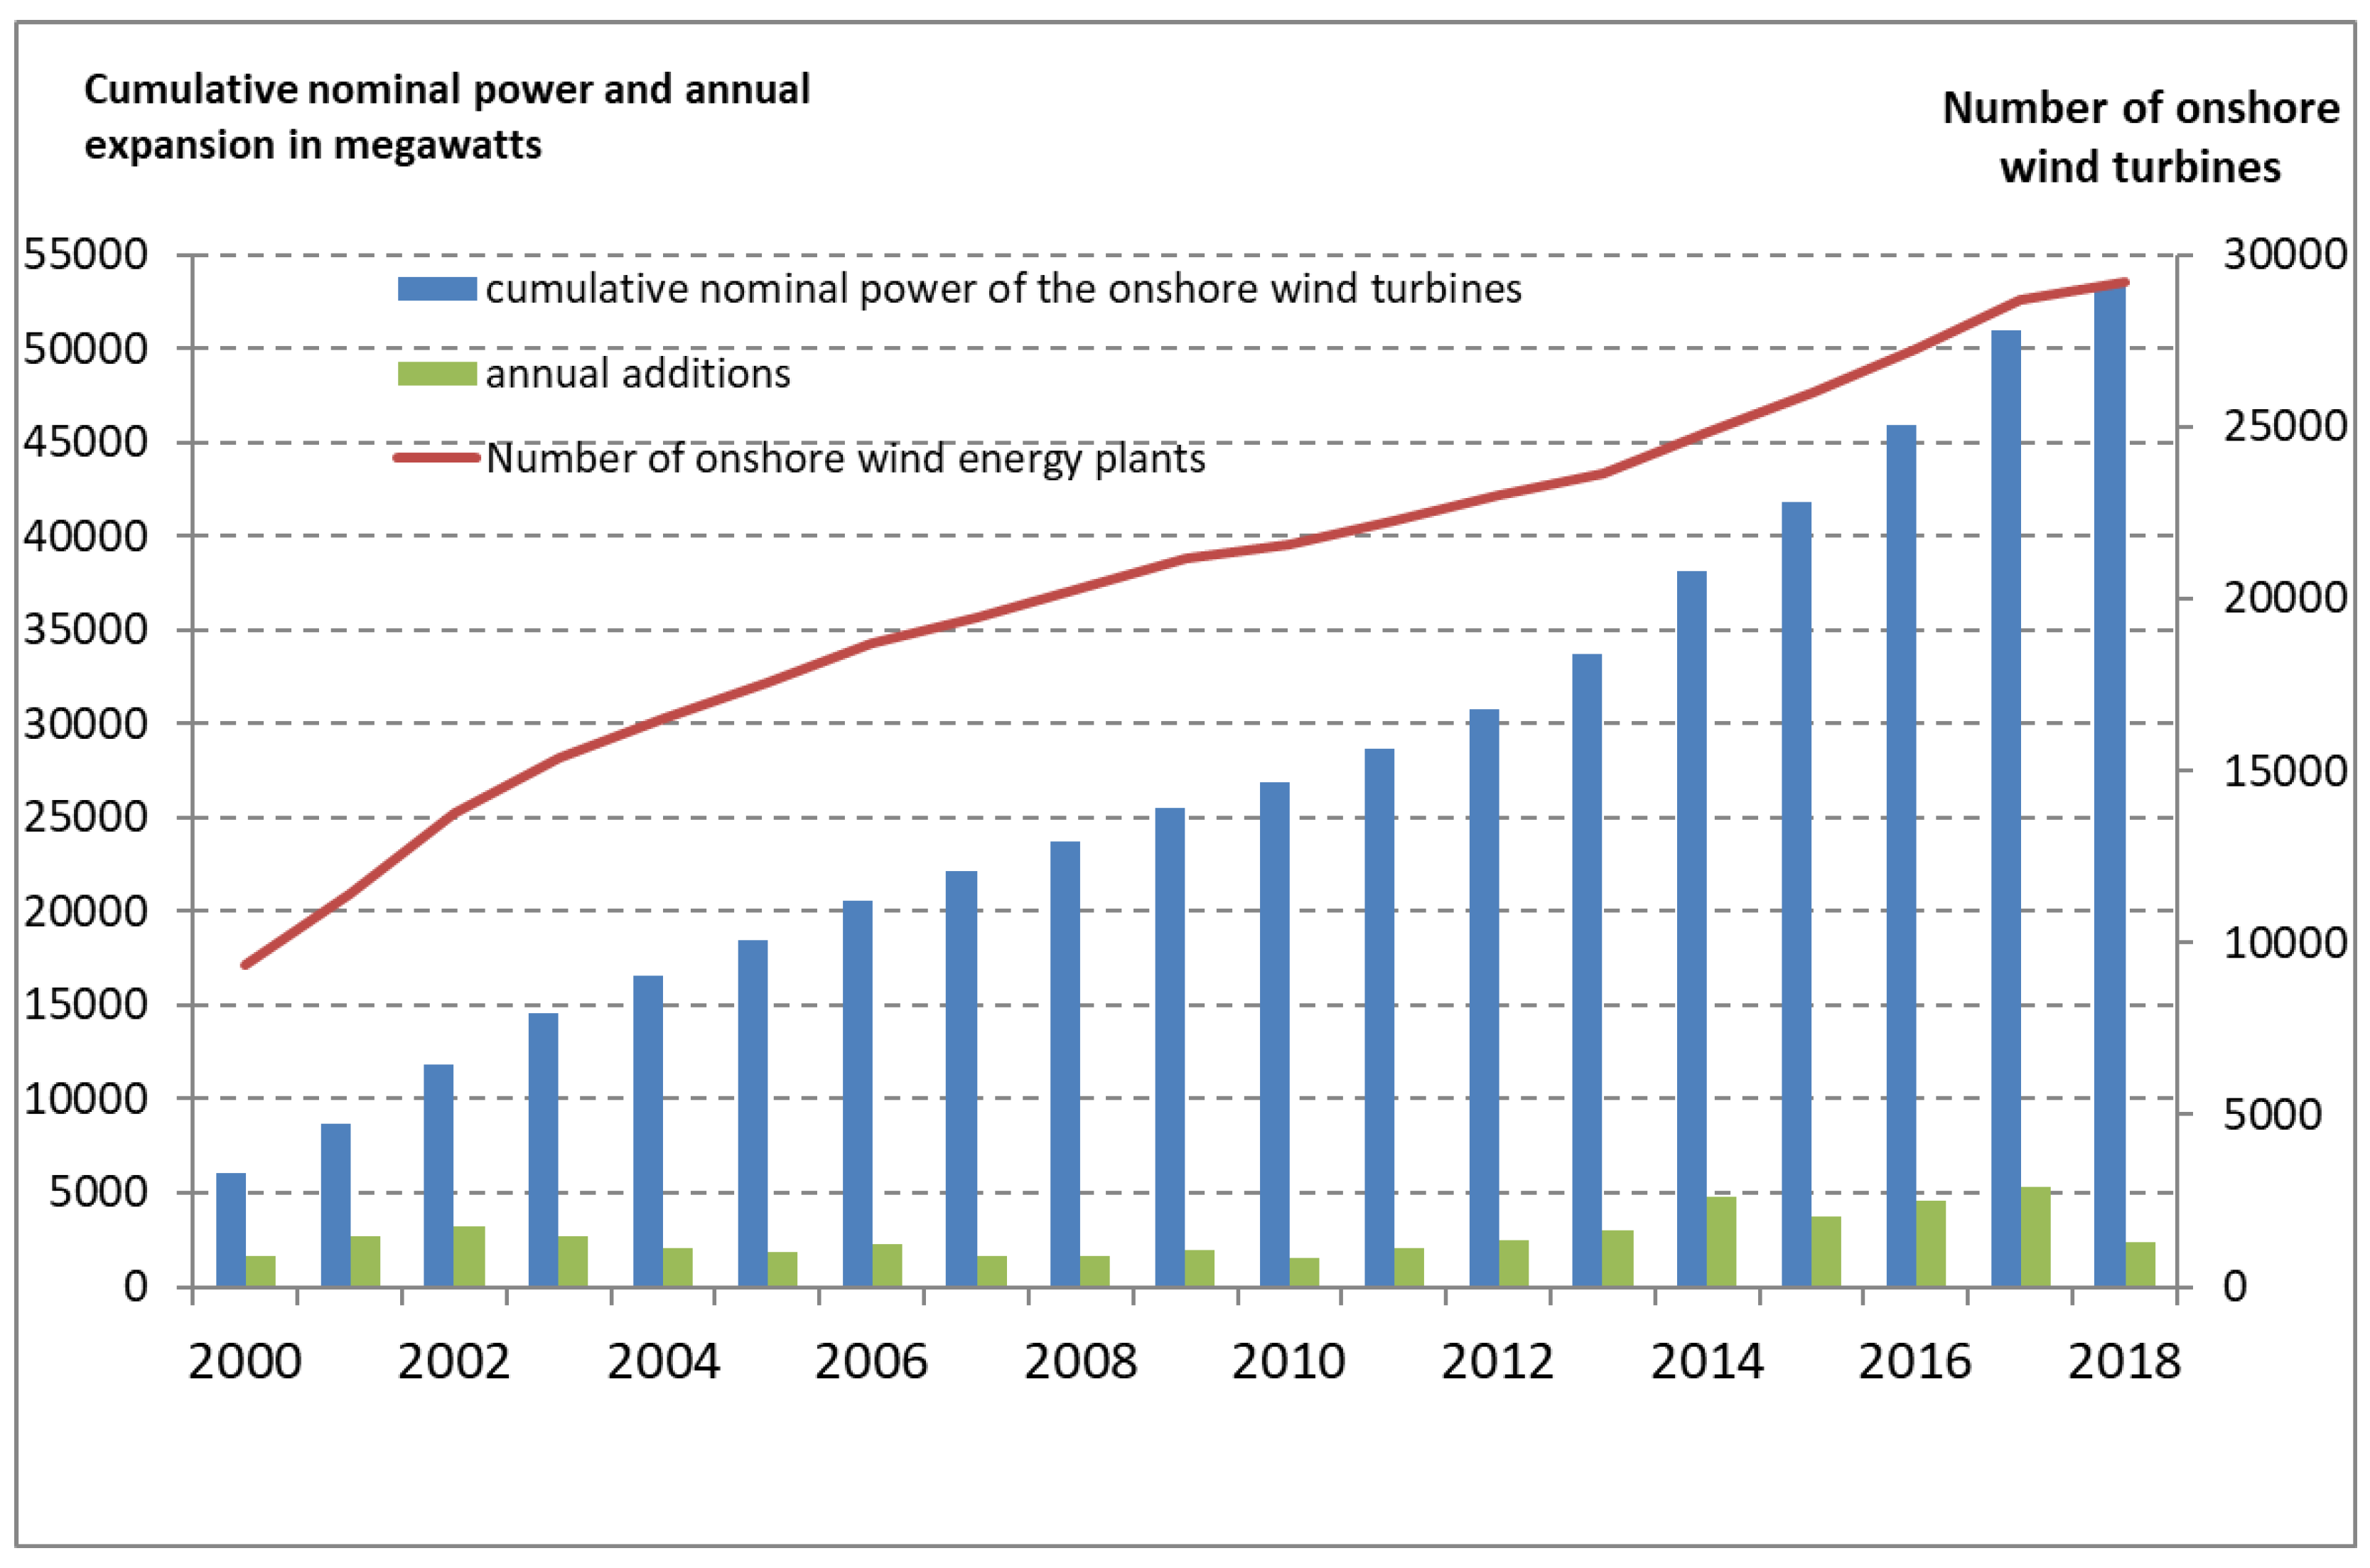
The wind industry has experienced a rapid increase in development worldwide. In 2018, 591,549 MW were already installed (Figure 1). Of the worldwide installed onshore wind power, China has the highest share (36%), followed by the USA (17%), and then Germany, with a worldwide share of 9% (Figure 2). Within Europe, the highest amounts of wind power were generated in Germany (111.6 TWh), the United Kingdom (55.8 TWh), Spain (50.8 TWh), and France (27.9 TWh) in 2018 (Figure 3). There are approximately 30,000 onshore wind turbines in Germany, of which approximately 10,000 will soon reach the age of 20 years (Figure 4). The latter have significant technical disadvantages (i.e., lower efficiency), as well as economic disadvantages (i.e., expiry of the guaranteed EEG feed-in tariff for electrical power), which are discussed in more detail below.
The German measures to support the investments in RE are briefly described here. The feed-in tariff is a guaranteed price for producers of renewable electricity, which is determined by the Renewable Energy Sources Act (EEG). These electricity revenues, which are in general above the market price, are financed through a levy on the electricity consumer. This EEG surcharge is part of the electricity price and amounts, in 2020, to 6.756 ct/kWh. The feed-in tariff has demonstrated a tendency to decline, due to economies of scale and technical progress in RE production, in order to avoid overcompensation to producers, while the EEG surcharge has increased due to growing investments in RE.
All in all, the prominent position that the wind industry has among REs and its importance are clear, particularly in Germany. Although the expansion of the wind turbines is currently stalling [6], wind energy is expected to continue to be a pillar of the energy transition in the future, both by designating new wind suitability areas and by replacing smaller, outdated plants with larger and more efficient new plants.
In the following, the beginning situation and the cost structure for the repowering of wind turbines (WKA) are shown using a wind farm in Mecklenburg-Western Pomerania, which went into operation in 2001 and 2002. Their decision about replacement essentially depends on the outcome of the approval process, which is briefly described. The expected future profits (net present value, NPV) are determined, to a certain extent, by future events. The associated risks form the conclusion of their considerations.

2. Description of the Wind Farm Example and the Technical Innovations of Repowering

The wind turbines to be replaced are type V80 wind turbines from the Danish company Vestas Wind Systems. Based on recent reports, the wind farm operators at the location in Mecklenburg-Western Pomerania considered in this paper want to switch to new, larger, and more efficient wind turbines of types N133 and N149 from Nordex (Table 1). The use of two different types of turbine is necessary, in order to meet the different requirements for the optimal design of the wind farm area, with regards to height, distance, and performance. Thanks to more efficient turbines and the better usable volume at higher altitudes, the new wind turbines not only produce more power (and, thus, electricity), but are also—thanks to the low number of revolutions per minute—significantly less noisy and produce energy more consistently, contributing to grid compatibility. Another associated positive effect is the increase in full load hours [7]. To determine the average wind speed at scar height, data from wind reports and from the German Weather Service (Deutscher Wetterdienst, DWD [8]) were used. The Formula (1) of the Weibull distribution, modified according to Konstantin (2013), was used to calculate the wind speed distribution:
f(w) = 8760 * π/2*w/wm2*e−π/4*(w/wm)2; in h/a
with w = wind speed in the time interval, wm = annual wind speed on the scar.
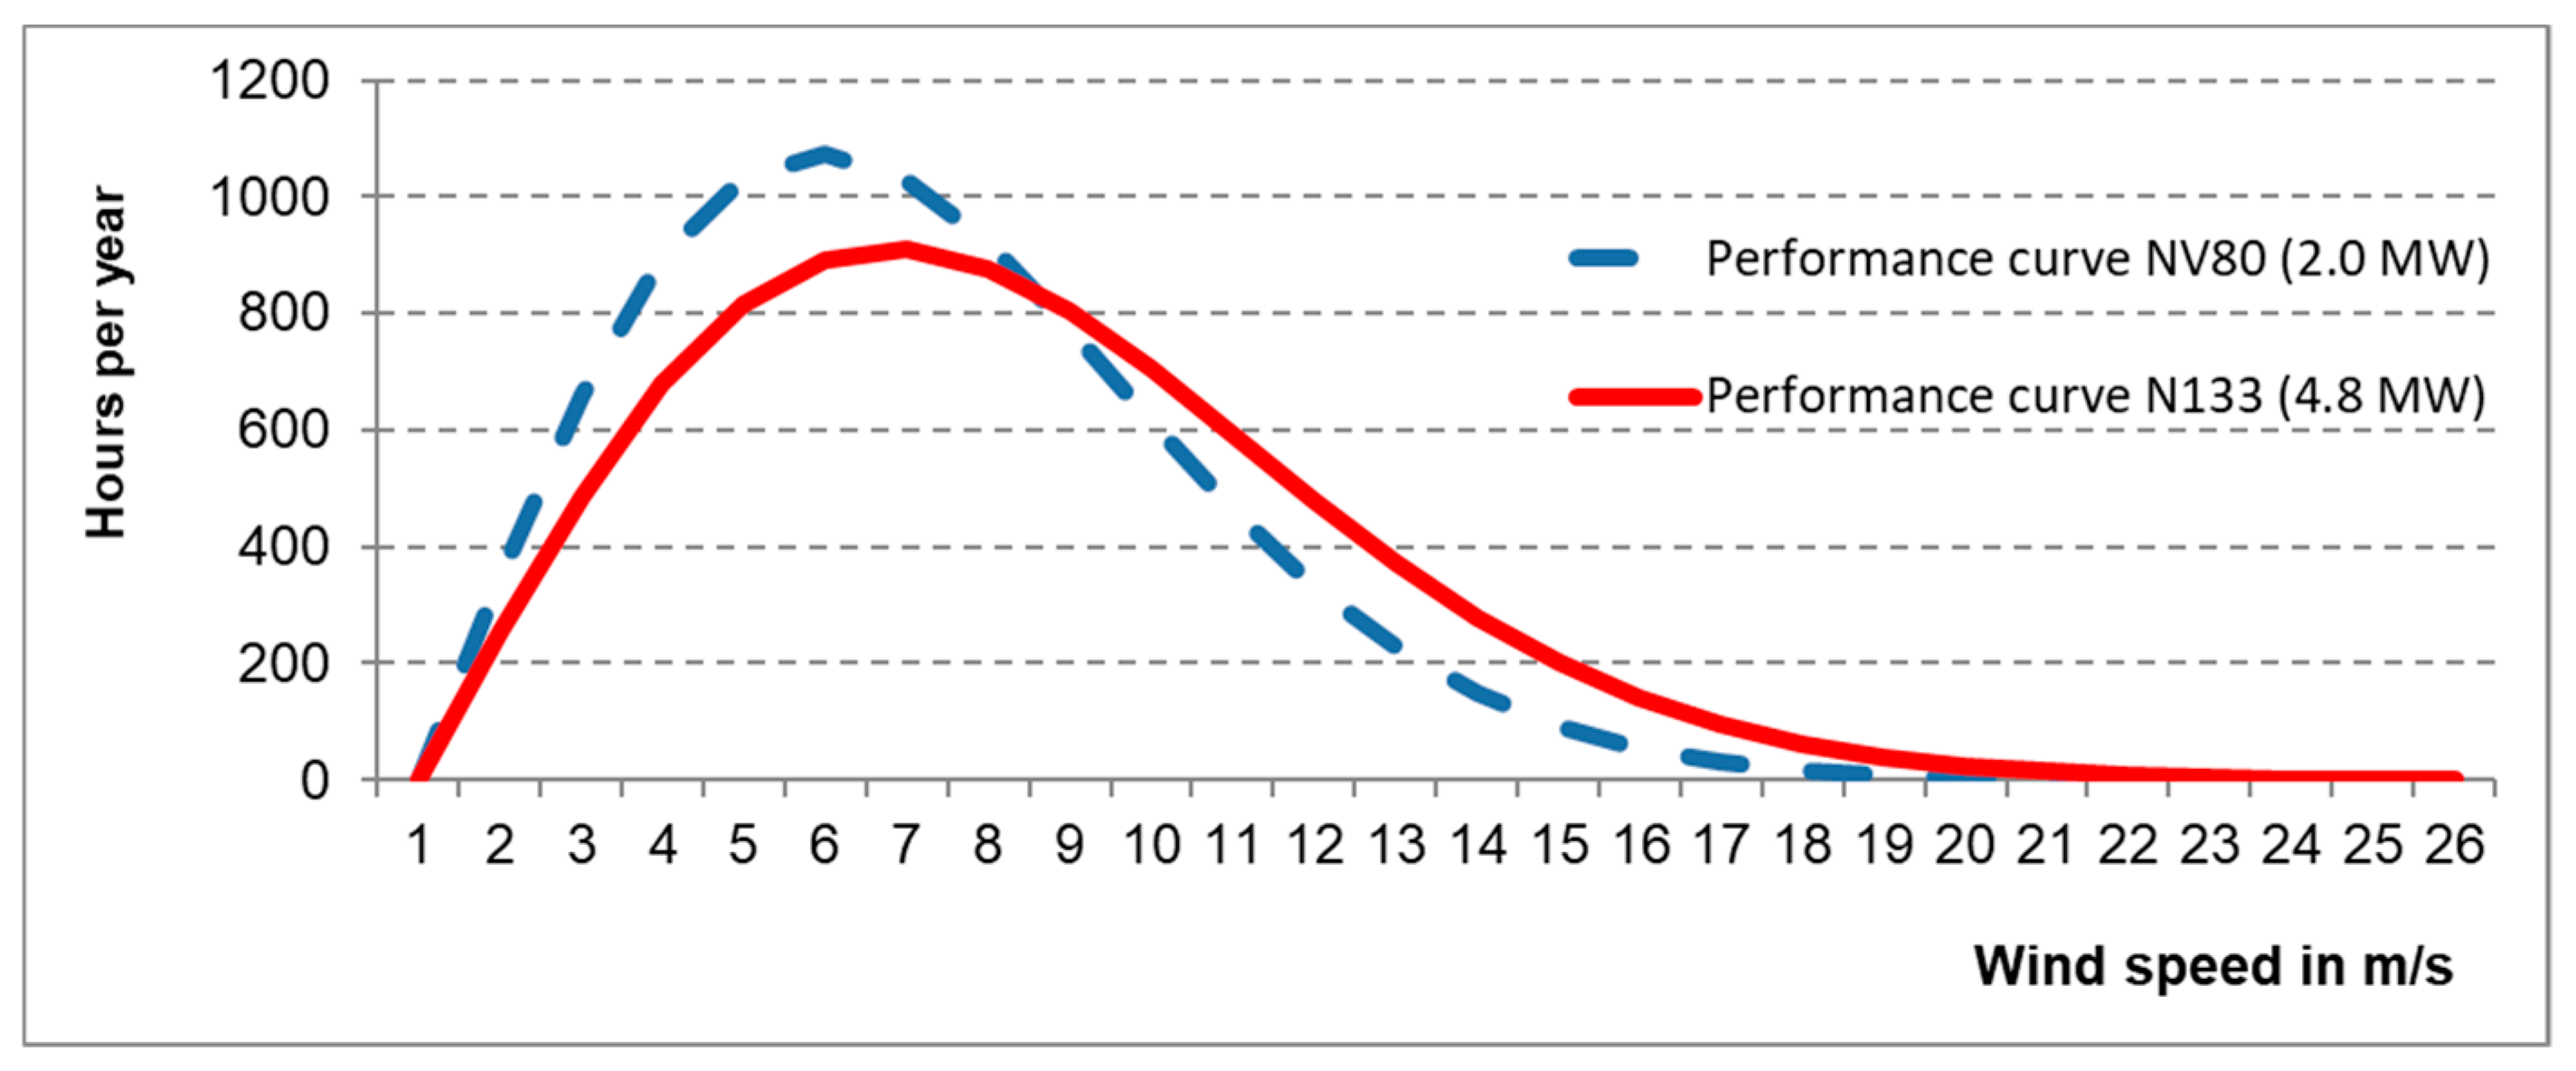
For V80, with 2 MW, the wind speed wm is assumed to be 6.2 m/s at 80 m hub height and 7.3 m/s for N133 at 125 m hub height. The distribution of the wind speed over a year has a maximum at 911 h for the N133 system; however, the old system, V80, has a maximum of 1074 h a year. The new system can use a wide range of wind speeds and convert it into power (Figure 5). This results in an overall higher gross annual energy yield, which differs significantly from the V80, due to the higher nominal output. Compared to the old system, the new N133, according to the model calculation, brings an increase of approximately 92 h/a [9]. By reducing the number of wind turbines and increasing their performance, the landscape is rectified, which can contribute to acceptance among the population. Furthermore, a new adjustment of the plants to the changed settlement structure can be made.
Repowering requires a new approval process. The technical part of the necessary planning documents includes a soil survey, the course of the cable routes, and proof of ownership and lease relationships in the building land. For this purpose, a description of the location (geographical location and land maps) is required, which contains information on crane access, crane parking spaces, construction documents for the wind turbines, and a map of the areas indicating the associated distance requirements [16]. The second component of the approval process is an environmental impact assessment, according to the Federal Immission Control Act (Bundesimmissionsschutzgesetz (BImSchG) [17]. A large number of documents relating to the environment and emissions law must be obtained; in particular, relating to occupational safety, air traffic control, a wind report, turbulence, ice shedding, sound emissions, the construction materials used, waste treatment, visualization, plant safety, lightning and fire protection, and a landscape management plan, as well as (where applicable) the archaeological peculiarities, the termination of operations, species protection, the settlement structure, Flora–Fauna–Habitat Directive (FFH) compatibility, monument protection, classification of flora and fauna, biotope structure, soil management, natural characterization, water management, and soil sealing [16].
A study by the specialist wind energy agency on land in 2015 determined the duration and costs of the planning and approval process, specifically for all federal states in Germany. The studies for Mecklenburg-Western Pomerania showed average costs for planning and approval of €69 per kilowatt (kW) and an average duration of 78 months (6.5 years) until approval [18]. Project development, thus, corresponds to about 5% of the total investment costs. Initially, this poses a high investment risk for the operator; after all, the costs incurred from the planning and approval phases cannot be generated later by the project if approval is denied [7].
Although regional development programs have called for the further designation of wind suitability and priority areas [19], the expansion of wind energy in recent years has been locked in the approval process, due to stricter conditions and an annually restricted tender volume for the secure remuneration of fed electricity, making the process more difficult. If repowering is not approved, the old wind turbines can continue to operate. The old plants are able to continue to achieve good energy yields, especially in the wind conditions on the coast [7]. The balance between the continued use of old wind turbines and investment in new wind turbines should, therefore, also be considered here.
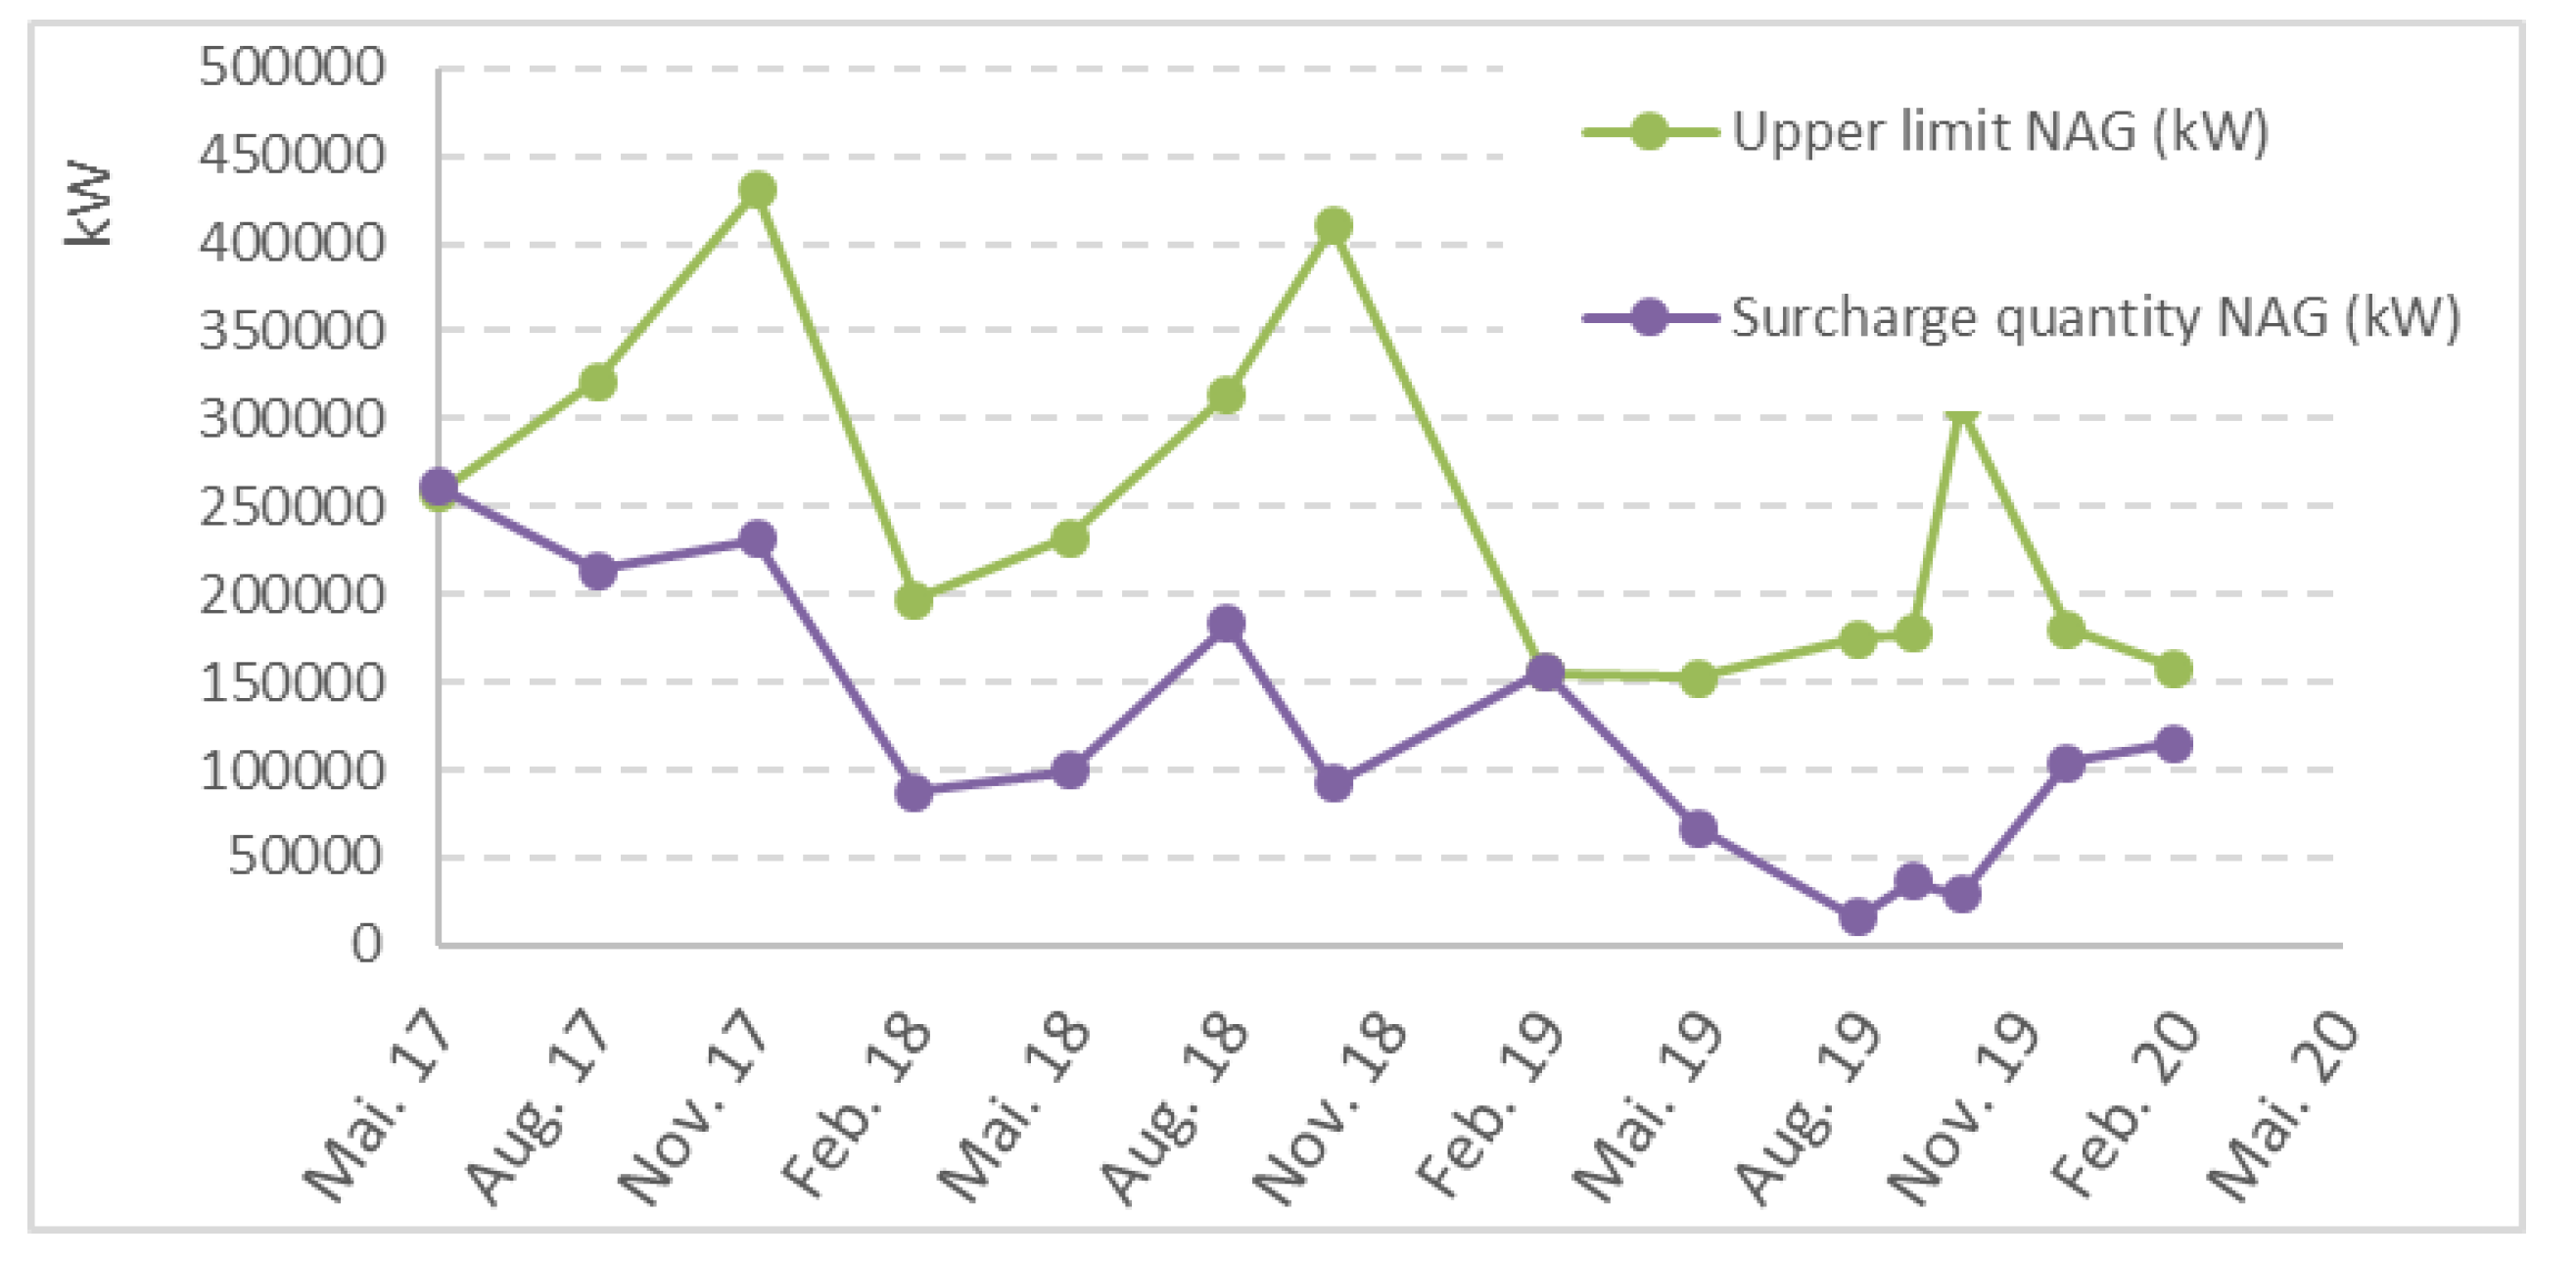
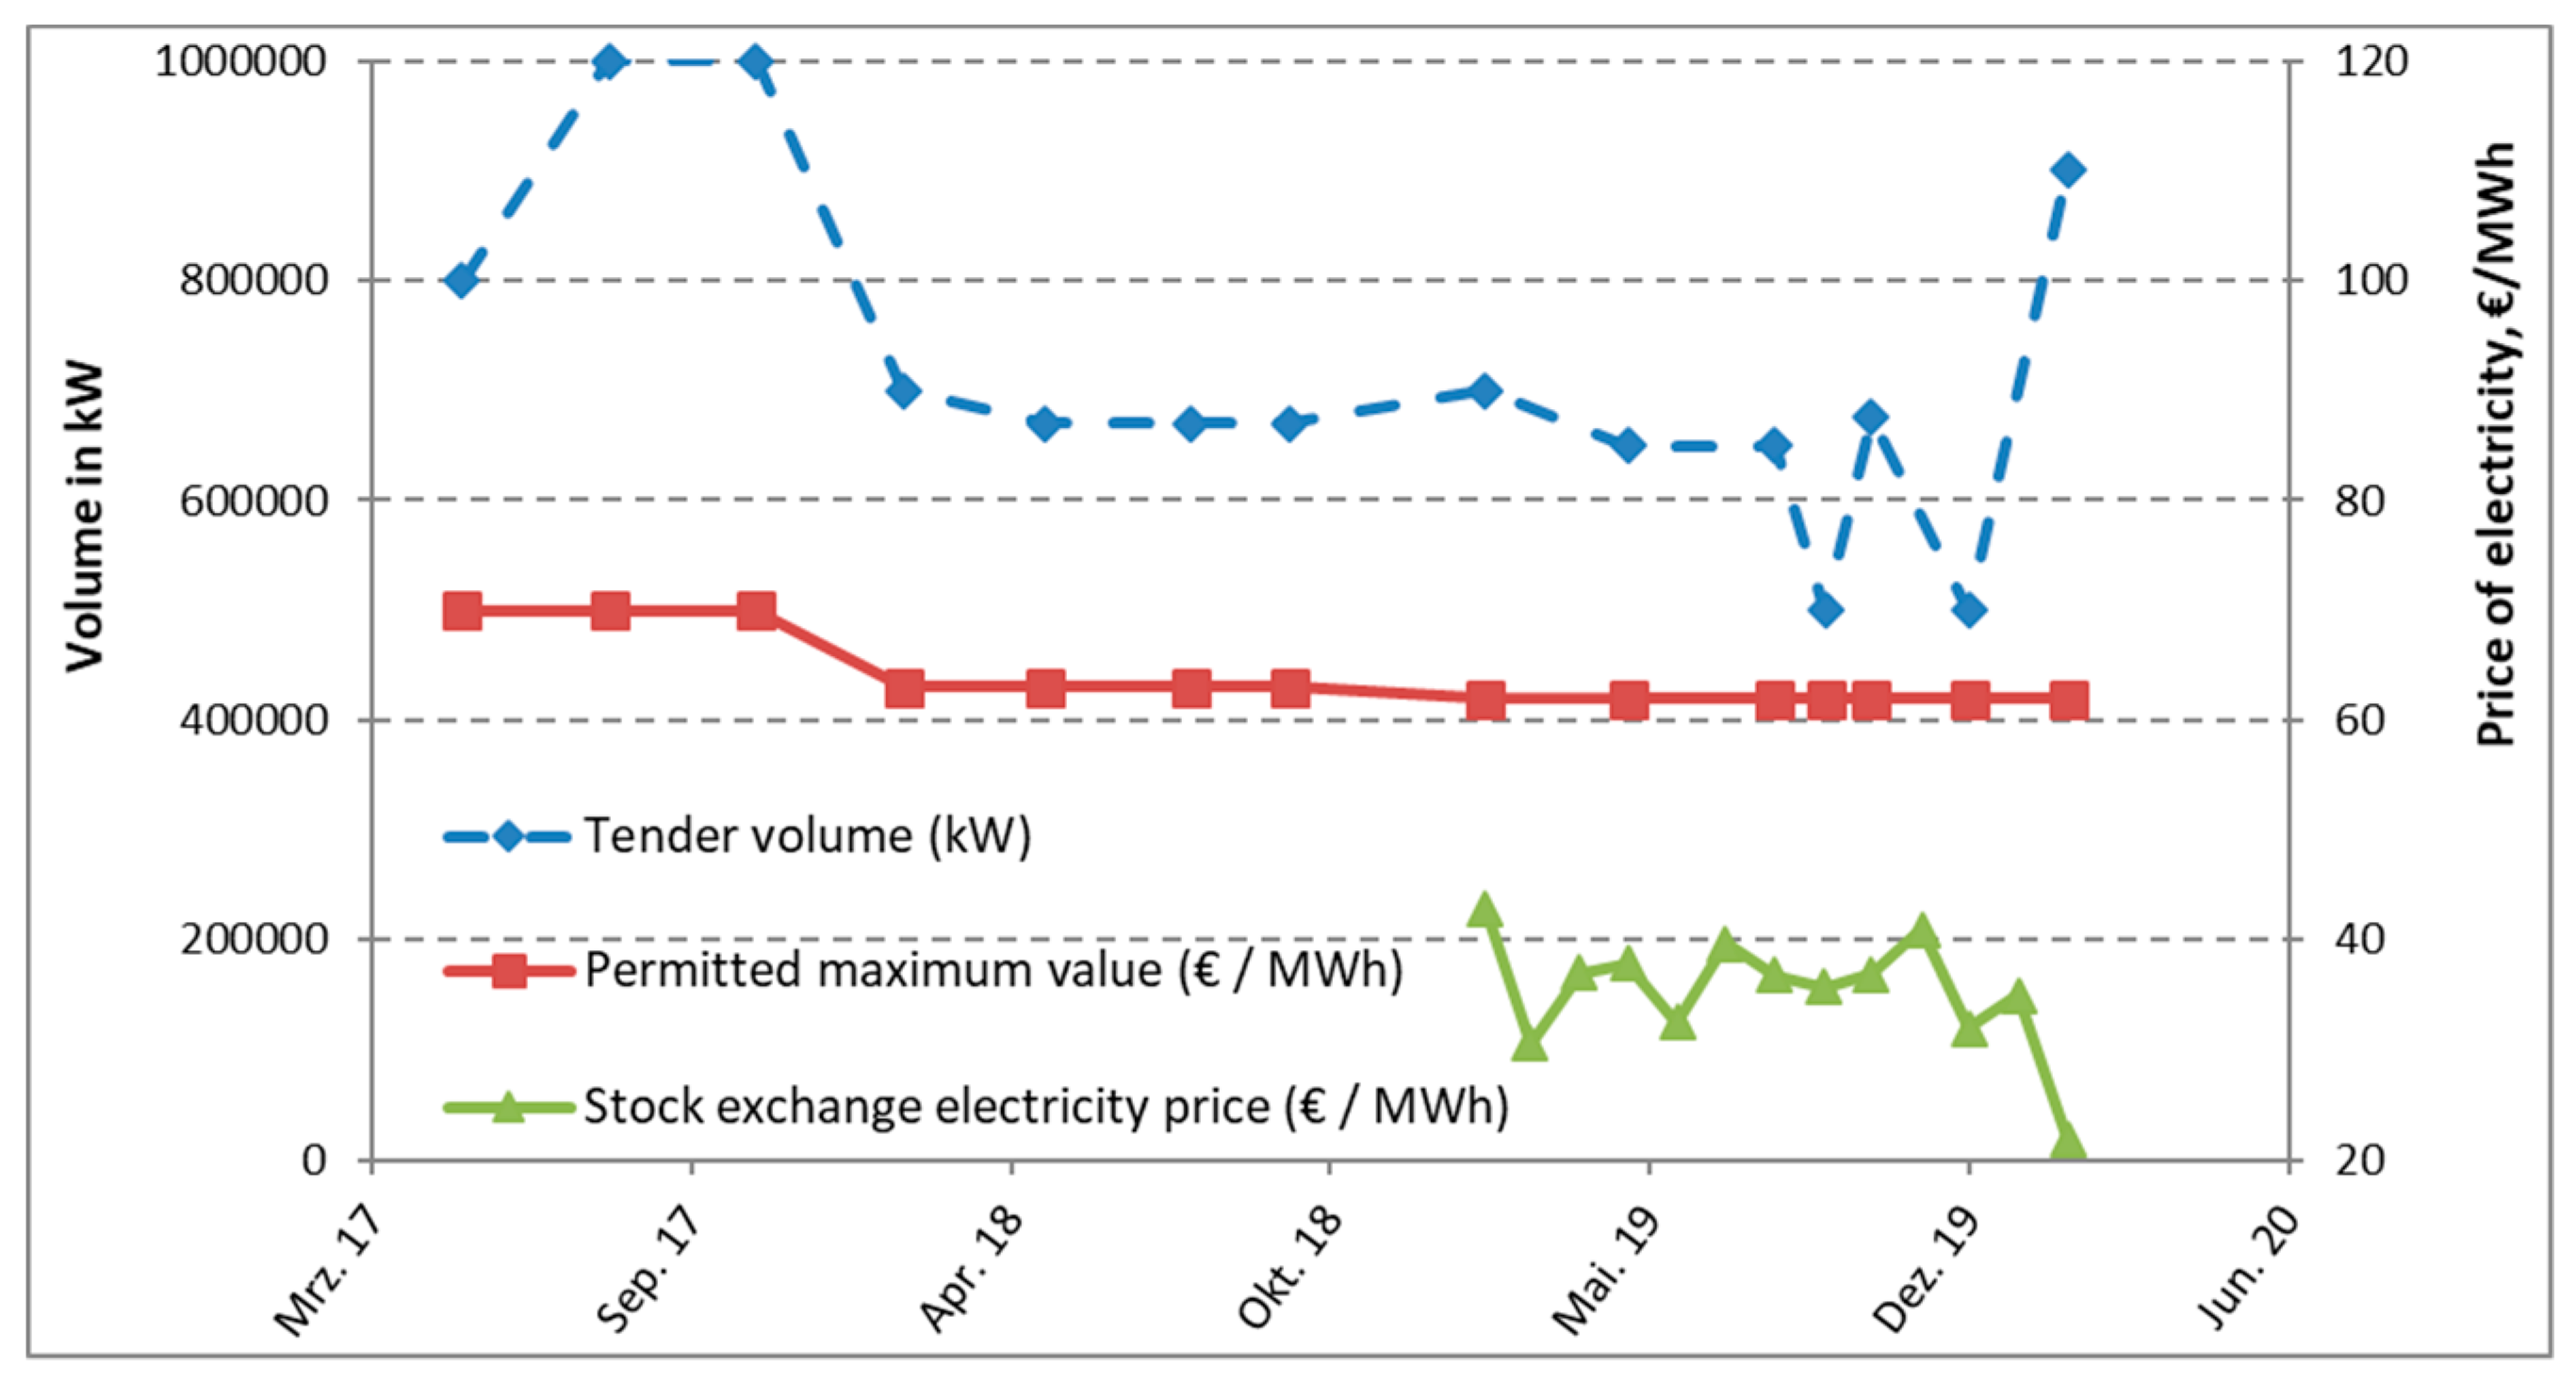
Since the amendment of the EEG in January 2017, the remuneration amount for fed-in electricity is no longer fixed by law; instead, investors must participate in a tendering procedure. The surcharge volume is limited, as is the remuneration rate. According to the Federal Network Agency, a total volume of 3675 MW in Germany was divided into six auction dates in 2019. Throughout 2019, 269 bids with a bid volume of 2111.25 MW were submitted, for which 236 bids were awarded. This corresponds to an additional quantity of 1846.71 MW. Therefore, the upper limit was not reached (Figure 6) and the remuneration for electricity could be granted at the highest permissible level (Figure 7). The permissible maximum bid for the remuneration of electricity for new wind turbines is currently 6.2 ct/kWh. The average quantity-weighted surcharge over the six cut-off dates was 6.1583 ct/kWh. The range of variation was 5.24–6.2 ct/kWh [20]. Under these conditions, the obstacle to investing in wind turbines at suitable locations is not the electricity revenues, but the lack of building permits. The current (i.e., as long as the investment backlog for wind turbines persists) relatively high remuneration rates for new wind turbines and repowering can, thus, be assumed.
For more and more old wind turbines, which were built during the building boom in the early 2000s, the period of 20 years with secured remuneration will expire in the near future. This usually means lower remuneration rates for the electricity produced; for example, on the EPEX spot market for Germany/Luxembourg in the period from February 2019 to February 2020, an exchange electricity price between “only” 21.92–42.82 €/MWh could be achieved (Figure 7). If a wind turbine falls out of the EEG subsidy, its profitability drops considerably, due to the lower remuneration, and this situation confronts the operator with the decision to “continue operation” or “repowering”. Both scenarios are examined, in more detail, in the following chapter.

3. Investment Analysis

3.1. Static Analysis: Continued Operation or Investment at Currently High Remuneration Prices

The starting point for the economic assessment is the average gross annual energy yield of the wind turbines, which is calculated based on the technical key figures of the wind turbines (Table 1) and the Weibull distribution (Figure 5). The old plant, V80, has an annual energy yield of 4329 MWh. If flow-related shadowing effects (wake losses) of 11.3% are deducted, the net annual energy yield is 3840 MWh [10]. To minimise the shadowing effects in a wind farm, minimum clearances should be maintained. The rotor diameter is decisive when optimizing the distances [7,21]. The new 4.5 MW plants (4.8 MW plants) have an annual gross energy yield of 15,751 MWh (16,478 MWh) and net (i.e., minus wake losses of 11.3%) yield of 13,971 MWh (14,616 MWh). The new wind turbines, thus, yield as much output as three to four of the old wind turbines.
In the case of new wind turbines, an investment requirement including transport and construction of €1000 per kW is assumed (Table 2). In addition, the costs of the approval process must be considered, with an additional share of 10.38% of the technical investment costs, made up of acquisition costs for site rights (5.64%) and project development (5.19%) (Table 2). The investment costs of the new wind turbines, including their connection to the high-voltage network, thus, amount to around six million euro.
In addition, depending on the size of the wind turbine, there are annual operating costs of €160,000–170,000 (Table 3). On average, this corresponds to 3.55% of the ex-factory price. By using the existing infrastructure (e.g., access roads and power lines), repowering is cheaper than a completely new investment [22]. Although the wind turbines considered in the case example are located on the operator’s own land, usual opportunity costs of 7% of the electricity revenue can also be expected here, as the location could alternatively be leased (Table 3).
With the old wind turbines, due to the high number of operating hours already reached, greater repair expenditure can occur, which can result in more frequent maintenance work and higher maintenance costs. This is taken into account in the next chapter (risk analysis), in which maintenance costs in multiple amounts (up to a factor of 3) are expected.
The net present value (NPV) method is used to estimate the profitability of repowering. For this purpose, all revenues and withdrawals were discounted and added up [23]:
N P V = t = 1 n R t ( 1 + i ) t ,
with Rt = Net cash inflow-outflows during a single period t, i = Discount rate or return that could be earned in alternative investments, and n = Number of time periods.
The interest rate (i) is currently 0.4% [24]. The acquisition costs of the 4.8 MW plant are reduced from €6,379,200 to €6,159,200 by the estimated liquidation proceeds of the old plant (€220,000). The dismantling costs for the new plants after 20 years (n) are estimated, on average, at €300,000 [25]. Tax aspects and ways of financing the project are not considered further here.
The remuneration rate for the new system was only calculated based on the new legal requirements regarding the maximum values for remuneration rates. The results of the five tenders from 2019 were used for this purpose. The Federal Network Agency (BNetz-A), subsequently, broke down the bids, which resulted in an average volume-weighted bid value of 6.1583 ct/kWh [20]. The net present value (NPV) is, then, €6.2 million (new 4.5 MW plant) or €7.5 million (new 4.8 MW plant). This gives an economic advantage under the above-described average conditions; in particular, the relatively high remuneration for electricity of 61.583 €/MW. The internal interest rate is 9.08% for the 4.5 MW system and 10.02% for the 4.8 MW system; therefore, the pay-off period is 9 to 10 years.
With the old system (V80 with 2 MW), with a net annual energy yield of 3,840 MWh, and at the current electricity price (October 2019) of 37 €/MWh [26], annual revenues of €142 thousand can be expected. The advantages and recommendations for continued operation depend heavily on the operating costs. With a remaining useful life of 10 years and operating costs of approximately €71,000 per year (p.a.), as well as the lease rate of approximately €10,000 per year, a net present value (discounted gross margin) of €587 thousand can only be expected. If the operating costs were twice as high (factor 2), this net present value (NPV) is already negative.
Comparing the two alternatives—(a) continued operation of the old wind turbines and (b) repowering—one can draw the interim conclusion that the profitability of the old wind turbines (with NVP €587 thousand) is much lower than replacement with new wind turbines (with NVP from approximately €6–7 million). Compared to repowering, the continued operation of the old wind turbines is not competitive. Under certain circumstances, this means that, in the case where the old wind turbines generate negative gross margins, they should be shut down immediately after the end of the operation period with fixed feed-in tariffs. If the gross margins of the old wind turbines are positive, then they should continue to be operated until a building permit(s) for the new wind turbine(s) has been obtained.
If more new wind turbines are approved again, it can be assumed that the guaranteed feed-in tariff for these new wind turbines would decrease in the long run, due to increasing completion in the tender. This has a significant impact on profitability, as the net present value (NPV) to be achieved also decreases. To what extent this could be the case is shown in the following risk analysis.

3.2. Results of the Risk Analysis: Future Development

As already stated, investments are currently (i.e., at the beginning of 2020), in terms of return expectations under average conditions, quite cheap, as the building permits are lacking. When investing in a wind turbine or in your own wind farm, essential parameters are contractually and thus firmly agreed upon for the entire term. In the future, however, the conditions assumed for the static analysis may change and, thus, involve risk. A risk analysis using stochastic simulation was carried out with 10,000 repetitions. In the following risk analysis, the fluctuation ranges for the risk parameters of the annual operating costs were assumed as in Table 3 and taken into account as triangular distributions. In addition, the dismantling costs of a new (4.5 MW or 4.8 MW) plant after 20 years are assumed to be between €100,000 and €500,000, with a median of €300,000 [25]. The variability of other influencing factors particularly affect the old systems. Here, a remaining useful life of between 5 and 10 years and operating costs multiplied by a factor of 1 to 3 are assumed. In addition, it is assumed that the wind turbines are insured against natural hazards, such that insurance would take over in the event of a total loss (e.g., fire). The usage costs for the location of a wind turbine are estimated with a possible range of 4%–10% of the electricity revenue (Table 4).
For this study, leasing of the repowered wind turbines was not an option for the owners of the old wind park, due to their sufficient access to capital for the new investment. In other cases, leasing may be considered as an option. If the latter is the case, how to deal with the question has already been discussed by the authors in another paper, also published in Energies [27] and the further literature listed there). The background to the analysis there was the question why very few landowners, especially farmers, lease their wind turbine sites and do not invest themselves. One of the reasons for this is that farmers have other opportunities or needs; for example, they can also invest their capital in buying land, such that there is usually not enough capital for both investment in wind turbines and land purchase. In addition to a lack of capital, personal risk attitudes also play a role. Risk-averse actors will not anticipate the high fees for planning if the outcome is uncertain. High lease payments also provide motivation to leave the construction of wind turbines to external investors. As part of the study, the authors [27] came to the conclusion that, if the investor is optimistic about wind energy, the existing (equity) capital, and the prospect of approval, leasing is not an option, but the farmer or landowners should invest themselves. These above-mentioned conditions also apply to the wind farm considered here, such that leasing to external investors was also out of the question, even from a risk perspective.
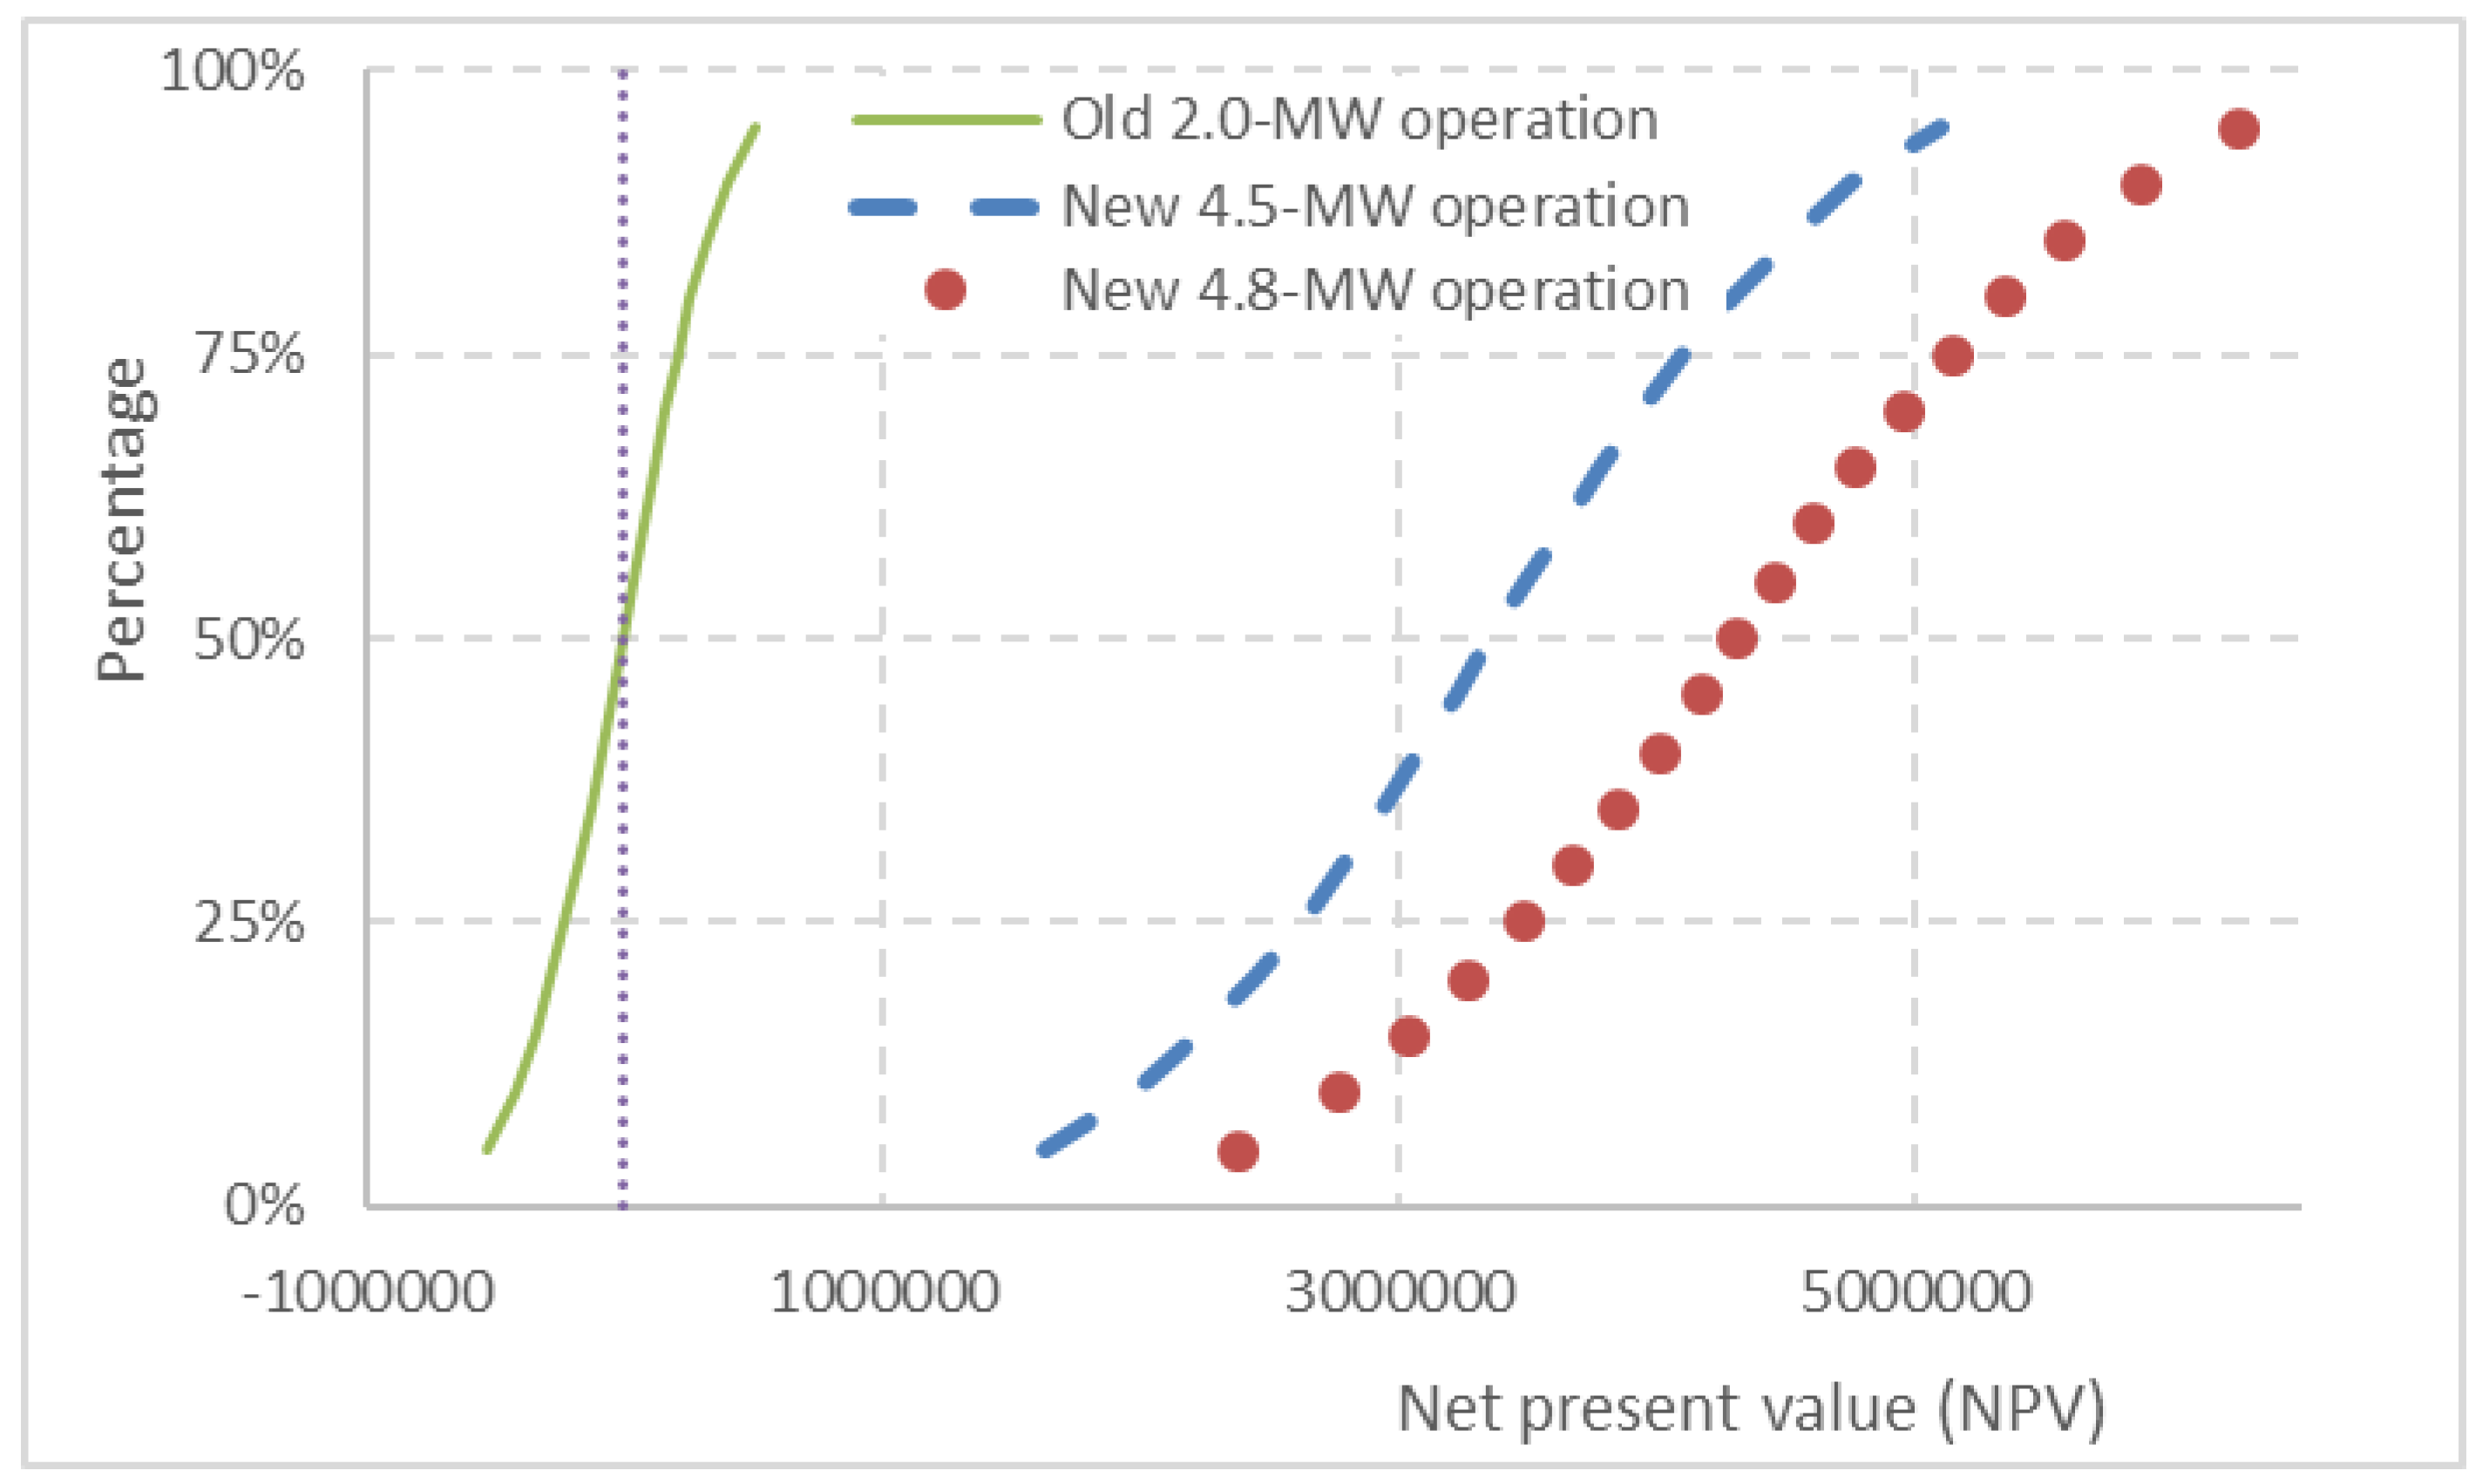
The analysis shows that the new wind turbines achieve a positive net present value (NPV) in all scenarios under the given general conditions and flow losses. Even under unfavourable conditions (i.e., high costs and low remuneration), minimum net present values (NPVs) of approximately €1.6 million and €2.3 million are achieved with the 4.5 MW and 4.8 MW wind turbines, respectively. On average, the net present value (NPV) is €3.3 million (45 MW) or €4.3 million (4.8 MW). This makes the new wind turbines comparatively lucrative. Meanwhile, the old wind turbines can still be operated economically. With low repair costs and high remuneration, positive gross margins are possible, which was achieved in approx. 50% of the simulations (Figure 8).
A stochastic dominance can be determined for all three systems under consideration (Figure 8). It follows that, if a building permit were granted, the old wind turbines should be replaced for economic reasons.
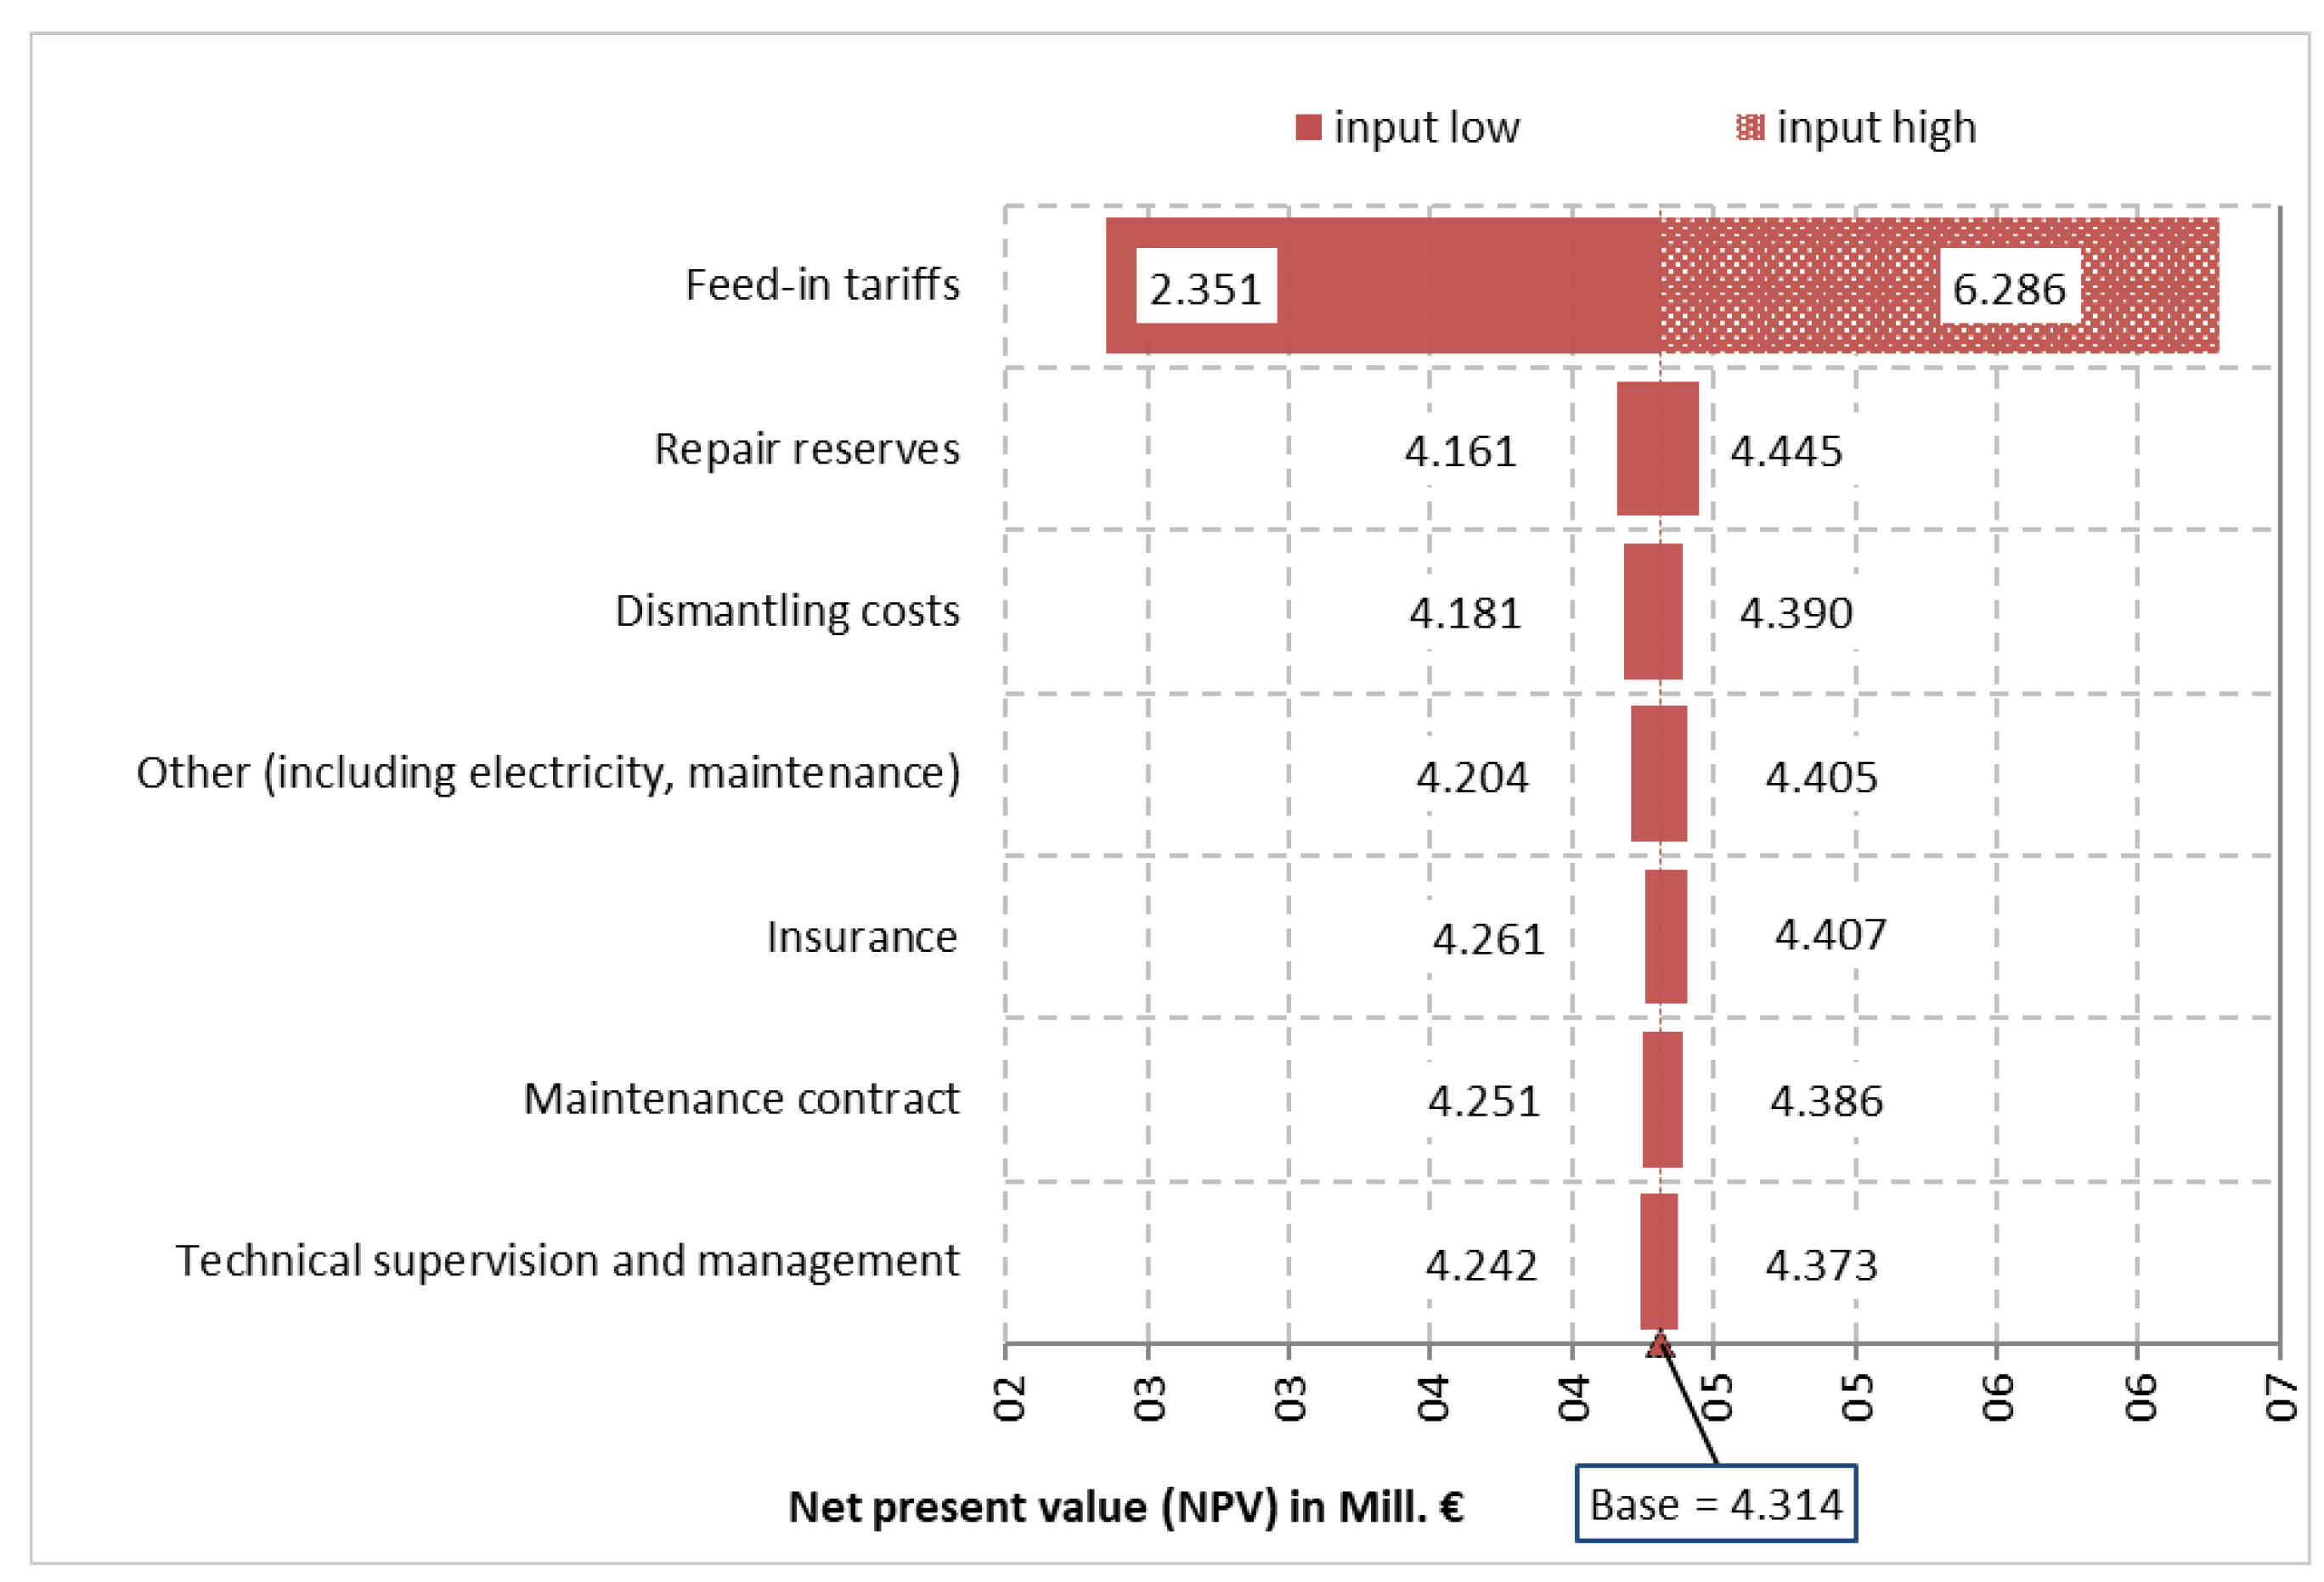
The main influencing factor for profitability is the feed-in tariff. This becomes clear in the tornado analysis (Figure 9). The feed-in tariff contributes over 95% to the variance of the net present value (NPV). Fluctuations in the annual operating costs, as well as in the dismantling costs, have only a minor influence on the end result.
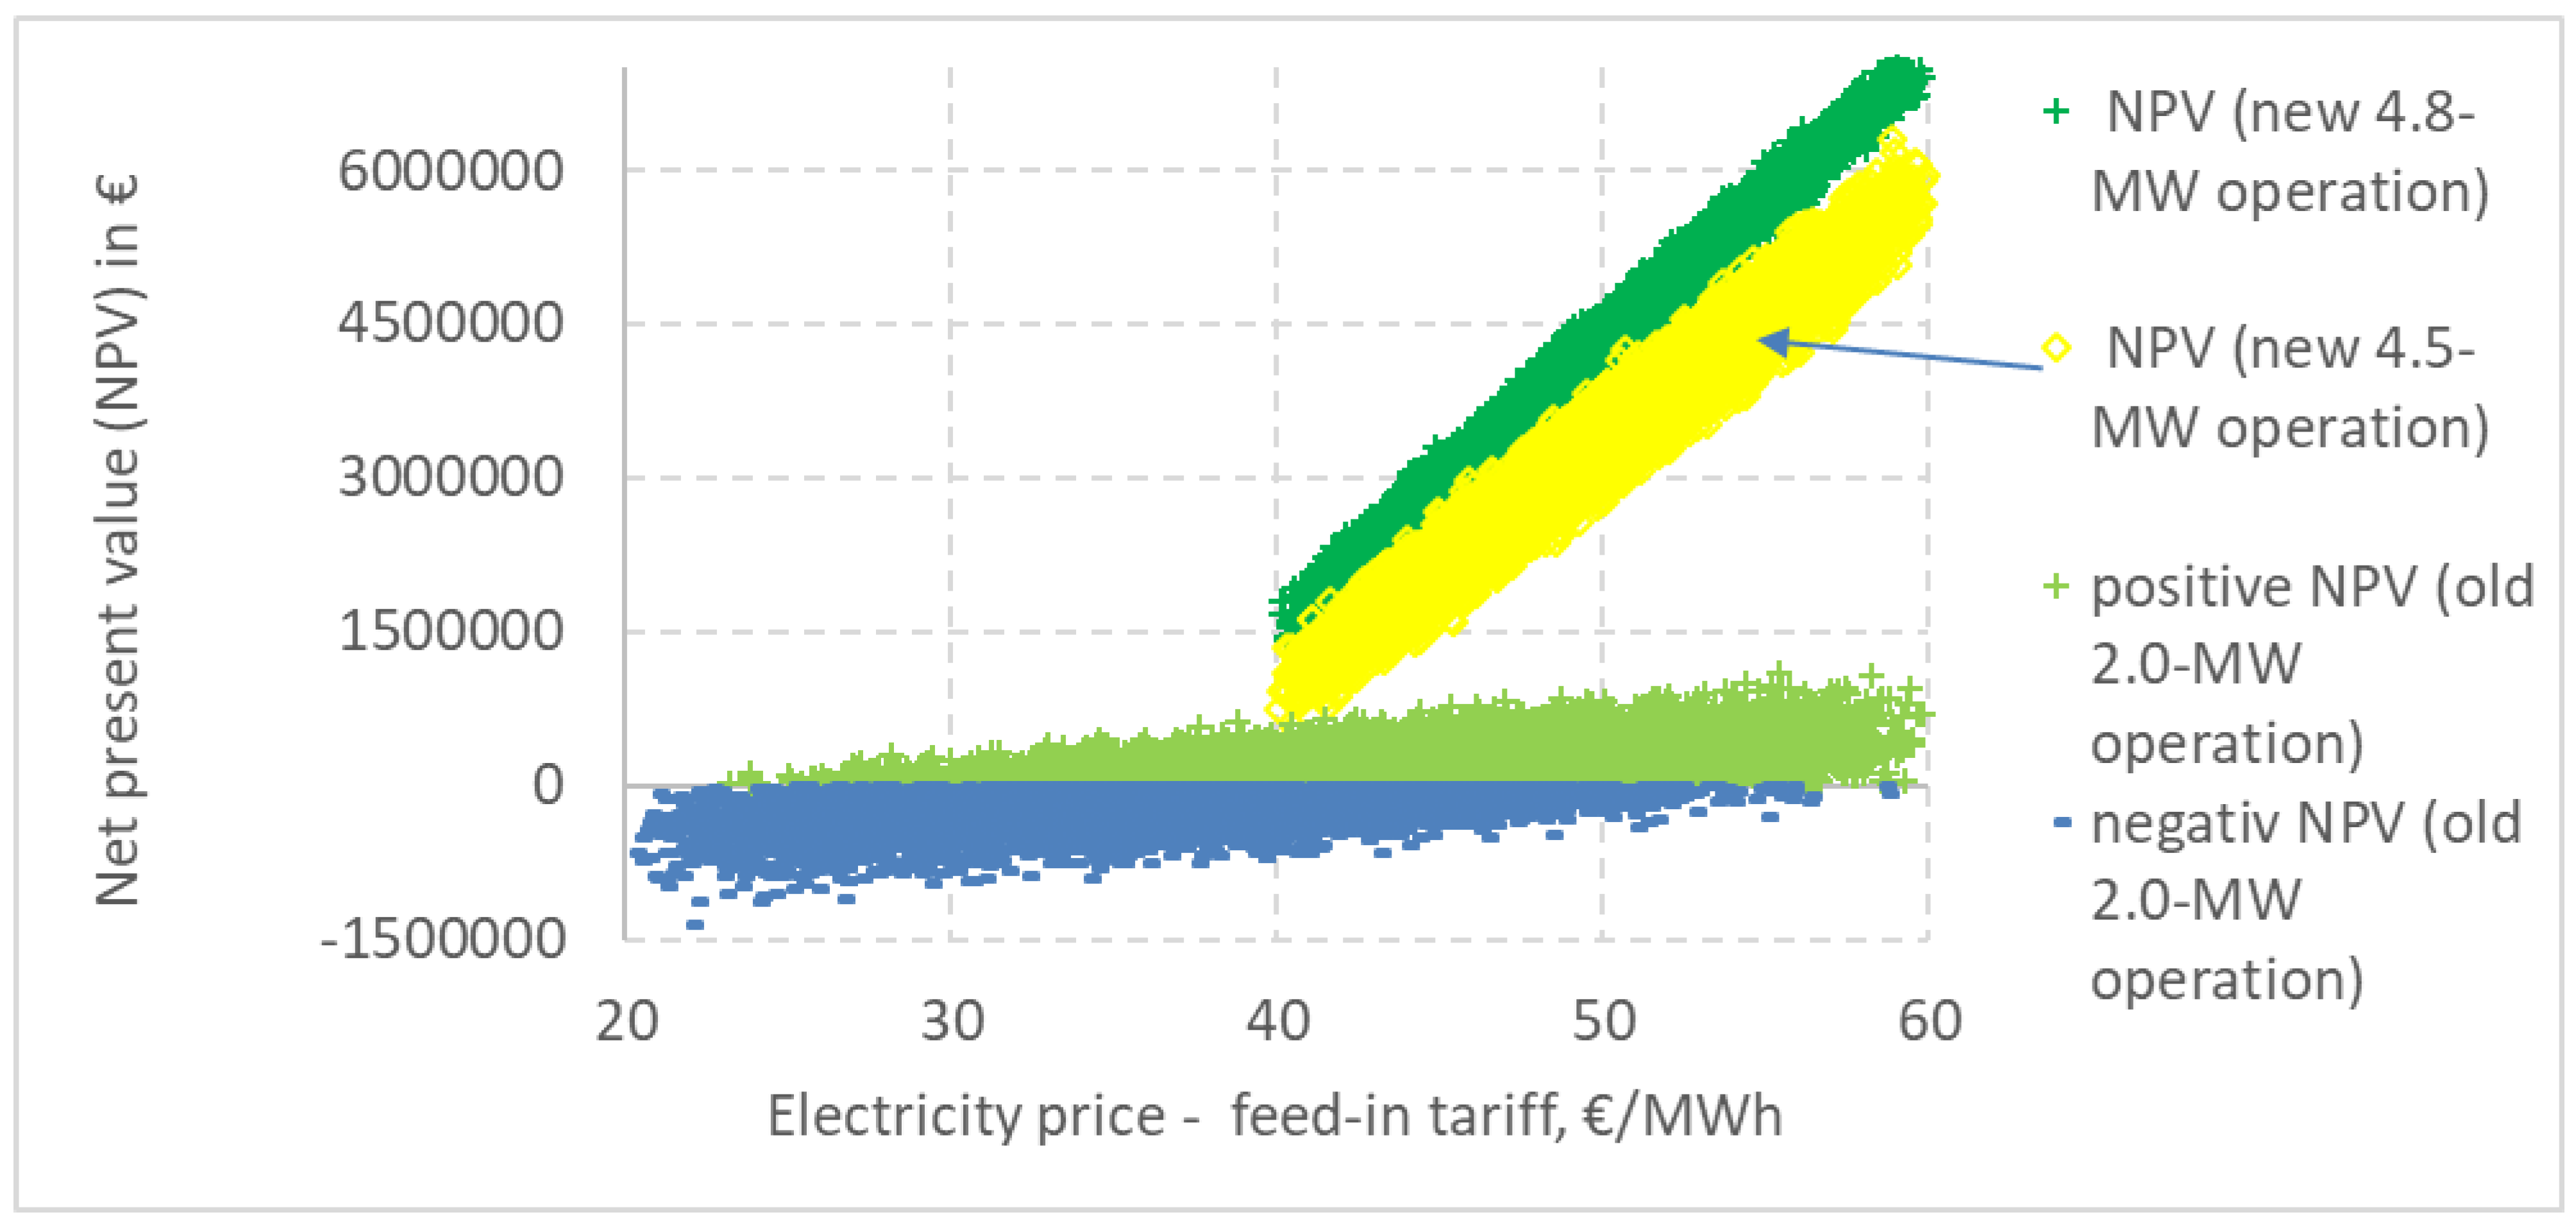
The results of the stochastic simulation can also be analysed in terms of which bid value an investor should not fall below, if a minimum value for the net present value (NPV) is to be achieved (Figure 10). The recommendation is that old wind turbines (older than 20 years) should continue to be operated as long as there is no building permit for the repowering and as long as they still generate positive gross margins (i.e., if the repair costs do not increase sharply). Otherwise, repowering the existing system is the more advantageous alternative.

4. Conclusions

Worldwide, wind farms play a major role in the energy transition away from fossil fuels and towards renewable energies. Germany ranks third, worldwide, in terms of cumulative electrical output from wind farms. This high level of around 30,000 wind turbines has been achieved primarily through a subsidy with high feed-in tariffs, which are stable for each plant over a period of 20 years. Of the approximately 30,000 onshore wind turbines in Germany, approximately 10,000 of them will fall out of the window of guaranteed high feed-in tariffs in the next one to two years.
There are basically two alternatives for these wind turbines: either continued operations with the sale of electricity at relatively low and fluctuating electricity stock prices, or repowering. Repowering, in turn, opens access to the fixed EEG feed-in tariffs for another 20 years. However, repowering has the disadvantage that a new approval process must be carried out and that the investor has to participate in a tender. There is no guarantee that a building permit will be granted and an economic operation also depends on the fact that one can win a contract without the submitted price being set too low.
The illustrated example is a wind farm in Mecklenburg-Western Pomerania, which was analysed economically. An investment into new, more efficient, and larger wind turbines currently promises a high return. The profitability of the investment in the wind turbines was determined using the net present value (NPV) method. In addition, a risk analysis was carried out by using stochastic simulation. At the beginning of the 2020s, the further expansion of wind energy in Germany stalled, due to a lack of building permits. Therefore, the guaranteed feed-in tariff—62 €/MWh of electricity—is relatively high. From this point of view, the continued operation of the old wind turbines would only be necessary if no planning permission was granted for the new wind turbines and as long as positive gross margins can be achieved. The risk of negative gross margins, even for old wind turbines with no further depreciation, could exist if high maintenance and repair costs occur along with low electricity revenues. The economic viability of repowering depends, to a large extent, on the feed-in tariff; although the investment would still be profitable even if the minimum price was assumed to be 40 €/MWh.

Author Contributions

Conceptualization, M.V., C.F.; methodology, C.F.; software, EXCEL, @RISK; validation, J.K., M.V. and C.F.; formal analysis, C.F.; investigation, M.V.; resources, M.V.; data curation, M.V.; writing—original draft preparation, M.V.; writing—review and editing, C.F.; visualization, M.V. and C.F.; supervision, J.K.; project administration, C.F. All authors have read and agreed to the published version of the manuscript.

Funding

This research received no external funding.

Conflicts of Interest

The authors declare no conflict of interest.

References

  1. Bundesministerium für Umwelt, Naturschutz und nukleare Sicherheit (BMU). Klimaschutzplan 2050—Klimapolitische Ziele und Grundsätze der Bundesregierung, 2nd ed.; Bundesministerium für Umwelt, Naturschutz und nukleare Sicherheit (BMU): Berlin, Germany, 2019. [Google Scholar]
  2. Bundesamt für Justiz. Erneuerbare-Energien-Gesetz (EEG); vom 21. Juli 2014 (BGBl. I S. 1066), zuletzt geändert durch Artikel 1 des Gesetzes vom 25. Mai 2020 (BGBl. I S. 1070); Bundesamt für Justiz: Bonn, Germany, 2020. [Google Scholar]
  3. AG Energiebilanzen e.V. Bruttostromerzeugung in Deutschland nach Energieträgern 1990–2019. Available online: https://www.ag-energiebilanzen.de/ (accessed on 3 January 2020).
  4. Anonymous. Windenergie Weltweit; Statista: ‎Hamburg, Germany, 2020; Available online: https://de.statista.com/statistik/studie/id/22071/dokument/windenergie-weltweit-statista-dossier/ (accessed on 10 June 2020).
  5. Anonymous. Onshore-Windenergie in Deutschland; Statista: ‎Hamburg, Germany, 2019; Available online: https://de.statista.com/statistik/studie/id/6462/dokument/windenergie-in-deutschland-statista-dossier/ (accessed on 10 June 2020).
  6. Zeit online Ausbau von Windrädern stockt- Bundesregierung am Zug. Available online: https://www.zeit.de/news/2019-10/22/ausbau-von-windraedern-an-land-eingebrochen (accessed on 21 April 2020).
  7. Madlener, R.; Schumacher, M. Ökonomische Bewertung des Repowering von Onshore- Windenergieanlagen in Deutschland. Zeitschrift für Energiewirtschaf 2011, 35, 297–320. [Google Scholar] [CrossRef]
  8. Deutscher Wetterdienst (DWD). Available online: https://www.dwd.de/DE/Home/home_node.html (accessed on 8 July 2019).
  9. I17-Wind GmbH & Co.KG. Gutachten “Masterplan Entwurf_2” (für spezifischen Windpark); I17-Wind GmbH & Co.KG: Friedrichstadt, Germany, 2018. [Google Scholar]
  10. Konstantin, P. Praxisbuch Energiewirtschaft- Energieumwandlung,-Transport und -Beschaffung im Liberalisierten Markt, 3rd ed.; Springer: Stuttgart, Germany, 2013. [Google Scholar]
  11. The Windpower-Wind Energy Market Intelligence. Hauptdaten der V80/2000. Available online: https://www.thewindpower.net/turbine_de_30_vestas_v80-2000.php (accessed on 20 August 2019).
  12. Vestas V80-2.0. Available online: https://www.wind-turbine-models.com/turbines/19-vestas-v80-2.0 (accessed on 20 August 2019).
  13. Vestas V90. Available online: https://www.wind-turbine-models.com/turbines/16-vestas-v90 (accessed on 20 August 2019).
  14. Nordex N149/4.0-4.5. Available online: https://www.wind-turbine-models.com/turbines/1705-nordex-n149-4.0-4.5 (accessed on 20 August 2019).
  15. Nordex N133/4800 Delta. Available online: https://www.wind-turbine-models.com/turbines/1831-nordex-n133-4800-delta (accessed on 20 August 2019).
  16. Hau, E. Windkraftanlagen: Grundlagen, Technik, Einsatz, Wirtschaftlichkeit, 6th ed.; Springer: Berlin/Heidelberg, Germany, 2016. [Google Scholar]
  17. Bundesamt für Justiz. Gesetz zum Schutz vor schädlichen Umwelteinwirkungen durch Luftverunreinigungen, Geräusche, Erschütterungen und ähnliche Vorgänge (Bundes-Immissionsschutzgesetz—BImSchG); In der Fassung der Bekanntmachung vom 17. Mai 2013 (BGBl. I S. 1274), zuletzt geändert durch Artikel 1 des Gesetzes vom 8. April 2019 (BGBl. I S. 432); Bundesamt für Justiz: Bonn, Germany, 2019. [Google Scholar]
  18. Fachagentur Windenergie an Land. Dauer und Kosten des Planungs- und Genehmigungsprozesses von Windenergieanlagen an Land; Fachagentur Windenergie an Land: Berlin, Germany, 2015; Available online: https://www.fachagentur-windenergie.de/fileadmin/files/Veroeffentlichungen/FA-Wind_Analyse_Dauer_und_Kosten_Windenergieprojektierung_01-2015.pdf (accessed on 10 June 2020).
  19. Ministerium für Energie, Infrastruktur und Landesentwicklung. Landesraumentwicklungsprogramm Mecklenburg-Vorpommern; Mecklenburg-Vorpommern: Schwerin, Germany, 2016. [Google Scholar]
  20. Bundesnetzagentur. Beendete Ausschreibungen -Ausschreibungen 2019- Ergebnisse der Ausschreibungsrunden für Windenergie-Anlagen an Land 2019. Available online: https://www.bundesnetzagentur.de/DE/Sachgebiete/ElektrizitaetundGas/Unternehmen_Institutionen/Ausschreibungen/Wind_Onshore/BeendeteAusschreibungen/BeendeteAusschreibungen_node.html (accessed on 2 January 2020).
  21. Kaltschmitt, M.; Schlüter, M.; Schulz, D.; Skiba, M.; Özdirik, B. Erneuerbare Energien—Systemtechnik, Wirtschaftlichkeit, Umweltaspekte, 5th ed.; Kaltschmitt, M., Streicher, W., Wiese, A., Eds.; Springer: Hamburg, Germany; Innsbruck, Austria; Frankfurt, Germany; Berlin/Heidelberg, Germany, 2012. [Google Scholar]
  22. Paschotta, R. Repowering. Available online: https://www.energie-lexikon.info/repowering.html (accessed on 12 November 2019).
  23. Arnold, T. How Net Present Value Is Implemented. In A Pragmatic Guide to Real Options; Palgrave Macmillan: New York, NY, USA, 2014. [Google Scholar]
  24. Deutsche Bundesbank. Entwicklung des Kapitalmarktzinssatzes in Deutschland in den Jahren 1975 bis 2018. Statista: ‎Hamburg, Germany; Available online: https://de.statista.com/statistik/daten/studie/201419/umfrage/entwicklung-des-kapitalmarktzinssatzes-in-deutschland/ (accessed on 13 July 2019).
  25. Deutscher Bundestag. Kontrolle und Entsorgung von Windkrafträdern. Antwort der Bundesregierung auf die Kleine Anfrage der Abgeordneten Oliver Luksic, Karlheinz Busen, Frank Sitta, weiterer Abgeordneter und der Fraktion der FDP – Drucksache 19/3619. Available online: http://dipbt.bundestag.de/dip21/btd/19/038/1903835.pdf (accessed on 1 June 2020).
  26. Breitkopf, A. Strombörse—Preisentwicklung am EPEX-Spotmarkt bis Oktober 2019. 4 November 2019. Available online: https://de.statista.com/statistik/daten/studie/289437/umfrage/strompreis-am-epex-spotmarkt/ (accessed on 12 December 2019).
  27. Fuchs, C.; Marquardt, K.; Kasten, J.; Skau, K. Wind Turbines on German Farms—An Economic Analysis. Energies 2019, 12, 1587. [Google Scholar] [CrossRef] [Green Version]
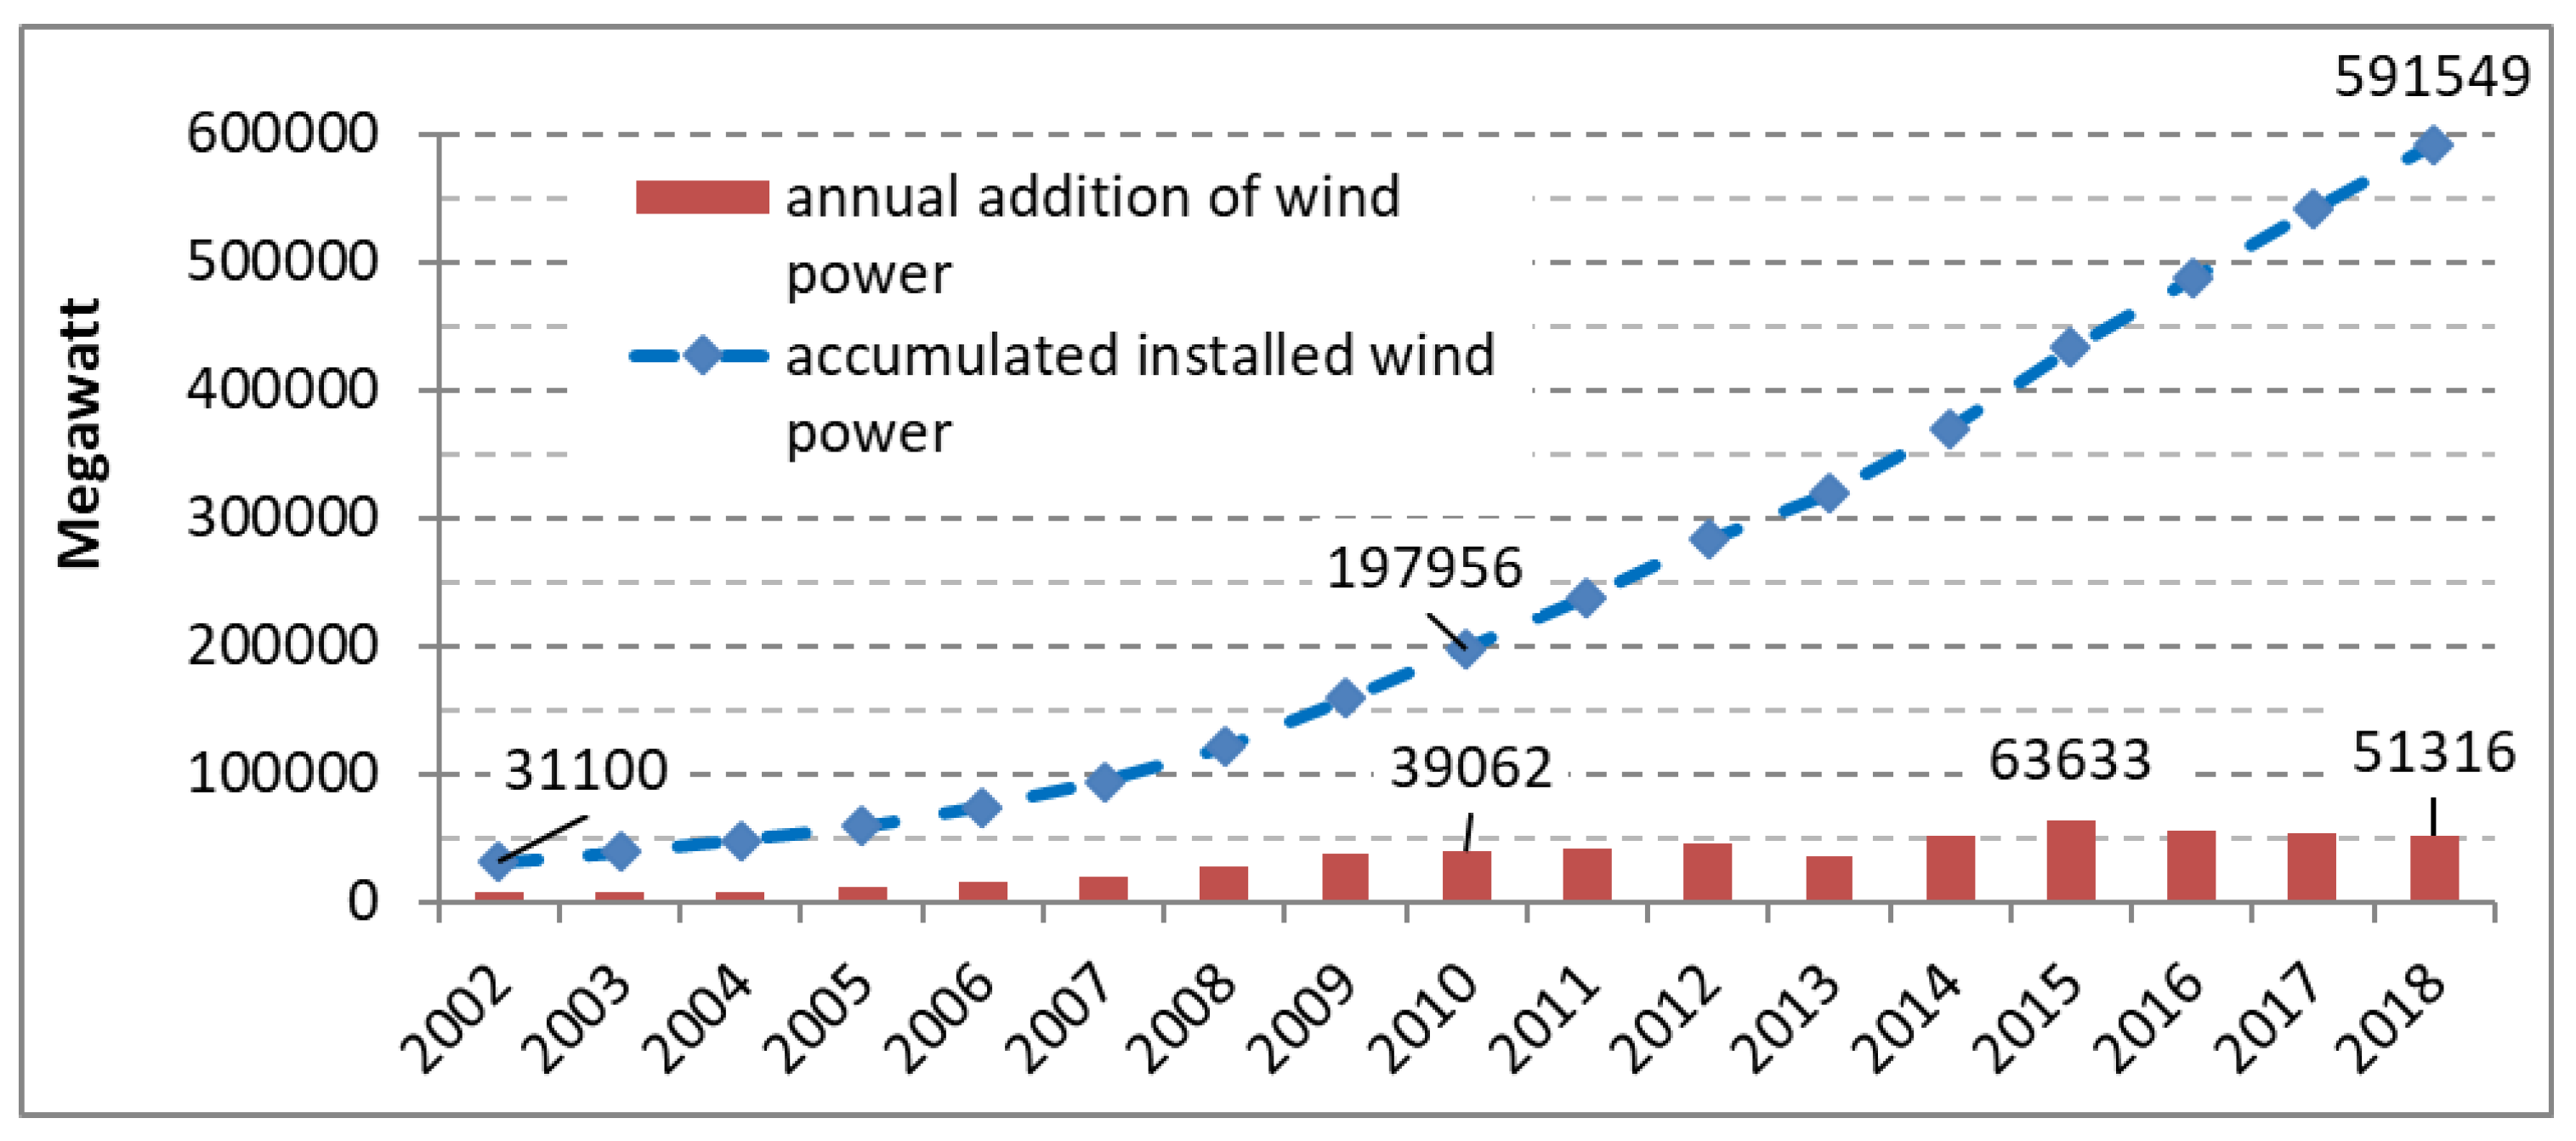
Figure 1. Worldwide cumulative installed wind energy output and annual output increase (in megawatts) from 2002–2018 [4], own illustration.
Energies 13 03048 g001
Figure 2. Most important countries by share of the worldwide installed onshore wind energy output (cumulative) in 2018 [4].
Energies 13 03048 g002
Figure 3. Most important countries in Europe, according to the amount of electricity generated from wind energy in 2018 (in terawatt hours) [5].
Energies 13 03048 g003
Figure 4. Number of onshore wind turbines, the cumulative nominal power, and annual additions of wind turbines in Germany from 2000 to 2018 [5], own illustration.
Energies 13 03048 g004
Figure 5. Performance curve as a Weibull distribution (according to [10]) of the old wind turbine (V80) and the new system (N133). Source: Own illustration.
Energies 13 03048 g005
Figure 6. Upper limit and additional amount in the network expansion area in Germany at the bidding dates according to the Renewable Energy Sources Act (EEG) 2017 (in kW) [20], own presentation.
Energies 13 03048 g006
Figure 7. Tender volume (in kW, left Y-axis) and permissible maximum values for remuneration (in €/MWh, right y-axis) in Germany at the auction dates, according to the EEG 2017; as well as exchange price on the European Power Exchange (EPEX) spot market for Germany/Luxembourg from February 2019 to February 2020 [20], own illustration.
Energies 13 03048 g007
Figure 8. Distribution of the net present value (NPV) for three wind turbines with variable remuneration, operating costs, dismantling costs, and lease rate; stochastic simulation with 10,000 repetitions with @RISK; (Range 5%–95%). Source: own calculations.
Energies 13 03048 g008
Figure 9. Tornado diagram with the relevance of the most important factors influencing the net present value (NPV) of a 4.8 MW wind turbine plant; stochastic simulation with 10,000 repetitions with @RISK. Source: own calculations.
Energies 13 03048 g009
Figure 10. Net present value (NPV), depending on the feed-in tariff and other influencing parameters (see Table 4); stochastic simulation with 10,000 repetitions with @RISK. Source: own calculations.
Energies 13 03048 g010
Table 1. Technical data of the old wind turbine (commissioned in 2001) and the new wind turbines.
Key FigureUnitOld Wind TurbineNew Wind Turbines
Type/kW-V80/2000N149/4500N133/4800
Manufacturer-VestasNordex
InstallationJahr2001New
Tower heightm78105/125/16478/83/110
Performance Characteristics
Rated capacitykW200045004800
Power regulation-PitchPitchPitch
Switch-on speedm/s3.533
Nominal wind speedm/s14.511.5
Shutdown speedm/s252020
Power densitym2/kW2.523.92.9
Rotor
Rotor diameterm80149.1133.2
Number of blades-333
Swept aream2502717,46013,935
Variable speedU/min9–196.4–12.36.9–13.9
Transmission
Type-spur/planetaryplanetaryplanetary-spur gear
Generator
Type-AsynchronousDouble Fed inductionDouble Fed Asyn
Nominal voltageV690660690
Maximal generator speedU/min19091420
Source: [10,11,12,13,14,15].
Table 2. Exemplary representation of the investment costs for the new wind turbines with connection to the high-voltage grid.
Key FigureCost Range in €/kWAverage Specific Costs in €/kWin %Costs in 000 € *
Size/type 4.5 MW4.8 MW
Acquisition costs of site rights50100755.64337.5360
Project development2050695.19310.5331.2
Wind turbine including transport and construction9001100100075.2445004800
Technical infrastructure
Foundations4060503.76225240
Paths and parking space1020151.1367.572
Internal wiring1020151.1367.572
Grid connection4060503.76225240
Total technical infrastructure1001601309.78585624
Other costs
Construction management5107.50.5633.7536
Compensatory measures153022.51.69101.25108
Reserve2030251.88112.5120
Total other costs4070554.14247.5264
Technical investment costs111014801329100%
Total investment costs 5980.56379.2
* Source: [16], own illustration.
Table 3. Annual operating costs of the old wind turbine and the alternative new wind turbines.
Key FigurePercentage of the Ex-Factory Price *Mean (%)Proportional Costs (in €) for a 2.0 MW OperationProportional Costs (in €) for a 4.5 MW OperationProportional Costs (in €) for a 4.8 MW Operation
Maintenance contract0.70.90.8016,00036,00038,400
Repair reserves0.51.00.7515,00033,75036,000
Insurance0.50.60.5511,00024,75026,400
Technical supervision and management0.50.60.5511,00024,75026,400
Other (including electricity, maintenance)0.81.00.918,00040,50043,200
Total annual operating costs34.23.671,000 **159,750170,400
Opportunity costs for the lease of the locationShare of lease of electricity revenue Annual lease (€ per location)
4%10%7%10,75248,89951,154
Total 81,752208,649221,554
* The specified fluctuation ranges are used in the stochastic simulation (Section 3.2). ** Is changed by a factor of 1 to 3 in the risk analysis. Source: [16], own illustration.
Table 4. Net present value (NPV) for three wind turbines with variable remuneration, operating costs, dismantling costs, and leasing rate; stochastic simulation with 10,000 repetitions.
Key FigureOld Operation (2.0 MW)New 4.5 MW OperationNew 4.8 MW Operation
Input: Risk Parameters (Triangular Distribution with Minimum—Median—Maximum Value)
Feed-in tariffs20—35—60 €/MWh40—50—60 €/MWh
Operating costs *Factor 1—2—33%—3.6%—4.2% from factory price
Remaining service life5—7.5—10 years20 years (fix)
Dismantling costs-100 T€—300 T€—500 T€
Lease rate4%—7%—10% of yearly electricity revenues
Result: Net Present Value (NPV)
Minimum (5%-Limit)−533,372 €1,634,061 €2,374,956 €
Average−10,305 €3,360,819 €4,314,152 €
Maximum (95%-Limit)505,066 €5,103,302 €6,247,754 €
* See Table 3 for fluctuations in operating costs; stochastic simulation with 10,000 repetitions with @RISK. Source: own calculations.