Article

An Ex-Post Assessment of RES-E Support in Greece by Investigating the Monetary Flows and the Causal Relationships in the Electricity Market

Technoeconomics of Energy Systems lab (TEESlab), Department of Industrial Management and Technology, University of Piraeus, Karaoli & Dimitriou 80, 18534 Piraeus, Greece
*
Author to whom correspondence should be addressed.
Energies 2020, 13(17), 4575; https://doi.org/10.3390/en13174575
Submission received: 15 July 2020 / Revised: 9 August 2020 / Accepted: 27 August 2020 / Published: 3 September 2020
(This article belongs to the Special Issue European Energy Policy at a Crossroads)

Abstract

:
One way to perceive the electricity market is as a network of actors connected through transactions and monetary flows. By exploring the monetary flows in the electricity market, one adopts a holistic view which can provide insights on the interactions between different components of the benefits and costs, as well as on the possible conflicts or alliances between the involved actors of the system. The importance of such an analysis becomes even more evident when considering if the system’s state would change due to either the effectuation of a policy measure or a shift in the external drivers of the system. Additionally, by identifying conditions of conflicting interests between the involved actors, one can devise a roadmap of least-resistance for a policy measure to attain its goals. Our work is based on the premise that understanding and quantifying the monetary flows in the electricity market can contribute to the efficiency assessment of policy interventions in the market. We present a structured analytical framework and the results of a quantitative analysis, based on available public domain data, for the identification of the main drivers and interactions that governed the major monetary flows in the Greek wholesale electricity market, from 2009 to 2013 and the ex-post assessment of the market impact of the feed-in-tariffs scheme that was in place during this period.

1. Introduction

To achieve the climate goals identified by the Paris Agreement, the energy sector needs to maintain efforts towards a zero-carbon, sustainable electricity system by 2050 [1,2]. Renewable energy sources (RES) are significant contributors to this goal [3,4]. Although RES were not market competitive at first [5], electricity generation from RES (RES-E) has been growing rapidly over the last years, owing to economies of scale, technological progress and financial-support mechanisms [6]. One of the most utilized RES-E support mechanism has been the feed-in-tariffs (FiTs) scheme, providing security and high profits to investors [7,8]. Many European Union (EU) member states, as France, Germany, Italy and Spain, have adopted FiTs, which proved to be the main driver for the drastically increased RES installed capacity during the period 2008 to 2015 [9,10,11,12]. However, despite the large growth, in many cases, policymakers failed to respond in a decisive manner to the negative implications of the scheme [13], as indicated by several examples across Europe [14,15,16,17].
Although FiTs have rapidly been adopted to incentivize RES investments, the scheme has been gradually decreasing—or has even ceased—and, thus, sustaining the growth of new RES installations has been challenging ever since. Although financial support is of substantial importance to incentivize new RES investments, it has to be designed with the aim of avoiding public deficits or burdening costs for consumers. Introduction of closer-to-market oriented policies that compensate consumers with real-time electricity prices may be the way forward [13]. Aiming at overcoming the difficulties encountered in the post-FiTs era, policymakers seek new legal mechanisms that combine tax benefits and other incentives; net-metering (NEM), feed-in-premiums (FiPs) and tenders are considered such mechanisms, that could, once more, trigger consumer interest in investing [18]. For the time being, though, these mechanisms should be mainly considered as transition policies from FiTs towards self-consumption schemes closer to the market, that eliminate aspects of subsidization and implement more advanced market rules (i.e., dynamic cost-reflective pricing) [19,20].
Increased RES deployment due to generous schemes as FiTs, has sparked debates across Europe regarding the effects of the enhanced RES integration on the performance of the energy market [21]. This debate challenges the premise that higher volumes of RES can enter every year the EU internal market and be absorbed progressively by existing mechanisms. However, while most studies so far have focused on a technoeconomic analysis of the regulatory design and efficiency of the different RES-E support mechanisms [22,23,24,25], there is a knowledge gap on the impact of such mechanisms on the performance of the energy market and its interaction with the RES-E sector. Despite the learning progress of the past years, thus, important regulatory questions remain still unanswered, with the long-term relationship between RES-E and conventional markets remaining ambiguous, mainly owing to two structural changes, as also depicted in Figure 1 [26]:
  • The intermittency in the RES-E generation requires now more challenging conventional generation capacity services to the market, while these services need to be reduced in order to achieve decarbonization targets;
  • The day-ahead electricity price declines reaching a zero value, to become equal to the marginal and opportunity costs of large RES-E integration, while there is going to be a higher variation of daily average prices.
Increasing RES shares bring new dynamics to the current fossil-based energy systems, which makes the decision-making process about the energy future more complex. Policymakers face the challenge of making decisions about technologies, spatial requirements, democratization, and other aspects of unfamiliar RES-dominated energy systems, like for example, balancing interests of involved actors in policy design towards the decarbonization of the energy system [27,28]. To date, studies suggest that RES and conventional generators, operate within the same market, but with very different business models, as a market operating only with RES would be a market with zero marginal and opportunity costs that compensates agents through subsidies [29], while the thermal market is based on bidding competition, as well as fuel and electricity spread risk. As a result, the existing market mechanisms may not be the ones that can effectively support the evolution of these two “worlds.” In view of a high-RES market design in line with the EU target electricity model, thus, regulatory efforts need to expand their approach to carefully: (a) review how the energy market performance is affected by the different support mechanisms both in the short- and the long-term, as well as, (b) assess past and/or modern mechanisms to optimize market performance in both time horizons. However, the outcomes of policy mechanisms depend on more than variables such as price and quantity; they depend on institutions that may be part of the environment surrounding a policy [30]. As a result, a structured approach, aiming at facilitating the systematic exploration of the effect that policy measures have on the electricity system and its components, and filling knowledge gaps, either in a national or in an EU level, is of paramount importance.
This article sheds light on the debate regarding the competition between conventional and RES-E generation, as well as, the role that RES-E remuneration played in this debate, by perceiving the electricity market as a network of actors connected through transactions and monetary flows. In particular, our work builds on the premise that understanding and quantifying the major monetary flows in the electricity market can contribute to the efficiency assessment of policy interventions, and that assessing how a policy measure affects the performance of the energy market requires the quantification of both the benefits and the costs attributed to it. To do so, we developed and applied an analytical framework based on daily and monthly public domain data, to identify and present the main drivers and interactions that governed the major monetary flows and causal relationships within the Greek wholesale electricity market during the period of 2009–2013. This was the period that the FiTs support measure contributed to a remarkable RES boom in the country, which was then suspended by institutional and legislative failures, combined with an adverse fiscal environment. The latter resulted to a stagnation of the RES market to this day and a gradual phase-out of the FiTs scheme [31].
Literature studies have already assessed the effects of the FiTs legislation in Greece upon the resulting RES penetration and investments (see e.g., [25,32]), addressing also the influence of the imposed retroactive reduction on the profitability of RES systems to their owners [33], and the resulting surcharge on the electricity prices owing to the massive photovoltaics (PV) penetration achieved [34]. However, while a literature consensus providing an account of the scheme’s profitability, mainly through a technoeconomic spectrum, has already been established, there is still a knowledge gap on how the scheme affected the structure and the performance of the electricity market, as also highlighted in recent scientific literature [35]. Our work addresses this gap by composing an analytical framework, which based on the identification of the major monetary flows in the Greek electricity market, allows for adopting a holistic view on the interactions between different components of the benefits and costs, as well as on the possible conflicts or alliances between the involved actors of the system. Consequently, short- (i.e., impact on the amount of incentivized production or total production) and long-run (i.e., impact on the installed capacity) effects of the FiTs scheme are able to be captured. This is further facilitated by the use of daily and monthly public domain data, which, by providing a larger number of observations compared to annual data, allows the analysis of the impact of the scheme on multiple electricity generation sources. The latter provides more refined results compared to typical approaches exploring interactions between RES and conventional generation sources in an aggregated way [36].
Furthermore, one of the main priorities of the recently revised National Energy and Climate Plan (NECP) in Greece is the goal for phasing out all lignite-fired power plants by 2028 [37], a critical objective of the European Green Deal [38], and in line with the EU’s commitment to global climate action in the context of the Paris Agreement and climate neutrality by 2050 [39,40]. In view of a market design that foresees sector coupling and the development of a single electricity market in Europe, the focal point of the national energy transition is the formulation of a new electricity mix that will be based on the integration of high shares of RES. In order for this transition to happen in a fair and socially just manner, with “no one being left behind”, it is important to ensure that the regulatory environment adapts to the new situation, to avoid legislative failures of the past. By identifying conditions of conflicting interests between the involved market actors, thus, our framework can further support policymakers towards the development of a roadmap of least resistance for a policy measure to attain its goals, without compromising, in parallel, the further development of electricity generation sources. The novelty of this approach becomes more evident when considering if the system’s state would change due to either the effectuation of a policy measure or a shift in the external drivers of the system. As a result, our work can trigger wave of research and denote structural and regulatory adaptations and adjustments needed towards the achievement of the national decarbonization targets.
The remainder of this study is organized as follows: Section 2 explains the analytical framework of our work. Section 3 showcases the application of our framework, using as an illustrative case study the electricity market in Greece to quantify the main benefits and costs attributed to the RES-E generation achieved from the FiTs scheme during the period 2009 to 2013. Section 4 presents and discusses the results of the study, while Section 5 provides conclusions of our study and reports key implications for market and industry professionals, consultants in the policy community and government officials.

2. Materials and Methods

Our analytical framework comprises of the following main methodological steps.

2.1. Step 1: Identifying the Relevant Monetary Flows

As a first step, we map the relevant monetary flows and the respective causal relationships in the electricity market under study, based on domain knowledge, literature review and tacit knowledge embedded in stakeholders.

2.2. Step 2: Quantifying Costs and Benefits from RES-E Generation

As a next step, we consider the main costs and benefits of RES-E generation. In our framework cost and benefits are modeled as:
  • Costs: Fiscal support of RES-E generation. Taxes are not considered. The levy often paid by RES-E generators to the local municipalities is omitted, as it has only a distributional effect.
  • Benefits: Substitution of the fossil-fueled generation by RES-E could be quantified by the induced reduction in the wholesale day-ahead electricity price or in the use of fossil-fuels. To omit transfer payments, we check if there is any energy consumption or savings, e.g., regarding fossil-fuel use or the net impact on public expenditures.
    To quantify the benefits attributed to RES-E the following sub-steps are implemented:
    • Estimating the mix of the conventional power generation that is substituted by RES-E generation, and
    • Estimating the capacity value of RES-E, while keeping the electricity system’s reliability at a designated level.
Note that balancing costs that derive from uncertainties of short-term forecasting of RES-E production are not taken into consideration, while the decrease in capacity payments because of the capacity value of RES-E generators is considered as benefit.

2.2.1. Sub-Step: Estimating the Mix of the Conventional Power Generation that Is Substituted by RES-E Generation

An econometric approach often used to model the relations of the different variables that rule the electricity market is cointegration analysis (CA) and Vector error-correction modeling (VECM) [41]. CA is based on the notion that, if a steady association among a set of variables, for a sufficiently long time period, can be demonstrated, then causal interactions between these variables can be inferred. Usually in literature, CA is applied to model the wholesale spot price of electricity (and/or the system marginal price (SMP)), as a function of underlying drivers, as: (a) demand for electricity consumption; (b) RES-E generation; (c) fuel prices; and, (d) capacity availability. In this work, we apply an econometric approach that considers the volatility of RES-E generation profiles and identifies the mean capacity reduction of conventional electricity generation that is substituted by RES-E generation. In doing so, the following two points are considered:
  • Regarding the system load, increasing the RES-E generation must result in equally decreasing of the conventional generation, so that the electricity generated is always equal to demand plus total losses, and
  • Avoiding conventional electricity generation results in increasing RES-E generation, which changes under the varying marginal costs of the dispatchable electricity generation. As a result, the impact of RES-E generation differentiates according to demand levels (i.e., high or low).
Our premise is that if the average load is considered constant, fuel and electricity prices could reach to an equilibrium. For example, Jong and Schneider (2009) developed a multi-market modeling framework showing that electricity and natural gas prices are cointegrated at long-term forward price levels, since both markets are highly linked when considering physical transportation [42]. Bosco et al. (2010) examined the causal relationships affecting the wholesale electricity prices in six major European countries, revealing four highly integrated central European markets, which shared a common trend in natural gas prices [43]. Additionally, Ferkingstad et al. (2011) acknowledged the influence of gas prices on electricity prices, while coal and oil prices play a lesser role [44]. Finally, Furió and Chuliá (2012) used VECM to reveal that forward prices of crude oil and natural gas are important factors for the evolution of the forward electricity market prices.

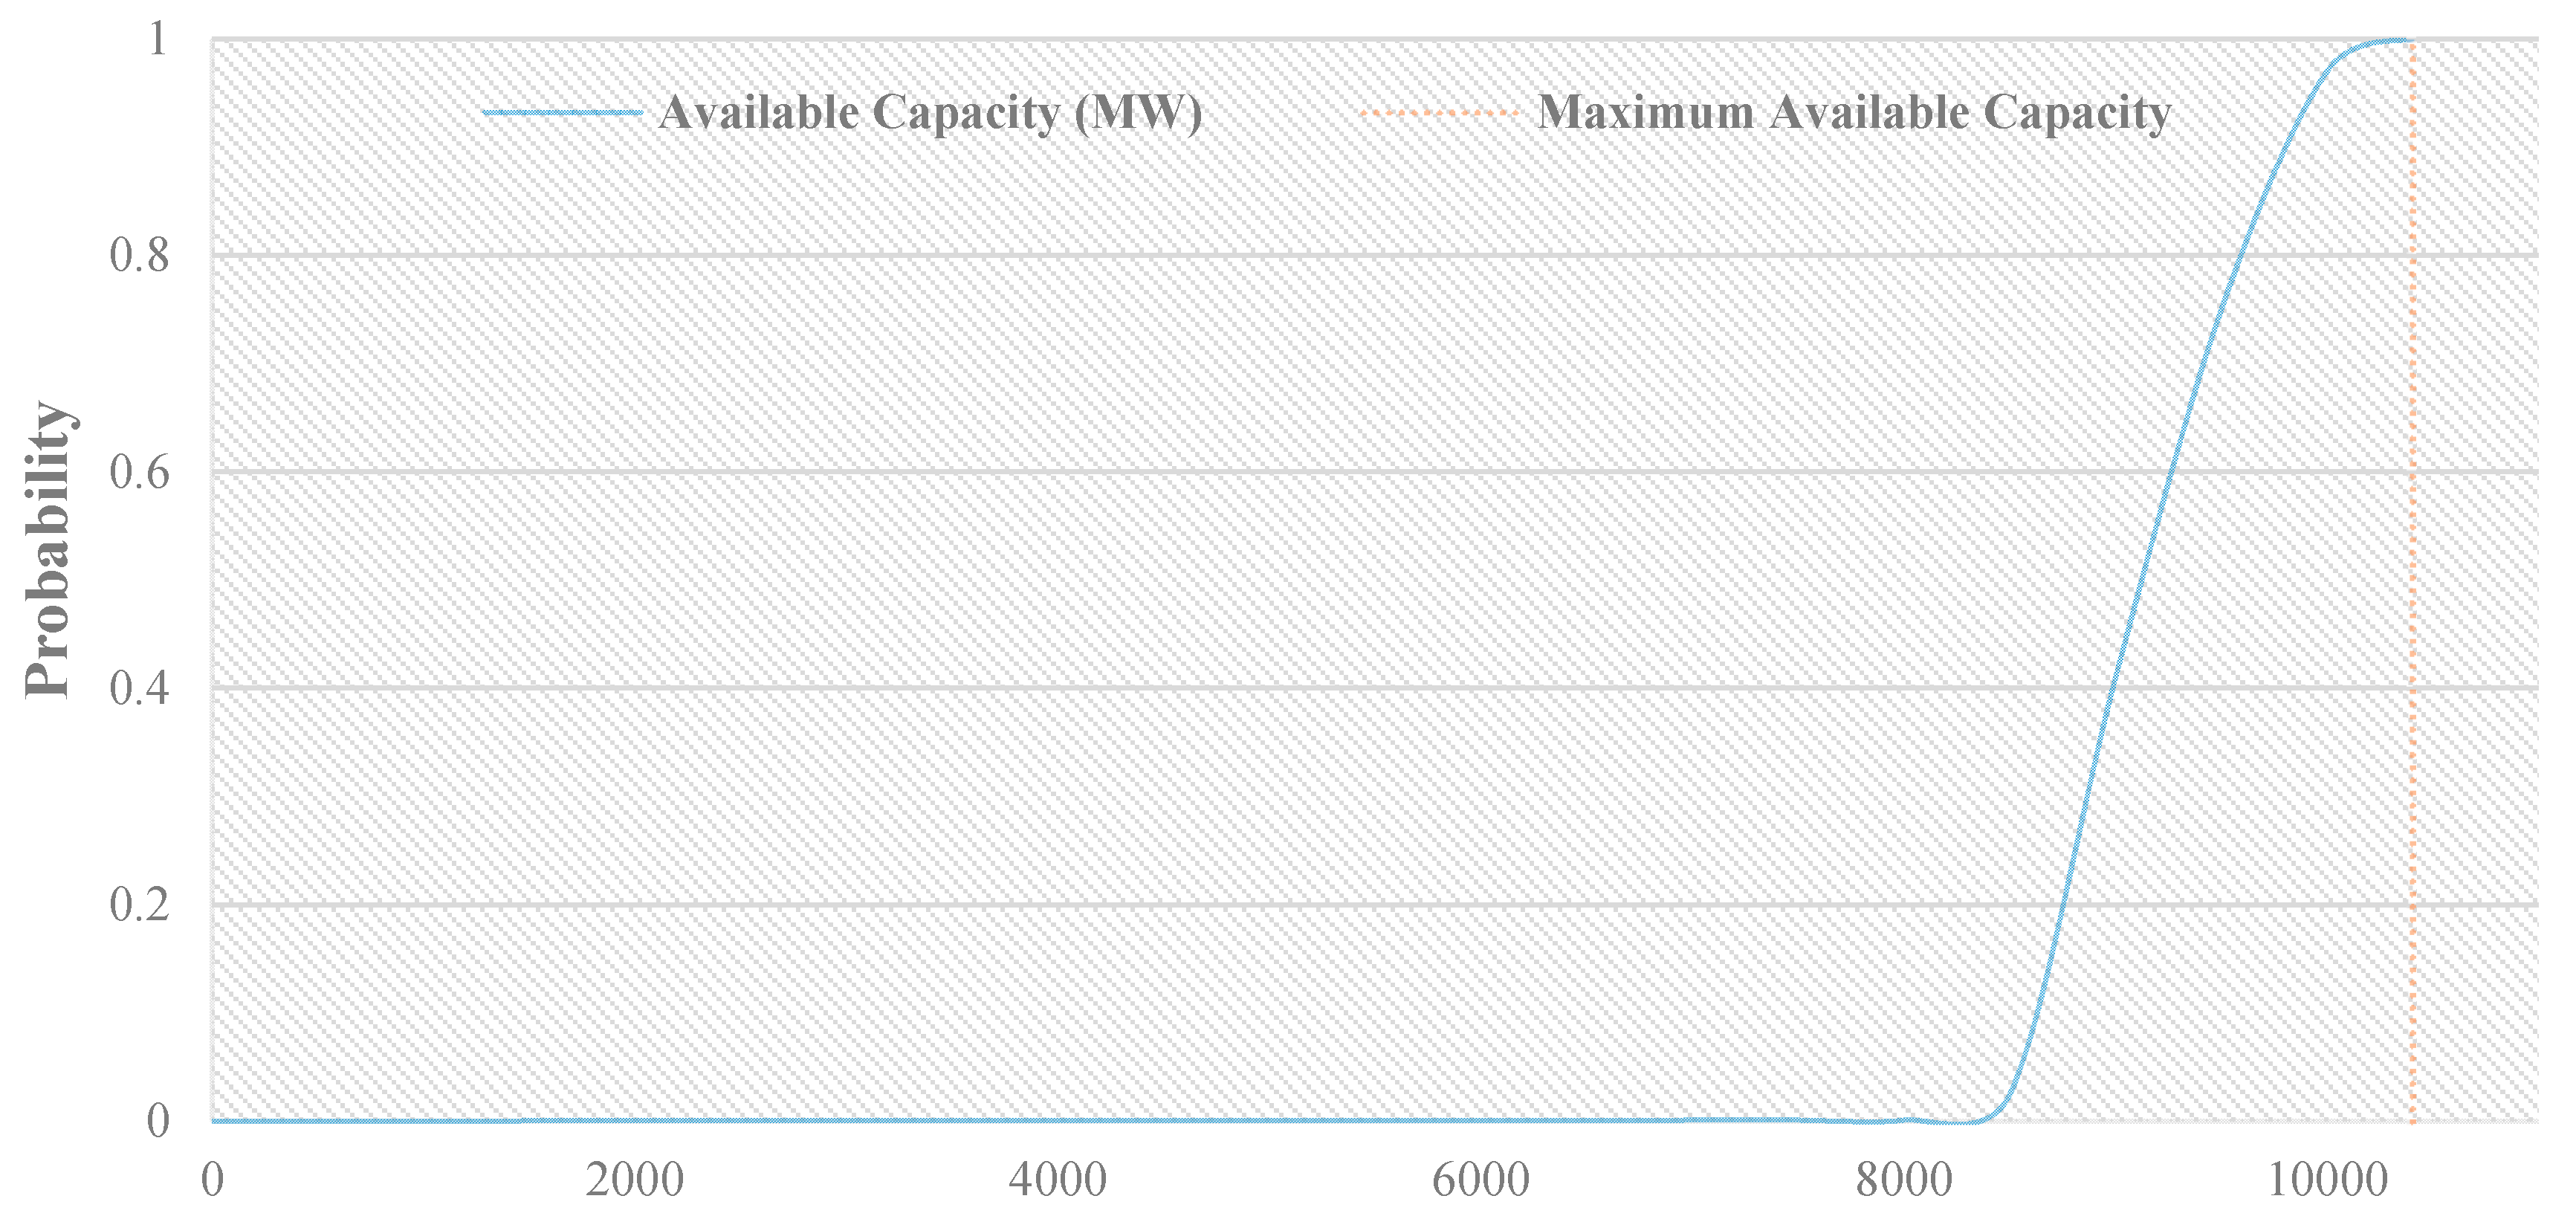
2.2.2. Sub-Step: Estimating the Capacity Value of RES-E, While Keeping the Electricity System’s Reliability in a Designated Level

Capacity values determine the contribution of generators to generation adequacy and reliability of electricity systems and can be modeled using installed capacity, capacity factor and effective load carrying capability (ELCC). Evaluating ELCC is imperative to optimize RES integration for the planning of the long-term reliability of the power system, while different kinds of uncertainty are introduced [45]. Loss of load probability (LOLP) and loss of load expectation (LOLE) are the main metrics that evaluate the generation adequacy of the power system. LOLP is defined as the probability of total load being larger than the available generation capacity at a given time, while LOLE is the cumulative time during which the available generation capacity is lower than load [46,47]. LOLP can be calculated as:
LOLP ( t ) =   Pr t ( C E <   L t )
where:
-
C E : the total available (in service) capacity of the electricity system, and
-
L t : the total load of the electricity system at time t .
The annual system LOLE of the electricity system can be expressed as:
LOLE year = t = 1 8760 Pr t {   C E < L t }
The ELCC of a generator about to be added to an existing electricity system equals to the additional load that is able to be integrated into the electricity system, without jeopardizing the desired reliability level, determined by the LOLE, before adding the generator. More specifically, assuming a LOLE index for the existing system of acceptable ranges, the concept of ELCC is represented as:
t = 1 n Pr t {   C E < L t } =   t = 1 n Pr t { ( C E + C A )   < ( L t +   Δ L ) }
where:
-
C A : the capacity of the new generator added (i.e., capacity value), and
-
Δ L : the additional load that can be integrated into the electricity system.
Finally, the capacity outage probability table (COPT) of the electricity system is calculated iteratively, adding generation units sequentially to build a matrix consisting of all the system’s possible capacity outage states, along with their respective cumulative probability [46]. Units added in the COPT are both at an operating (on) state and at a non-operating (off) state. Long-term unavailability statistics are used in order to find whether a unit is on forced outage (i.e., off state). The COPT is calculated by using a chained convolution of the binomial distributions for each unit’s on–off state:
p j ( X ) =   p j 1 ( X ) · ( 1 EFORd j ) +   p j 1 ( X   C j ) · EFORd j
where:
-
X : the outage capacity (MW);
-
p j ( X ) : the probability of outage capacity when adding the jth unit;
-
p j 1 ( X ) : the probability of outage capacity before adding the jth unit;
-
C j   : the equivalent perfectly reliable capacity of the jth unit;
-
EFORd j : the demand equivalent forced outage rate of the jth unit.

3. Application to the Electricity Market in Greece

Despite the RES boom during the period 2009 to 2013 owing to the FiTs scheme [35], the high investment costs resulted to a significant deficit to the Greek RES Special Account, which was responsible for funding the agreed contracts. Consequently, the Greek government imposed an additional tax on the consumer income from RES-E generation, simultaneously with a reduction of the tariffs, to counterbalance negative economic implications [13]. This led to a complete shutdown of the RES market, with the domestic PV market indicatively, shrinking during 2014–2017 to approximately 1% of its 2013 size [31]. Over the past three years, regulatory efforts, to reach the standards of other European markets that experienced a transition from a high FiTs status to a market-based environment, have been put in place, with a NEM scheme having been legislated [13].
Literature studies have already assessed the effects of FiTs legislation in Greece upon the resulting RES penetration and investments, addressing also the effect of the imposed retroactive reduction on the profitability of RES systems to their owners and the consequent charge on the electricity prices owing to the massive PV penetration achieved. While a literature consensus providing an account of the scheme’s profitability, mainly through a technoeconomic spectrum, has been already established, there is still a knowledge gap on how the scheme affected the structure and the performance of the energy market. In the sections below, we demonstrate the applicability of our analytical framework, as presented in Section 2, using as an illustrative case study the electricity market in Greece during the period 2009 to 2013. All the time series data and market statistics used in our study are publicly available and were acquired from the official website of the Greek Independent Power Transmission Operator (IPTO) [48].

3.1. Identifying the Relevant Monetary Flows

Within the European Commission (EC) funded Horizon 2020 (H2020) “TRANSrisk (http://transrisk-project.eu/)” project, a workshop to engage with key market stakeholders from different groups and institutions, including the Center of Renewable Energy Sources (CRES), IPTO, the Hellenic Electricity Distribution Network Operator (HEDNO) and the Greek Ministry of Environment and Energy (MEE), along with researchers and experts from private sector industries that are involved in the provision of greenhouse gas (GHG) emissions, was carried out. Building on their feedback and domain knowledge, the major monetary flows in the Greek wholesale electricity market, from 2009 to 2013, are visualized in Figure 2, if the equipment manufacturers and distributers, and the aspects of job creation and energy security, are excluded.
Over the period under study, compensation for the electricity produced from conventional generators was equal to the SMP, as derived from the day-ahead scheduling (DAS) market. During DAS, price bids made were firm, exposing generators to a penalty payment, if they did not comply with the delivery, equal to the ex-post imbalance price. IPTO was responsible for determining an ex-post system-imbalances marginal price (SIMP) in an hourly basis by executing the ex-post imbalance pricing procedure after the DAS process. This process, while comparable to DAS, used the actual demand, availability of generators and RES-E generation. Deviations in electricity generation could be either instructed (i.e., deviations of the actual from the scheduled generation), or uninstructed. Generators with positive instructed deviations were paid the equivalent SIMP, while negative deviations were charged as bid. On the other hand, positive uninstructed deviations were not paid, whereas negative and load deviations were charged the relevant SIMP. Extra payments were provided by the variable cost recovery mechanism (VCRM) so that generators ended up profitable if this was not succeeded through market revenues.
The Greek capacity adequacy mechanism supplied conventional generators with capacity payments through which they were able to accumulate a portion of their fixed costs. In particular, each generator had issued a number of Capacity Availability Tickets (CATs) for the next five reliability years, the total number of which was equal to the generator’s unit net capacity. Each CAT was valid for one reliability year, and each year IPTO, by estimating the available capacity of each generator based on its EFORd, was allocating to each CAT a capacity value equal to “1-EFORd”. Each generator could reach an agreement with IPTO to acquire a fund equivalent to the available capacity of the CAT multiplied by a noncompliance penalty value ( P NCP ), when the generator was unavailable in the DAS market. As a result, the payment that was received by a generator j was equal to [49,50]:
payment =   P NCP · ( 1 EFORd j ) 2
where P NCP was equal to 35,000 €/MW-year until 31/10/2010, and to 45,000 €/MW-year from 1/11/2010 until the end of 2013. On the other hand, remuneration of RES-E generators was paid through the Special RES Account, with its outflows being the FiTs payments and its major inflows being:
  • The payments to RES-E generators for each MWh generated at SMP, and
  • The RES-E levy paid directly by final consumers. This levy was basically the monetary difference between the tariff and SMPs, or between the tariff and the average variable costs for non-interconnected regions such as islands.
However, as FiTs were higher than SMPs, the Hellenic Operator of Electricity Market (LAGIE) at the time (reformed now into HEMO, i.e., Hellenic Electricity Market Operator S.A.), was facing a deficit that was expected to be covered by the RES-E levy, whose level was decided by the administration of the Greek Ministry of Development and Investments (MDI). This annual deficit was calculated as [51]:
i = 1 n h = 1 8760 [ ( SMP h FiT i ) · RES h i ]
where:
-
SMP h was the system marginal price during hour h,
-
FiT i was the Feed-in-Tariff reimbursement for technology i,
-
RES h i was the RES-E generation (MW) during hour h, from technology i.
Typically, RES-E generation reduces the SMP due to the merit order effect [29], and as thus, lower SMP values resulted to an increase of the required levy, and, thus, an increase in the total deficit. The latter led to questions about the design of the RES-E levy mechanism. Considering the latter, the deficit of the RES Account was excluded from our analysis, since: it only answered the question of who is in charge of paying for the FiTs reimbursement, and it did not reflect the actual costs of RES-E electricity generation, as SMP values may vary regardless of the RES-E generation.

3.2. Quantifying Costs and Benefits from RES-E Generation

The major costs and benefits of RES-E generation from FiTs are:
Costs: Paying for the FiTs reimbursement.
Benefits: Under the assumption that the SMP reduction due to the substitution of conventional generation by RES-E generation is balanced by VCRM, a better way to approximate economic benefits owing to the offset of fossil-fueled generators is the reduction in fuel use. Given that lignite is an indigenous energy source in Greece [52], monetizing the lignite consumption avoided due to RES-E generation can be calculated by considering the lignite export price. However, there are no trends indicating the prices for lignite-fueled generation in liberalized markets, as its transport over longer distances is considered an uneconomic choice due to its low calorific value. As an alternative, the pre-tax avoided cost of lignite use and natural gas imports, and the avoided Carbon Dioxide (CO2) emissions, owing to offset from RES-E generation, will be regarded as benefits.
Kaldellis and Kapsali (2014) combined historical data for CO2, sulfur dioxide (SO2), nitrogen oxide (NOx), and particulate matter (PM) emissions from the main Greek lignite-fueled generators with electricity generation data, to estimate each generator’s emissions contribution (i.e., emission factors) [53]. Emission factors (kg/MWh) for each major lignite-fueled generator in Greece, as acquired from the study, are presented in Table A1 in Appendix A. Additionally, Gouw et al. (2014) used continuous emissions monitoring systems (CEMS) data to investigate the CO2, NOX and SO2 emission factors of natural gas-fueled power generation units in USA [54]. Their analysis showed that generation from combined cycle technology fired by natural gas contributes to average emissions at 44% of the CO2 of the coal-fueled generator. This was also assumed valid for the case of Greece.
The annual CO2 emissions avoided from RES-E generation were estimated as:
Δ E t p =   G t RES · ε t CO 2
where:
-
G t RES : the RES-E generation during year t (kWh).
-
ε t p : CO2 emissions coefficient of the displaced fossil-fueled generator during year t ( kg   of   CO 2 kWh   avoided ) .

3.2.1. Estimating the Mix of the Conventional Power Generation that is Substituted by RES-E Generation

In this section, CO2 emissions avoided during the period under study are quantified to estimate the fossil-fueled generation that was substituted by RES-E generation, and measure the avoided cost of natural gas imports.
Based on domain knowledge and stakeholder insights, the causal relationships within the electricity market in Greece are visualized in Figure 3. The arrows with solid line show certain causal relationships, whereas the arrows with dashed lines represent “plausible to exist” relationships that should be validated. Note that the term “causal relationship” is utilized to indicate that “if Z t   includes a set of properly selected explanatory variables, we can predict Y t + 1   using the lagged values of Y t   and Z t   , thus by adding the lagged values of W t   (i.e., W t   contains unique information for predicting Y t + 1 ), a better prediction can be achieved. Therefore, it could be implied that there is a (Granger) “causal relationship from W t   to Y t ( W t Y t )” [55].
According to the Granger causal relationships between the fossil-fueled and RES-E generations, the total electricity load and the available capacities of the electricity system, the latter three variables are considered exogenous. Regarding the electricity load, residential and commercial consumers are late to realize the variation of the wholesale price, since they are charged with the most common tariff (i.e., “G1” tariff) [56]. Consequently, since consumers purchase electricity in a constant price, demand volatility is caused by exogenous factors, which do not relate to the wholesale price. Moreover, causal relationships between the natural gas-fueled generation, the lignite-fueled generation, and the hydroelectric generation should be further investigated. One should expect to identify a causal relationship between the residual load and the lignite-fueled, the natural gas-fueled and the hydroelectric generation.
CA is applied to estimate the displacement of lignite- and natural gas-fueled generation by RES-E generation from FiTs in the Greek wholesale market, from 2009 to 2013. To model the long-run equilibrium relationships, a set of explanatory variables must be selected, such that: (a) the variables are exogenous, thus the dependent variable has no reverse causations with any of the explanatory variables, (b) no relevant variables are excluded from the analysis, as doing so would result to false predictions, because the error term and the regressors are correlated, (c) unnecessary explanatory variables are excluded, as they would add noise to the estimations, and (d) multiple significantly correlated variables must be avoided, as their inclusion would make individual coefficients to change drastically regarding variations in the model or the data, hence, be falsely and unstably estimated.
Since high-resolution PV RES-E generation data for the period under study are not available, our work focused on wind RES-E generation data. This was feasible as the available load data were adjusted by the ex-post PV RES-E generation output. Figure 4 and Figure 5 depict the daily electricity demand and actual wind RES-E generation during the period under study. Note that seasonal variation of the time series data for both electricity demand and wind RES-E generation is in line with previous findings from the scientific literature [57]. Since identifying the correlation of two non-stationary variables is not useful, because of an either deterministic or stochastic trend, the load time series used were detrended and wind capacity factor data were selected instead of the actual wind RES-E electricity generation.
The capacity factor is bounded and, thus, can be considered stationary: CF t [ 0 , 1 ] . Figure 6 depicts the daily wind capacity factor for Greece, for the period under study. Note that there is not any long-term variation since the evolution of penetration does not affect capacity factors [57]. The variation that appears in Figure 6 is statistical due to weather conditions that differ among years. As visualized in Figure A1 in Appendix A, the mean value of the correlation between the wind capacity factor and the detrended load is −0.05. This implies that no clear pattern throughout time could be identified, and that the assumption that the load and the wind RES-E generation are uncorrelated is considered pertinent.
Figure 7 and Figure 8 present the actual daily lignite- and natural gas-fueled generation during the period of 2009–2013. The daily natural gas-fueled generation ascends during this period, rather than descending due to the merit order effect, because of the combined impact of the important capacity additions and the effect of VCRM. The total available capacity for lignite-fueled generators determines the final lignite-fueled output, so if the residual load levels remain the same, a reduction in the available capacity should result to an equivalent output reduction. The same applies to the relationship between the total available capacity and the final output of the natural gas-fueled electricity generation. Furthermore, if residual load is considered constant, reducing the available lignite (natural gas) capacity should result in an increase in the natural gas-fueled (lignite-fueled) generation.
On the other hand, Figure 9 presents the evolution of the natural gas-fueled and the hydroelectric generation from 2009 to 2013. Note that when hydro generation is high, natural gas-fueled generation is low. For each time period, the hydroelectric generation depends on the comparison between the marginal water value (MWV) and the expected SMP. The value of water is linked with its opportunity cost, thus expected income relies on the future values of stochastic hydro inflow and electricity prices, as well as on the current reservoir levels. The substantial change of the MWV curve does not alter its general shape over the years [58]. MWV and storage have a converse trend, with the curve being almost for most storage levels, reaching zero at the upper bound, and ascending abruptly as storage descends towards the other end. The latter highlights the system’s ability to cope with different inflows and storage levels, at average costs. However, in case that storage values become immoderate, water turns out to be very valuable in order to avert a probable shortage.
The MWV value could be described by two components, as presented in Figure 10, based on the way that the marginal cost of hydroelectric generation is calculated: (a) the C 1 , d , m component, reflecting the substitute value of the thermal generation, in case of hydroelectric generation (i.e., impact on SMP), and (b) the C 2 , d , m   component, where d   is the day and m   is the month indices, reflecting the current reservoir levels.
The daily C 1 , d , m   component derived from the following formula:
C 1 , d , m   =   ( 1 + σ d , m ) · C TH , m
where:
-
σ d , m is a factor capable of adjusting to the volatility of fuel prices. It was calculated on a daily basis as the total price change of the different fuels ( Δ P fuel , m , d 1 ) according to their contribution in the generation output ( a fuel , m ) :
σ d , m =   fuel ( a fuel , m · Δ P fuel , m , d 1 )
The price variation of each fuel was calculated as the difference between the previous day and the mean price of the same month for the last three years:
Δ P fuel , m , d 1 =   P fuel , d 1 1 3 y 3 y 1 P fuel , m ( y ) 1
Finally, a fuel , m   was calculated as the mean contribution to the total fossil-fueled generation for the last three years:
a fuel , m =   1 3 y 3 y 1 G fuel , m ( y ) G fossil , m ( y )
-
C TH , m is the reference value of the displacement of thermal generation due to hydroelectric generation. The reference value C TH , m was calculated as the rolling mean value of the SMP during month m over the last three years, considering the respective hydroelectric generation variable G m ( y ) , h hydro over the same period:
C TH , m =   1 3 y 3 y 1 ( h ( SMP m ( y ) , h · G m ( y ) , h hydro ) h G m ( y ) , h hydro )
The scheduling of the hydroelectric generation takes place in accordance with the peak shaving method that is based on the heuristic idea that electricity generation should be distributed in the upper part of the load curve of the electricity system, which concerns the peak loads [59]. Thus, the total available capacity of hydroelectric generation, while being limited for a specific time period due to resource constraints, is dispatchable, resulting to a significant decrease in the operating costs of the rest of the units. Hydroelectric generation is considered as an exogenous variable to both the conventional generation and SMP. As far as the relationship between lignite- and natural gas-fueled generation is concerned, it is considered that the recurring bidding process between the market agents was stabilized, and thus a generator holds the same market share (i.e., constant generation), while the total system load remains stable, unless a variation in the available conventional capacity happens. Additionally, hydroelectric and RES-E generation affect both lignite- and natural gas-fueled generation, thus having RES-E and hydroelectric generation data in a model for lignite-fueled (natural gas-fueled) generation, can provide natural gas-fueled (lignite-fueled) electricity generation data without any other source of data being required.
A vector autoregressive (VAR) model between the lignite-fueled and natural gas-fueled electricity generation (i.e., dependent variables) and the total electricity load (shorthand: “Load”), the RES-E generation (shorthand: “RES”), the hydroelectric generation (shorthand: “Hydro”) and the fossil-fueled available capacities (shorthand: “Lignite” and “NGas”) (i.e., explanatory variables), was modeled. Note that the non-stationarity of these variables is easily proved by a visual inspection of the time series data used and presented above, as the mean value and the variance of the time series data differentiate over time. The latter violates stationarity. Choosing the lags to be equal to 7, the partial autocorrelation diagram proposes that the natural gas-fueled generation during hour t   is correlated with the generation during the same hour of the previous days, as presented in Figure A2 in Appendix A. This led us to model each hour of the day separately, through an autoregressive distributed lag (ARDL)/bounds-testing methodology [60,61]. The ARDL modeling process implies that the lignite- or natural gas-fueled generation during time t , was based on past generation, modified by the new state of the electricity market incorporated into past values of the total load, RES-E and hydroelectric generation, as well as fossil-fueled available capacity. For the lignite-fueled (natural gas-fueled) generation variable, the corresponding ARDL model has the following form:
q t , d ng =   i = 1 p a i q t , d i ng +   j = 1 n β j X t , d j +   ε t , d
where:
-
q t , d ng is the actual lignite-(natural gas-)fueled electricity generation during hour t   and day d , and
-
X t , d =   [ L t , d ,   res t , d ,   hydro t , d , C t , d ng ,   C t , d lig ] , where
  • L t , d is the system load during hour t   and day d ,
  • res t , d is the actual RES-E generation during hour t   and day d ,
  • hydro t , d is the hydroelectric generation during hour t   and day d , and
  • C t , d ng ,   C t , d lig   are the total available capacities during hour t   and day d for natural gas-fueled and lignite-fueled electricity generation, respectively.
Next, we formulated an unrestricted error-correction model (ECM) between the dependent variables and the explanatory ones, chose the lag structure and assured that the model was well-defined (i.e., model errors were sequentially independent). The coefficients for the unrestricted ECM for hour 00:00 and with number of lags equal to 2 are presented in Table A2 in Appendix A. Additionally, an F-test was performed assuming that: “If the coefficients of the lagged values of the explanatory variables are jointly equal to zero, then a long-run equilibrium relationship between the dependent variables and the explanatory ones cannot be concluded.” A typical difficulty with an F-test is that its distribution is not standard and the exact critical values for the test are unknown for an arbitrary mix of I(0) and I(1) variables. However, based on the range of the critical values for the asymptotic distribution of the F-statistic [61], we concluded that the coefficients are not nullified, thus, our assumption must be rejected (i.e., the F-statistic exceeded by far the upper bound). Since the test concluded in cointegration, the long-run equilibrium relationship of the variables under study is meaningful and can be estimated. Results are presented in Table A3 in Appendix A.

3.2.2. Estimating the Capacity Value of RES-E, While Keeping the Electricity System’s Reliability in a Designated Level

The density plot of wind capacity factor, as generated from an autocorrelated process, is shown in Figure A3 in Appendix A. However, the average value of the plot provides very limited information on the generation adequacy risk, as the length of the investigation period required with wind generators is typically an open question. Wind’s ELCC is usually calculated using hourly generation data of one or more years. However, this approach is effective enough when applied to long-term generation data of conventional generation and is not able to effectively represent the long-term performance features of wind generators. In particular, when data for wind generation is only available for a single year, then the calculated LOLE is expected to be a historical assessment rather than a predictive one, and as a result, an increase in the available years of time series data could result in an important wind generation volatility [46]. A way to overcome this difficulty is by finding in a yearly basis from 2009 to 2013, the month with the most volatile wind generation (i.e., difference between higher and lower daily wind generation). The corresponding days are shown in Table A4 in Appendix A.
Hydroelectric generation is excluded from the COPT calculation due to its dependency on water reserves and the estimation of the wind’s ELCC by comparing the system’s LOLE before and after its configuration. Table A5 in Appendix A presents the available fossil-fueled power plants in Greece for the investigation period, alongside their net maximum capacity and EFORd. Then, for the same period, and using the hourly load series data (i.e., without considering wind RES-E generation), we calculated the LOLP in an hourly basis (i.e., for each hour of the year), as well as the yearly LOLE. In case of low demand, in comparison to the installed generation capacity, LOLP is insignificant (Figure A4 in Appendix A). If we add the total hours that demand is lower than the load in which the LOLP starts to become high enough (a threshold L TH ), we can calculate the LOLE using the residual load L t net . Assuming that the LOLE is not influenced by the addition of a perfectly reliable resource of capacity   C wind , then the annual LOLE can be approximated as:
LOLE year , wind     t :   L t > L TH Pr t {   C E < L t C wind }

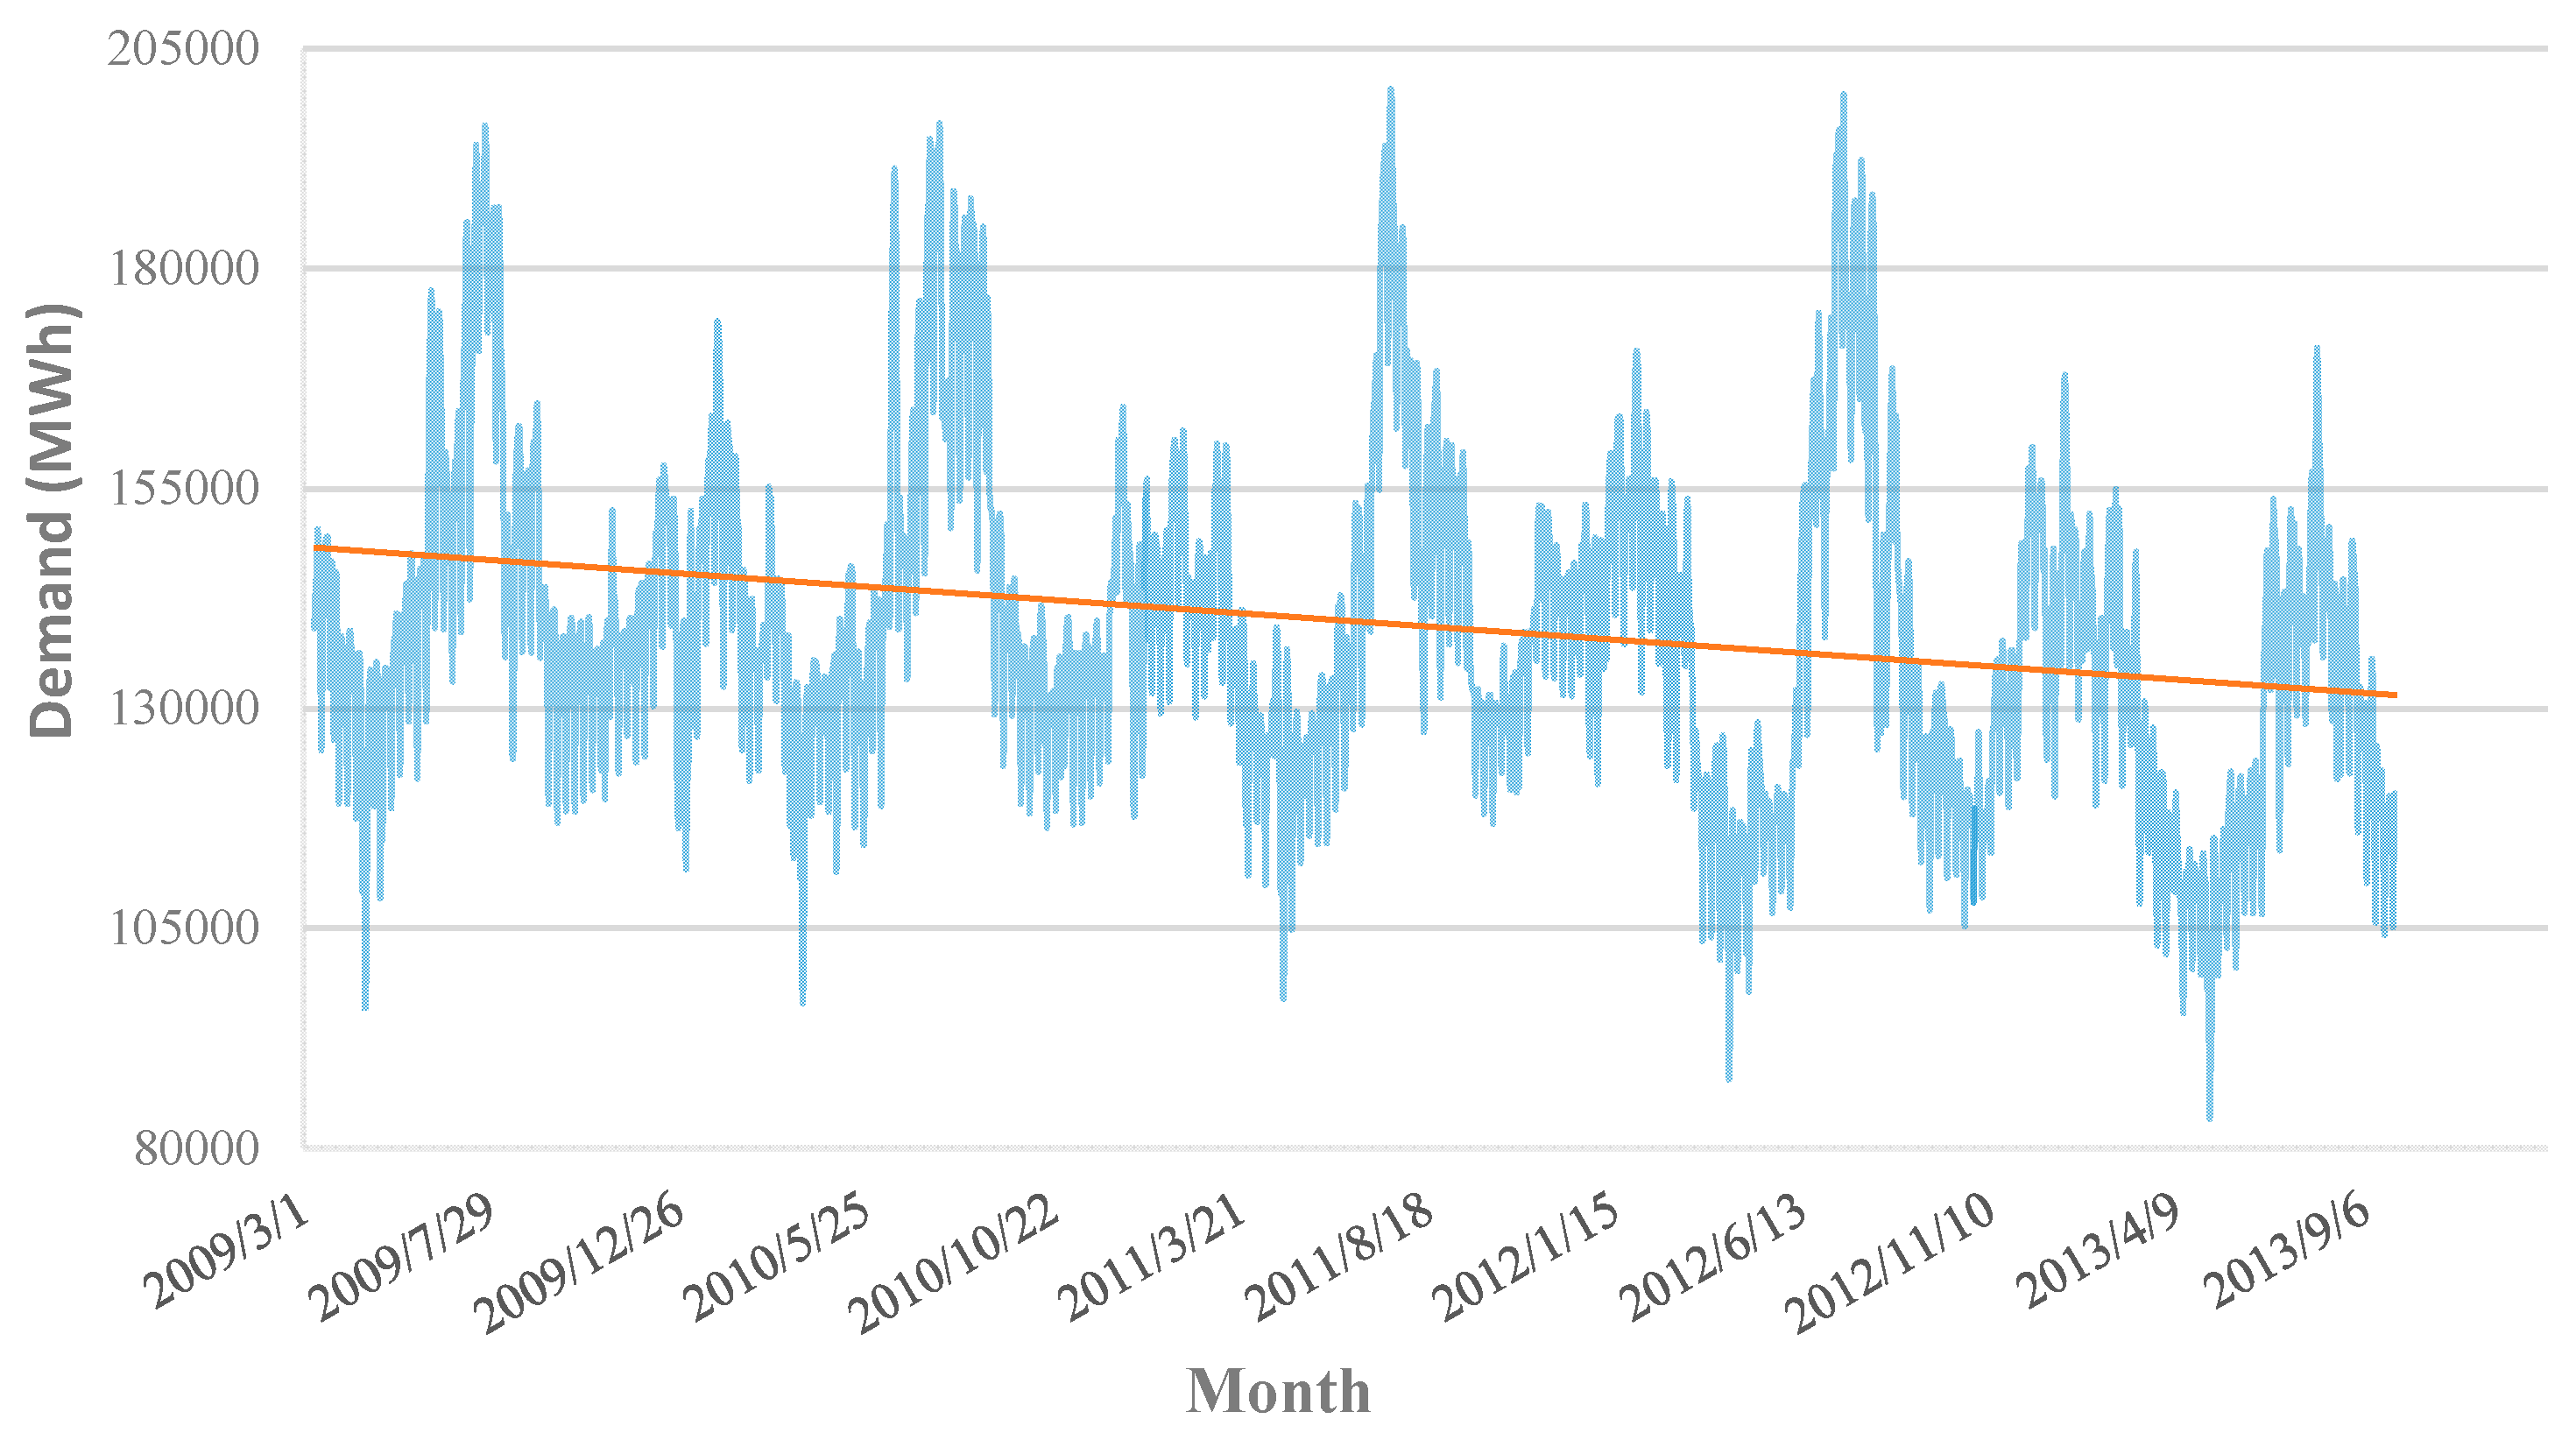
4. Results and Discussion

This section presents and discusses our findings regarding the economic and environmental impact of the FiTs scheme in Greece during the period 2009 to 2013, along with its contribution to the reliability of the electricity system.

4.1. The Long-Run Equilibrium Relationship between the Lignite-(Natural Gas-)Fueled Generation and the Wind RES-E Generation

Although a VECM can be specified, our work assumed that the long-run equilibrium relationship is the important aspect of the effect of RES-E generation on conventional electricity generation. The coefficients of the long-run equilibrium relationship for natural gas- and lignite-fueled generation, for four representative hours of the day, are presented in Table 1. The detailed coefficients for the unrestricted ECM for hour 00:00 can be made available upon request.
Although a distinct pattern is not visible, our outcomes imply that, during the period 2009 to 2013, 0.41 MWh of natural gas-fueled generation, and 0.29 MWh of lignite-fueled generation, were displaced on average by 1 MWh of wind RES-E generation. This is also validated by recent literature findings, acknowledging a substitution effect between RES and conventional electricity generation, with an increase in one implying a decrease in the other [62].

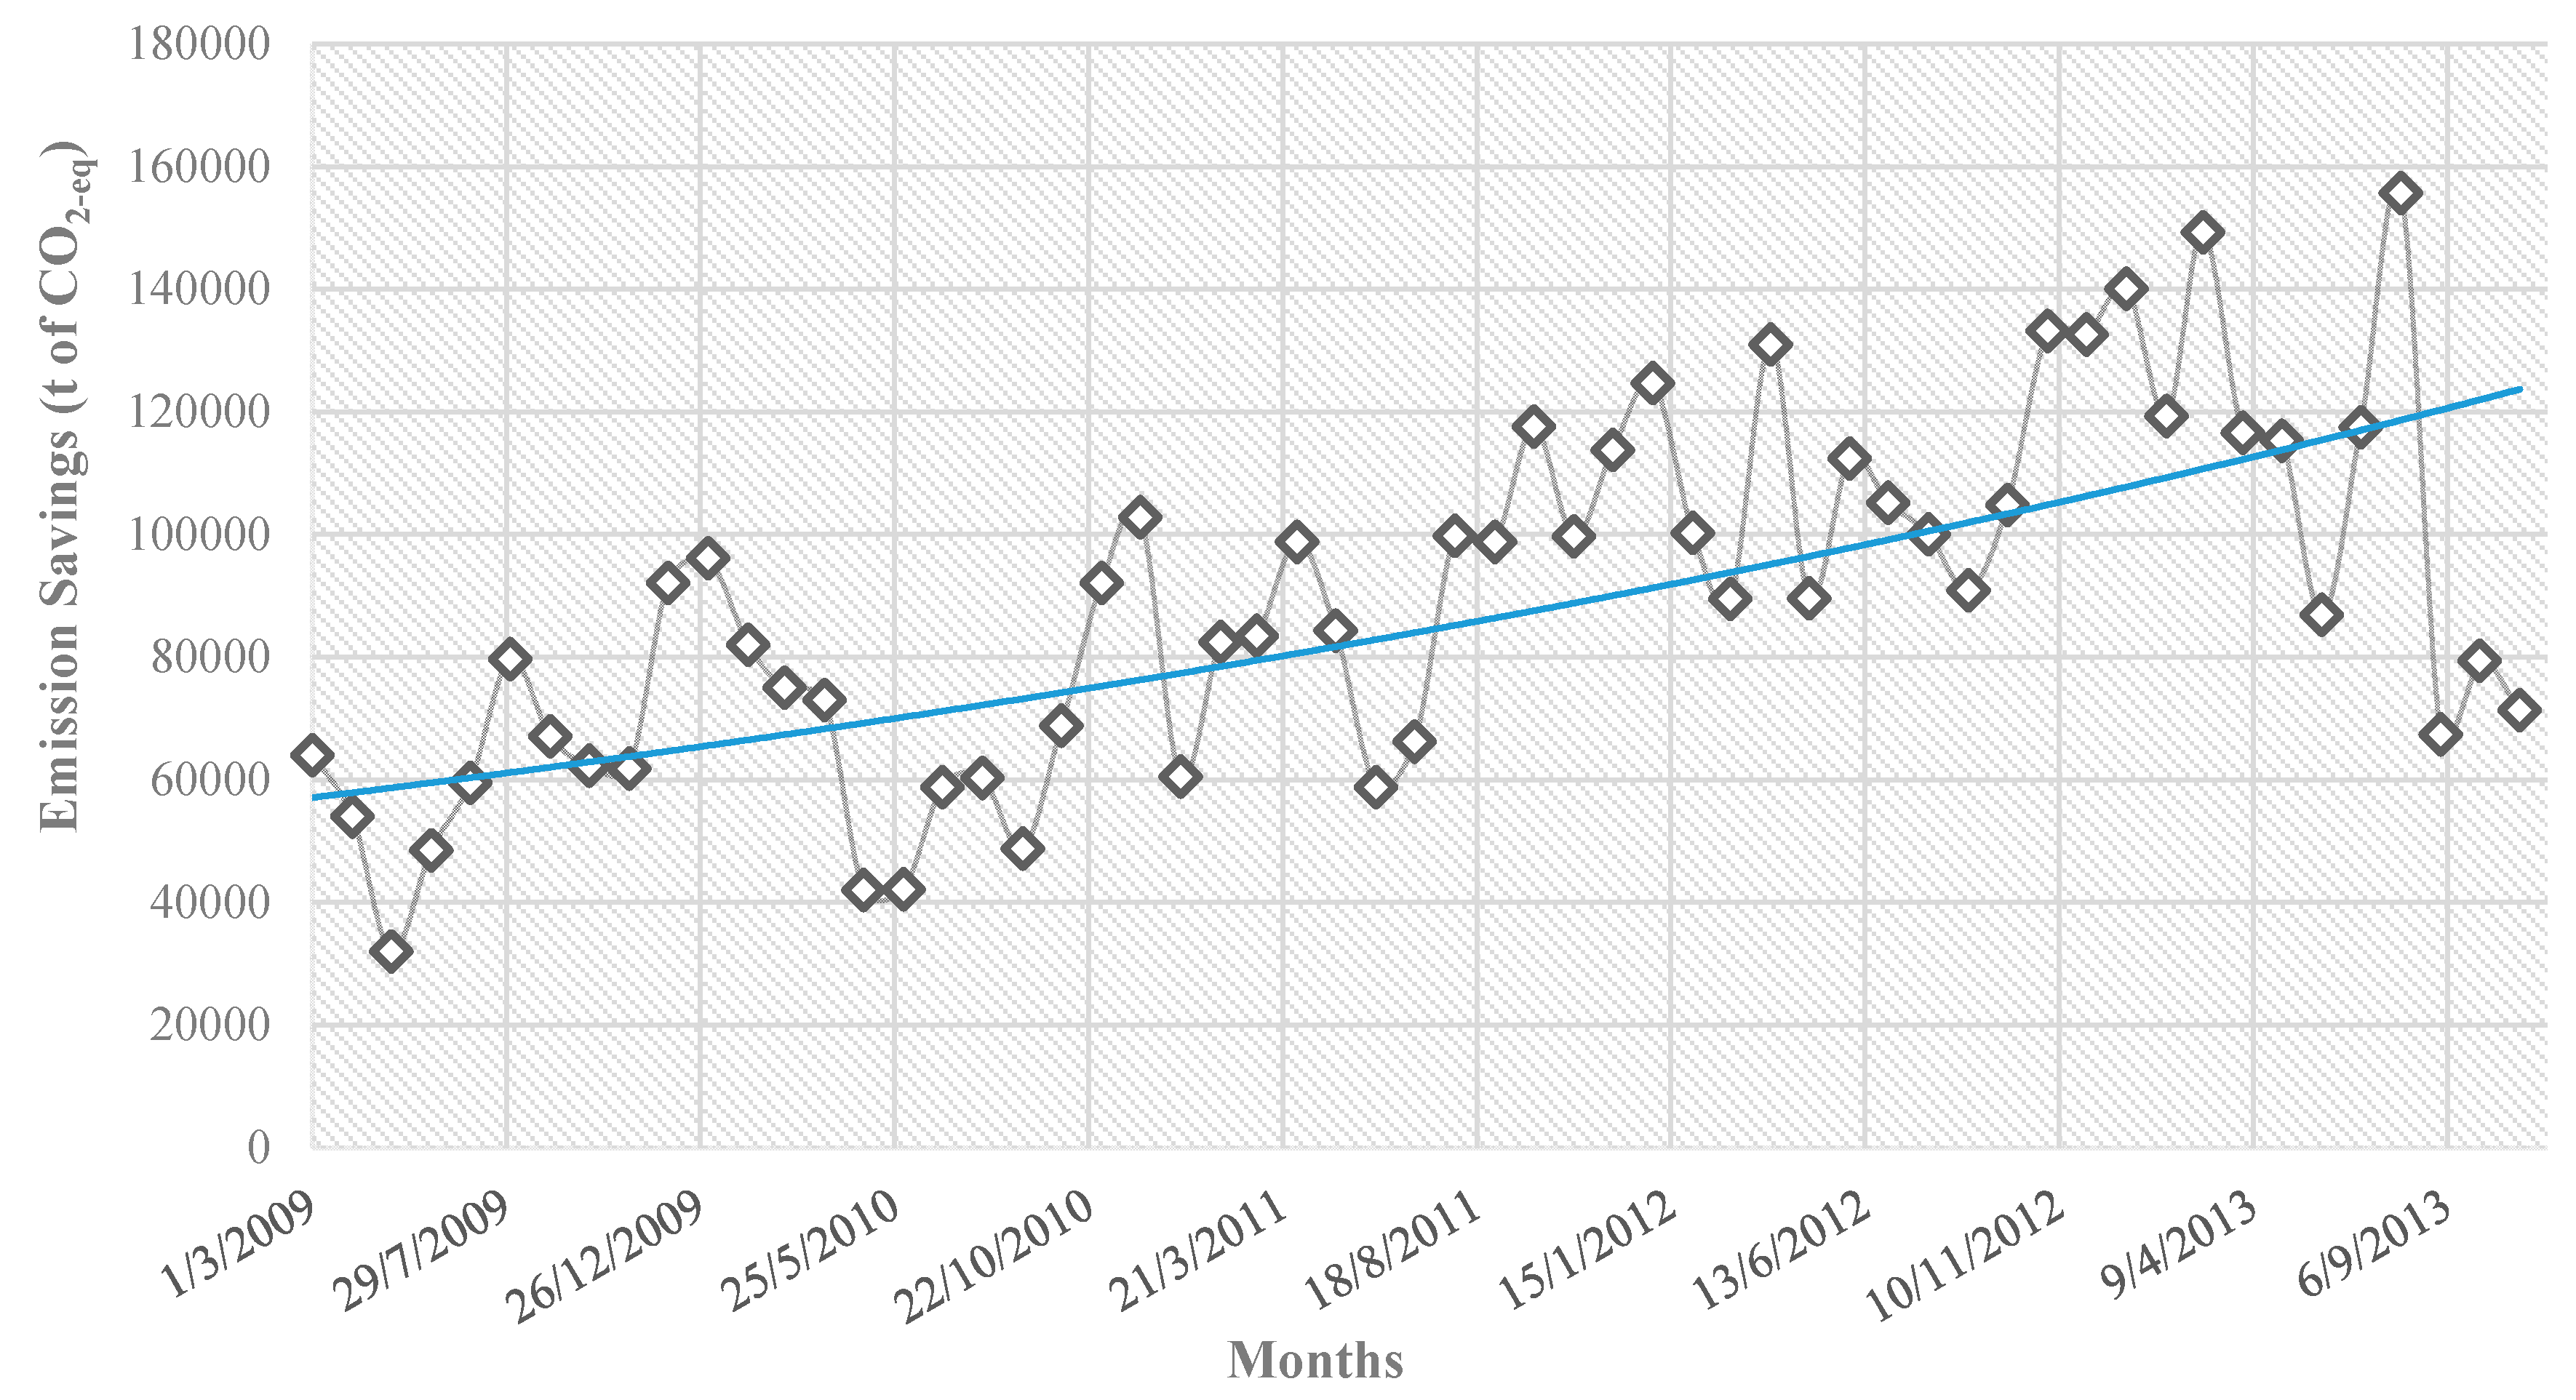
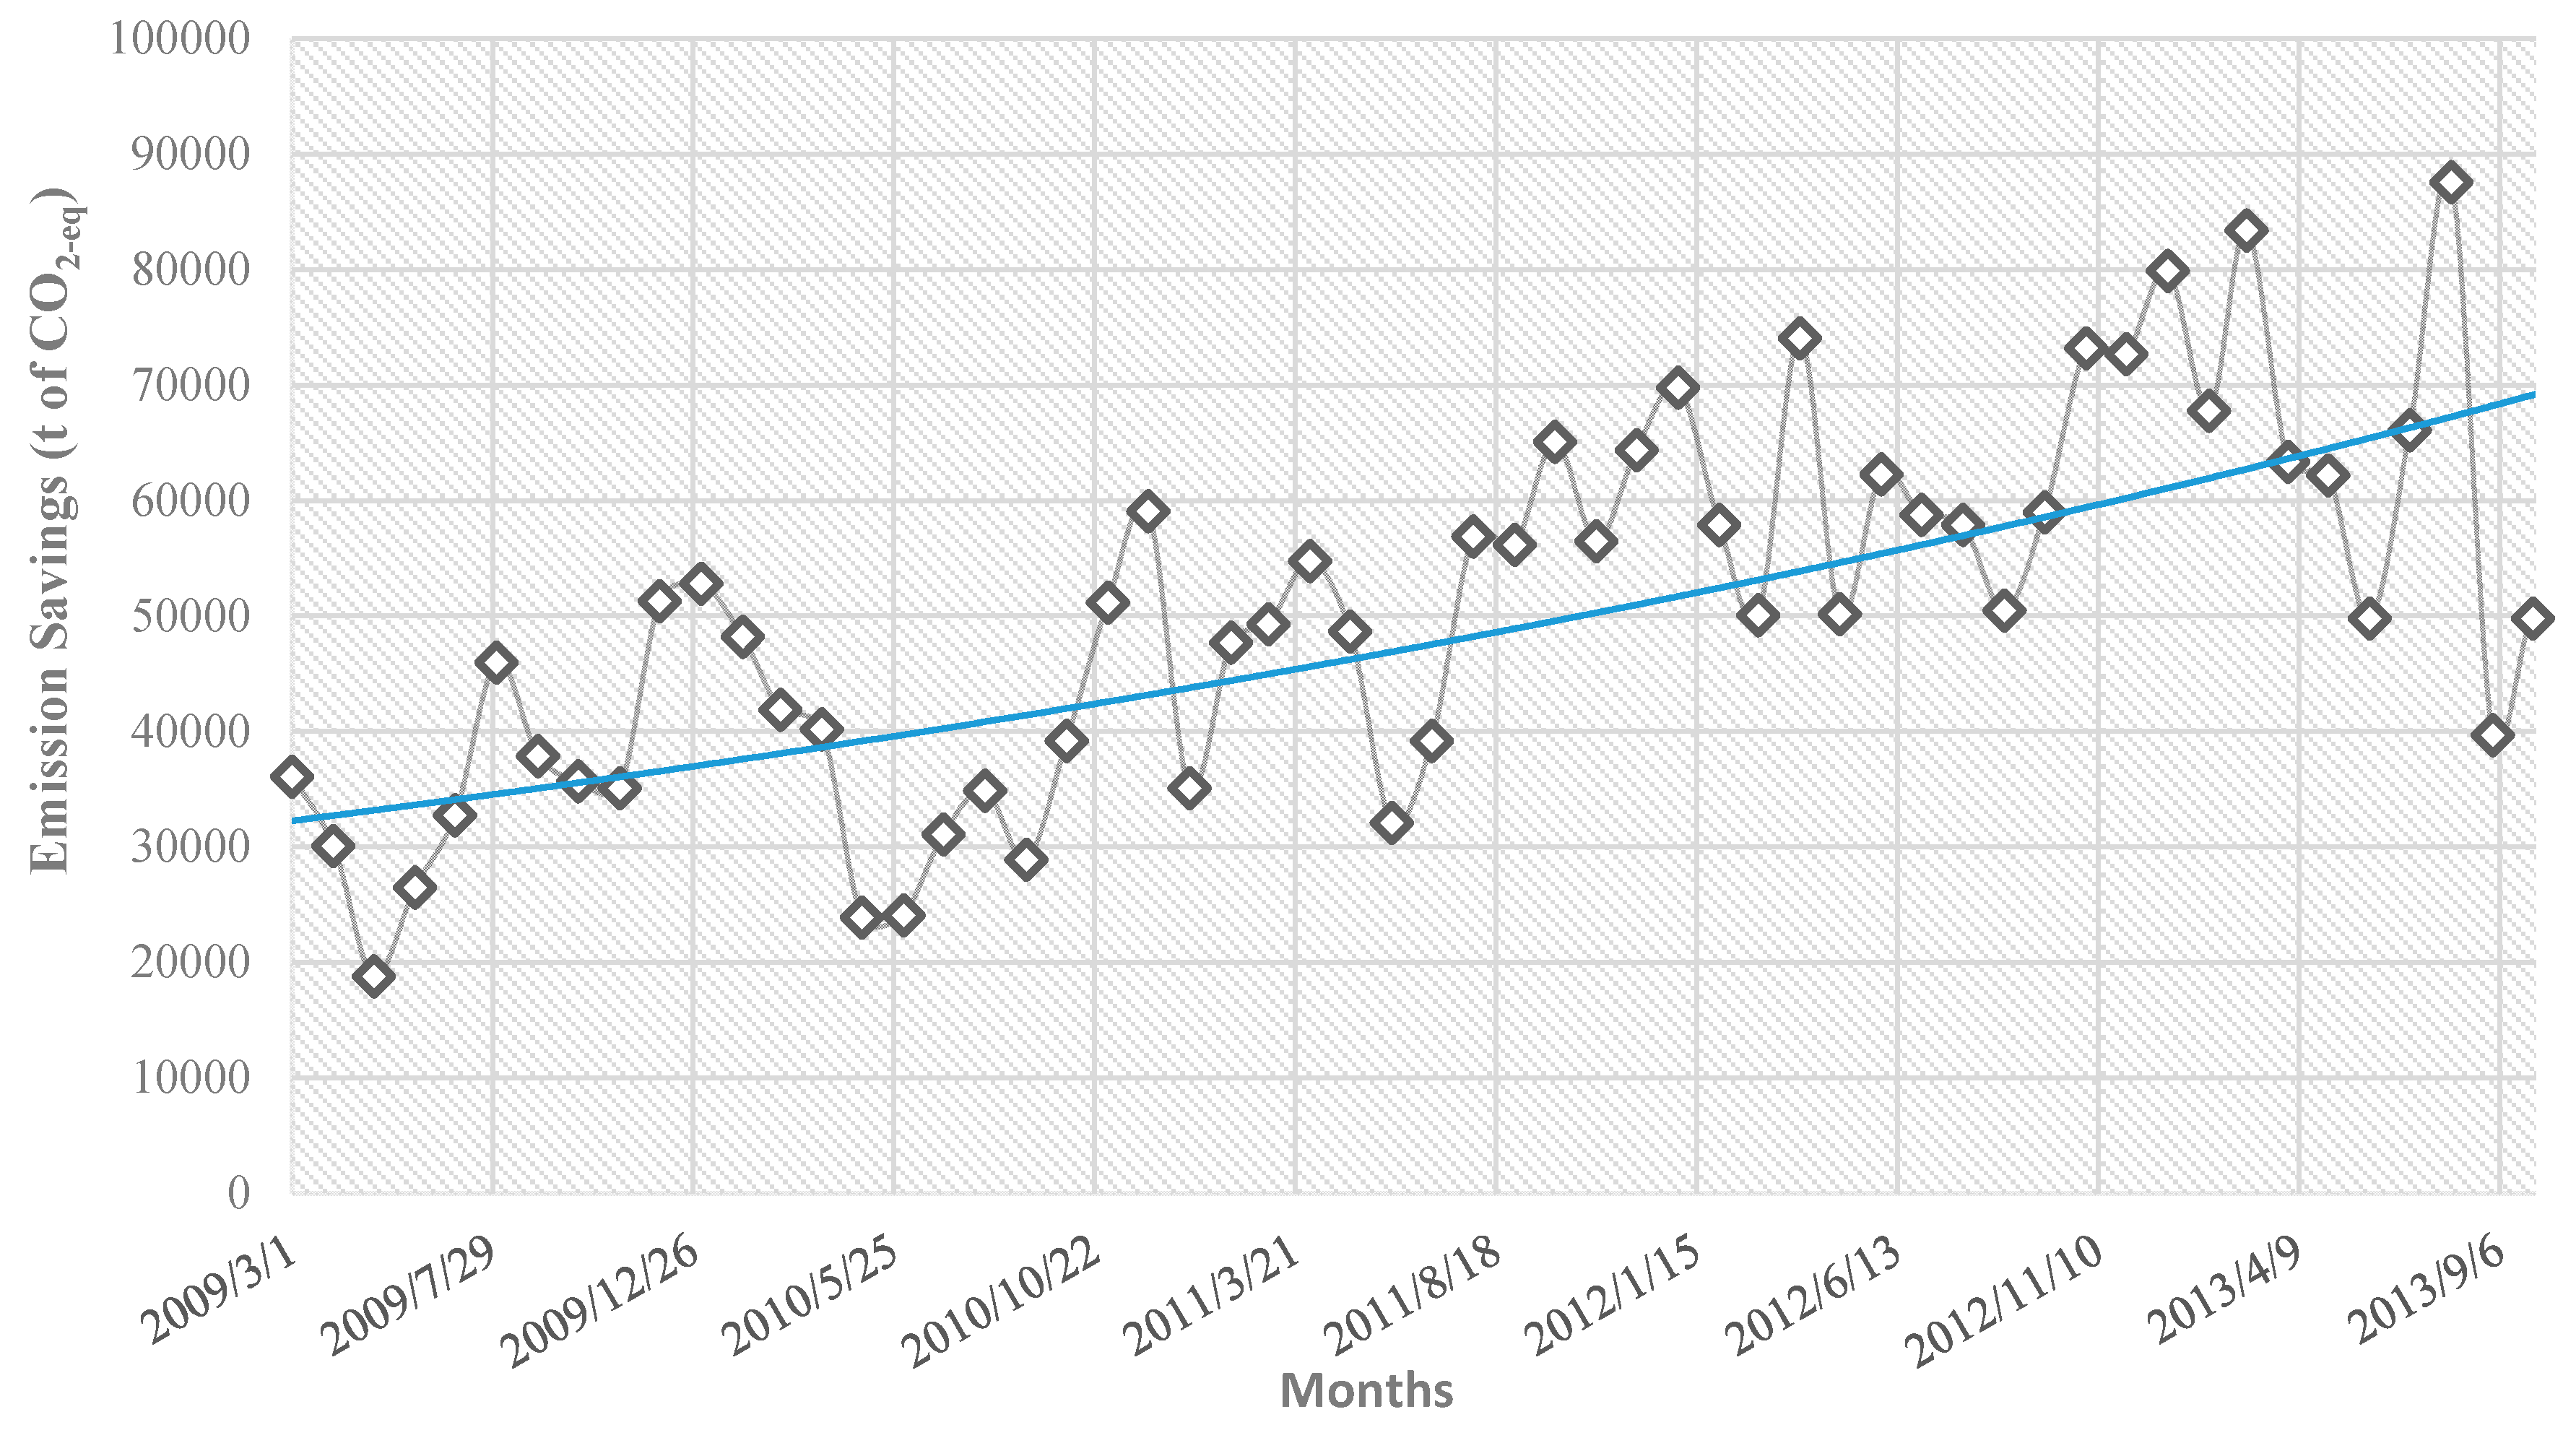
4.2. Economic Benefits from the Wind RES-E Generation

Excluding the consumption tax and the tariffs of the transmission system, the fuel cost of natural gas-fueled generators is calculated as the natural gas price divided by their efficiency. If efficiency of natural gas-fueled generators is assumed to be equal to their capacity-weighted average, which is 0.51, the evolution of the monthly weighted average import price of natural gas is depicted in Figure 11.
Considering the monthly weighted average import price of natural gas, the economic benefits from natural-gas imports avoided, due to the substitute of the natural gas-fueled generation from the wind RES-E generation, during the period 2009 to 2013 are presented in Figure 12. According to our results, the effect of the FiTs scheme on public finances during this period was positive. In particular, from March of 2009 until the end of 2011, the economic benefits reached the €98.32 million in total, while from early 2012 to end of 2013, the respective benefits were one and a half times over (i.e., €147.2 million). This is also acknowledged by similar scientific findings, showing that subsidies for electricity generation from wind in Spain have had a positive impact on economic activity [36].

4.3. Environmental Benefits: CO2 Emissions Savings from the Wind RES-E Generation

Figure 13 and Figure 14 present the CO2 emissions avoided owing to the lignite- and natural gas-fueled generation offset by the wind RES-E generation from FiTs, during the period 2009 to 2013. Considering that the electricity system in Greece relies heavily on a high share of lignite- and imported natural gas-fueled power plants, our results suggest that the high share of RES-E achieved by FiTs during the period under study had also a significant environmental impact. In particular, from March 2009 to end of 2011, the cumulative emission savings owing to the wind RES-E generation from FiTs reached almost the four million tons of CO2-eq, accounting for more than the 6% of the total GHG emissions reduction in Greece during the same period. Especially for the year 2011 it should be noted that almost all the major lignite thermal power stations (LTPSs) in Greece were not in a compliance status with the national obligations, with the largest one presenting the highest emission excess (i.e., about 3.2 Mt/year more than allowed) [53]. Similar results, during the period 2009 to 2011, are also presented for the case of FiTs in Portugal, the electricity market of which has a very similar structure to the electricity market in Greece [63]. Additionally, the respective savings from early 2012 until the end of 2013 exceeded the ones of the previous period.
The CO2 emission reduction trend in Greece during the period under study has been also acknowledged by the scientific literature [64,65]. However, such a decrease, can typically be attributed to the economic austerity of this period, as previous studies have already highlighted that economic activity is strongly correlated to, and mainly responsible for, a CO2 emissions increase [66,67]. Our results differentiate, as they explicitly estimate the emission savings owing to the lignite- and natural gas-fueled generation offset by the increased wind RES-E generation from FiTs, providing, thus, a clearer perspective on the environmental performance of the scheme in Greece. Similar results have been also acknowledged for the case of Spain [36].
Note that including CO2 emissions contributed by RES, owing to material processing, components and facilities construction and electricity intense utilization of metals, during the initial fabrication stages, was out of the scope of our study. From this aspect, a tailor-made life-cycle environmental performance assessment study to address this issue in a more detailed manner is needed, focusing on the development of an emission inventory in the electricity sector in Greece. The latter should include emissions, not only from conventional generation, but from RES generation too.

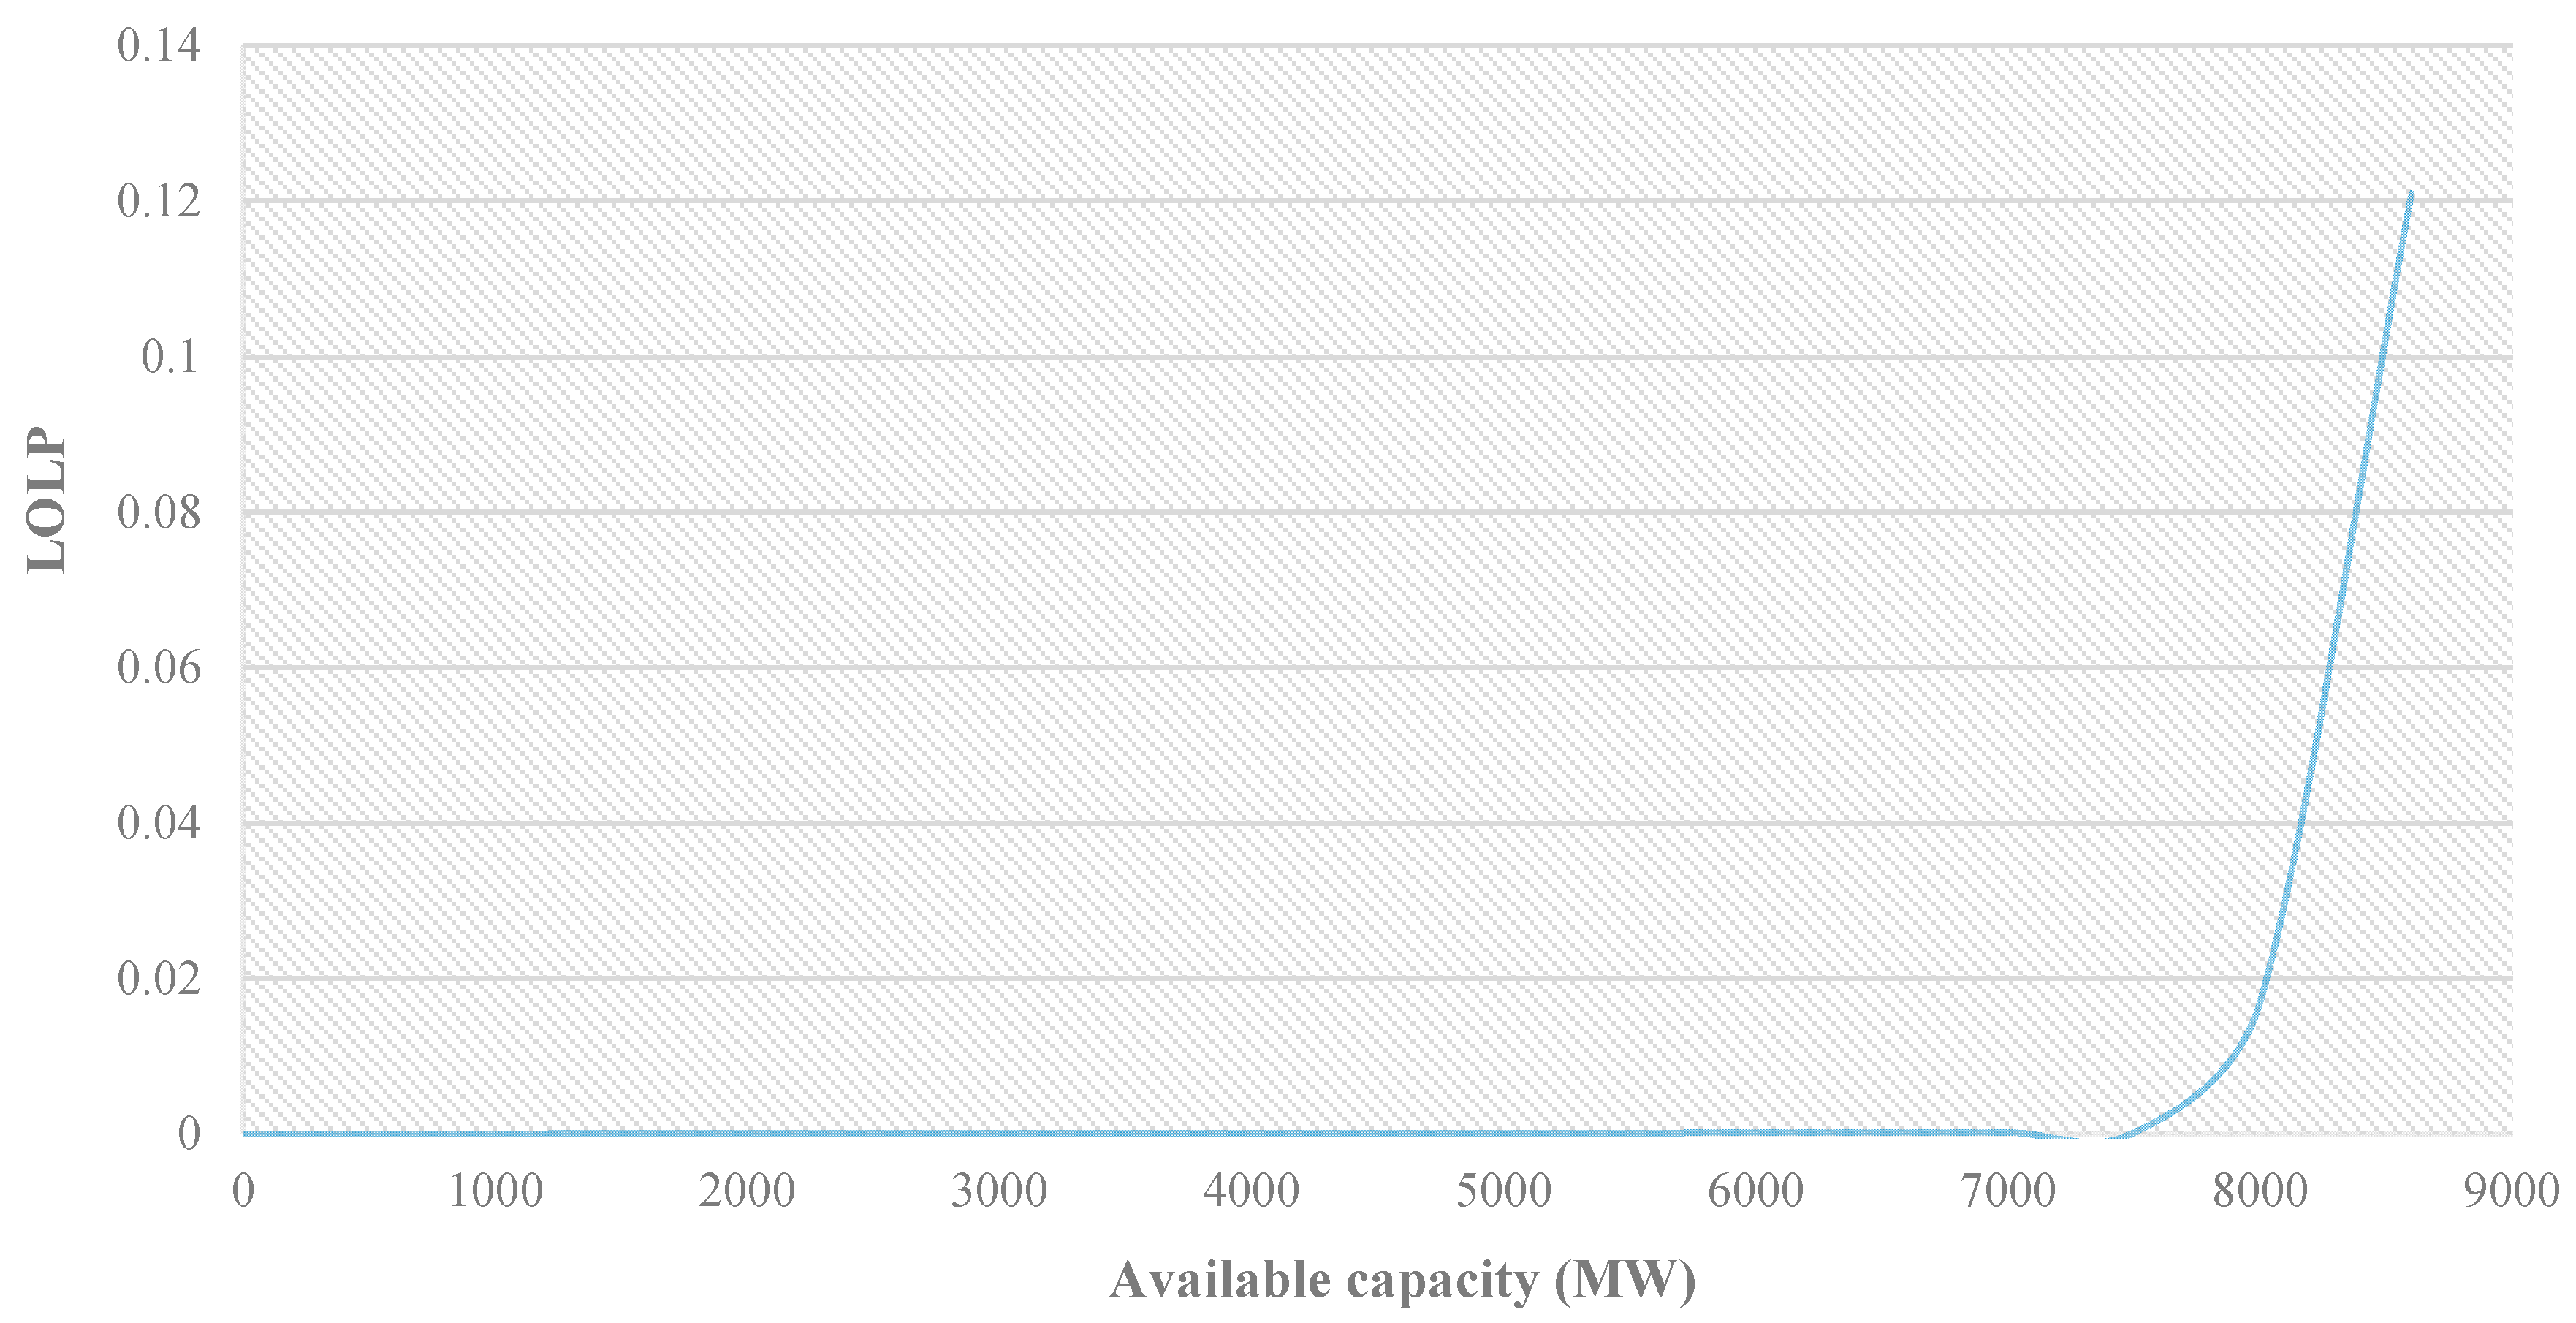
4.4. Capacity Adequacy of the Wind RES-E Generation

The COPT for the electricity system in Greece, during the period 2009 to 2013, is presented in Figure 15. Note that the x-axis refers to different capacity levels (MW), and the y-axis to the cumulative probability that these capacity levels can be matched by the available capacity at any given time period t .
If one chooses a threshold L TH equal to 7500 MW, which corresponds to all hours in the 1% peak load period, then the annual LOLE for the Greek electricity system, from October 2012 to September 2013, was found approximately equal to 1.34 h. Assuming that the LOLP function follows a linear trend between the threshold L TH   and the maximum observed peak load, which is approximately true at the upper end of the LOLP curve (Figure A5 in Appendix A), then the following condition should be satisfied [68]:
C wind =   mean ( Wind t )
where Wind t is the wind RES-E generation when the residual load is greater than the threshold value L TH . The LOLP curve as a function of the system’s residual load is depicted in Figure 16.
The capacity adequacy value of wind RES-E generation was found equal to 239 MW or, equivalently, 16% of the mean wind RES-E capacity (i.e., 1485 MW), for the period under study, while the total wind RES-E generation was 3,416,125 MWh. As the capacity-weighted average EFORd of the natural gas-fueled generators was equal to 8.58%, the total capacity displaced by the wind RES-E generation was 426.57 MW of a nominal fossil-fueled generator with an EFORd of 8.58%. In addition, given the capacity contributed by the RES-E generation (i.e., 239 MW), an annual capacity payment equal to €7.055 million or, equivalently €4,750/MW is attributed as a cost to the wind RES-E generation from FiTs.
Although a static analysis like ours can be insightful, a dynamic one is required, due to the fact that, as the RES-E penetration increases, the peak period of the residual load shifts toward hours that the RES-E generation decreases (i.e., has lower capacity factors). As a result, increasing RES-E capacity has diminishing returns in terms of its value, mainly owing to increased reserve requirements. For instance, the relationship between wind and peak load remains ambiguous over the years, as dictated by the respective patterns. To quantify, thus, the impact that data limitations can have on the calculation results, an estimation of the possible deviations of the capacity values during different time periods is required. Our analytical framework, acknowledging data limitations, provides a good starting point for that; future studies can build on our work to also assess the impact of newly introduced support mechanisms, as NEM or FiPs, in different contexts across Europe. Aspects of decentralization and prosuming should also be included to assess possible uncertainties that can be introduced into the electricity markets.

5. Conclusions and Implications for Policy and Practice

Over the period 2009 to 2013, RES in Greece have been treated as a special type of market participant, mainly owing to their non-dispatchable nature. During this period, RES-E has been compensated based on a FiTs support mechanism, which was necessary for the investment initiation, not only in the country, but also in other European electricity systems. Despite the remarkable boom, as RES penetration progressively reached large-scale, and given the economic recession in Greece, market prices were distorted, and market efficiency was downgraded. Since then, although regulatory efforts to reach the standards of other European markets that experienced a transition from a high FiTs status to a market-based environment have been put in place, progress remains slow. On the other hand, despite of the learning progress of the past years, governments and regulatory agencies remain still uncertain about the regulatory framework necessary to incorporate larger shares of RES into the generation mix of a country or region.
While most studies on the regulatory design of RES-E support mechanisms focus on assessing the efficiency of the different alternatives, there is a knowledge gap on how these mechanisms affect the performance of the energy market. In view of a high-RES market design compatible with the EU target electricity model, regulatory efforts need to include in their scope the interaction between the market and RES-E sector. To this end, quantitative assessment studies filling knowledge gaps on the market effect of RES-E support mechanisms, either in a national or in an EU level, are of paramount importance. Although FiTs are almost in the past in Greece, our work focused on the ex-post assessment of the scheme to identify the main drivers and interactions that governed the major monetary flows and causal relationships within the wholesale electricity market, during the period 2009 to 2013.
To do so, we developed an analytical framework that facilitated the systematic exploration of the impact that policy measures have on the electricity system and its components. Our framework was built on the premise that assessing how a policy measure affects the performance of the energy market requires the quantification of both the benefits and the costs attributed to it. By exploring the monetary flows in the electricity market, one adopts a holistic view which can provide insights on the interactions between different components of the benefits and costs, as well as on the possible conflicts or alliances between the involved actors of the system. As a result, government officials and consultants in the policy community can gain a clearer perspective on how to devise a roadmap of least resistance for a policy measure to attain its goals. Given that, while European RES targets have been set, governance of RES-E support beyond 2020 at an EU level remains undefined, our work contributes to the scientific literature by empirically studying the impact of the FiTs support mechanism on electricity generation by source, as well as on economic and environmental activity, and by paving the way for a more comprehensive, detailed and better-structured analysis of RES-E policy design than what currently prevails. Although the applicability of our approach is demonstrated for the case of Greece, the analytical framework presented herein can be used to explore the effectiveness of RES support schemes in any geographical context, given that necessary historical data and observations are available.
Our results indicated that the share of wind RES-E achieved by FiTs, owing to the displacement of conventional generators, had a positive environmental impact, highlighting a reduction trend of CO2 emissions. Understanding and analyzing emission trends can contribute to the effective design of policies and practices targeting the achievement of the existing climate goals. However, the large-scale penetration of RES-E alone, does not necessarily imply a more environmental-friendly energy generation approach. Increasing the shares of RES-E in Greece is a step to the right direction; an efficient low-carbon transition though, requires also the inclusion of an appropriate regulatory framework designed to consider factors associated with the adverse impacts of the early stages in the life-cycle of RES. Additionally, our work quantified explicitly the emission savings attributed to the FiTs scheme, decoupled from issues of economic growth. From this aspect, policy priority for breaking the connection between economic growth and GHG emissions is vital to establish a stable RES support framework and a safe environment for investors.
On the other hand, while our results indicated that the capacity of the wind RES-E generation achieved by FiTs did not compromise the reliability of the electricity system, compared to historical data available, this was almost 70% less than the total PV capacity achieved during the period under study. The latter, derived mainly from the fact that FiTs in Greece made it extremely challenging to determine the appropriate RES-E remuneration levels, led to a regulatory failure and market asymmetry at the end of 2013. This information asymmetry between RES generators and policymakers has been also acknowledged by the scientific literature [21]. As a result, since then, the existing market structure and mechanisms are unable to incentivize long-term investments and support the long-term growth of infrastructure, as it is challenging to set an optimal price that considers all the associated costs of future investments. Considering that the country is still in financial distress, special attention must be paid to policy measures that do not undermine market competitiveness. Consequently, to avoid similar rebound effects in the long-term, tailored energy policies, targeting each energy source separately, should be developed, promoting competitiveness among electricity generators through market-based instruments, rather than guaranteed prices. Based on the latter, policymakers and practitioners should also focus on the development of business models and regulatory innovations that will increase the value of the technological infrastructure required towards a high RES and decentralized power system, exploring, in parallel, ways to trigger once again consumer willingness to invest. Finally, decision-makers should envision a more adaptive policymaking process, which, based on the concept of Key Performance Indicators (KPIs), will allow for contingency planning, by monitoring cost reductions owing to technological progress and learning effects, controlling the profit margin of prosumers and limiting public expenses and burdensome charges.

Author Contributions

Conceptualization, V.S. and A.F.; methodology, V.S.; software, V.S. and N.K.; formal analysis, V.S. and N.K.; data curation, V.S. and N.K.; writing—original draft preparation, V.S. and N.K.; writing—review and editing, V.S., N.K. and A.F.; visualization, N.K.; supervision, A.F.; project administration, A.F.; funding acquisition, A.F. All authors have read and agreed to the published version of the manuscript.

Funding

This research was funded by the EC funded Horizon 2020 Framework Program for Research and Innovation (EU H2020) Project titled “Transitions pathways and risk analysis for climate change mitigation and adaption strategies” (TRANSrisk)—Grant Agreement No. 642260. The authors would like to acknowledge the support from the EC. The content of the paper is the sole responsibility of its authors and does not necessary reflect the views of the EC.

Conflicts of Interest

The authors declare no conflict of interest.

Abbreviations

NomenclatureRES-EElectricity generation from RES
Acronyms & AbbreviationsSIMPSystem imbalances marginal price
ARDLAutoregressive distributed lagSMPSystem marginal price
CAcointegration analysisSO2Sulfur dioxide
CATCapacity availability ticketUSAUnited States of America
CEMSContinuous emissions monitoring systemsVARVector autoregressive
CO2Carbon dioxideVCRMVariable cost recovery mechanism
COPTCapacity outage probability tableVECMVector error-correction modeling
CRESCenter of renewable energy sourcesParameters
DASDay-ahead schedulingPNCPNoncompliance penalty value
ECEuropean CommissionεpEmissions coefficient
ECMError-correction modelσAdjustment factor
EFORdDemand equivalent forced outage rateIndices & sets
ELCCEffective load carrying capabilitydIndex of time period
EUEuropean UnionhIndex of time period
FiPsFeed-in-premiumsiIndex
FiTsFeed-in-tariffsjIndex
GHGGreenhouse GasmIndex of time period
HEDNOHellenic Electricity Distribution Network OperatornTotal number of elements in a set
HEMOHellenic Electricity Market OperatortIndex of time period
LAGIEHellenic Operator of Electricity MarketyIndex of time period
IPTOIndependent power transmission operatorVariables
KPIKey performance indicatoraPercentage
LOLELoss of load expectationCCapacity
LOLPLoss of load probabilityCFCapacity factor
MDIMinistry of Development and InvestmentsGGeneration
MEEMinistry of Environment and EnergyLLoad
MWVMarginal water valuePPrice
NECPNational energy and climate planpProbability
NEMNet-meteringWExplanatory variable
NOxNitrogen oxideXCapacity
PMParticulate matterYExplanatory variable
PVPhotovoltaicsZExplanatory variable
RESRenewable energy sources

Appendix A

Table A1. Lignite-based thermal power stations in Greece sorted by their emission factors (data as acquired from [53]).
CO2SO2NOXPM
PlantValuePlantValuePlantValuePlantValue
Megalopolis A1652Megalopolis A8.70Ag. Dimitrios2.16Ptolemaida2.78
Ptolemaida1577Amyntaio8.65Kardia2.08Kardia0.68
Kardia1500Ag. Dimitrios3.11Amyntaio1.37Megalopolis A0.42
Ag. Dimitrios1435Ptolemaida2.73Ptolemaida1.36Amyntaio0.18
Amyntaio1349Florina2.29Megalopolis B1.15Megalopolis B0.12
Megalopolis B1340Kardia1.73Megalopolis A1.09Ag. Dimitrios0.10
Florina1210Megalopolis B0.69Florina0.82Florina0.02
Table A2. Coefficients for the unrestricted error-correction model (ECM) for hour 00:00.
Results: OLS
Model:OLSAIC:21,217.4836
Dependent variable:diff(ngas)BIC:21,346.0190
No. Observations1565Log-Likelihood:−10,585
Df Model:23F-statistic:70.18
Df Residuals:1541Prob (F-statistic):2.64 × 10−220
R-squared:0.512Scale:44,552
Adj. R-squared:0.504
CoefficientStandard ErrortP > |t|[0.0250.975]
const−70.299168.8041−1.02170.3071−205.258764.6606
L1.ngas−0.22760.0200−11.36800.0000−0.2669−0.1883
L1.Load0.06950.01026.79590.00000.04940.0895
L1.RES−0.05200.0384−1.35690.1750−0.12730.0232
L1.Hydro−0.09610.0175−5.49840.0000−0.1304−0.0618
L1.Lignite−0.05250.0165−3.19140.0014−0.0848−0.0202
L1.NGas0.08110.01127.24650.00000.05920.1031
diff(Load)0.36260.013926.10100.00000.33530.3898
diff(RES)−0.42620.0305−13.96030.0000−0.4860−0.3663
diff(Hydro)−0.37180.0236−15.74920.0000−0.4181−0.3255
diff(Lignite)−0.09790.0156−6.28350.0000−0.1285−0.0673
diff(NGas)0.11780.02075.68650.00000.07710.1584
L1.diff(ngas)−0.19700.0272−7.25060.0000−0.2503−0.1437
L1.diff(Load)0.11920.01816.58700.00000.08370.1548
L1.diff(RES)−0.10160.0361−2.81750.0049−0.1724−0.0309
L1.diff(Hydro)−0.01270.0286−0.44600.6557−0.06880.0433
L1.diff(Lignite)−0.07210.0171−4.22860.0000−0.1055−0.0387
L1.diff(NGas)0.05060.02332.16950.03020.00490.0964
L2.diff(ngas)−0.06530.0251−2.59680.0095−0.1146−0.0160
L2.diff(Load)0.05070.01643.08430.00210.01850.0830
L2.diff(RES)−0.05280.0325−1.62520.1043−0.11640.0109
L2.diff(Hydro)0.01460.02540.57560.5650−0.03520.0645
L2.diff(Lignite)−0.01710.0161−1.06580.2867−0.04860.0144
L2.diff(NGas)−0.00070.0210−0.03460.9724−0.04180.0404
Omnibus:46.774Durbin–Watson:2.024
Prob(Omnibus):0.000Jarque–Bera (JB):92.237
Skew:0.188Prob(JB):0.000
Kurtosis:4.128Condition No.:99,643
Table A3. Coefficients for the long-run equilibrium relationship for hour 00:00.
Results: OLS
Model:OLSAIC:22,453.3982
Dependent variable:NgasBIC:22,485.5436
No. Observations1568Log-Likelihood:−11,221
Df Model:5F-statistic:465.1
Df Residuals:1562Prob (F-statistic):4.14 × 10−306
R-squared:0.598Scale:96,575
Adj. R-squared:0.597
CoefficientStandard ErrortP > |t|[0.0250.975]
const−406.445085.9341−4.72970.0000−575.0032−237.8867
Load0.32260.010231.55260.00000.30260.3427
RES−0.37230.0386−9.64330.0000−0.4480−0.2966
Hydro−0.43860.0193−22.68320.0000−0.4765−0.4007
Lignite−0.21900.0172−12.69770.0000−0.2529−0.1852
NGas0.35580.011331.58740.00000.33370.3779
Omnibus:6.508Durbin–Watson:0.659
Prob(Omnibus):0.039Jarque–Bera (JB):6.657
Skew:0.122Prob(JB):0.036
Kurtosis:3.205Condition No.:83,351
Table A4. The volatility of wind RES-E generation in Greece during the period of 2009–2013.
20092010201120122013
Most volatile monthDecemberNovemberSeptemberNovemberMarch
Day of max wind2009/12/252010/11/232011/09/272012/11/292013/3/14
Max wind (MWh)11,75615,46417,75323,32823,014
Day of min wind2009/12/082010/11/162011/09/12012/11/262013/3/1
Min wind (MWh)682556139516262476
Volatility ± . 89% ± 93% ± . 85% ± 87% ± 81%
Table A5. The fossil-fueled power plants in the Greek electricity market during the period of 2009–2013 (as accessed at http://www.admie.gr/fileadmin/groups/EDRETH/CAM/UCAP_12_13.pdf).
Plant NamePlant FuelEFORd (%)Net Capacity (MW)
AG_DIMITRIOS1.Lignite8.302.274
AG_DIMITRIOS2Lignite7.534274
AG_DIMITRIOS3Lignite7.074283
AG_DIMITRIOS4Lignite10.174283
AG_DIMITRIOS5Lignite5.355342
AG_GEORGIOS8Natural gas14.231151
AG_GEORGIOS9Natural gas3.229188
ALIVERI3Oil0.749144
ALIVERI4Oil1.767144
ALOUMINIONatural gas42.39334
AMYNDEO1Lignite11.284273
AMYNDEO2Lignite11.472273
ELPEDISON_THESSNatural gas6.29389.38
ELPEDISON_THISVINatural gas5.67410
HERON1Natural gas6.6749.254
HERON2Natural gas7.7949.254
HERON3Natural gas7.3849.254
HERON_CCNatural gas5.67422.142
KARDIA1Lignite9.815275
KARDIA2Lignite7.607275
KARDIA3Lignite9.658280
KARDIA4Lignite17.76280
KOMOTININatural gas5.88476.3
LAVRIO1Oil3.02123
LAVRIO2Oil8.97287
LAVRIO3Natural gas11.55173.4
LAVRIO4Natural gas6.49550.2
LAVRIO5Natural gas3.11377.66
LIPTOL1Lignite6.4230
LIPTOL2Lignite6.428
MEGALOPOLI1Lignite20.485113
MEGALOPOLI2Lignite20.485113
MEGALOPOLI3Lignite20.485255
MEGALOPOLI4Lignite7.265256
MELITILignite10.141289
PROTERGIA_CCNatural gas5.67432.7
KORINTHOS_POWERNatural gas5.67433.46
PTOLEMAIDA1Lignite27.0764
PTOLEMAIDA2Lignite27.07116
PTOLEMAIDA3Lignite28.4116
TOLEMAIDA4Lignite27.08274
Figure A1. Rolling correlation between wind power capacity factor and the detrended load.
Energies 13 04575 g0a1
Figure A2. Autocorrelation plot for natural gas-fueled generation.
Energies 13 04575 g0a2
Figure A3. Density plot for wind power capacity factor for Greece.
Energies 13 04575 g0a3
Figure A4. LOLP as a function of the Greek system load.
Energies 13 04575 g0a4
Figure A5. Assumed linearity of the LOLP function.
Energies 13 04575 g0a5

References

  1. Michas, S.; Stavrakas, V.; Spyridaki, N.; Flamos, A. Identifying Research Priorities for the further development and deployment of Solar Photovoltaics Identifying Research Priorities for the further development. Int. J. Sustain. Energy 2018, 38, 276–296. [Google Scholar] [CrossRef] [Green Version]
  2. Stavrakas, V.; Spyridaki, N.-A.; Flamos, A. Striving towards the deployment of bio-energy with carbon capture and storage (BECCS): A review of research priorities and assessment needs. Sustainability 2018, 10, 2206. [Google Scholar] [CrossRef] [Green Version]
  3. Cooper, M. Renewable and distributed resources in a post-Paris low carbon future: The key role and political economy of sustainable electricity. Energy Res. Soc. Sci. 2016, 19, 66–93. [Google Scholar] [CrossRef]
  4. Vandyck, T.; Keramidas, K.; Saveyn, B.; Kitous, A.; Vrontisi, Z. A global stocktake of the Paris pledges: Implications for energy systems and economy. Glob. Environ. Chang. 2016, 41, 46–63. [Google Scholar] [CrossRef]
  5. Ackermann, T.; Andersson, G.; Söder, L. Overview of government and market driven programs for the promotion of renewable power generation. Renew. Energy 2000, 22, 197–204. [Google Scholar] [CrossRef]
  6. Hirth, L. The market value of variable renewables: The effect of solar wind power variability on their relative price. Energy Econ. 2013, 38, 218–236. [Google Scholar] [CrossRef] [Green Version]
  7. Ringel, M. Fostering the use of renewable energies in the European Union: The race between feed-in tariffs and green certificates. Renew. Energy 2006, 31, 1–17. [Google Scholar] [CrossRef]
  8. Butler, L.; Neuhoff, K. Comparison of feed-in tariff, quota and auction mechanisms to support wind power development. Renew. Energy 2008, 33, 1854–1867. [Google Scholar] [CrossRef] [Green Version]
  9. Campoccia, A.; Dusonchet, L.; Telaretti, E.; Zizzo, G. An analysis of feed’in tariffs for solar PV in six representative countries of the European Union. Sol. Energy 2014, 107, 530–542. [Google Scholar] [CrossRef]
  10. Li, S.J.; Chang, T.H.; Chang, S.L. The policy effectiveness of economic instruments for the photovoltaic and wind power development in the European Union. Renew. Energy 2017, 101, 660–666. [Google Scholar] [CrossRef]
  11. Fuchs, C.; Kasten, J.; Vent, M. Current State and Future Prospective of Repowering Wind Turbines: An Economic Analysis. Energies 2020, 13, 3048. [Google Scholar] [CrossRef]
  12. Nicolini, M.; Tavoni, M. Are renewable energy subsidies effective? Evidence from Europe. Renew. Sustain. Energy Rev. 2017, 74, 412–423. [Google Scholar] [CrossRef]
  13. Koumparou, I.; Christoforidis, G.C.; Efthymiou, V.; Papagiannis, G.K.; Georghiou, G.E. Configuring residential PV net-metering policies—A focus on the Mediterranean region. Renew. Energy 2017, 113, 795–812. [Google Scholar] [CrossRef]
  14. Antonelli, M.; Desideri, U. The doping effect of Italian feed-in tariffs on the PV market. Energy Policy 2014, 67, 583–594. [Google Scholar] [CrossRef]
  15. Couture, T.D.; Cory, K.; Kreycik, C.; Williams, E. Policymaker’s Guide to Feed-in Tariff Policy Design; National Renewable Energy Lab.: Golden, CO, USA, 2010. [Google Scholar]
  16. Frondel, M.; Schmidt, C.M.; Vance, C. Revisiting Germany’s solar cell promotion: An unfolding disaster. Econ. Anal. Policy 2014, 44, 3–13. [Google Scholar] [CrossRef]
  17. De Boeck, L.; Van Asch, S.; De Bruecker, P.; Audenaert, A. Comparison of support policies for residential photovoltaic systems in the major EU markets through investment profitability. Renew. Energy 2016, 87, 42–53. [Google Scholar] [CrossRef]
  18. Kyritsis, A.; Voglitsis, D.; Papanikolaou, N.; Tselepis, S.; Christodoulou, C.; Gonos, I.; Kalogirou, S.A. Evolution of PV systems in Greece and review of applicable solutions for higher penetration levels. Renew. Energy 2017, 109, 487–499. [Google Scholar] [CrossRef]
  19. Stavrakas, V.; Flamos, A. A modular high-resolution demand-side management model to quantify benefits of demand-flexibility in the residential sector. Energy Convers. Manag. 2020, 205, 112339. [Google Scholar] [CrossRef]
  20. Mart, H.; Coronas, S.; Alonso, À.; de Hoz, J.; Matas, J. Renewable Energy Auction Prices: Near Subsidy-Free? Energies 2020, 13, 3383. [Google Scholar]
  21. Batlle, C.; Pérez-Arriaga, I.J.; Zambrano-Barragán, P. Regulatory design for RES-E support mechanisms: Learning curves, market structure, and burden-sharing. Energy Policy 2012, 41, 212–220. [Google Scholar] [CrossRef] [Green Version]
  22. Eid, C.; Guillén, J.R.; Marín, P.F.; Hakvoort, R. The economic effect of electricity net-metering with solar PV: Consequences for network cost recovery, cross subsidies and policy objectives. Energy Policy 2014, 75, 244–254. [Google Scholar] [CrossRef]
  23. Nikolaidis, A.I.; Milidonis, A.; Charalambous, C.A. Impact of fuel-dependent electricity retail charges on the value of net-metered PV applications in vertically integrated systems. Energy Policy 2015, 79, 150–160. [Google Scholar] [CrossRef]
  24. Ramïrez, F.J.; Honrubia-Escribano, A.; Gómez-Lázaro, E.; Pham, D.T. Combining feed-in tariffs and net-metering schemes to balance development in adoption of photovoltaic energy: Comparative economic assessment and policy implications for European countries. Energy Policy 2017, 102, 440–452. [Google Scholar] [CrossRef]
  25. Danchev, S.; Maniatis, G.; Tsakanikas, A. Returns on investment in electricity producing photovoltaic systems under de-escalating feed-in tariffs: The case of Greece. Renew. Sustain. Energy Rev. 2010, 14, 500–505. [Google Scholar] [CrossRef]
  26. Papaioannou, G.P.; Dikaiakos, C.; Dagoumas, A.S.; Dramountanis, A.; Papaioannou, P.G. Detecting the impact of fundamentals and regulatory reforms on the Greek wholesale electricity market using a SARMAX/GARCH model. Energy 2017, 142, 1083–1103. [Google Scholar] [CrossRef]
  27. Michas, S.; Stavrakas, V.; Papadelis, S.; Flamos, A. A transdisciplinary modeling framework for the participatory design of dynamic adaptive policy pathways. Energy Policy 2020, 139. [Google Scholar] [CrossRef]
  28. Sotiriou, C.; Michopoulos, A.; Zachariadis, T. On the cost-effectiveness of national economy-wide greenhouse gas emissions abatement measures. Energy Policy 2019, 128, 519–529. [Google Scholar] [CrossRef]
  29. Newbery, D.; Pollitt, M.G.; Ritz, R.A.; Strielkowski, W. Market design for a high-renewables European electricity system. Renew. Sustain. Energy Rev. 2018, 91, 697–707. [Google Scholar] [CrossRef] [Green Version]
  30. Iychettira, K.K.; Hakvoort, R.A.; Linares, P. Towards a comprehensive policy for electricity from renewable energy: An approach for policy design. Energy Policy 2017, 106, 169–182. [Google Scholar] [CrossRef]
  31. Nikas, A.; Stavrakas, V.; Arsenopoulos, A.; Doukas, H.; Antosiewicz, M.; Witajewski-Baltvilks, J.; Flamos, A. Barriers to and consequences of a solar-based energy transition in Greece. Environ. Innov. Soc. Transit. 2018, 35. [Google Scholar] [CrossRef]
  32. Papadelis, S.; Stavrakas, V.; Flamos, A. What do capacity deployment rates tell us about the efficiency of electricity generation from renewable energy sources support measures in Greece? Energies 2016, 9, 38. [Google Scholar] [CrossRef] [Green Version]
  33. Anagnostopoulos, P.; Spyridaki, N.A.; Flamos, A. A “new-deal” for the development of photovoltaic investments in Greece? A parametric techno-economic assessment. Energies 2017, 10, 1173. [Google Scholar] [CrossRef]
  34. Giannini, E.; Moropoulou, A.; Maroulis, Z.; Siouti, G. Penetration of photovoltaics in Greece. Energies 2015, 8, 6497–6508. [Google Scholar] [CrossRef]
  35. Karteris, M.; Papadopoulos, A.M. Legislative framework for photovoltaics in Greece: A review of the sector’s development. Energy Policy 2013, 55, 296–304. [Google Scholar] [CrossRef]
  36. Marques, A.C.; Fuinhas, J.A.; Macedo, D.P. The impact of feed-in and capacity policies on electricity generation from renewable energy sources in Spain. Util. Policy 2019, 56, 159–168. [Google Scholar] [CrossRef]
  37. Hellenic Republic. National Energy and Climate Plan of Greece; European Commission: Brussels, Belgium, 2019. [Google Scholar]
  38. European Commission. Communication from the Commission: The European Green Deal; European Commission: Brussels, Belgium, 2019. [Google Scholar]
  39. Sotiriou, C.; Zachariadis, T. Optimal timing of greenhouse gas emissions abatement in Europe. Energies 2019, 12, 1872. [Google Scholar] [CrossRef] [Green Version]
  40. Taliotis, C.; Giannakis, E.; Karmellos, M.; Fylaktos, N.; Zachariadis, T. Estimating the economy-wide impacts of energy policies in Cyprus. Energy Strategy Rev. 2020, 29, 100495. [Google Scholar] [CrossRef]
  41. Engle, R.F.; Granger, C.W.J. Co-Integration and Error Correction: Representation, Estimation, and Testing. Econometrica 1987, 55, 251–276. [Google Scholar] [CrossRef]
  42. De Jong, C.; Schneider, S. Cointegration between gas and power spot prices. J. Energy Mark. 2009, 2, 27–46. [Google Scholar] [CrossRef]
  43. Bosco, B.; Parisio, L.; Pelagatti, M.; Baldi, F. Long-run relations in European electricity prices. J. Appl. Econom. 2010, 25, 805–832. [Google Scholar] [CrossRef]
  44. Ferkingstad, E.; Løland, A.; Wilhelmsen, M. Causal modeling and inference for electricity markets. Energy Econ. 2011, 33, 404–412. [Google Scholar] [CrossRef] [Green Version]
  45. Chen, Z.; Wu, L.; Shahidehpour, M. Effective load carrying capability evaluation of renewable energy via stochastic long-term hourly based SCUC. IEEE Trans. Sustain. Energy 2015, 6, 188–197. [Google Scholar] [CrossRef]
  46. Keane, A.; Milligan, M.; Dent, C.J.; Hasche, B.; D’Annunzio, C.; Dragoon, K.; Holttinen, H.; Samaan, N.; Söder, L.; O’Malley, M. Capacity value of wind power. IEEE Trans. Power Syst. 2010, 26, 564–572. [Google Scholar] [CrossRef] [Green Version]
  47. Kahn, E.P. Capability of Wind Generation: Initial Results with Public Data. Electr. J. 2004, 17, 85–95. [Google Scholar]
  48. Independent Power Transmission Operator (IPTO). Market Statistics and Data Relating to the Operation of the Greek Wholesale Electricity Market. Available online: https://www.admie.gr/agora/statistika-agoras/dedomena (accessed on 8 August 2020).
  49. Sakellaris, K. The greek capacity adequacy mechanism: Design, incentives, strategic behavior and regulatory remedies. In Proceedings of the 6th International Conference on the European Energy Market (EEM), Leuven, Belgium, 27–29 May 2009; IEEE: Piscataway, NJ, USA, 2009; pp. 1–6. [Google Scholar]
  50. Biskas, P.N.; Marneris, I.G.; Chatzigiannis, D.I.; Roumkos, C.G.; Bakirtzis, A.G.; Papalexopoulos, A. High-level design for the compliance of the Greek wholesale electricity market with the Target Model provisions in Europe. Electr. Power Syst. Res. 2017, 152, 323–341. [Google Scholar] [CrossRef]
  51. Flamos, A. A sectoral micro-economic approach to scenario selection and development: The case of the greek power sector. Energies 2016, 9, 77. [Google Scholar] [CrossRef]
  52. Kaldellis, J.K.; Zafirakis, D.; Kondili, E. Contribution of lignite in the Greek electricity generation: Review and future prospects. Fuel 2009, 88, 475–489. [Google Scholar] [CrossRef]
  53. Kaldellis, J.K.; Kapsali, M. Evaluation of the long-term environmental performance of Greek lignite-fired power stations. Renew. Sustain. Energy Rev. 2014, 31, 472–485. [Google Scholar] [CrossRef]
  54. De Gouw, J.A.; Parrish, D.D.; Frost, G.J.; Trainer, M. Reduced emissions of CO2, NOx, and SO2 from U.S. power plants owing to switch from coal to natural gas. Earths Future 2014, 2, 75–82. [Google Scholar] [CrossRef]
  55. Granger, C.W.J. Investigating Causal Relations by Econometric Models and Cross-spectral Methods. Econometrica 1969, 37, 424–438. [Google Scholar] [CrossRef]
  56. Stavrakas, V.; Papadelis, S.; Flamos, A. An agent-based model to simulate technology adoption quantifying behavioural uncertainty of consumers. Appl. Energy 2019, 255, 113795. [Google Scholar] [CrossRef]
  57. Loumakis, S.; Giannini, E.; Maroulis, Z. Renewable Energy Sources Penetration in Greece: Characteristics and Seasonal Variation of the Electricity Demand Share Covering. Energies 2019, 12, 2441. [Google Scholar] [CrossRef] [Green Version]
  58. Tipping, J.P.; Read, G.E.; Mcnickle, D. The Incorporation of Hydro Storage into a Spot Price Model for the New Zealand Electricity Market. In Proceedings of the Sixth European Energy Conference: Modelling in Energy Economics and Policy, Zurich, Switzerland, 2–3 September 2004; pp. 1–25. [Google Scholar]
  59. Uddin, M.; Romlie, M.F.; Abdullah, M.F.; Abd Halim, S.; Abu Bakar, A.H.; Kwang, T.C. A review on peak load shaving strategies. Renew. Sustain. Energy Rev. 2018, 82, 3323–3332. [Google Scholar] [CrossRef]
  60. Pesaran, M.H.; Shin, Y. An Autoregressive Distributed Lag Modelling Approach to Cointegration Analysis in Econometrics and Economic Theory in the 20th Century: The Ragnar Frisch Centennial Symposium. In Econometrics and Economic Theory in the 20th Century: The Ragnar Frisch Centennial Symposium; Cambridge University Press: Cambridge, UK, 1999; pp. 1–31. ISBN 9781139052221. [Google Scholar]
  61. Pesaran, M.H.; Shin, Y.; Smith, R.J. Bounds testing approaches to the analysis of level relationships. J. Appl. Econom. 2001, 16, 289–326. [Google Scholar] [CrossRef]
  62. Salim, R.A.; Hassan, K.; Shafiei, S. Renewable and non-renewable energy consumption and economic activities: Further evidence from OECD countries. Energy Econ. 2014, 44, 350–360. [Google Scholar] [CrossRef] [Green Version]
  63. Behrens, P.; Rodrigues, J.F.D.; Brás, T.; Silva, C. Environmental, economic, and social impacts of feed-in tariffs: A Portuguese perspective 2000–2010. Appl. Energy 2016, 173, 309–319. [Google Scholar] [CrossRef] [Green Version]
  64. Roinioti, A.; Koroneos, C. The decomposition of CO2 emissions from energy use in Greece before and during the economic crisis and their decoupling from economic growth. Renew. Sustain. Energy Rev. 2017, 76, 448–459. [Google Scholar] [CrossRef]
  65. Kim, H.; Kim, M.; Kim, H.; Park, S. Decomposition Analysis of CO2 Emission from Electricity Generation: Comparison of OECD Countries before and after the Financial Crisis. Energies 2020, 13, 3522. [Google Scholar] [CrossRef]
  66. Hatzigeorgiou, E.; Polatidis, H.; Haralambopoulos, D. CO2 emissions in Greece for 1990–2002: A decomposition analysis and comparison of results using the Arithmetic Mean Divisia Index and Logarithmic Mean Divisia Index techniques. Energy 2008, 33, 492–499. [Google Scholar] [CrossRef]
  67. Diakoulaki, D.; Mavrotas, G.; Orkopoulos, D.; Papayannakis, L. A bottom-up decomposition analysis of energy-related CO2 emissions in Greece. Energy 2006, 31, 2638–2651. [Google Scholar] [CrossRef]
  68. Lu, S.; Diao, R.; Samaan, N.; Etingov, P. Capacity Value of PV and Wind Generation in the NV Energy System; Pacific Northwest National Lab.: Richland, WA, USA, 2012. [Google Scholar]
Figure 1. Influence of electricity generation from RES (RES-E) growth on different aspects of the electricity system over the past few years.
Energies 13 04575 g001
Figure 2. Major monetary flows in the Greek wholesale electricity market from 2009 to 2013.
Energies 13 04575 g002
Figure 3. Causal relationships within the wholesale electricity market in Greece during the period 2009 to 2013.
Energies 13 04575 g003
Figure 4. Daily data of electricity demand in Greece during the period March 2009 to November 2013 (data as acquired from [48]).
Energies 13 04575 g004
Figure 5. Daily wind power generation in Greece during the period March 2009 to November 2013 (data as acquired from [48]).
Energies 13 04575 g005
Figure 6. Daily wind capacity factor in Greece during the period March 2009 to November 2013 (data as acquired from [48]).
Energies 13 04575 g006
Figure 7. Daily generation from lignite-fueled plants in Greece during the period March 2009 to November 2013 (data as acquired from [48]).
Energies 13 04575 g007
Figure 8. Daily generation from natural gas-fueled plants in Greece during the period March 2009 to November 2013 (data as acquired from [48]).
Energies 13 04575 g008
Figure 9. Monthly hydro and natural gas-fueled generation during the period March 2009 to September 2013 (data as acquired from [48]).
Energies 13 04575 g009
Figure 10. Components of hydroelectric production.
Energies 13 04575 g010
Figure 11. Evolution of the monthly weighted average import price of natural gas in Greece during the period 2009 to 2013.
Energies 13 04575 g011
Figure 12. Economic benefits from natural gas imports avoided owing to the substitute of the natural gas-fueled generation by the wind RES-E generation achieved with feed-in-tariffs (FiTs) policy measure in Greece, during the period of 2009–2013.
Energies 13 04575 g012
Figure 13. CO2 emissions avoided owing to lignite-fueled generation offset by the wind RES-E generation from FiTs in Greece during the period 2009 to 2013.
Energies 13 04575 g013
Figure 14. CO2 emissions avoided owing to natural gas-fueled generation offset by the wind RES-E generation from FiTs in Greece during the period 2009 to 2013.
Energies 13 04575 g014
Figure 15. Capacity outage probability table (COPT) curve for the electricity market in Greece as a function of the system’s available capacity.
Energies 13 04575 g015
Figure 16. Loss of load probability (LOLP) curve as a function of the Greek residual load from October 2012 to September 2013.
Energies 13 04575 g016
Table 1. Coefficients of the long-run equilibrium relationship for natural gas- and lignite-fueled generation.
Natural GasLignite
Hour of the Day
01016200101620
Load0.320.410.380.460.410.350.370.34
RES−0.37−0.42−0.40−0.43−0.31−0.27−0.33−0.25
Hydro−0.44−0.37−0.35−0.28−0.53−0.46−0.49−0.40
NGas0.360.300.280.30−0.12−0.10−0.11−0.08
Lignite−0.22−0.25−0.24−0.240.310.370.370.38

