Article

Effective Electricity Theft Detection in Power Distribution Grids Using an Adaptive Neuro Fuzzy Inference System

by
Konstantinos V. Blazakis
1,*,
Theodoros N. Kapetanakis
2 and
George S. Stavrakakis
1
1
School of Electrical and Computer Engineering, Technical University of Crete, University Campus, GR-73100 Chania, Greece
2
Department of Electronic Engineering, Hellenic Mediterranean University, GR-73100 Chania, Greece
*
Author to whom correspondence should be addressed.
Energies 2020, 13(12), 3110; https://doi.org/10.3390/en13123110
Submission received: 28 April 2020 / Revised: 23 May 2020 / Accepted: 12 June 2020 / Published: 16 June 2020

Abstract

:
Electric power grids are a crucial infrastructure for the proper operation of any country and must be preserved from various threats. Detection of illegal electricity power consumption is a crucial issue for distribution system operators (DSOs). Minimizing non-technical losses is a challenging task for the smooth operation of electrical power system in order to increase electricity provider’s and nation’s revenue and to enhance the reliability of electrical power grid. The widespread popularity of smart meters enables a large volume of electricity consumption data to be collected and new artificial intelligence technologies could be applied to take advantage of these data to solve the problem of power theft more efficiently. In this study, a robust artificial intelligence algorithm adaptive neuro fuzzy inference system (ANFIS)—with many applications in many various areas—is presented in brief and applied to achieve more effective detection of electric power theft. To the best of our knowledge, there are no studies yet that involve the application of ANFIS for the detection of power theft. The proposed technique is shown that if applied properly it could achieve very high success rates in various cases of fraudulent activities originating from unauthorized energy usage.

1. Introduction

Nowadays, societies are even more dependent on electricity due to the extinction of fossil fuels and revolutionary shifts to electric mobility. Electricity power losses occur naturally during the entire operation of the electrical network grid, but the vast amount of losses is caused by electricity theft mainly in the power distribution network. Detection of power theft is an important issue worldwide nowadays in order to preserve the reliability and the more profitable operation of the electricity distribution power grids. Nevertheless, power theft percentages are very small in industrialized countries, in absolute terms they lead to a considerable amount of electrical energy that is not billed [1,2,3].
Technical losses are an inherent consequence of the operation in any electricity distribution network and arise as the power flows through equipment such as cables, overhead lines and transformers. Technical losses are also related to low power quality occurrence due to the voltage variations, the frequency fluctuations as well as the power fluctuations because of the small time period demand events, the long time period demand events or the seasonal power variations in general [4].
Non-technical power grid losses (NTLs) are defined as the energy that is distributed, but not billed mainly due to illegal actions external of the power system and to conditions that technical losses computations fail to take into consideration. A large proportion of non-technical losses are due to theft and frauds (meter tampering and illegal grid manipulations). NTLs are often non-countable by the distribution system operators and due to the fact that they have no recorded information it is too difficult or even impossible to be measured. The reasons of power theft are plenty such as high price of the kilowatt–hour and secondary electricity charges, a low subsistence level of a consumer, tax purposes, weak accountability of law enforcement, economic crisis and consequently increased poverty, etc. [5,6].
There are many techniques for power theft to take place, such as tapping energy directly from an overhead distribution feeder, grounding the neutral cable, putting a magnet on an electromechanical meter, insert a disc in order to stop the coil rotation, hitting the meter to damage the rotating coil, interchanging the input connection with the output connections, etc. [7].
Researchers adopt methods from different fields of knowledge with the most common ones being machine learning, anomaly detection, cyber security and of course network analysis for power theft detection purposes. The various NTLs detection schemes are organized in three large categories: data oriented methods, network oriented methods and hybrid methods. Data oriented methods make use of consumer related data only (for example energy consumption records, consumer type, etc.) while the network oriented methods are based mainly on the power grid data (network topology or network real time measurements). Hybrid methods use data from both categories. Various data oriented, network oriented and hybrid methods can be found in the literature [1,2,3].
The most common data oriented methods in bibliography are indicatively: support vector machines (SVM) [7,8,9,10], artificial neural networks (ANN) [11], Bayesian networks and decision trees [12], extreme learning machines (ELM) [5], optimum-path forest (OPF) [13], fuzzy clustering [4] and deep learning [14,15,16,17,18,19] or various combinations of those. Widely used algorithms such as support-vector machines and artificial neural networks have a remarkable performance in detecting the power theft while they are widely used in many research areas.
The most common network oriented methods are the monitoring of the power flow of the distribution grid [20] and the malicious meter inspection [21,22,23,24].
Hybrid oriented methods found in the bibliography are: SVM (support-vector machines) based methods [25,26] and grid state estimation methods [27]. Machine learning techniques having already indicated satisfactory performance in NTLs detection cases present several advantages. However, tasks such as the quality of data, the choice of features to extract and the choice of metrics need special attention due to the fact that they affect the performance of the classifier in each particular case, see [3,28,29].
In this work the adaptive neuro fuzzy inference system (ANFIS) is proposed and applied in cases that residential energy consumption patterns are used for power theft detection in a smart grid environment. Electronic meters (smart meters) record electricity consumption from the consumers several times per day and these records are used for monitoring, billing, power theft detection, etc.
The main contributions of this study are:
  • The adaptive neuro fuzzy inference system (ANFIS) is proposed and applied for first time in power theft detection for local low voltage power distribution network;
  • Thirteen different scenarios possible to occur in the real world are established and presented analytically, in order to justify their importance in the proper operation of the power distribution network and they are used in the simulated and discussed case studies in the following;
  • High success rates in power theft detection for most those realistic power theft scenarios were achieved; The adaptive neuro fuzzy inference system (ANFIS) is proposed, implemented and has achieved great success in classifying residential energy consumption patterns to be legal or illegal.
The rest of this study is organized as follows: Section 2 (the proposed machine learning model framework) describes in brief the ANFIS algorithm used, presents the adopted power theft scenarios and the steps followed for the ANFIS algorithm applications in the simulated case studies for the theft detection achievement. In Section 3 (performance and discussion) the simulations results and their discussion is presented while in the Section 4 the conclusions of the study are summarized.

2. The Proposed Machine Learning Model Framework

2.1. The ANFIS Classification Method

The ANFIS classification method first proposed in [30], was introduced as the combination of two different innovative techniques, i.e., of the ANNs and the fuzzy set theory, which have been successfully applied to solve problems in different scientific fields. The benefits of this combination makes ANFIS appropriate for the purposes of the present research. In more detail, ANFIS integrates the capability of ANNs to learn by example using the back-propagation training algorithm (BP) and the deployment of a Sugeno fuzzy inference system (FIS) from the fuzzy logic approach [30,31].
The architecture of the ANFIS network is shown in Figure 1. Consist of five layers, the fuzzy layer, the product layer, the normalized layer, the defuzzification layer and the summation layer, where the output of each layer is denoted as O L , i , where L = 1, 2, …, 5 [30]:
Layer 1: Every node i here in is an adaptive inference node with a node function defined as following:
O 1 , i = μ A i ( x ) ; for i = 1 , 2 , or   O 1 , i = μ B i 2 ( y ) ; for i = 3 , 4
where, x (or y) is the input to node i, Ai (or Bi−2) is a linguistic variable associated with this node.
Here the membership function for Ai can be any appropriate parameterized membership function [32].
Layer 2: Every node in this layer is a fixed node labeled Π, whose output is the product of all the incoming signals representing the firing strength of a rule or in other words performing the fuzzy AND operation:
O 2 , i = w i = μ A i ( x ) μ B i ( y ) ; i = 1 , 2
Layer 3: Every node in this layer is a fixed node labeled N. The node i calculates the ratio of the i–th rule’s firing strength to the sum of all rules’ firing strengths. The output of this layer is called normalized fire strength:
O 3 , i = w ¯ i = w i / ( w 1 + w 2 ) ; i = 1 , 2
Layer 4: Every node i in this layer is an adaptive node-with-node function defined as:
O 4 , i = w ¯ i f i = w ¯ i ( p i x + q i y + r i )
where   w ¯ i is a normalized firing strength from layer 3 and (pi, qi, ri) is the parameter set of this node. The parameters in this layer are referred as consequent parameters.
Layer 5: The single node in this layer is a fixed node, which computes the overall output as the summation of all the incoming signals:
O 5 , i = i w ¯ i f i = ( i w i f i ) / i w i
The training procedure of the network is carried out in two phases. During the forward propagation of the signals (from the input to the output) the premise parameters (pi, qi, ri) remain unchanged and the LSM algorithm extract the consequent parameters. On the other hand, during back propagation (from the output to the input) the premise parameters are extracted using the gradient descent method (GDM) [30].

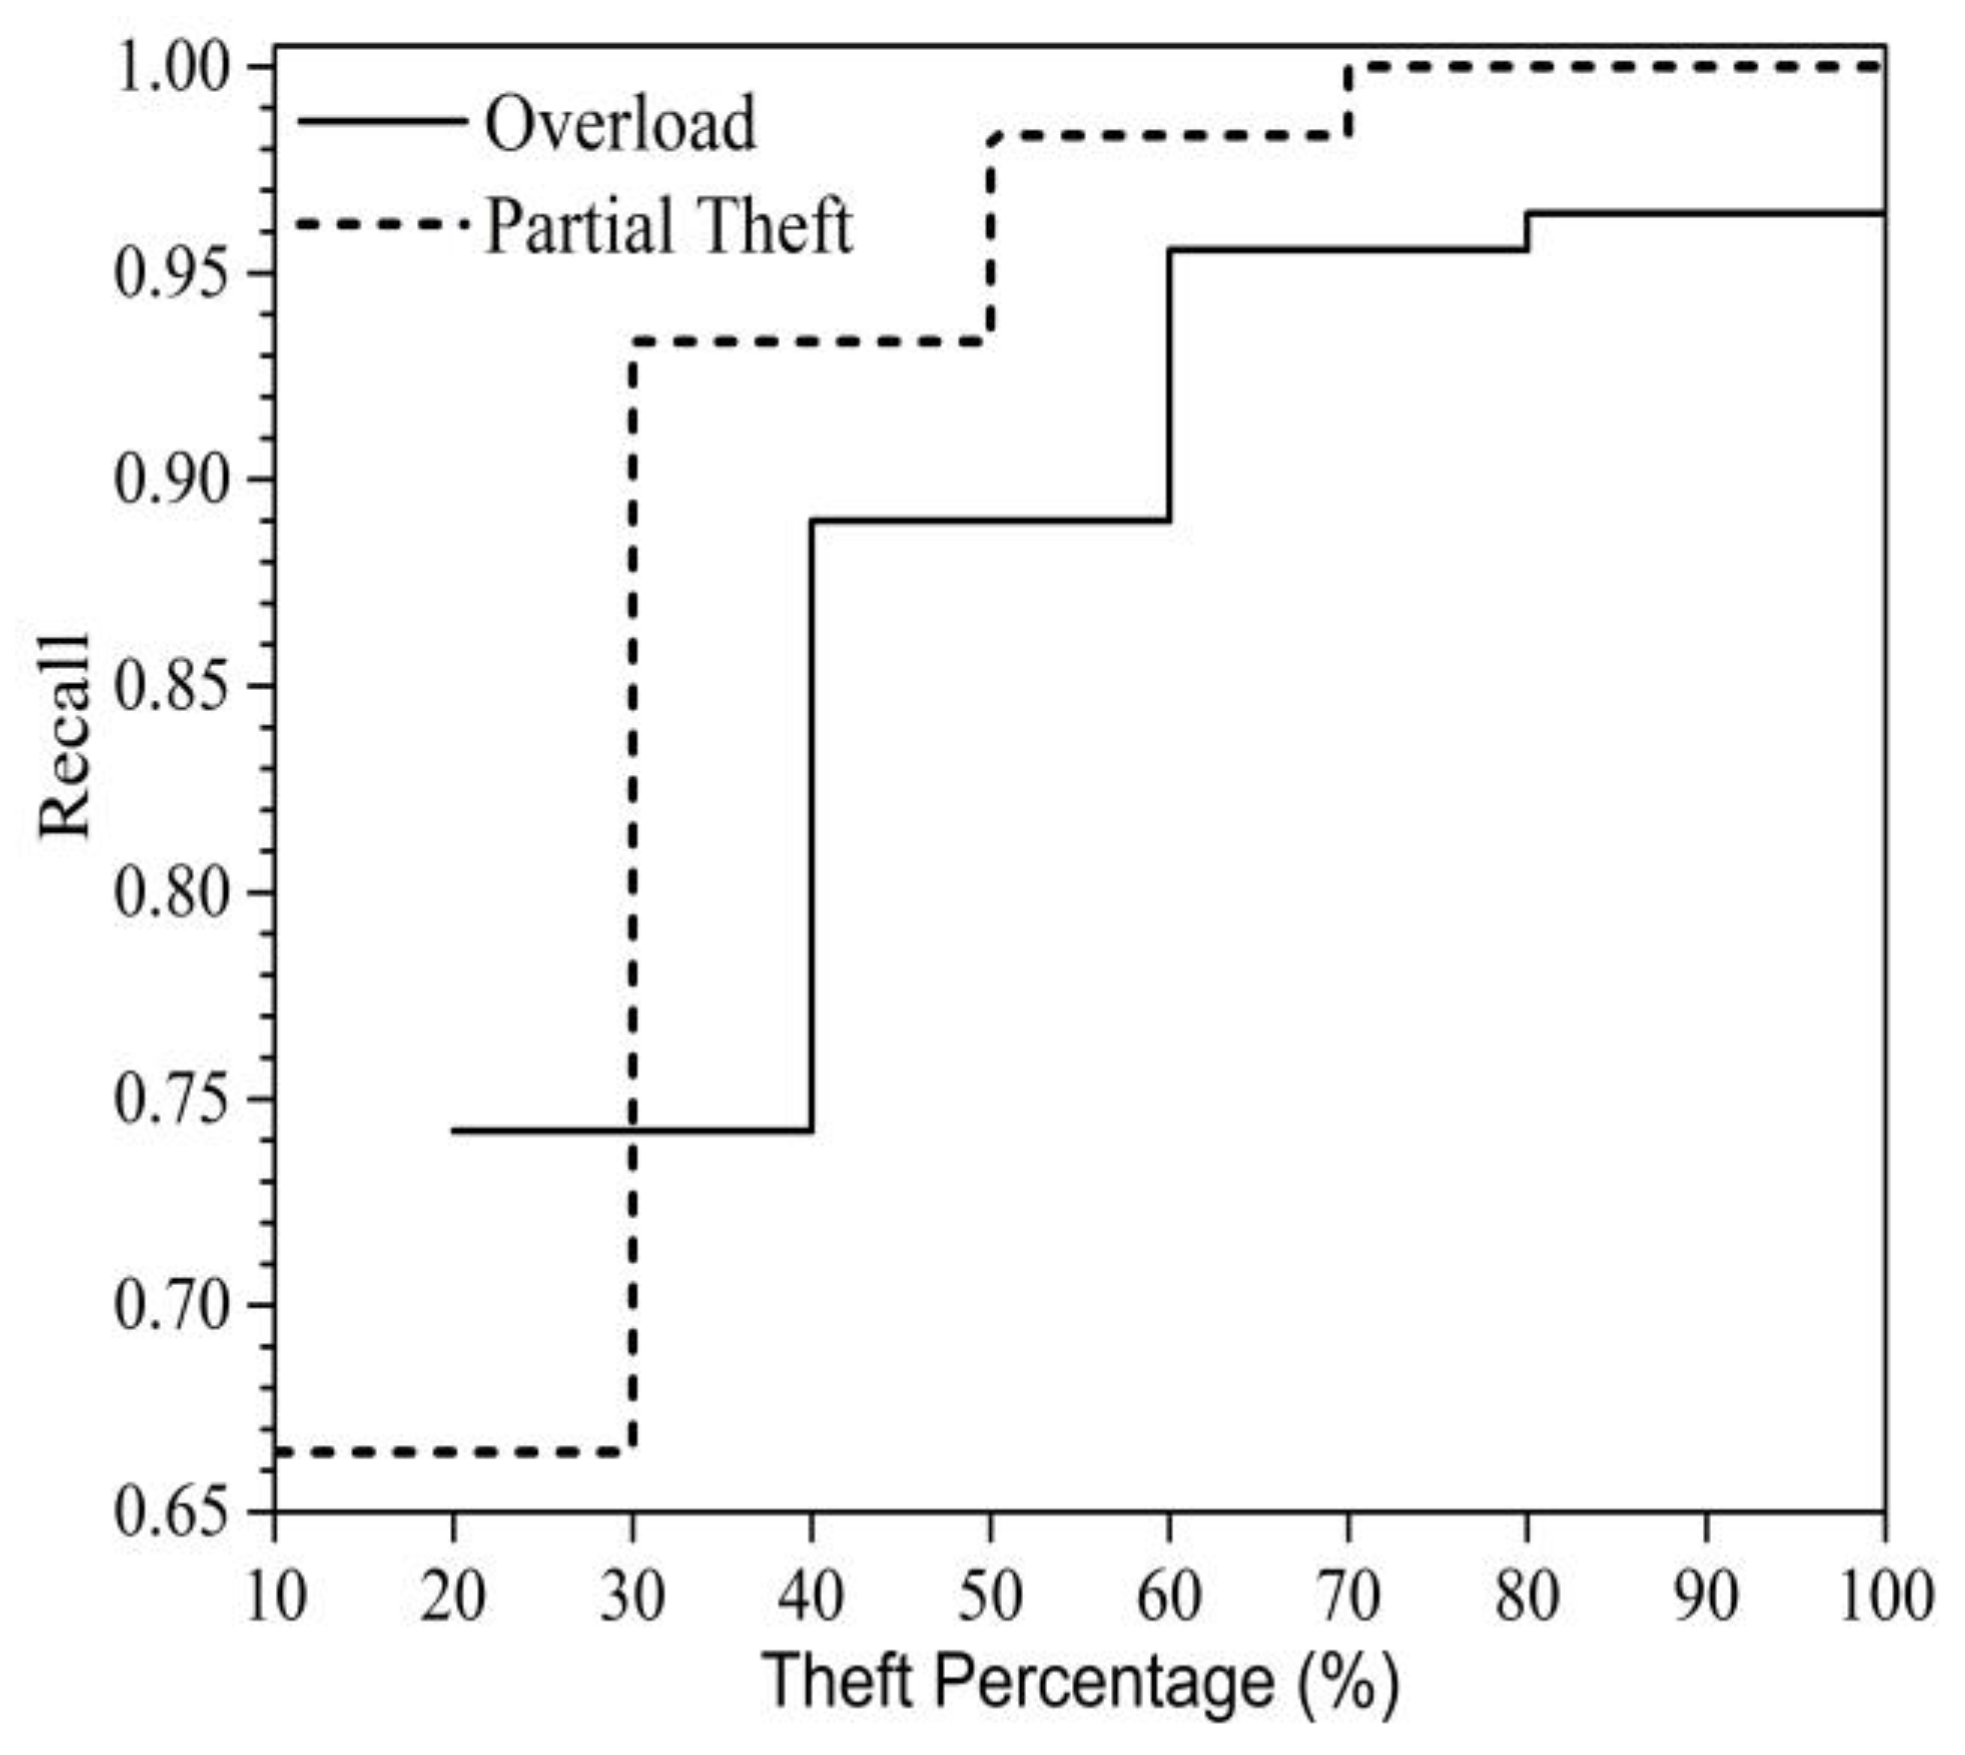
2.2. Power Theft Scenarios

The consumers’ electricity consumption pattern may differ from the legal consumption due to several factors. These factors can be temporary, periodic or permanent consumption changes which are related mainly to the power theft occurrences. For the purposes of the present research three basic power theft scenarios w.r.t legal consumption (Normal) were considered, as it is shown in Figure 2, which are very close to the reality [25]. These are: (a) consumers with smart meter stealing a part of the electricity (Partial theft) of their overall consumption (possibly power pass before the smart meter), (b) consumers with abruptly increased consumption of electricity (Overload), (possible illegal activity or power delivery to a building without legal authorization for power supply), (c) consumers with smart meter stealing a part of the totally supplied electricity (periodic theft) during specific hours of the day, which a high demand of electric power consumption occurs.
Furthermore, different percentages of power theft for the three basic scenarios and the combinations of them were taken into account due to the fact that in an electricity provider database different types of power theft are recorded [25,33,34]. The percentages for partial power theft (PTi) were considered from 10%–90% of the overall consumption. For abruptly increased consumption (Ok) the percentages are from 20%–100% of the overall consumption. For partial power theft specific times of the day (PDm) were considered two scenarios with 80% power theft in time periods that the consumers have a large amount of consumption. These periods are from 12:00 p.m.–15:00 p.m. and from 20:00 p.m.–22:00 p.m. for PD1 and from 12:00 p.m.–15:00 p.m. for PD2. The scenario (Mn) is a combination of the above power theft scenarios, as summarized in Table 1 below.

2.3. Electricity Consumption Data Preprocess and ANFIS Configuration

The dataset used is based on the real smart metering data of approximately 5000 Irish households monitored for one and a half years [35]. After data preprocessing 3273 consumers have been chosen in order to conduct the experiments. The consumption pattern (Cp) for each consumer, consists of the electricity consumption data logged at 30 min intervals. This dataset resulted from an electricity consumer behavior trial scheduled and performed by the Irish Commission for Energy Regulation (CER). For this reason and without loss of generality these energy consumption data were initially considered as no containing power theft incidents [25,36].
For the purposes of the present research a random selection of 1000 consumers from the total 3273 were considered as illegal consumers and consequently it was necessary to apply the power theft scenarios in their electricity consumption data in order to generate the power theft cases which are referred in Table 1 above. As a result, thirteen datasets were constructed corresponding to each of the power theft scenarios of Table 1. In order to select the appropriate ANFIS parameters the criterion applied was the misclassification error to be minimized. Trial and error implementations on the type of membership functions (MF), the number of the MF were performed in order to select the optimal parameters for each applied ANFIS model j, j = 1, 2, …., 12, 13 corresponding to each scenario of Table 1 and they are shown in Table 2. Due to the 10-fold cross validation method used for the validation of the ANFIS classifier, the consumers dataset is randomly divided by a factor of 10 [37]. Thus, 10 random subdatasets of the total (3273) consumers are created, resulting approximately 327 consumers randomly put in each subdataset.
In Figure 3 the procedure followed for the detection of fraudulent consumers is presented in a form of block diagram. For the whole consumption (one and a half year) of each consumer among the 3273 consumers, a number of common classification features are calculated and tested. These features are: The mean, the median, the skewness, the entropy, the variance, the standard deviation, the kurtosis, the energy and the load factor of the data, the calculation formulas of which are presented analytically in Table 3 below.
In order to select the appropriate number and type of features which maximize the classification’s process the well-known neighborhood component analysis (NCA) is used [32]. Applying feature selection and computing the ranking importance of features ends up to four top scoring features as inputs, i.e., the mean, the median, the entropy and the load factor of the data, as it is shown in Figure 4.
Afterwards, the datasets for each power theft scenario divided randomly in 10 subdata matrices (by using the aforementioned 10-fold cross validation method) were inserted into each ANFISj model for the analysis and the classification of the consumers in legal and illegal, respectively.

3. Performance and Discussion

In this section, the performance of the conducted simulations of the thirteen power theft scenarios of Table 1 is discussed in order to assess the robustness of the proposed ANFIS algorithm. In Figure 5, Figure 6 and Figure 7 the worst confusion matrices are shown of the 10-fold validation method applied for each power theft scenario created to evaluate the power theft detection performance of the ANFIS algorithm. The confusion matrices indicated four result types: (a) TP (true positive) is a fraudster consumer correctly classified as fraudster; (b) FN (false negative) is a fraudster consumer incorrectly classified as non-fraudster; (c) FP (false positive) is a consumer non-fraudster incorrectly classified as fraudster; (d) TN (true negative) is a consumer non-fraudster correctly classified as non-fraudster.
The classification performance metrics used for the evaluation of the results are: the accuracy (ACC), the F1 score, the precision or positive predictive value (PPV), the recall or true positive rate (TPR), the specificity, the area under curve (AUC), which are defined as follows by the Equations (6)–(11):
Accuracy = TP + TN TP + TN + FN + FP
F 1 = 2 TP 2 TP + FP + FN
Precision = TP TP + FP
Recall = TP TP + FN
Specificity = TN TN + FP
AUC = Recall + Specificity 2
In Figure 8, Figure 9, Figure 10 and Figure 11 the evaluation metrics (accuracy, F1, precision, recall) are shown graphically for the cases of partial power theft of the overall consumption (PTi scenarios of Table 1) and for overload power theft for different power theft percentages (Ok scenarios of Table 1).
From the above figures it is clearly shown that the percentages of power theft detection are generally very high. Moreover, it is worth noting that the ANFIS algorithm has equally good results for mixed scenarios (Mn scenarios of Table 1) and for periodic power theft scenarios (PDm scenarios of Table 1) as shown in Figure 12 and Table 4. In Figure 12 and in Table 4 the AUC metric and the reminder performance metrics are presented for the power theft incidents of Table 1 in comparison with the support-vector machine (SVM) [38] and the radial-basis-function neural network (RBF) [39] results, respectively. In order to obtain comparative results, the SVM and RBF classifiers are trained and evaluated with exactly the same dataset, the same power theft scenarios and with the 10-fold validation technique.
In more detail, it can be observed from Table 4 and Figure 12 that for almost all the power theft scenarios the applied ANFIS method has a better performance in comparison with the other two widely used algorithms, i.e., the SVM and the RBF.
Especially the proposed ANFIS method outperforms the other algorithms in cases of low power theft percentage such as PT1, O1. In case of mixed scenarios such as M2, and M3 the lower performance than the other two is due to the increment of FP incidents. On the other hand, the proposed method has better performance in case of recall metric due to the low FN rate.
Table 5 presents the training root mean square error (RMSE) in all cases of power theft incidents after running the ANFIS model for each case and shows that the ANFIS model was trained successfully.
Table 6 presents the main characteristics and the best performances of previous approaches, which many them have common characteristics with the proposed method, such us the database (Irish [35]) and some similar power theft scenarios. In the present work, more power theft scenarios with respect to those examined in [16,17,25,33,34,36], which represent additional realistic power theft cases, are studied.

4. Conclusions

This study presents an artificial intelligence (AI) method for efficient power theft detection based on real smart electricity meter data, where the most significant classification features are inserted into the adaptive neuro fuzzy inference system classifier. Numerous simulations were performed and thirteen different incidents of power theft, extracted from the real-world experience, are studied. Real smart-electricity-metering data from Irish households are taken into account and high AUC scores were achieved. Except for the AUC metric, other classification success metrics such as ACC, F1 score, precision, recall and specificity, were used for the further evaluation of the proposed method. Additionally, a comparison with other extensively used classification methods for power theft detection, such as the SVM and the RBF is performed using exactly the same power theft scenarios and the same Irish smart electricity meter data, verifying by this way the efficiency and superiority of the ANFIS structure and algorithm in the effective power theft detection.
In conclusion, the proposed ANFIS structure and algorithm gave very encouraging results for the successful detection of power theft in power distribution grids. Almost every power theft scenario was considered herein. In future research, more power theft scenarios could be investigated to take into consideration consumers with high demand of electricity such us commercial and industrial consumers. Moreover, the interconnection of RES (renewable energy sources) as distributed generation (i.e., photovoltaic, wind turbines, small hydro, etc.) connected to the power distribution grid could crucially affect the power theft phenomenon and should be investigated.

Author Contributions

Conceptualization, K.V.B., T.N.K. and G.S.S.; Methodology, K.V.B. and G.S.S.; Software, K.V.B. and T.N.K.; Validation, K.V.B., T.N.K. and G.S.S.; Formal Analysis, K.V.B., T.N.K. and G.S.S.; Investigation, K.V.B., T.N.K. and G.S.S.; Resources, K.V.B.; Data Curation, K.V.B. and T.N.K.; Writing-Original Draft Preparation, K.V.B., T.N.K. and G.S.S.; Writing-Review & Editing, K.V.B., T.N.K. and G.S.S.; Visualization, K.V.B.; Supervision, G.S.S.; Project Administration, none; Funding Acquisition, K.V.B.” All authors have read and agreed to the published version of the manuscript.

Funding

Τhis research work was supported by the Hellenic Foundation for Research and Innovation (HFRI) and the General Secretariat for Research and Technology (GSRT), under the HFRI PhD Fellowship grant (GA. no. 81740).

Conflicts of Interest

The authors declare no conflict of interest.

References

  1. Viegas, J.L.; Esteves, P.R.; Melício, R.; Mendes VM, F.; Vieira, S.M. Solutions for detection of non-technical losses in the electricity grid: A review. Renew. Sustain. Energy Rev. 2017, 80, 1256–1268. [Google Scholar] [CrossRef] [Green Version]
  2. Messinis, G.M.; Hatziargyriou, N.D. Hatziargyriou. Review of non-technical loss detection methods. Electr. Power Syst. Res. 2018, 158, 250–266. [Google Scholar] [CrossRef]
  3. Glauner, P.; Meira, J.; Valtchev, P.; State, R.; Bettinger, F. The Challenge of Non-Technical Loss Detection using Artificial Intelligence: A Survey. Int. J. Comput. Intell. Syst. (IJCIS) 2017, 10, 760–775. [Google Scholar] [CrossRef] [Green Version]
  4. Angelos EW, S.; Saavedra, O.R.; Cortés OA, C.; de Souza, A.N. Detection and identification of abnormalities in customer consumptions in power distribution systems. IEEE Trans. Power Deliv. 2011, 26, 2436–2442. [Google Scholar] [CrossRef]
  5. Nizar, A.H.; Dong, Z.Y.; Wang, Y. Power utility nontechnical loss analysis with extreme learning machine method. IEEE Trans. Power Syst. 2008, 23, 946–955. [Google Scholar] [CrossRef]
  6. Konstantinos, B.; Georgios, S. Efficient Power Theft Detection for Residential Consumers Using Mean Shift Data Mining Knowledge Discovery Process. Int. J. Artif. Intell. Appl. (IJAIA) 2019, 10, 69–85. [Google Scholar]
  7. Nagi, J.; Yap, K.S.; Tiong, S.K.; Ahmed, S.K.; Mohamad, M. Nontechnical loss detection for metered customers in power utility using support vector machines. IEEE Trans. Power Deliv. 2010, 25, 1162–1171. [Google Scholar] [CrossRef]
  8. Nagi, J.; Yap, K.S.; Tiong, S.K.; Ahmed, S.K.; Nagi, F. Improving SVM-based nontechnical loss detection in power utility using the fuzzy inference system. IEEE Trans. Power Deliv. 2011, 26, 1284–1285. [Google Scholar] [CrossRef]
  9. Ramos, C.C.O.; de Souza, A.N.; Falcão, A.X.; Papa, J.P. New insights on nontechnical losses characterization through evolutionary-based feature selection. IEEE Trans. Power Deliv. 2012, 27, 140–146. [Google Scholar] [CrossRef]
  10. Pereira, D.R.; Pazoti, M.A.; Pereira, L.A.M.; Rodrigues, D.; Ramos, C.O.; Souza, A.N.; Papa, J.P. Social-Spider Optimization-based Support Vector Machines applied for energy theft detection. Comput. Electr. Eng. 2016, 49, 25–38. [Google Scholar] [CrossRef] [Green Version]
  11. Costa, B.C.; Alberto, B.L.A.; Portela, A.M.; Maduro, W.; Eler, E.O. Fraud detection in electric power distribution networks using an Ann-based knowledge-discovery process. Int. J. Artif. Intell. Appl. 2013, 4, 17–23. [Google Scholar] [CrossRef]
  12. León, C.; Biscarri, F.; Monedero, I.; Guerrero, J.I.; Biscarri, J.; Millán, R. Variability and trend-based generalized rule induction model to NTL detection in power companies. IEEE Trans. Power Syst. 2011, 26, 1798–1807. [Google Scholar] [CrossRef]
  13. Ramos CC, O.; de Sousa, A.N.; Papa, J.P.; Falcao, A.X. A new approach for nontechnical losses detection based on optimum-path forest. IEEE Trans. Power Syst. 2011, 26, 181–189. [Google Scholar] [CrossRef]
  14. Zheng, Z.; Yang, Y.; Niu, X.; Dai, H.N.; Zhou, Y. Wide & Deep Convolutional Neural Networks for Electricity-Theft Detection to Secure Smart Grids. IEEE Trans. Veh. Technol. 2017, 14, 1606–1614. [Google Scholar]
  15. Wang, Y.; Chen, Q.; Gan, D.; Yang, J.; Kirschen, D.S.; Kang, C. Deep Learning-Based Socio-demographic Information Identification from Smart Meter Data. IEEE Trans. Smart Grid 2018, 10, 2593–2602. [Google Scholar] [CrossRef]
  16. Hasan, M.; Toma, R.N.; Nahid, A.A.; Islam, M.M.; Kim, J.M. Electricity Theft Detection in Smart Grid Systems: A CNN-LSTM Based Approach. Energies 2019, 12, 3310. [Google Scholar] [CrossRef] [Green Version]
  17. Bhat, R.R.; Trevizan, R.D.; Sengupta, R.; Li, X.; Bretas, A. Identifying nontechnical power loss via spatial and temporal deep learning. In Proceedings of the 15th IEEE International Conference on Machine Learning and Applications (ICMLA), Anaheim, CA, USA, 18–20 December 2016; pp. 272–279. [Google Scholar]
  18. Fenza, G.; Gallo, M.; Loia, V. Drift-aware methodology for anomaly detection in smart grid. IEEE Access 2019, 7, 9645–9657. [Google Scholar] [CrossRef]
  19. Marulli, F.; Visaggio, C.A. Adversarial deep learning for energy management in buildings. In Proceedings of the 2019 Summer Simulation Conference, Society for Computer Simulation International, Berlin, Germany, July 2019. [Google Scholar]
  20. Neto, E.A.A.; Coelho, J. Probabilistic methodology for technical and non-technical losses estimation in distribution system. Electr. Power Syst. Res. 2013, 97, 93–99. [Google Scholar] [CrossRef]
  21. Xiao, Z.; Xiao, Y.; Du, D.H.-C. Exploring malicious meter inspection in neighborhood area smart grids. IEEE Trans. Smart Grid 2013, 4, 214–226. [Google Scholar] [CrossRef]
  22. Liao, C.; Ten, C.W.; Hu, S. Strategic FRTU deployment considering cyber security in secondary distribution network. IEEE Trans. Smart Grid 2013, 4, 1264–1274. [Google Scholar] [CrossRef]
  23. Zhou, Y.; Chen, X.; Zomaya, A.; Wang, L.; Hu, S. A dynamic programming algorithm for leveraging probabilistic detection of energy theft in smart home. IEEE Trans. Emerg. Top. Comput. 2015, 3, 502–513. [Google Scholar] [CrossRef]
  24. Silva, L.G.d.; da Silva, A.A.P.; de Almeida-Filho, A.T. Allocation of power-quality monitors using the P-median to identify nontechnical losses. IEEE Trans. Power Deliv. 2016, 31, 2242–2249. [Google Scholar] [CrossRef]
  25. Jokar, P.; Arianpoo, N.; Leung, V.C.M. Electricity theft detection in AMI using customers’ consumption patterns. IEEE Trans. Smart Grid 2016, 7, 216–226. [Google Scholar] [CrossRef]
  26. Jindal, A.; Dua, A.; Kaur, K.; Singh, M.; Kumar, N.; Mishra, S. Decision tree and SVM-based data analytics for theft detection in smart grid. IEEE Trans. Ind. Inform. 2016, 12, 1005–1016. [Google Scholar] [CrossRef]
  27. Huang, S.-C.; Lo, Y.-L.; Lu, C.-N. Non-technical loss detection using state estimation and analysis of variance. IEEE Trans. Power Syst. 2013, 28, 2959–2966. [Google Scholar] [CrossRef]
  28. Tharwat, A. Classification assessment methods. Appl. Comput. Inform 2018. [Google Scholar] [CrossRef]
  29. Sokolova, M.; Lapalme, G. A systematic analysis of performance measures for classification tasks. Inf. Process. Manag. 2009, 45, 427–437. [Google Scholar] [CrossRef]
  30. Jang, J.-S.R. ANFIS: Adaptive-network-based fuzzy inference system. IEEE Trans. Syst. Man Cybern. 1993, 23, 665–685. [Google Scholar] [CrossRef]
  31. Kapetanakis, T.N.; Vardiambasis, I.O.; Lourakis, E.I.; Maras, A. Applying neuro-fuzzy soft computing techniques to the circular loop antenna radiation problem. IEEE Antennas Wirel. Propag. Lett. 2018, 17, 1673–1676. [Google Scholar] [CrossRef]
  32. Matlab Statistics and Machine Learning Toolbox 11.2, 2017; The MathWorks, Inc.: Natick, MA, USA, 2017.
  33. Ghasemi, A.A.; Gitizadeh, M. Detection of illegal consumers using pattern classification approach combined with Levenberg-Marquardt method in smart grid. Int. J. Electr. Power Energy Syst. 2018, 99, 363–375. [Google Scholar] [CrossRef]
  34. Buzau, M.M.; Tejedor-Aguilera, J.; Cruz-Romero, P.; Gómez-Expósito, A. Detection of non-technical losses using smart meter data and supervised learning. IEEE Trans. Smart Grid 2018, 10, 2661–2670. [Google Scholar] [CrossRef]
  35. Irish Social Science Data Archive. Available online: http://www.ucd.ie/issda/data/commissionforenergyregulationcer/ (accessed on 6 October 2019).
  36. Zheng, K.; Chen, Q.; Wang, Y.; Kang, C.; Xia, Q. A Novel Combined Data-Driven Approach for Electricity Theft Detection. IEEE Trans. Ind. Inform. 2018, 15, 1809–1819. [Google Scholar] [CrossRef]
  37. Fushiki, T. Estimation of prediction error by using K-fold cross-validation. Stat. Comput. 2011, 21, 137–146. [Google Scholar] [CrossRef]
  38. Platt, J. Sequential Minimal Optimization: A Fast Algorithm for Training Support Vector Machines; Technical Report MSR-TR-98-14; 1998; Available online: https://www.microsoft.com/en-us/research/publication/sequential-minimal-optimization-a-fast-algorithm-for-training-support-vector-machines/ (accessed on 10 June 2016).
  39. Wu, Y.; Wang, H.; Zhang, B.; Du, K.L. Using radial basis function networks for function approximation and classification. ISRN Appl. Math. 2012, 2012, 1–34. [Google Scholar] [CrossRef] [Green Version]
Figure 1. Equivalent adaptive neuro fuzzy inference system (ANFIS) architecture of a two-input ANFIS model with two rules.
Energies 13 03110 g001
Figure 2. Power consumption patterns for legal (continuous line) and illegal (dotted lines) consumers.
Energies 13 03110 g002
Figure 3. Block diagram of the proposed power theft classification model.
Energies 13 03110 g003
Figure 4. Ranking of the selected classification features.
Energies 13 03110 g004
Figure 5. Confusion matrix for partial power theft scenarios (PTi).
Energies 13 03110 g005
Figure 6. Confusion matrix for overload power theft scenarios (Ok).
Energies 13 03110 g006
Figure 7. Confusion matrix for periodic and mix scenarios (PDm, Mn).
Energies 13 03110 g007
Figure 8. Accuracy metric for partial power theft and overload scenarios.
Energies 13 03110 g008
Figure 9. F1 metric for partial power theft and overload scenarios.
Energies 13 03110 g009
Figure 10. Precision metric for partial power theft and overload scenarios.
Energies 13 03110 g010
Figure 11. Recall metric for partial power theft and overload scenarios.
Energies 13 03110 g011
Figure 12. Area under curve (AUC) metric for the ANFIS, radial-basis-function neural network (RBF), support vector machines (SVM) classifiers for all the power theft scenarios of Table 1.
Energies 13 03110 g012
Table 1. The proposed power theft scenarios based on realistic consumers’ behavior cases.
ScenarioPower Theft (%)
PTi: Partially stealingi = 1: 10%–30%
i = 2: 30%–50%
i = 3: 50%–70%
i = 4: 70%–90%
Ok: Abruptly increased consumptionk = 1: 20%–40%
k = 2: 40%–60%
k = 3: 60%–80%
k = 4: 80%–100%
PDm: Partially stealing electricity specific times of the daym = 1: 80% from 12:00 p.m.–15:00 p.m. and 20:00 p.m.–22:00 p.m.
m = 2: 80% from 12:00 p.m.–15:00 p.m.
Mn: combination of PTi, Ok, PDmn = 1: PT3, O3
n = 2: PT3, O3, PD1
n = 3: PT3, O3, PD1, PD2
Table 2. Configurations of the applied ANFIS algorithm structure.
ModelANFIS
MF typeGeneralized
bell-shaped
Number of MFs4
Output MFConstant
Training dataset327
Checking dataset327
Testing dataset327
Number of epochs200
Table 3. Definition of the classification features necessary to be extracted from the electricity consumption data.
FeaturesDefinition
mean 1 N i = 1 N x i
medianThe middle value of observations
skewness E ( x μ ) 3 σ 3
entropy i = 1 N P ( x i ) log 2 ( P ( x i ) )
standard deviation 1 N 1 i = 1 N | x i μ | 2
kurtosis E ( x μ ) 4 σ 4
variance 1 N 1 i = 1 N | x i μ | 2
Energy i = | x i | 2
Load factor 1 N i = 1 N x i m a x ( x )
Table 4. Classification performance metrics calculation for each power theft scenario (13 in total).
AccuracyRecallF1Precision
ANFISSVMRBFANFISSVMRBFANFISSVMRBFANFISSVMRBF
O10.870.720.800.740.130.570.780.220.640.810.690.72
O20.940.790.840.890.420.680.900.550.720.920.790.77
O30.980.850.900.960.610.830.960.710.840.970.850.85
O40.980.890.950.960.740.930.970.810.910.980.900.90
PT10.870.690.800.660.000.500.750.090.610.861.000.78
PT20.970.910.950.930.710.910.950.830.920.970.990.93
PT30.990.970.980.980.910.980.980.950.970.981.000.96
PT41.000.990.991.000.971.001.000.980.980.991.000.97
PD10.990.960.980.970.890.970.980.940.960.990.990.96
PD20.950.910.950.890.720.900.920.840.910.960.990.94
M10.930.880.730.960.650.140.880.760.230.820.930.82
M20.830.870.830.920.590.480.660.730.630.520.960.94
M30.690.770.770.890.270.270.440.420.410.290.970.91
Table 5. Root mean square error (RMSE) calculated for the ANFIS training stage.
Power Theft ScenarioRMSE
PT1, PT2, PT3, PT40.640, 0.350, 0.184, 0.082
O1, O2, O3, O41.184, 0.844, 0.631, 0.537
PD1, PD20.660, 1.518
M1, M2, M30.531, 0.850, 1.436
Table 6. Comparison among the different power theft classification and detection methods.
RefData SourceNumber of ConsumersSampling Time (Min) 1ML AlgorithmAccuracyPrecisionRecallAUC
[25]Irish~500030SVM0.94
[36]Irish~500030CFSFDP0.98
[33]--15PNN, LM0.96
[34]Endesa57,304288K-means, KNN, LR, XGBoost0.91
[6]Artificial110015Mean shift, DBSCAN0.96
[17]IEEE 123 bus feeder12,180-CNN, LSTM0.970.97
[16]State Grid of China17,120-CNN, LSTM0.890.900.87
ANFISIrish327330ANFIS0.990.990.990.99
1 measurements were taken every 15 or 30 or 288 min.

