Abstract
Predicting actual energy harvesting of a photovoltaic (PV) installation as per site-specific conditions is essential, from the customer’s point of view, to choose suitable PV technologies as well as orientations, since most PVs usually have been designed and evaluated under standard illumination. Hence, the tendency lives in the PV community to evaluate the performance on the energy yield and not purely on the efficiency. The major drawback is that weather conditions play an important role, and recording solar spectra in different orientations is an expensive and time-consuming business. We, therefore, present a model to calculate the daily, monthly and annual energy yield of Si-based PV installations included in commercial panels as well as tandem solar cells. This methodology will be used to evaluate the benefit of potential new technologies for domestic and building integrated applications. The first advantage of such a numerical model is that the orientation of solar panels and their properties can be easily varied without extra experiments. The second advantage is that this method can be transferred to other locations since it is based on a minimum of input parameters. In this paper, the energy yield of PV installations for different regions in Belgium and Vietnam will be calculated.
1. Introduction
Si-wafer based photovoltaic technologies, which accounted for about 95% of the total production in 2017, have been always dominant in the market share of the photovoltaic (PV) industry [1] because of the significant improvement in efficiency and reduction in fabrication cost. Moreover, silicon is an earth-abundant element and has demonstrated its reliability and lifespans that meet the requirement of most PV applications. Currently, efforts are still ongoing to improve Si cell efficiency by optimizing the cell surfaces to minimize the losses due to front contacts and recombination, exploring new technologies and high-quality, low-cost materials used in fabrication [2,3,4]. Subsequently, the most recent record reported is of 26.7% under AM1.5G [3], approaching towards its theoretical limiting efficiency of 29.4% [5].
To achieve significantly higher efficiencies, the most practical approach is the tandem cells, which provide the best-known example of such high-efficiency techniques. In the tandem architecture, the efficiency can be increased merely by adding more cells of different bandgap to a stack [6]. In that aspect, III-V materials tandem on silicon, the efficiencies of 38.8% of which have been achieved under one sun illumination using five junctions of III–V semiconductors represents a promising pathway to overcome the efficiency limit of a single c-Si solar cell [7]. Theoretically, a three-junction (AlGaAs/GaAs-InGaAs) mechanically stacked tandem solar cell efficiency is limited to 46.4% when a 4-terminal configuration is used to separately contact the bottom InGaAs cell. Four-junction mechanically stacked solar cells incorporating a 4-terminal AlGaAs/GaAs-Si-InGaAs structure have also shown an overall efficiency of 49% under 1-Sun illumination [8].
However, the performance of PV modules installed outdoors is greatly influenced by various ambient environmental factors such as incident irradiance, spectral content, module temperature and angle of incidence. The actual outdoor spectra, which always vary hour to hour, day by day during the year and strongly depends on regional weather conditions, have a major impact on the performance of a PV device. This effect also depends on the technology as well as material which decides the sensitivity of the PV devices [9]. The variations in incident irradiation and solar spectral content have a higher effect on multi-junction and high-bandgap devices compared with single-junction and low-bandgap devices [10,11,12]. Theoretical and experimental studies have illustrated that the actual harvesting efficiency, which is usually lower than the efficiency under standard test conditions, varies during the year and the drop in harvesting efficiency can be attributed to irradiance and temperature as major loss channels [12,13]. Other studies have addressed that angle of incidence is intimately related to the irradiance on a solar panel surface and an increase in electricity production of a PV system can be adapted by optimizing the panel orientation [14,15,16,17].
Due to the reasons mentioned above, there is a growing tendency in the PV community to analyze and predict the performance of PV systems under real operating conditions which includes various technologies, climate regions and orientations [12,17,18], while other studies focused on the harvesting energy of tandem solar cells [13,19]. The major disadvantage of those experimental studies is that they are usually set up under fixed orientations and the operation needs to take place over a long time, followed by a massive quantity of measurements. Furthermore, predicting the outdoor energy yield of PVs is usually based on historical local solar irradiation and temperature onsite, which is time-consuming and expensive to record in different orientations. To overcome these problems, numerical modeling can be a promising alternative, which provides the flexibility in changing operating parameters of a PV system such as PV properties, the orientation of installation, and weather conditions [20,21,22].
In this study, a model that is able to calculate the daily, monthly and annual energy yield of solar cell under varying spectra and easy to transfer from one location to others, is developed. Therefore, four specific regions in Vietnam and Belgium with different climate regions will to be taken into account. The model is first drawn up for actual PV installations in Flanders, Belgium, where the actual data of PV energy production and weather conditions can be gained effortlessly. The weather data, which include global horizontal irradiation and sunshine hour, were investigated online for simulating daily solar spectra on the solar panel, while the experiment data measured onsite were used to validate the accuracy of the results. Afterwards, the model was tested under Vietnam conditions where the climate is absolutely different from Belgium and possesses a high potential for solar development. In the estimation of the energy yield of Si-based commercial PV, the results were subsequently compared to that of actual installation systems and other models. After ensuring that it was working correctly, the model was applied for Si-based tandem solar cells using their reference external quantum efficiency (EQE).
2. Study Objectives
The objective of this research is to create a new accurate methodology for calculating the energy yield of a PV installation system under local weather conditions. We then combine this methodology with the results provided by [7] to estimate the potential yield of the cutting-edge tandem solar cells. In this research, the objectives are to:
- Develop a model to calculate the total daily, monthly and annual energy yield of arbitrarily oriented PV system based on minimum input parameters of the local weather conditions.
- The model can be transferred easily from one location to another.
- Combine the results of this research with previous studies to analyze the potential application of tandem solar cells in a specific location.
To calculate the energy yield of PV system, a detailed energy yield model is developed to convert measured solar irradiation components, including global horizontal irradiation (GHI) and average sunshine duration as well as ambient temperature (), into hourly, monthly and annual electricity production for each combination of the panel’s tilt and azimuth angles.
Aimed to minimize the number of input parameters, only the global horizontal irradiation, average sunshine duration and temperature from the database have been taken into account in our research. Moreover, to make sure that the model can be transferred smoothly from one location to another, the use of solar irradiation and weather conditions databases that are available online for different locations were chosen, while annual average local temperatures were applied instead of nominal operating cell temperature which is more complicated to determine.
3. Methodology
The calculation methodology used in this study consists of the three following steps:
- Collection of solar irradiance and weather data for study regions;
- Calculation of the solar irradiation incident on the earth and tilt surface;
- Calculation of electric energy yield of Si-based PV panel and tandem solar cells.
3.1. Input Data
3.1.1. Database
The experimental database of four specific regions in Belgium and Vietnam (Table 1) were used to find out empirical coefficients of the model. The weather database of Flanders was collected from the Royal Meteorological Institute (RMI) [23], while that of Vietnam’s locations are selected from the Photovoltaic Geographical Information System (PVGIS) that belongs to a project of the European Commission [24]. Initially, a pilot model was established based on local weather conditions in the Flanders region (Belgium) where the model’s performance was then compared to an actual PV installation system and other online models of PVGIS such as CMSAF, SARAH, ERA5 and COSMO [25,26]. Once the accuracy of the pilot model was proven, it was applied to Vietnam’s regions, where the measurement data provided by Energy Sector Management Assistance program (ESMAP) [27] were used to evaluate its calculated performance again.

Table 1.
Database resources for studied regions.
3.1.2. Solar Angles Equations
The solar declination angle which varies between +23.5° and −23.5° is defined as the angle between the Equator and the center of the sun [28]:
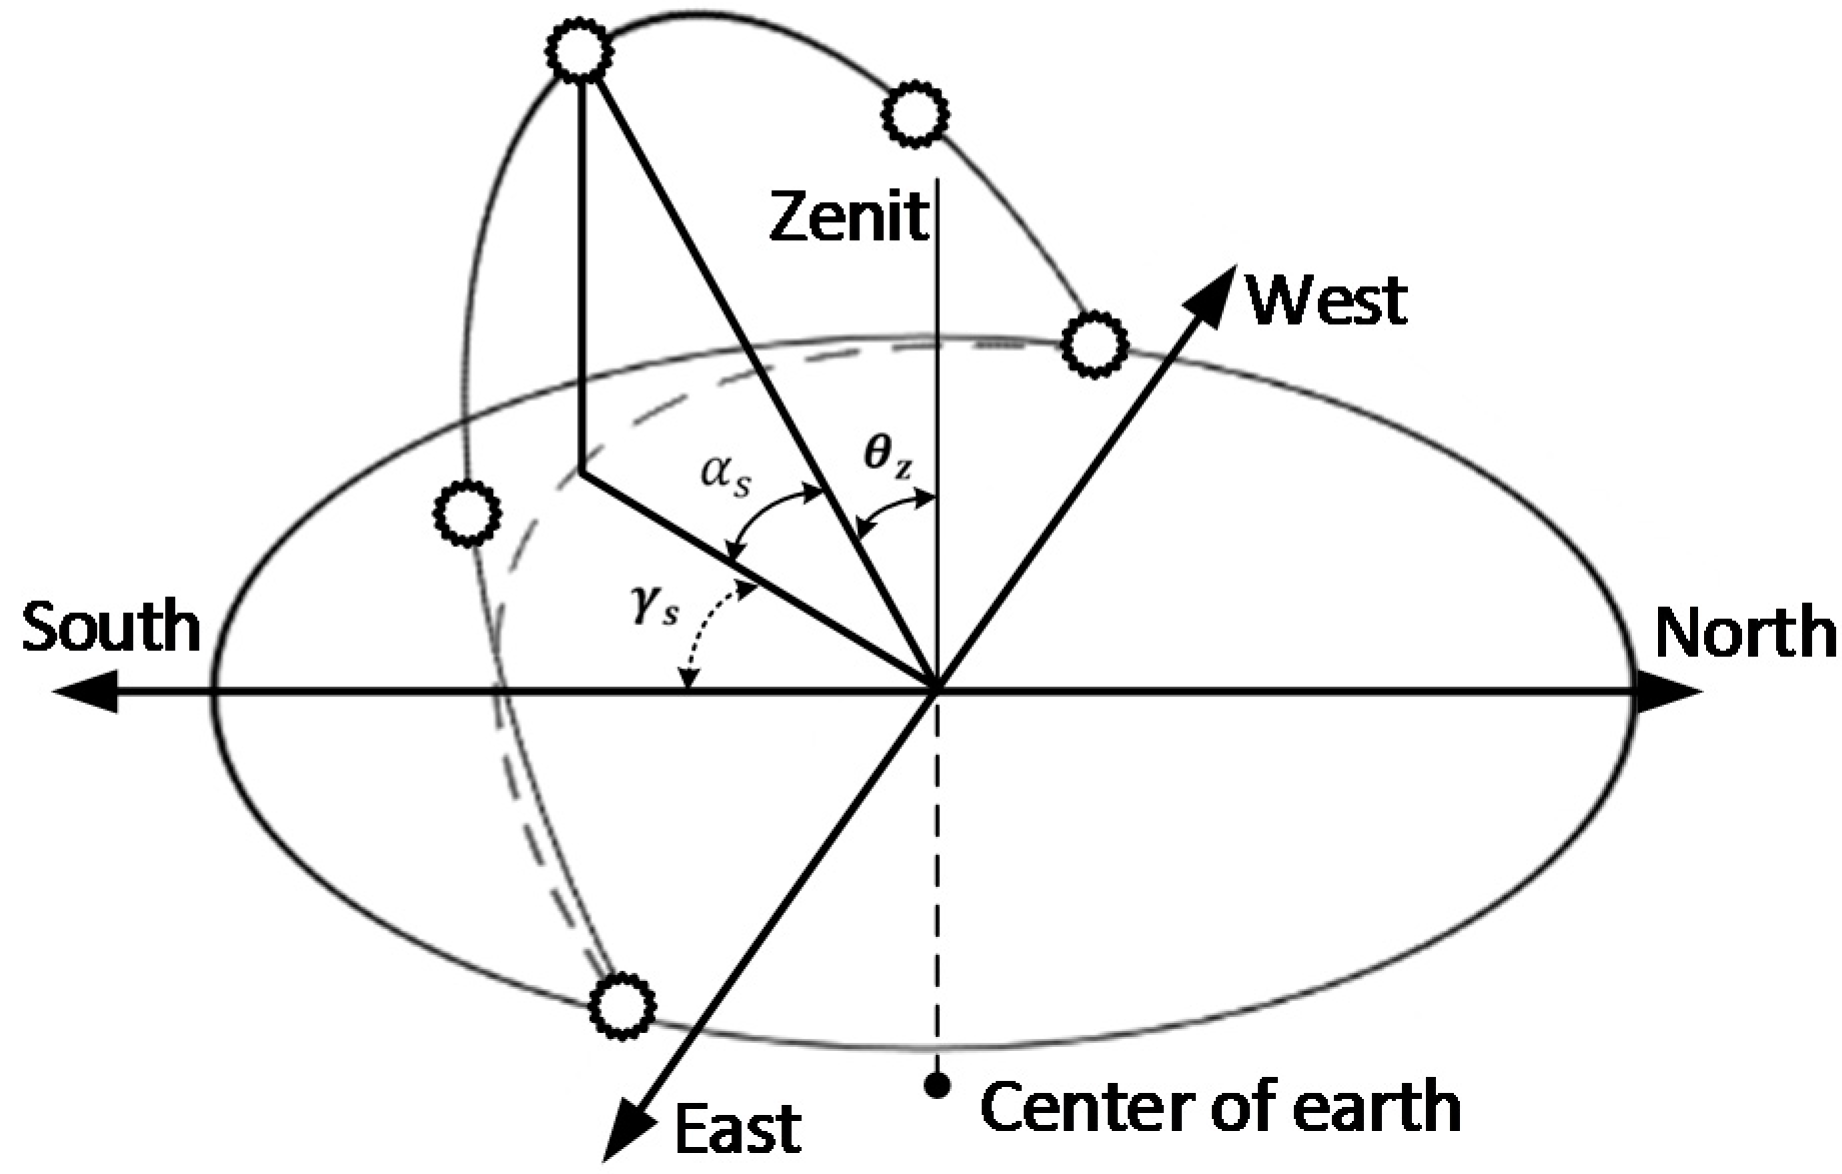
where n is the number day (n = 1 for 1st January). At any time of day, the altitude angle and azimuth angle of the sun can be used to determine its position as shown in Figure 1.
where is the local latitude angle and is the hour angle. The hour angle of the sun is positive toward East and negative toward West, so the hour angle of sun rise is:
and the hour angle of sun set:
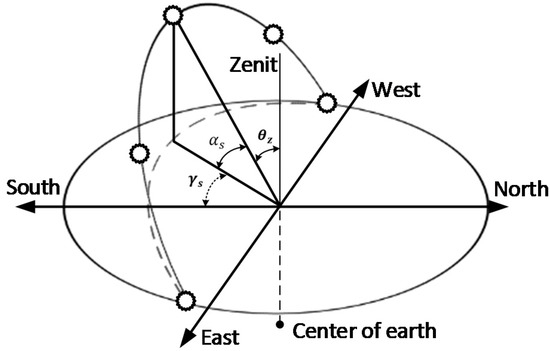
Figure 1.
Daily path of the sun from sunrise to sunset.
The solar azimuth angle, , is the angle between the normal projection to a horizontal plan and the local meridian. The azimuth angle for the morning hours is and for the afternoon hours is , the solar azimuth is 0° at noon.
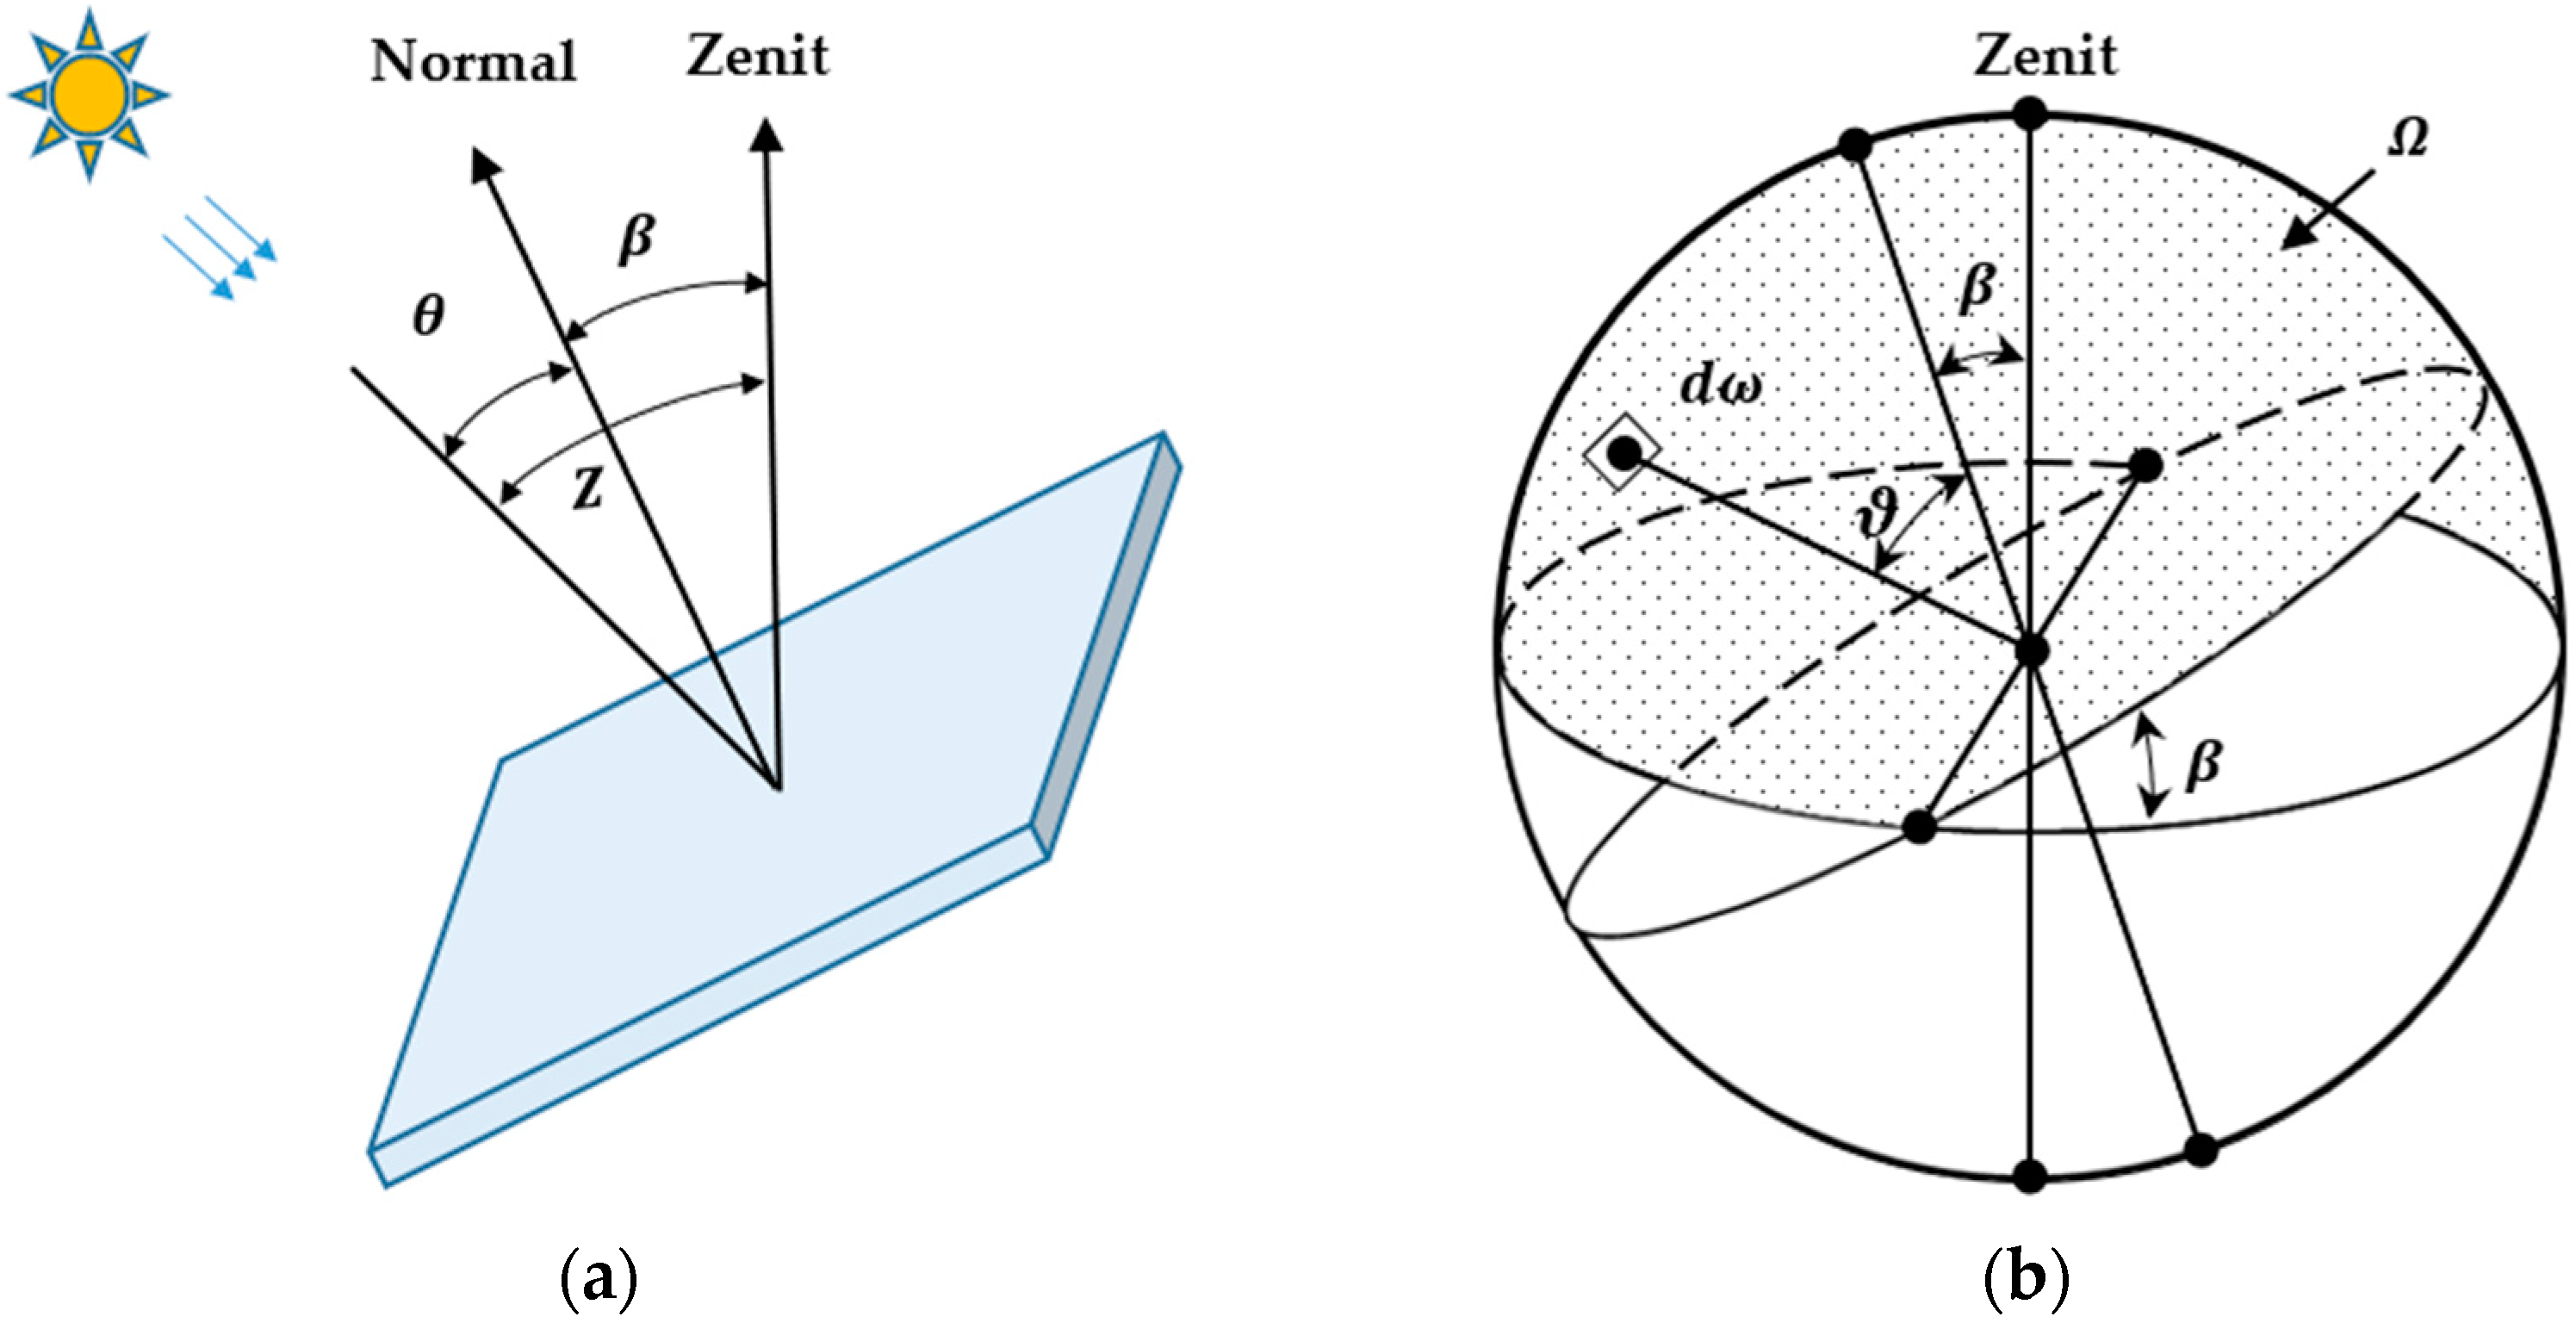
As shown in Figure 2a, the angle of incidence , the angle between the direct radiation from the sun and the solar panel surface normal, is computed by equation:
where β is the angle between the horizontal plane of the earth and the plane of the solar panel, and this angle varies between 0° and 180°, where β > 90° means the solar panel facing the ground, γ is the panel azimuth angle.
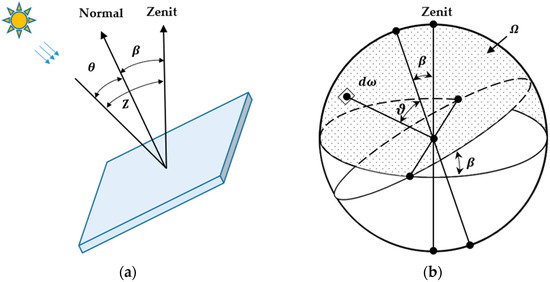
Figure 2.
Angles of direct and diffuse light falling on solar panel. (a) The angles of direct incidence; (b) The angles of diffuse incidence.
3.1.3. Calculate Solar Radiation on Horizontal and Tilted Surface
For a flat Earth’s surface and a uniform atmosphere whose thickness is d, it is assumed that the GHI comprises two major components called direct and diffuse horizontal irradiation [29]. If the sunlight incident is under an angle z, the intensity of the sunlight or direct horizontal irradiation () becomes:
where z is called the zenith distance, α is the absorption coefficient and corresponds to the intensity above the atmosphere (d = 0), while diffuse horizontal irradiation (DHI) is calculated by:
As shown in Figure 2a, whenever the normal of a solar panel makes an angle with the solar rays, a direct intensity falls in its surface is given by:
and diffused intensity (Figure 2b):
where is the angle of incidence of the diffuse light and is the solid angle in which the panel sees the heaven’s dome.
Therefore, the total irradiation received by solar panel is a combination of two components: direct beam irradiation, , and diffuse irradiation, . The total irradiation received by solar cell module is computed by:
3.2. Calculate Solar Energy Yield for Si-Based Tandem Cell and Commercial Panel
In this work, the classical current–voltage characteristic of a solar cell is assumed for both commercial and tandem items:
where q is the elementary charge, n is ideality factor, k is Boltzmann constant, T is absolute temperature, is the recombination current and is the short-circuit current. In terms of the commercial panel, the characteristic parameters such as , , and are already provided by the producers, therefore, can be calculated easily by using Equation (12). However, such parameters are not available for tandem solar cells, the properties and performance of which strongly depend on the configuration of their sub-cells. For this reason, the bandgap and EQE were applied to calculate and for each corresponding sub-cell and consequently the characteristic of the tandem solar cell could be figured out. The recombination current of a sub-cell is given by:
Where h is Plank’s constant, is correction factor, c is the speed of light, is the bandgap of the material. The short-circuit current of a sub-cell is:
where is incident photon spectrum which is calculated from estimated radiation.
In a grid-connected PV system which consists of PV arrays, an inverter is used to convert the produced DC to AC power. Conventionally, the maximum DC power extraction is expected, so the DC/AC converter needs to impose on the PV panels the appropriate voltage. It can be accepted that the PV panel always operates at its maximum power point for any given solar irradiance and cell temperature [30,31]. Knowing that in this study, the instantaneous values of the dc power were calculated every 4 min during 24 h a day when solar energy is available at the site. Therefore, the unit values of dc power can be determined by imposing:
where and = 4 min/24 h stand for respective per-unit values of power and time; is the nominal DC power of the inverter at time t; is inverter DC power and calculated by:
The efficiency of a PV inverter is:
where is the efficiency of the inverter as a percentage, > 0 is the per-unit value of the DC power that the inverter can convert in AC; while A, B and C depend on the type of inverter and need to be determined. In this study, the values of A, B and C are 100.83, −4.517 and −1.27, respectively [31].
We also concentrated on the difference between the energy yield of 2-terminal and 4-terminal Si-based tandem cell which all use silicon as a bottom cell, while for the top cells, GaInP and GaAs whose bandgap are 1.81 eV and 1.42 eV respectively were selected. All EQEs of these materials were gathered from the reference [7].
The modeling procedure assumed that the top and bottom cells, which normally cannot be measured directly, are similar in shape to the single-junction cell curves. For each prevailing spectrum condition, the corresponding values calculated from the Equation (14) serve to align an I-V curve for each top and bottom cell separately. In the case of 2-terminal tandem cell, the minimum value of top and bottom cells was selected as the entire short-circuit value of the tandem cell. Subsequently, the entire I-V characteristic for 2T series connection was achieved by adding the voltage of two sub-cells calculated at the same current value. The obtained curve of 2T tandem cell was then used to calculate the yield of PV under 2T connection. The total electricity output under 4-terminal connection was obtained by summing the individual power from top and bottom cells, when each sub-cell operates at its unconstrained maximum power point.
The estimation of solar spectra, which include both direct and diffuse intensity, have been demonstrated in previous studies [10,32,33]. In this study, the clear-sky spectral irradiance on a tilted surface (tilt angle α), , was calculated by:
where and are clear-sky direct normal irradiance and diffuse irradiance respectively, these parameters can be calculated directly by using Equations (7) and (8) based on reference extraterrestrial spectra defined in ASTMGE173-03 and IEC 60904-3 [34,35]; and which are calculated from the measurements applied Equations (9) and (10), respectively, are direct and diffuse irradiance on the tilted surface. The spectral photon flux density at a specific value of wavelength , , can be determined by:
The efficiency, , of these tandem cells was calculated by:
where and is the instantaneous maximum power of the cell and incoming power of solar light respectively. The daily power harvesting of the tandem solar cells then could be computed by:
3.3. Estimating Daily Solar Irradiation from Databases
Once the monthly average measurements of solar radiation were derived from databases, the DHI and GHI for each day during the year could be found using curve fitting methods [36]. The average DHI for each day during the year was estimated using Gaussian fitting method which is defined as:
where is the estimated daily DHI; is the annual average daily DHI; ne is the order number of day in the year ranging from 1 on 1 January to 365 on 31 December; a, b and c are empirical coefficients and need to be found.
The average daily GHI was predicted using sine fitting function:
or polynomial fitting function:
where is the estimated daily GHI; is the annual average daily GHI; d, e, f and are empirical coefficients.
4. Result and Discussion
4.1. Daily, Monthly and Annual GHI on the Flat and Tilted Surface
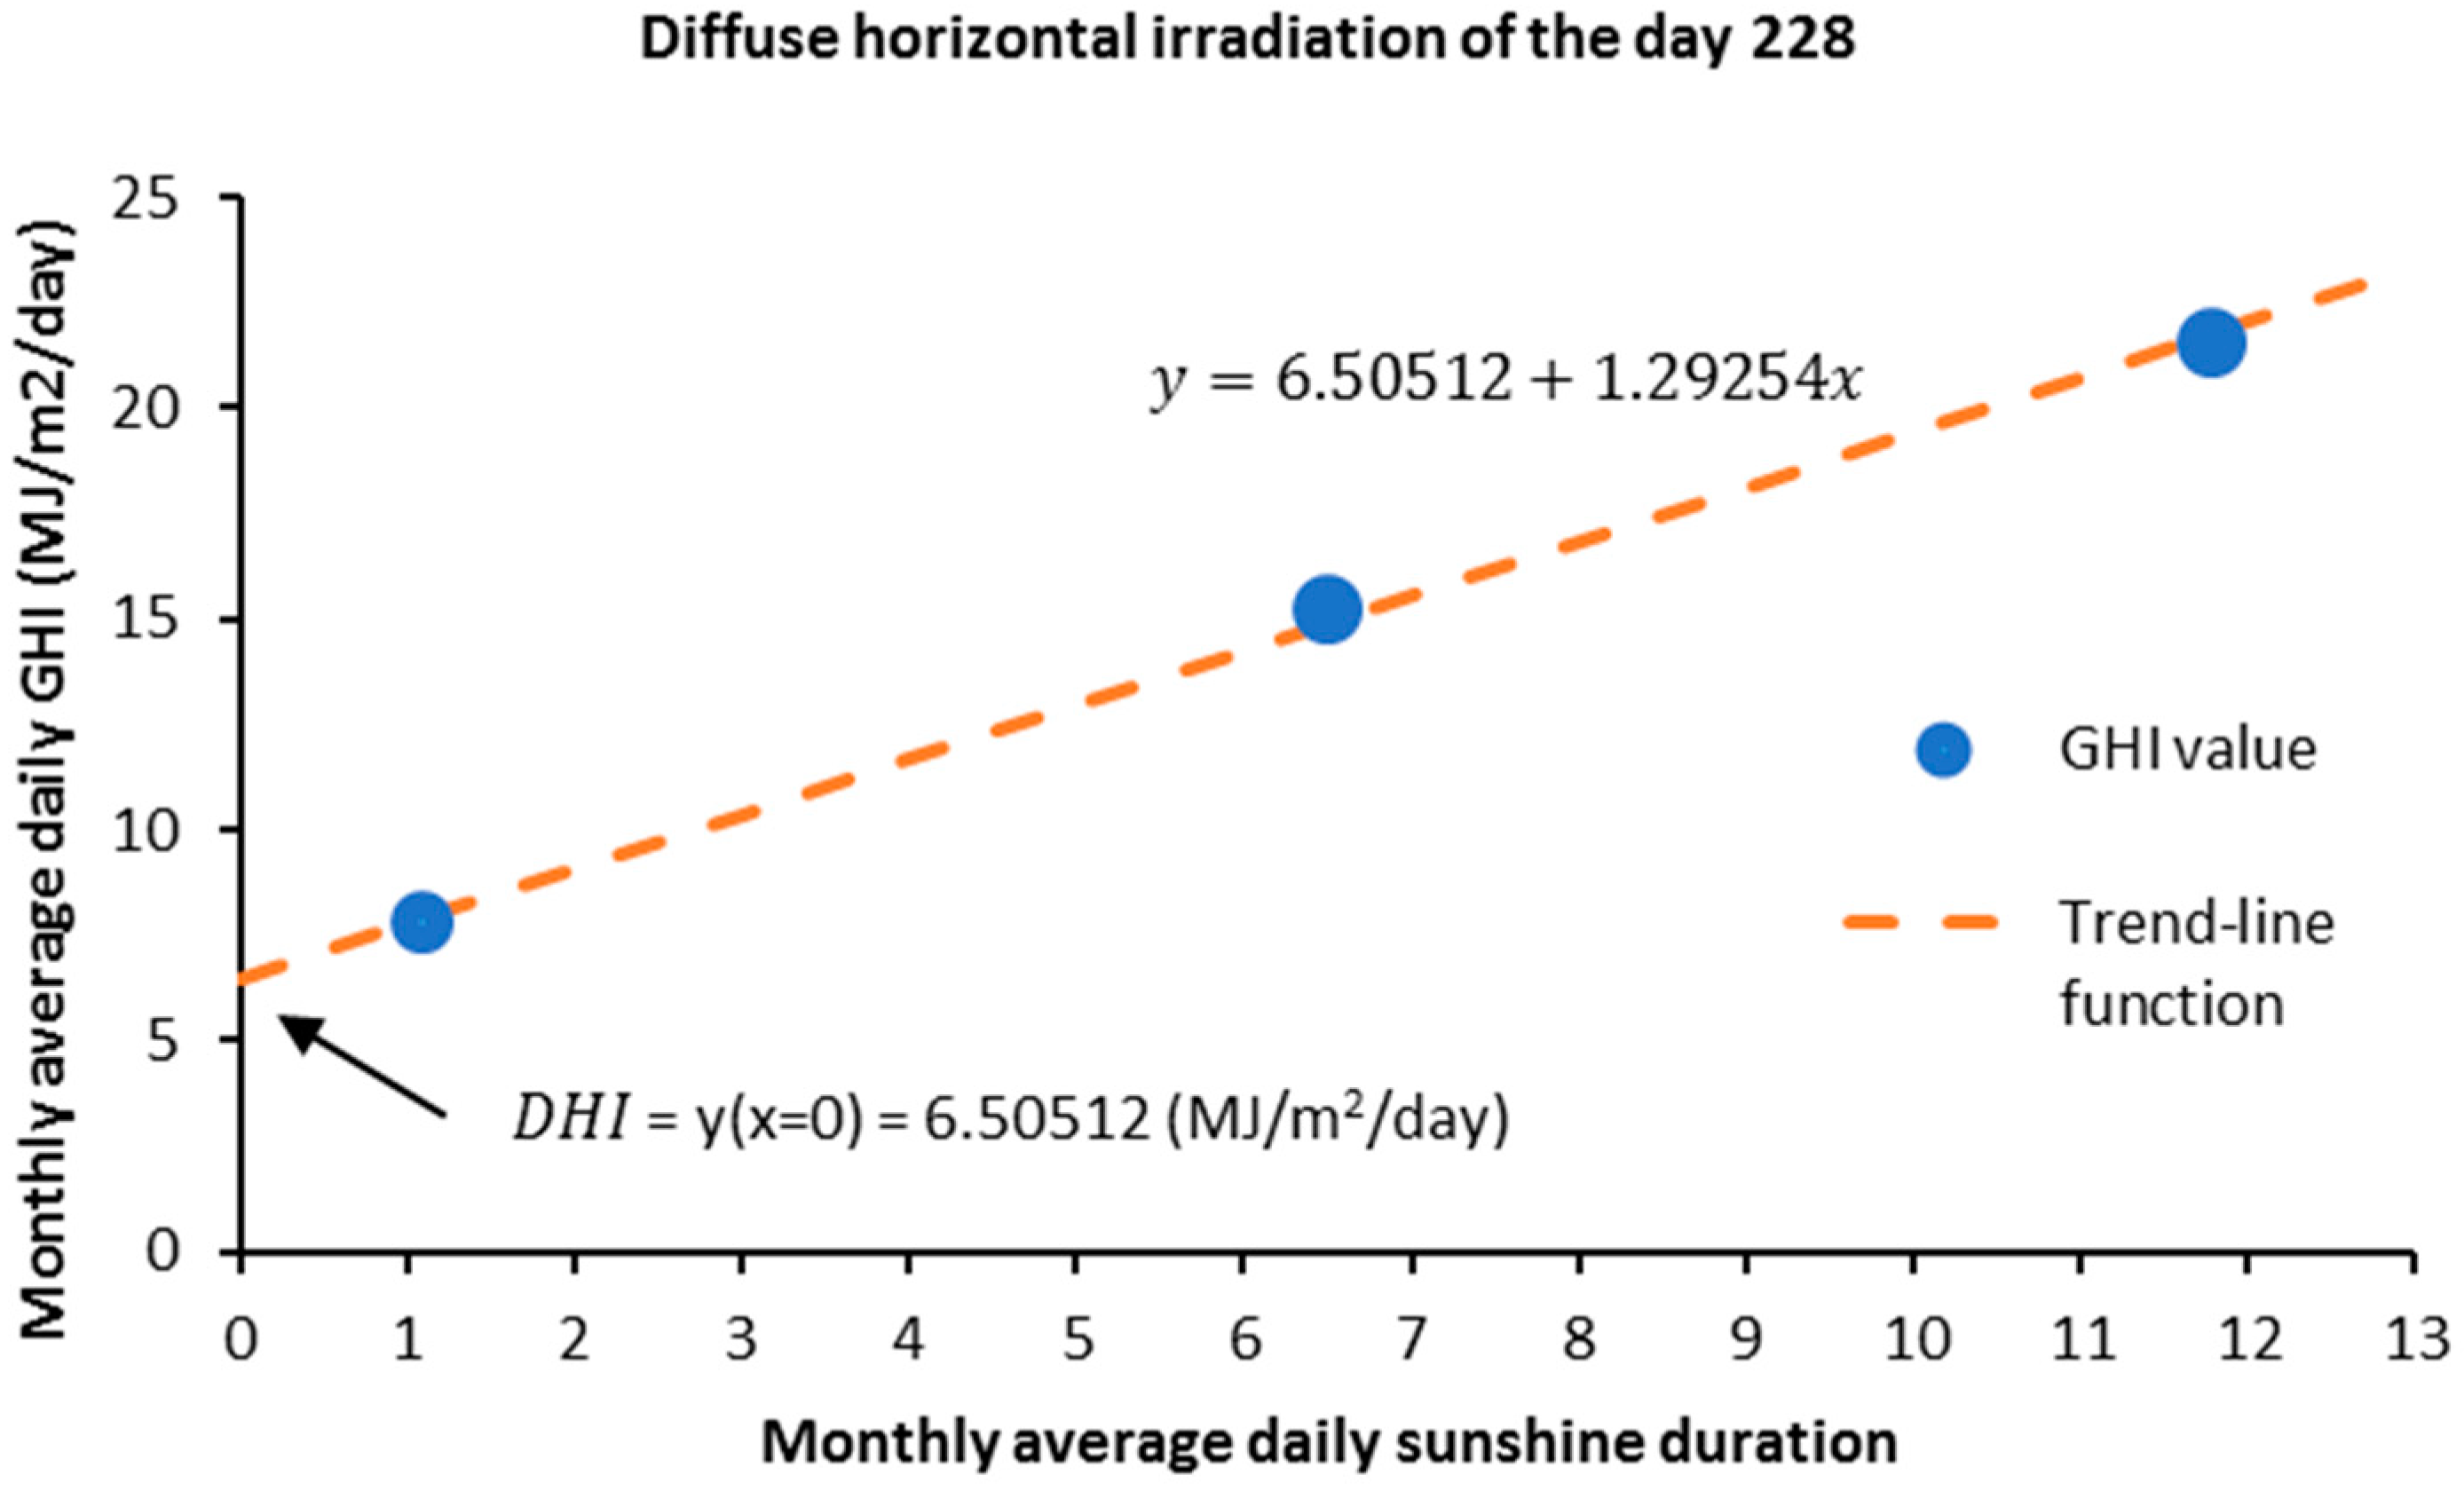
The monthly average daily GHI and monthly average daily sunshine duration can be obtained easily from the available databases. Subsequently, it is possible to draw up a graph in which the average monthly daily GHI is displayed in the function of the monthly average daily sunshine duration. A linear trend-line for each month can be drawn to determine the relationship between number of sunshine hours and solar radiation intensity, assuming that the diffuse solar radiation is the intensity of sunlight which is received on the Earth’s surface in a day when the sunshine duration for that day is zero. As shown in Figure 3, the ordinate of the intersection of the trend-line with the y-axis which is shown on the graph as the point where the number of sunshine hours per day equals zero, therefore, the monthly average daily DHI.
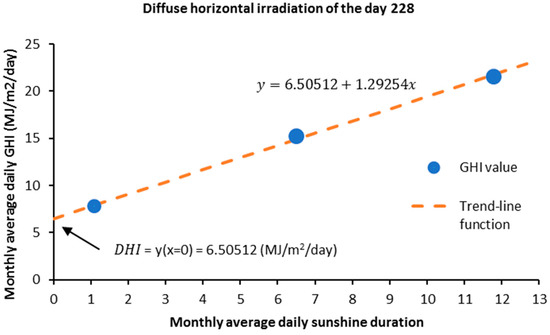
Figure 3.
Graphic illustration for the determination of DHI in Flanders, Belgium.
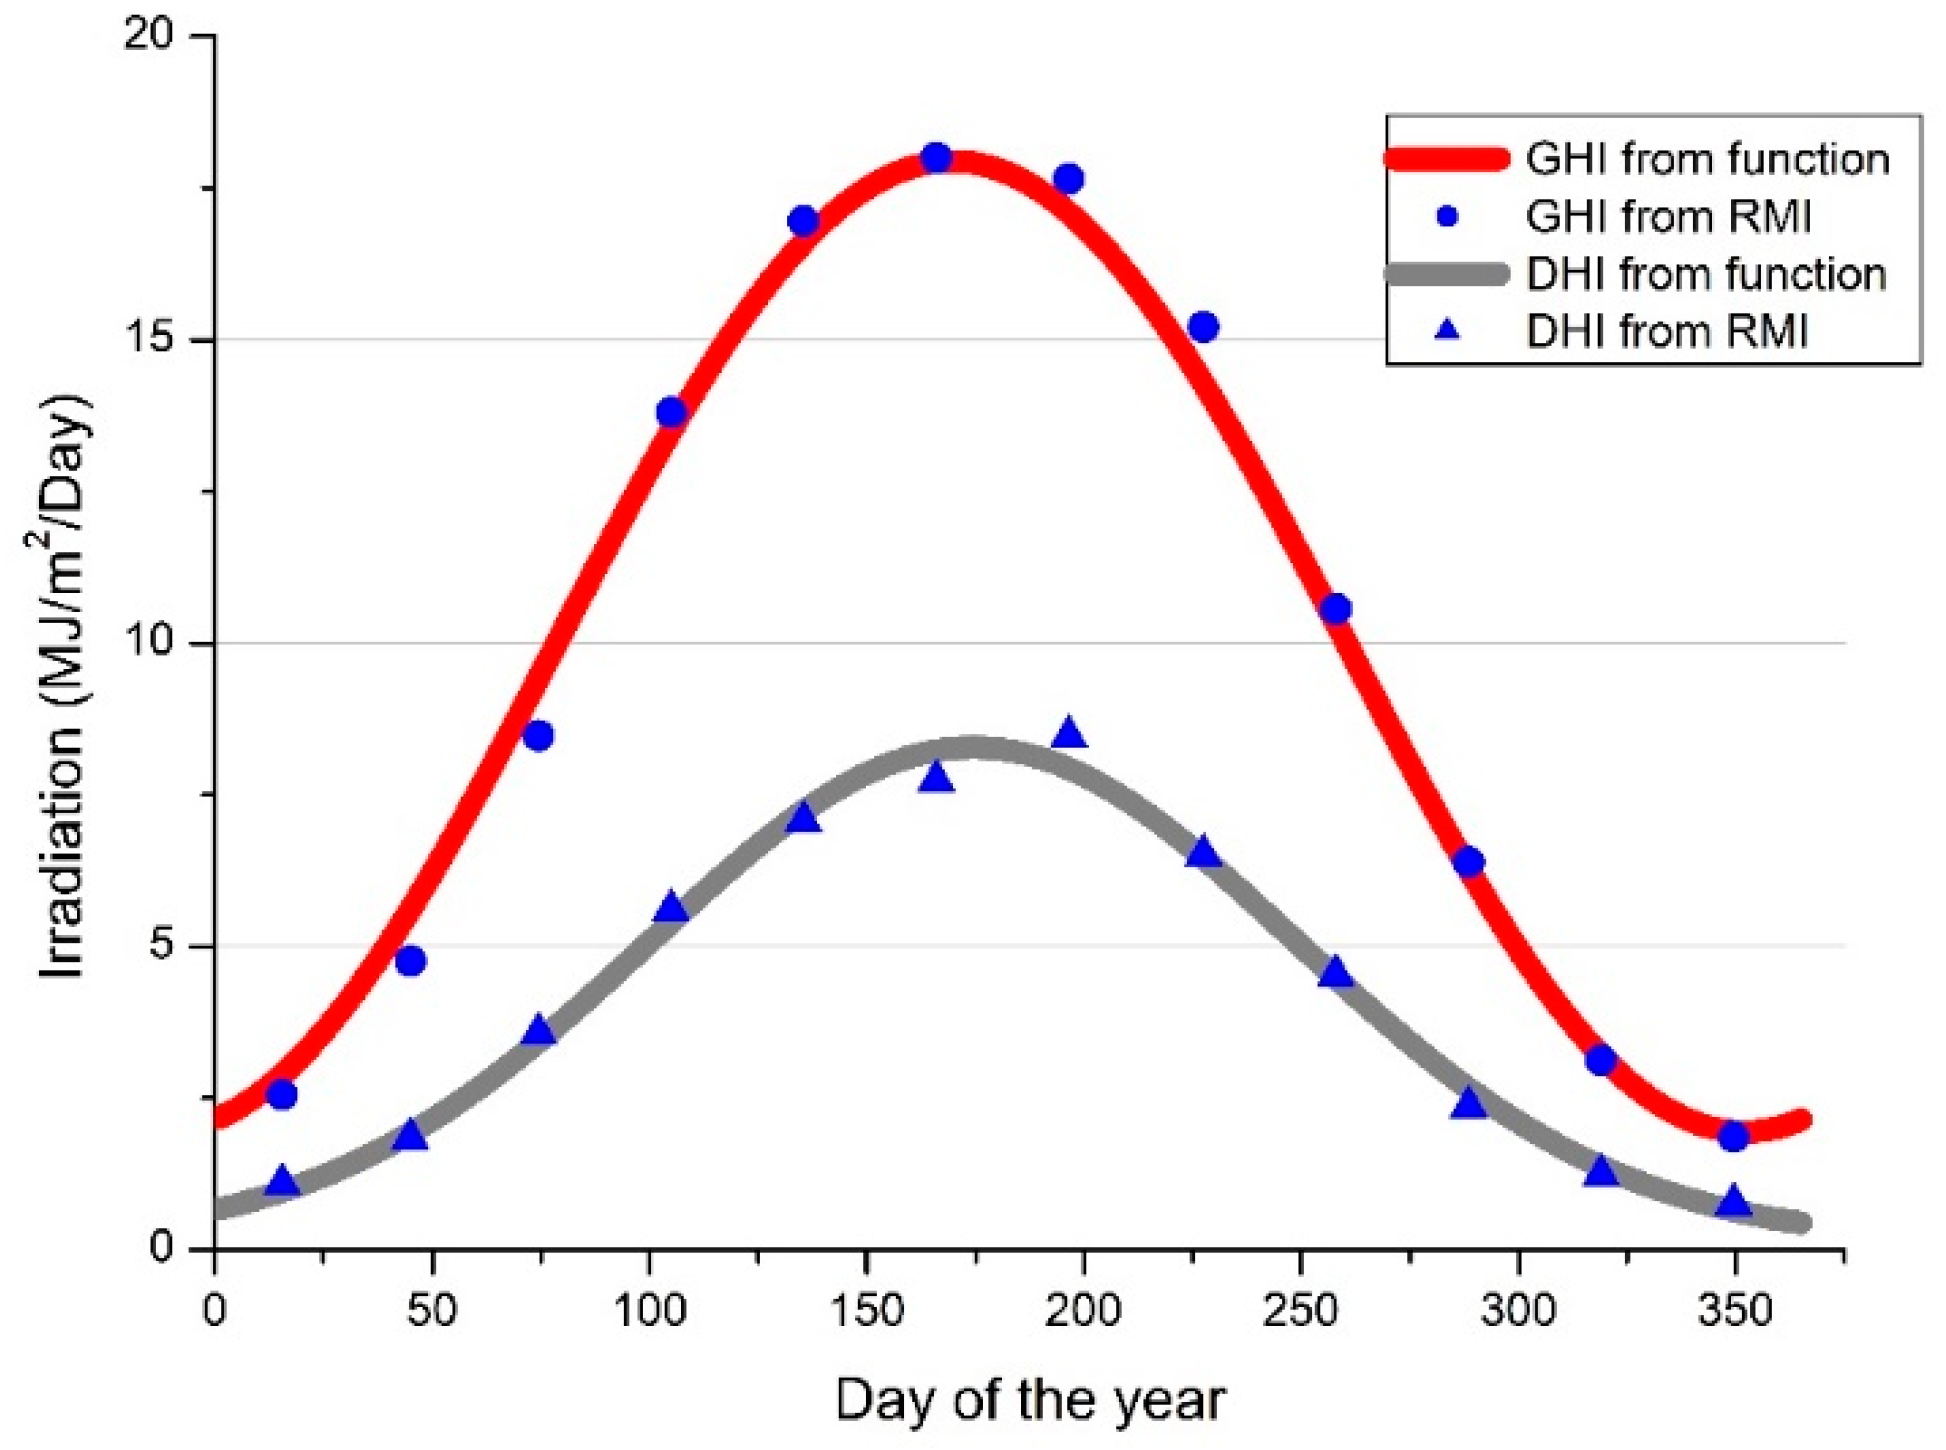
In this study, a course of DHI over a full year is necessary so that the diffuse intensity of solar radiation is known for every day of the year. As illustrated in Figure 4, the monthly average daily DHI for twelve months of the year extracted from the RMI were plotted, and these values are valid for the DHI of the middle day of the corresponding month. Furthermore, these twelve values make it possible to draw up a graph in which the daily DHI is plotted as a function of the day of the year. This function can be approached with a Gaussian curve fitting (Equation (22)) and corresponds well to the twelve calculated values with , , , .
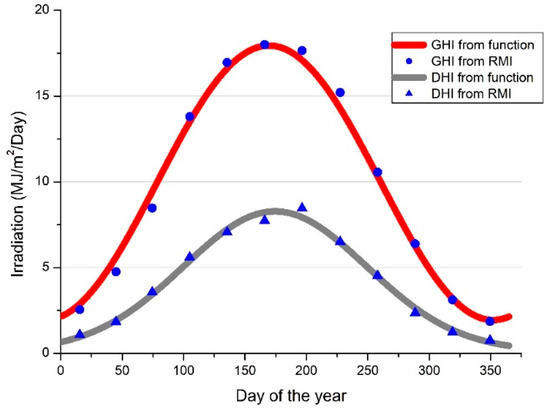
Figure 4.
A comparison between the twelve values from the Royal Meteorological Institute (RMI) database and fitted function of daily GHI and DHI calculated for Flanders.
The curve fitting method was also applied for the daily GHI estimation, however, the twelve-month average daily GHI values were taken directly from the database without any computation. Following this, a graph, which includes those values, was plotted to demonstrate the GHI over a full year and its approximate function was then able to be obtained using the Sine fitting method (Equation (23)). The function then was applied to simulate the total intensity of solar radiation on a flat surface for a certain day of the year. Figure 4 shows how well the cosine function in the model implemented and fitted with the twelve values of GHI from RMI database with , d = −8, e = 13, f = 365.
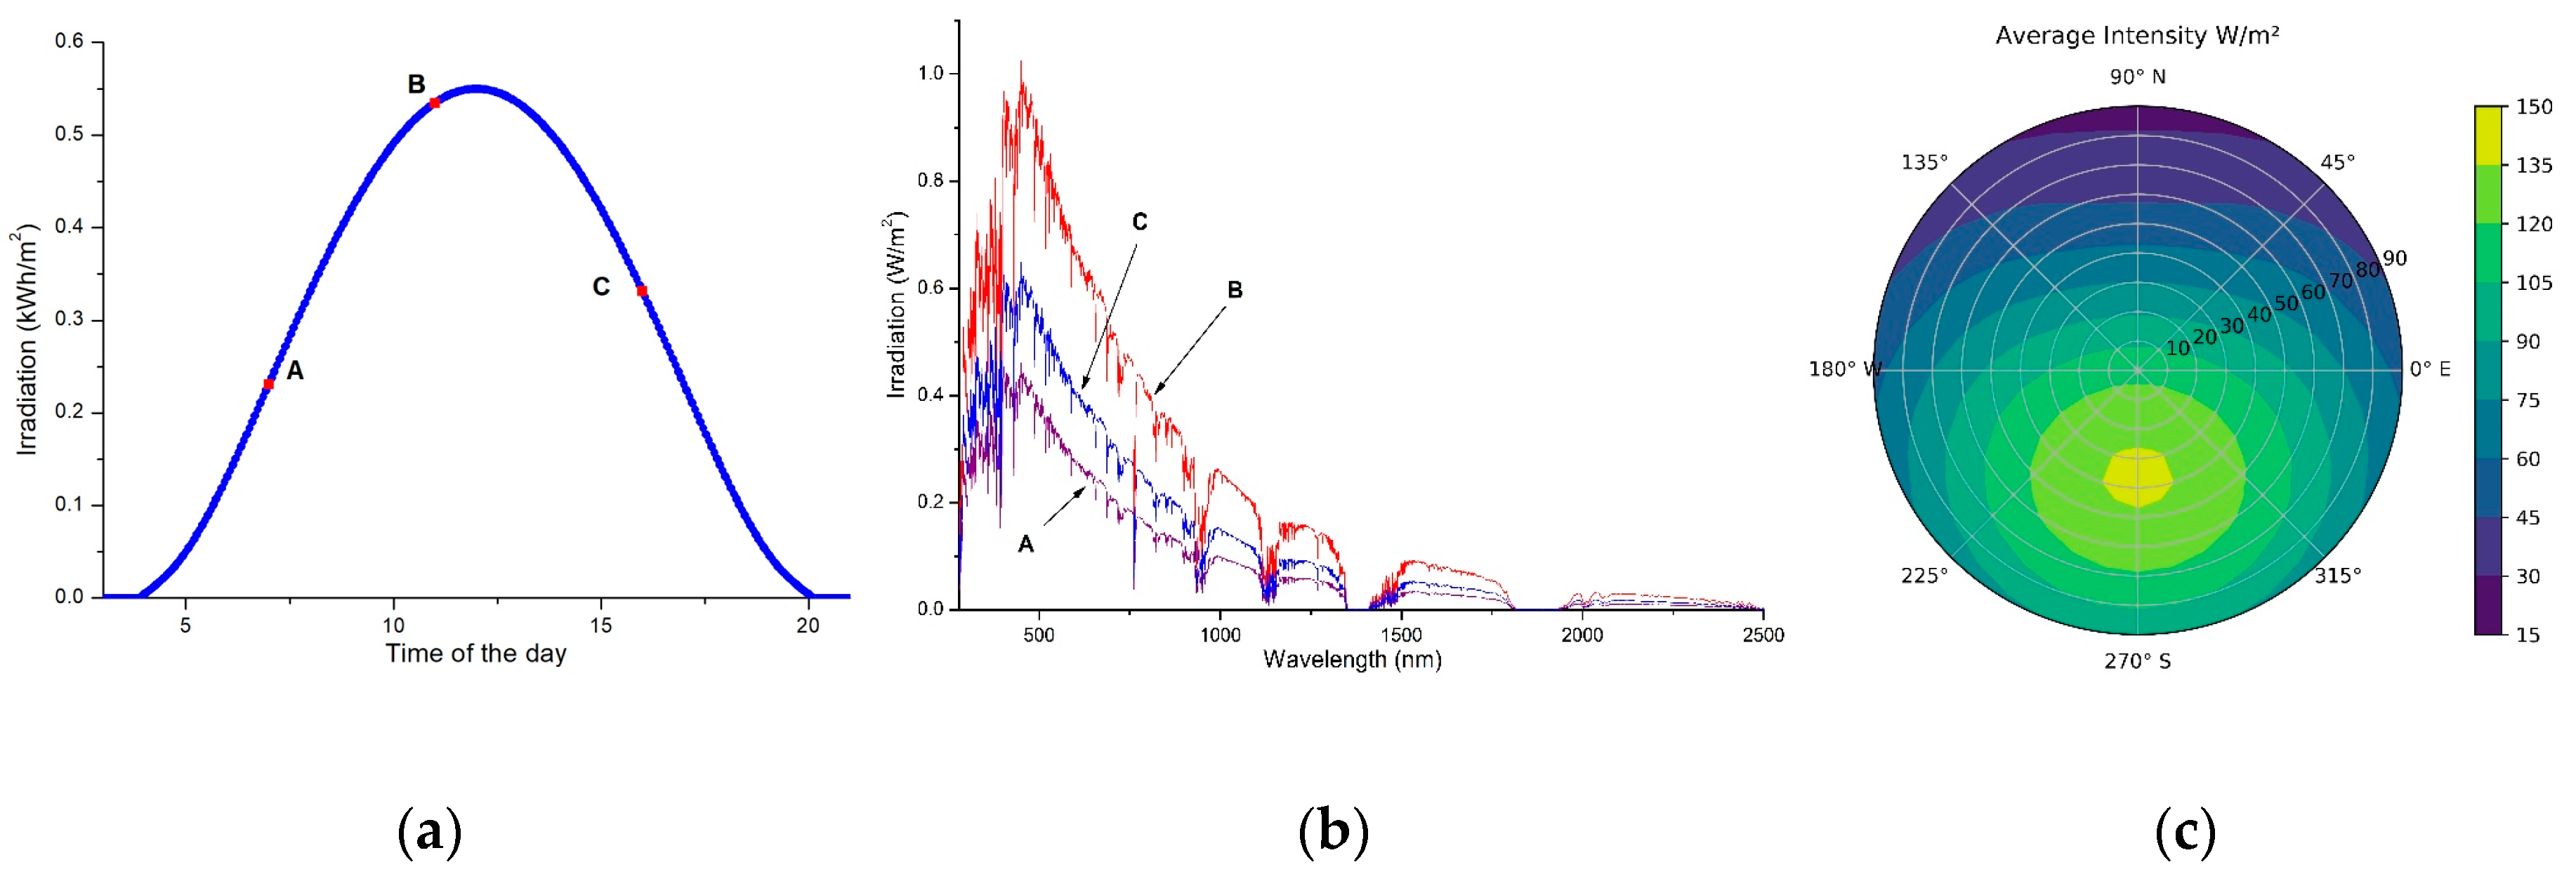
For daily calculation, the total energy yield per day was the sum of output power per time unit, which was calculated every 4 min, from the sunrise to sunset. Therefore, the solar spectra, which are needed for calculating the output power of both commercial solar panel and new technology solar cell, corresponds to each unit time needing to be computed. Figure 5a,b show the solar irradiance per time unit and some snapshots of solar spectrum on the day 182 in Flanders, Belgium, respectively. Then, the Equations (8)–(10) were applied respectively to find out , and on the corresponding tilted surface. Aiming to know how to gain the maximum irradiation on the slope, the annual average intensity was computed for different orientations of the collector, with the azimuth angle varying from 0° to 359° and the step of tilt angle is 10° (the center is 0° and the outermost circle is 90°), by summing twelve monthly average values (Figure 5c). According to the result, the annual maximum irradiation is gained when the panel azimuth angle between south-facing ±20° and its tilt angle between 30° and 50°, with an average intensity around 135 W/m2. This amount of irradiation decreases to a minimum, approximately 15 W/m2, when the panel surface faces north and its tilt angle is 90°.
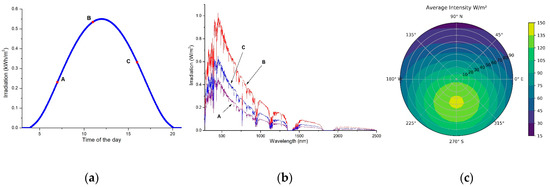
Figure 5.
Illustration of solar irradiance and spectra on the day 182 calculated for Flanders, Belgium. (a) Solar irradiance; (b) Snapshots of spectra at 7:00 am, 11:00 am and 04:00 pm; (c) Distribution of annual average intensity as a function of tilt and azimuth angles of tilted surface.
4.2. Energy Yield Calculation for Silicon Solar Panel with Arbitrary Tilt and Orientation in Flanders, Belgium
The methodology was first applied to the Flanders region in Belgium, where data from actual PV systems can be found online from Frank Deboosere [37] and T_36_Brugge [38]. The characteristics of these systems are illustrated in Table 2.

Table 2.
Characteristics of two actual installation photovoltaic (PV) systems in Flanders, Belgium.
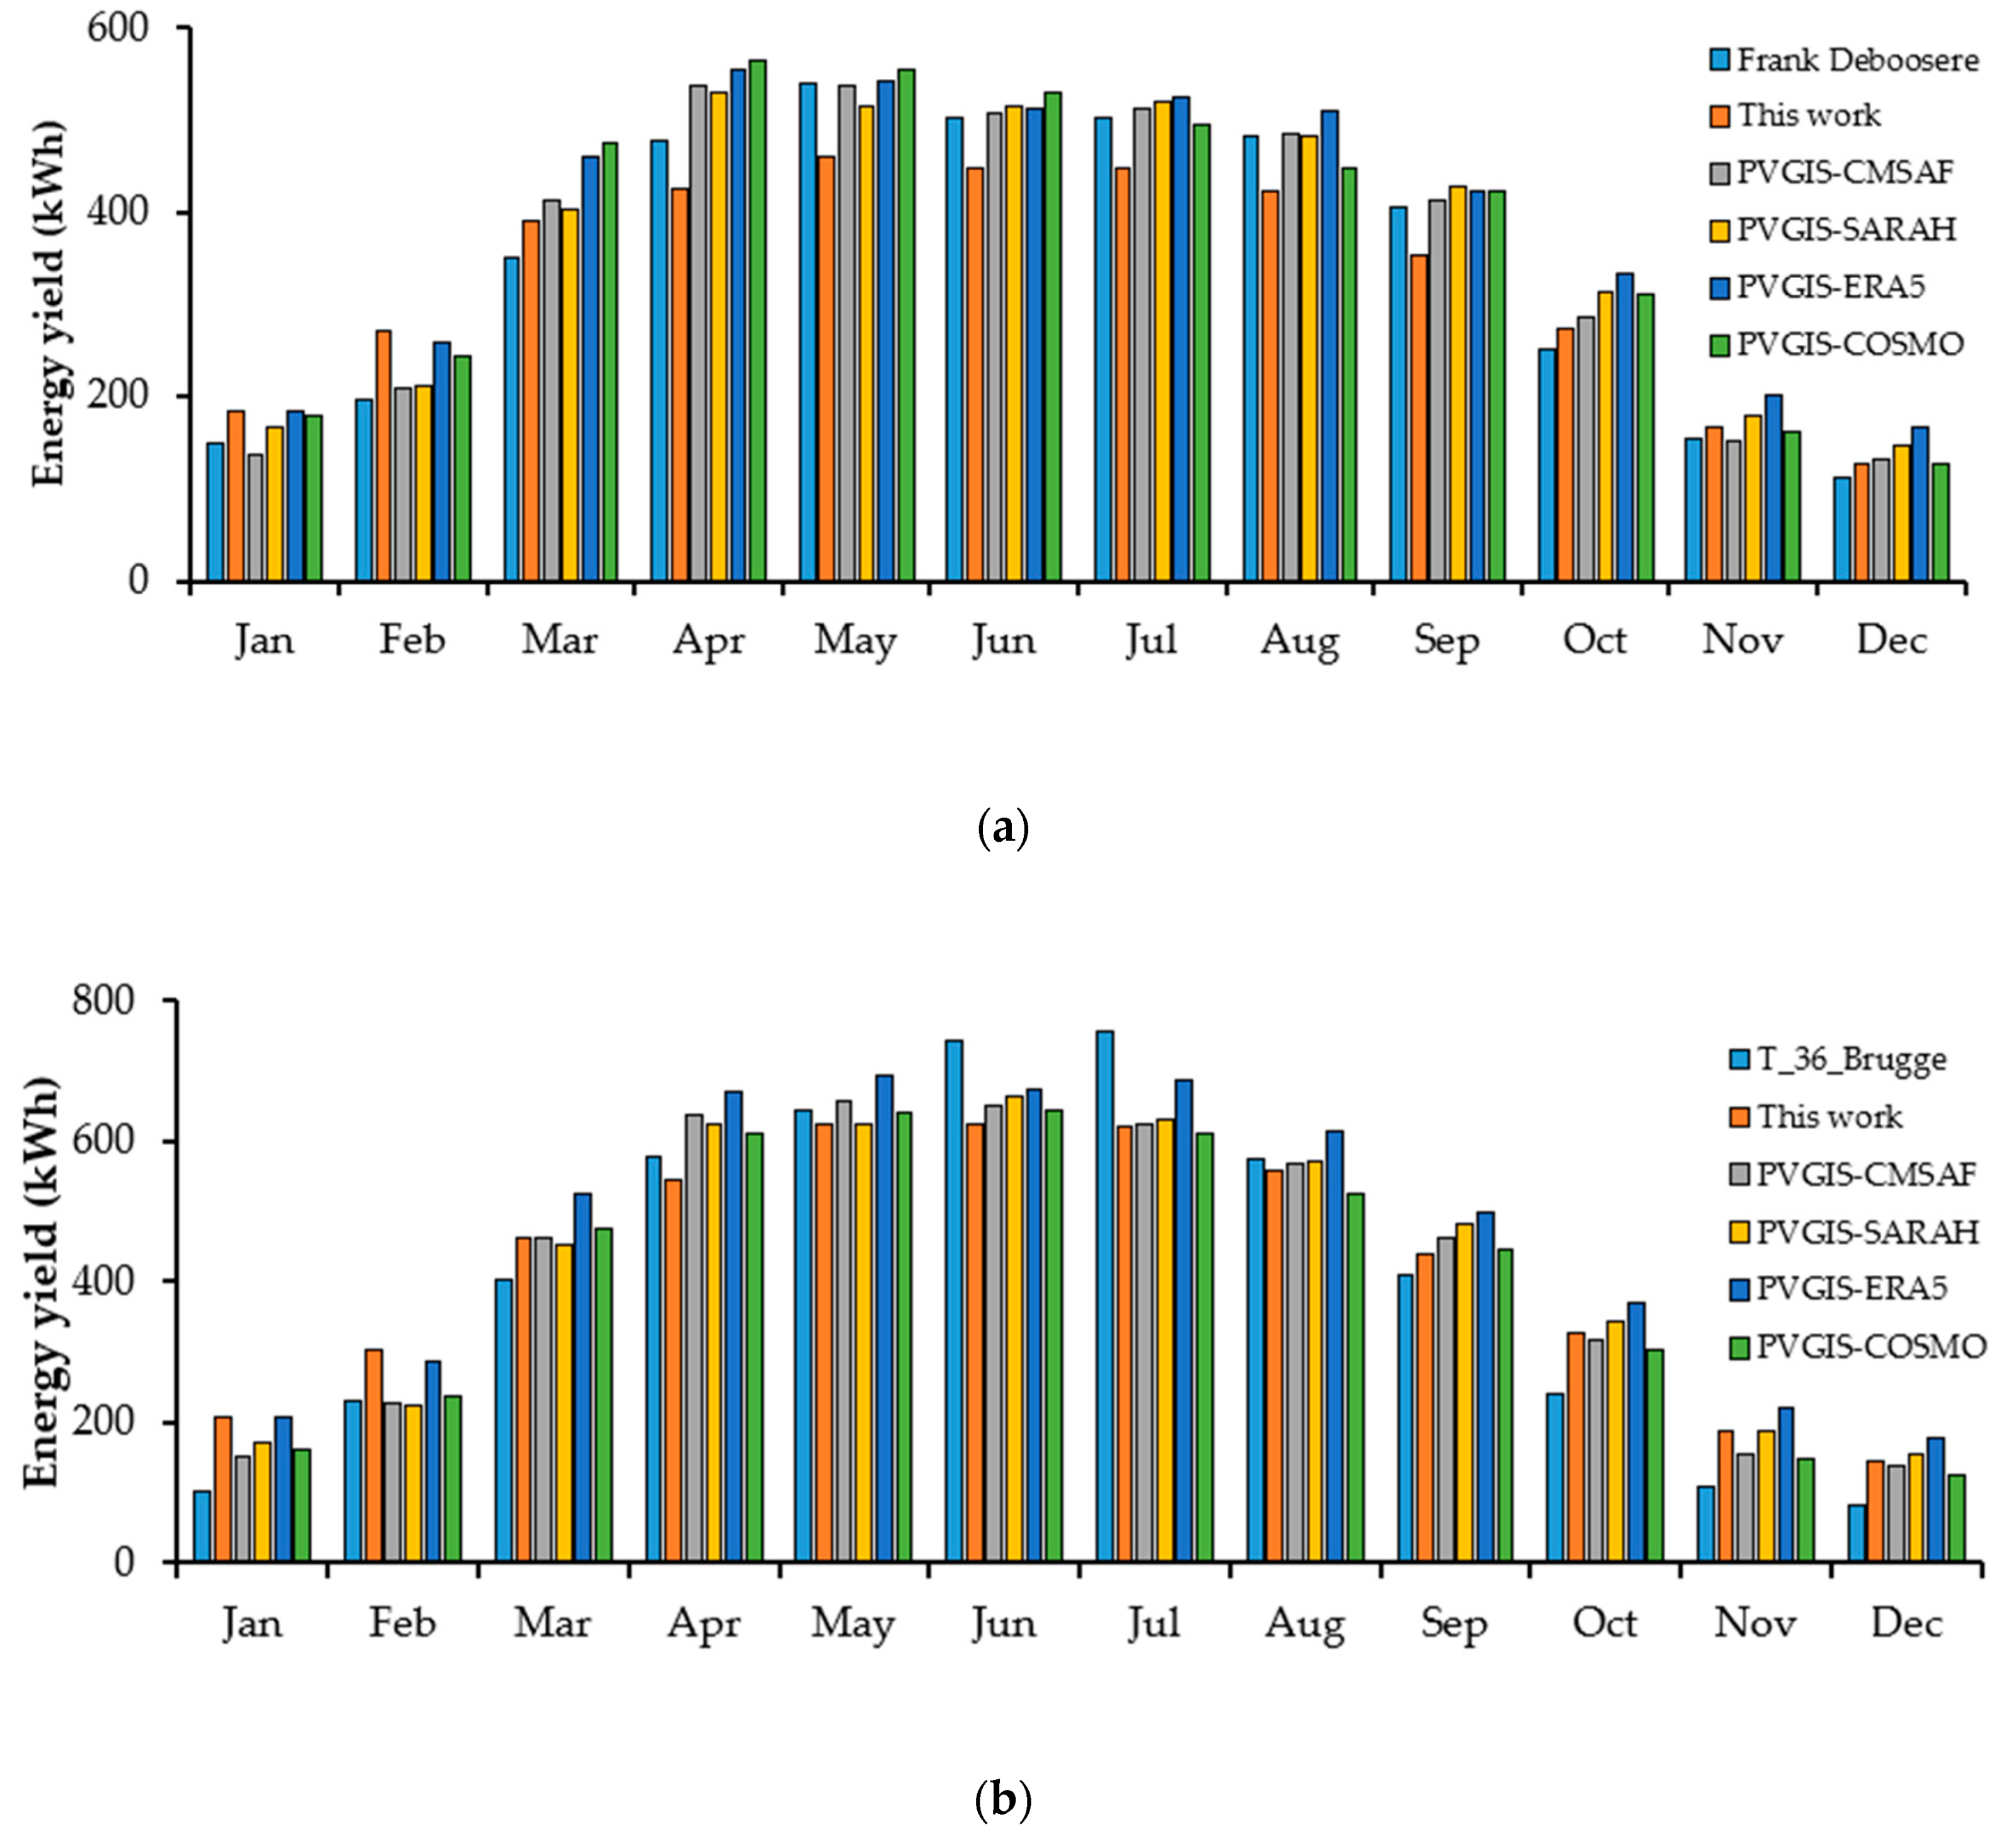
The electricity harvesting at the converter outlet and DC power produced by PV panel was computed using Equations (15) and (16), respectively. Figure 6 shows a comparison between the output production of above actual installations and the results of this study as well as other PVGIS models. For the monthly production, there are some quite significant differences between the results of this study and actual systems due to the variation in the duration of sunny and cloudy days.
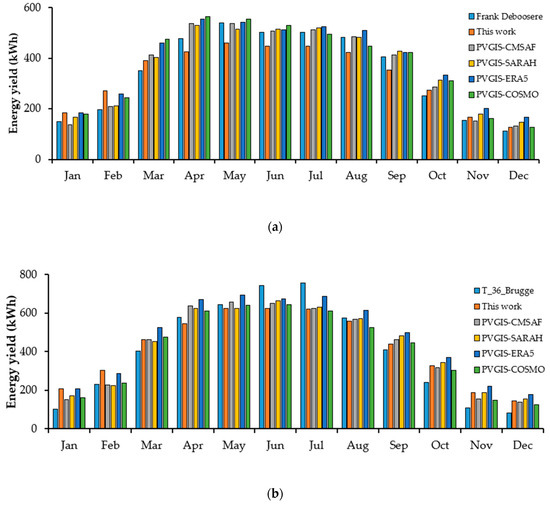
Figure 6.
A comparison of monthly energy yield between this study and two actual installation PV-systems in Flanders, Belgium as well as Photovoltaic Geographical Information System (PVGIS) models. (a) Monthly harvesting of Frank Deboosere installation; (b) Monthly harvesting of T_36_Brugge installation.
The total annual energy yield, however, has proven that the model works well and achieves a significant accuracy which is only 3.67% and 3.54% different from the data from Frank Deboosere and T_36_Brugge respectively and better than most of the PVGIS models (Table 3). As mentioned previously, to make the model as simple as possible to be able to transfer easily from one location to other regions, the regional ambient temperature was considered as a constant during the year by using annual average temperature. Additionally, the operating temperature of the solar panel also remained constant and equaled to the ambient temperature, which differed absolutely from the panel’s operating temperature. Consequently, during the time when the difference between the actual temperature and model’s temperature increases, the deviation is higher. As we can see in Figure 6, the deviation will be higher in the summer and winter when the difference in temperature is the largest. Furthermore, the simulated solar spectrum in this model was calculated without taking into account the temperature effect and remained equal between the morning and the afternoon. As a result, the estimated energy yield was well suited to the data from Frank Deboosere, which was mainly morning sunlight. In contrast, the estimation for T_36_Brugge, which was mainly sunlight in the afternoon when the ambient temperature is usually higher than in the morning, did not show the lowest deviation. To overcome this problem, the influence of temperature on the operation of the PV cells and the relevance between ambient temperature and solar irradiation need to be taken into account.

Table 3.
Annual yield of actual installation PV systems compared to the results of this work and other models.
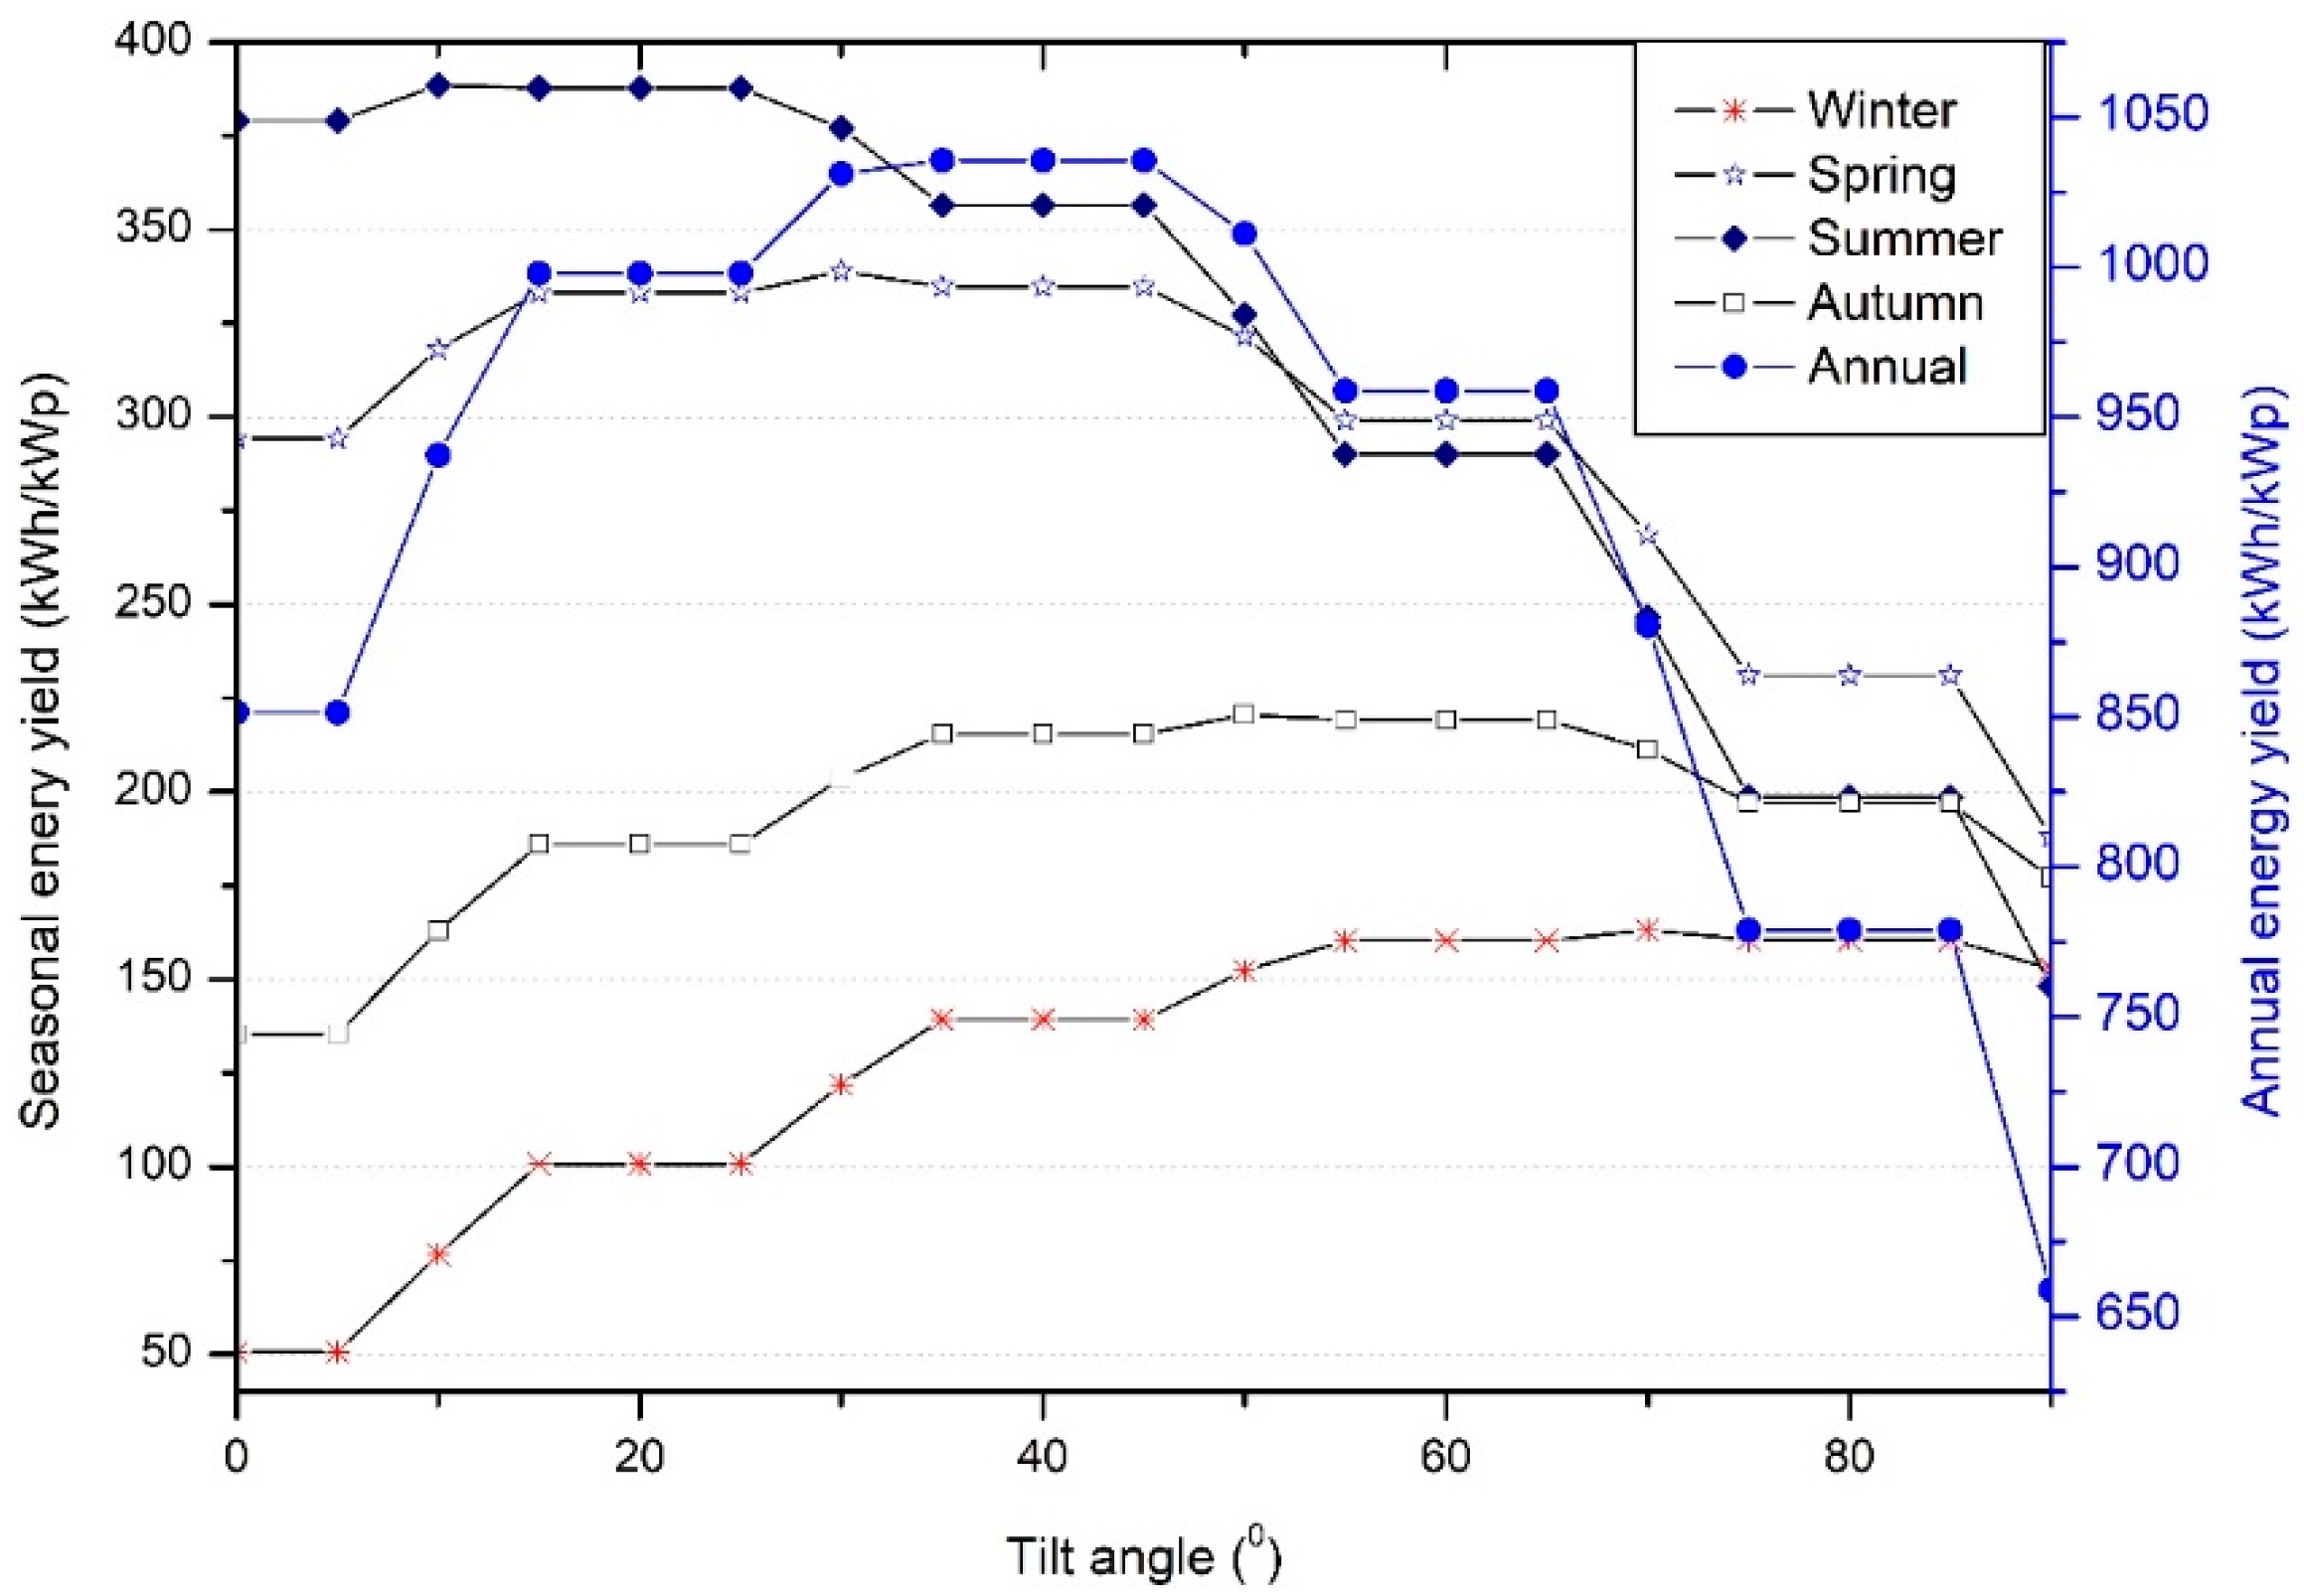
Figure 7 shows the total of seasonal and annual energy yields of 1 kWp Si-based commercial panel in Flanders at various tilt angles and facing south. Due to more sunshine and longer daily time, the energy harvested in the summer is the highest compared to other seasons, while that of the corresponding time in winter is the lowest. During the summer months (June, July and August), the energy yield is at maximum with tilt angle around 20° and decreases gradually when the tilt angle increases due to the high solar latitude. In contrast, because of the low latitude of the sun during the winter time, the harvesting energy increases proportionally to the tilt angle and reaches a peak when the slope is around 60°. To maximize the annual harvesting, the angle of the slope should be between 35° and 45°. Adjusting the tilt angle in this way can increase the annual yield up to 26% compared to the harvesting of horizontal panel, with 1035.6 kWh per kWp and 851.4 kWh per kWp, respectively.
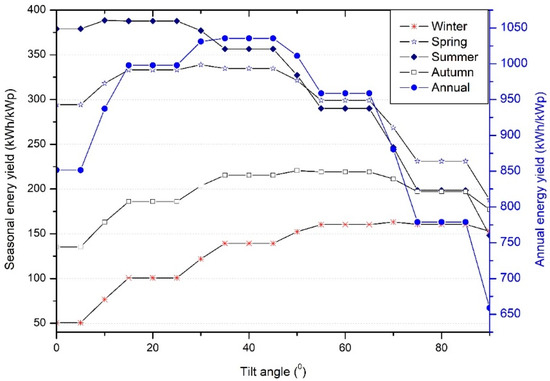
Figure 7.
Seasonal and annual yield of 1 kWp Si panel calculated at different tilt angle and azimuth = 0° for Flanders, Belgium.
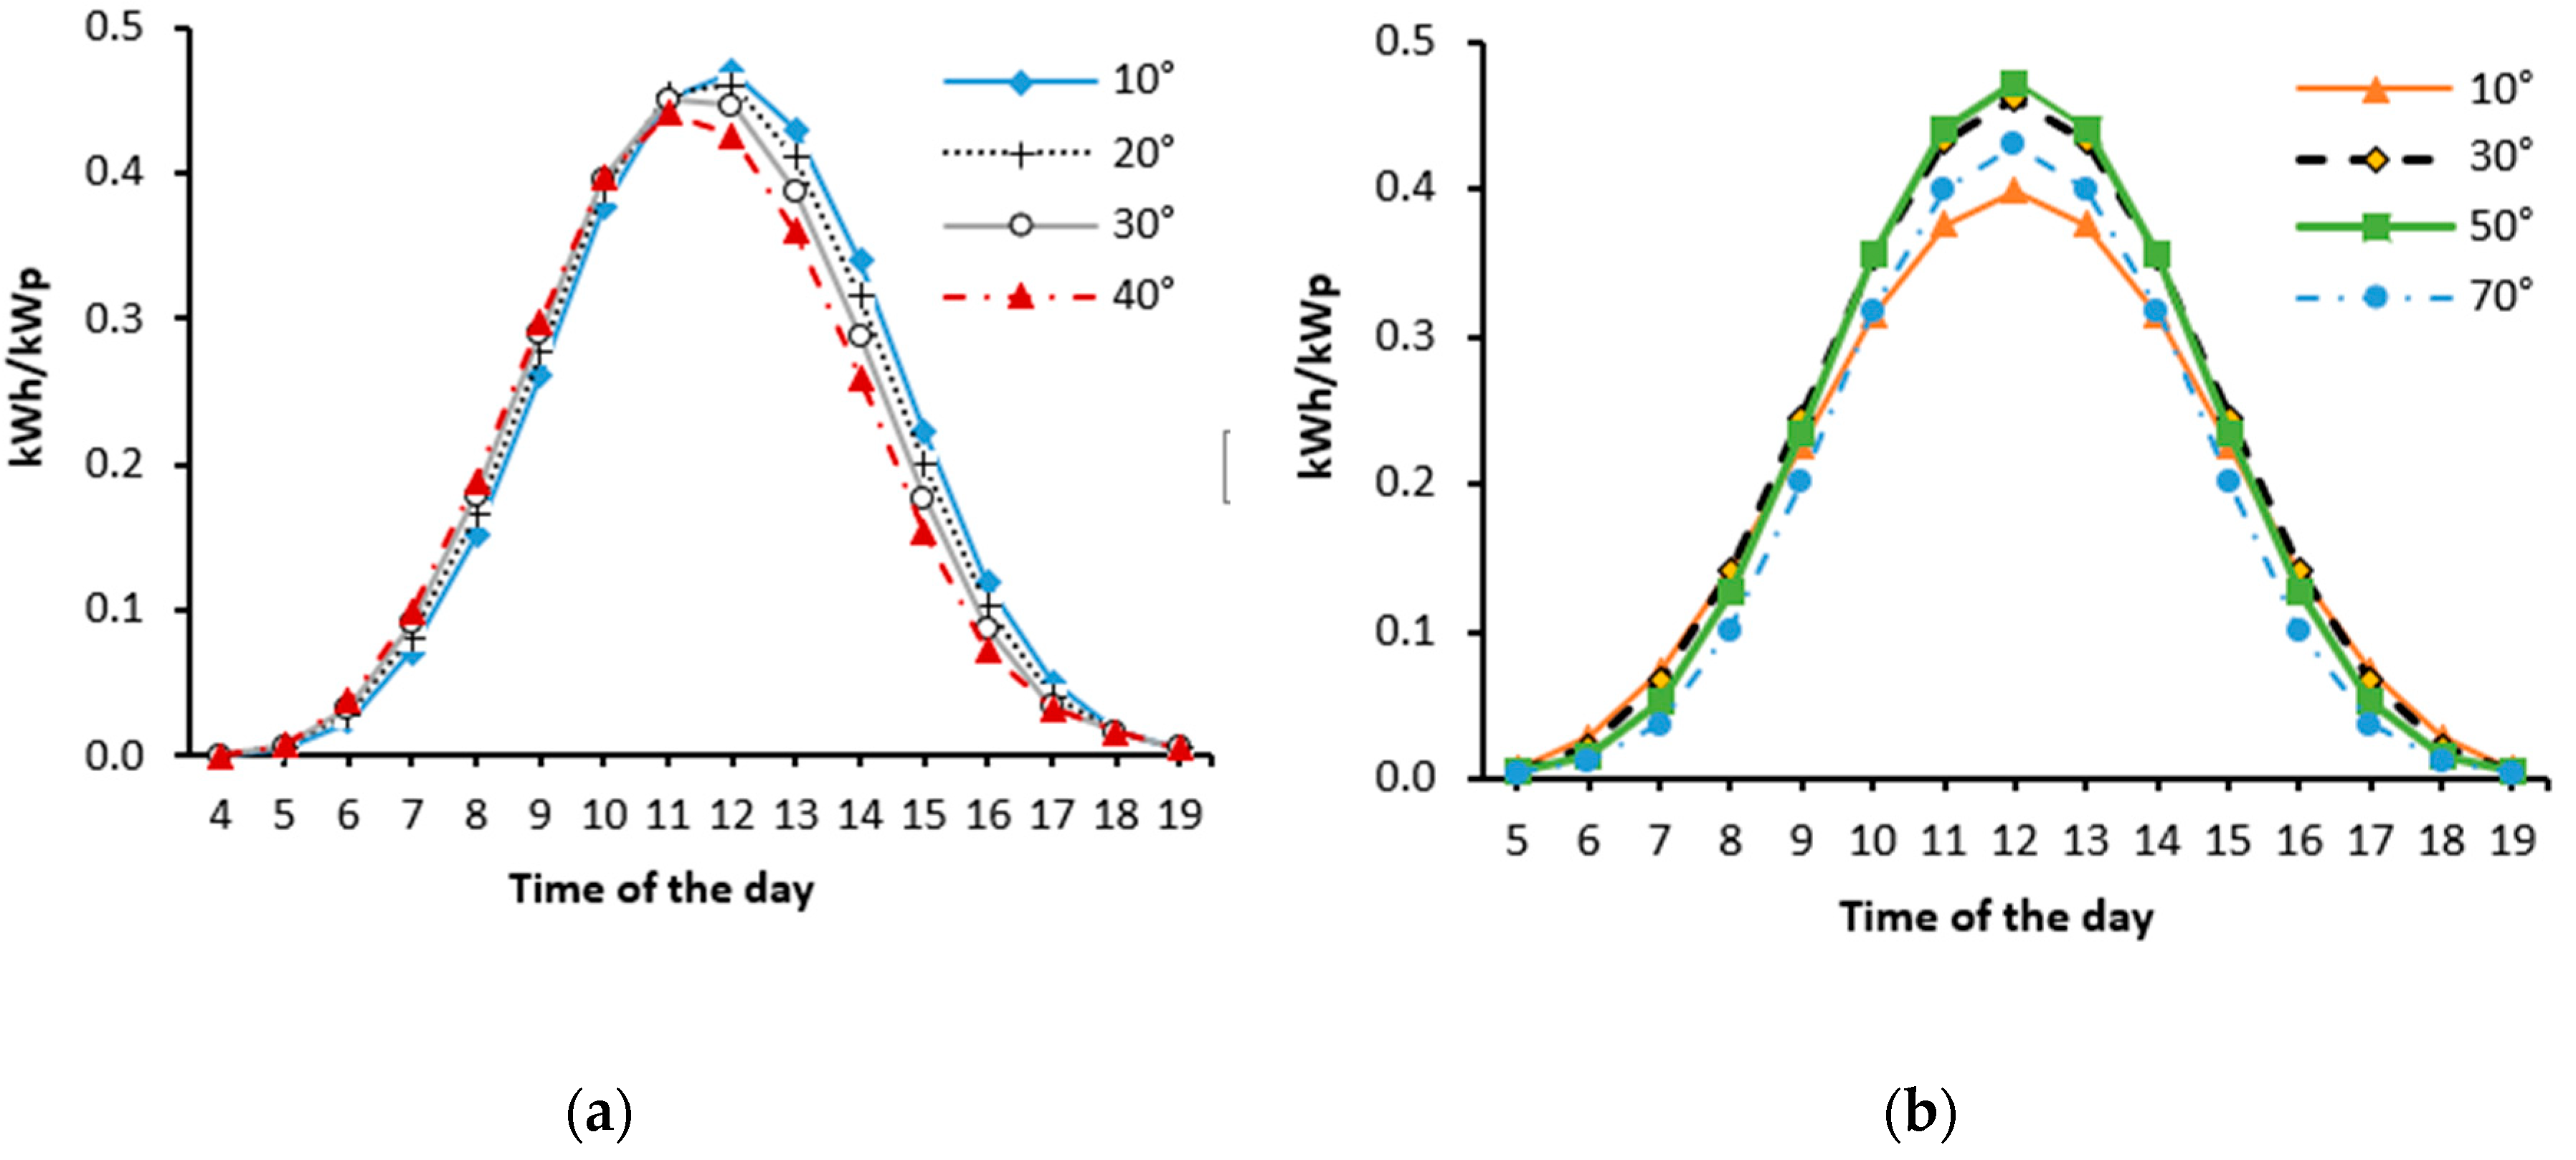
Furthermore, the amount of hourly harvesting power can be affected by adjusting the azimuth and slope angle of the collector [14]. Figure 8a illustrates how the azimuth angle affects the performance of the PV panel during day 15 in Flanders region. If the azimuth angle was increased, the PV would gain more energy in the morning and quite lower in the afternoon, while adjusting to a suitable tilt angle could increase the yield all the time during the day (Figure 8b). Consequently, this phenomenon can be supportive in the case of building-integrated PV system in cold climates and high longitude regions, such as Flanders, where buildings consume much energy in the morning for heating inside and most of them do not have an electricity storage system.
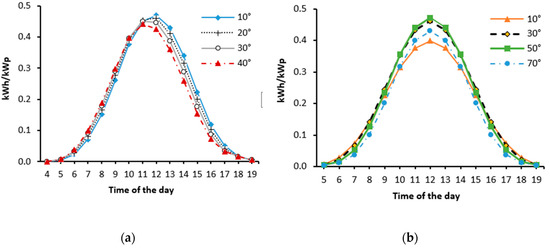
Figure 8.
Average power (kWh) generated by 1 kWp panel from 5:00 am to 19:00 pm at different orientations. (a) Panel operates at tilt angle 40° and four specific azimuth angles on day 15th; (b) Panel operates at various tilt angles and facing-south.
4.3. Transferring the Model to Vietnam Conditions
This model was afterward transferred to three other specific regions in Vietnam, which is located in South East Asia and extends between latitudes 9° N and 23° N with a long coastline on the east and high mountain on the west. These natural geography conditions lead to three different climate regions in Vietnam and these zones, therefore, also have different behavior of solar radiation, which varies from 3.0 kWh/m2 to 5.0 kWh/m2 per day [39].
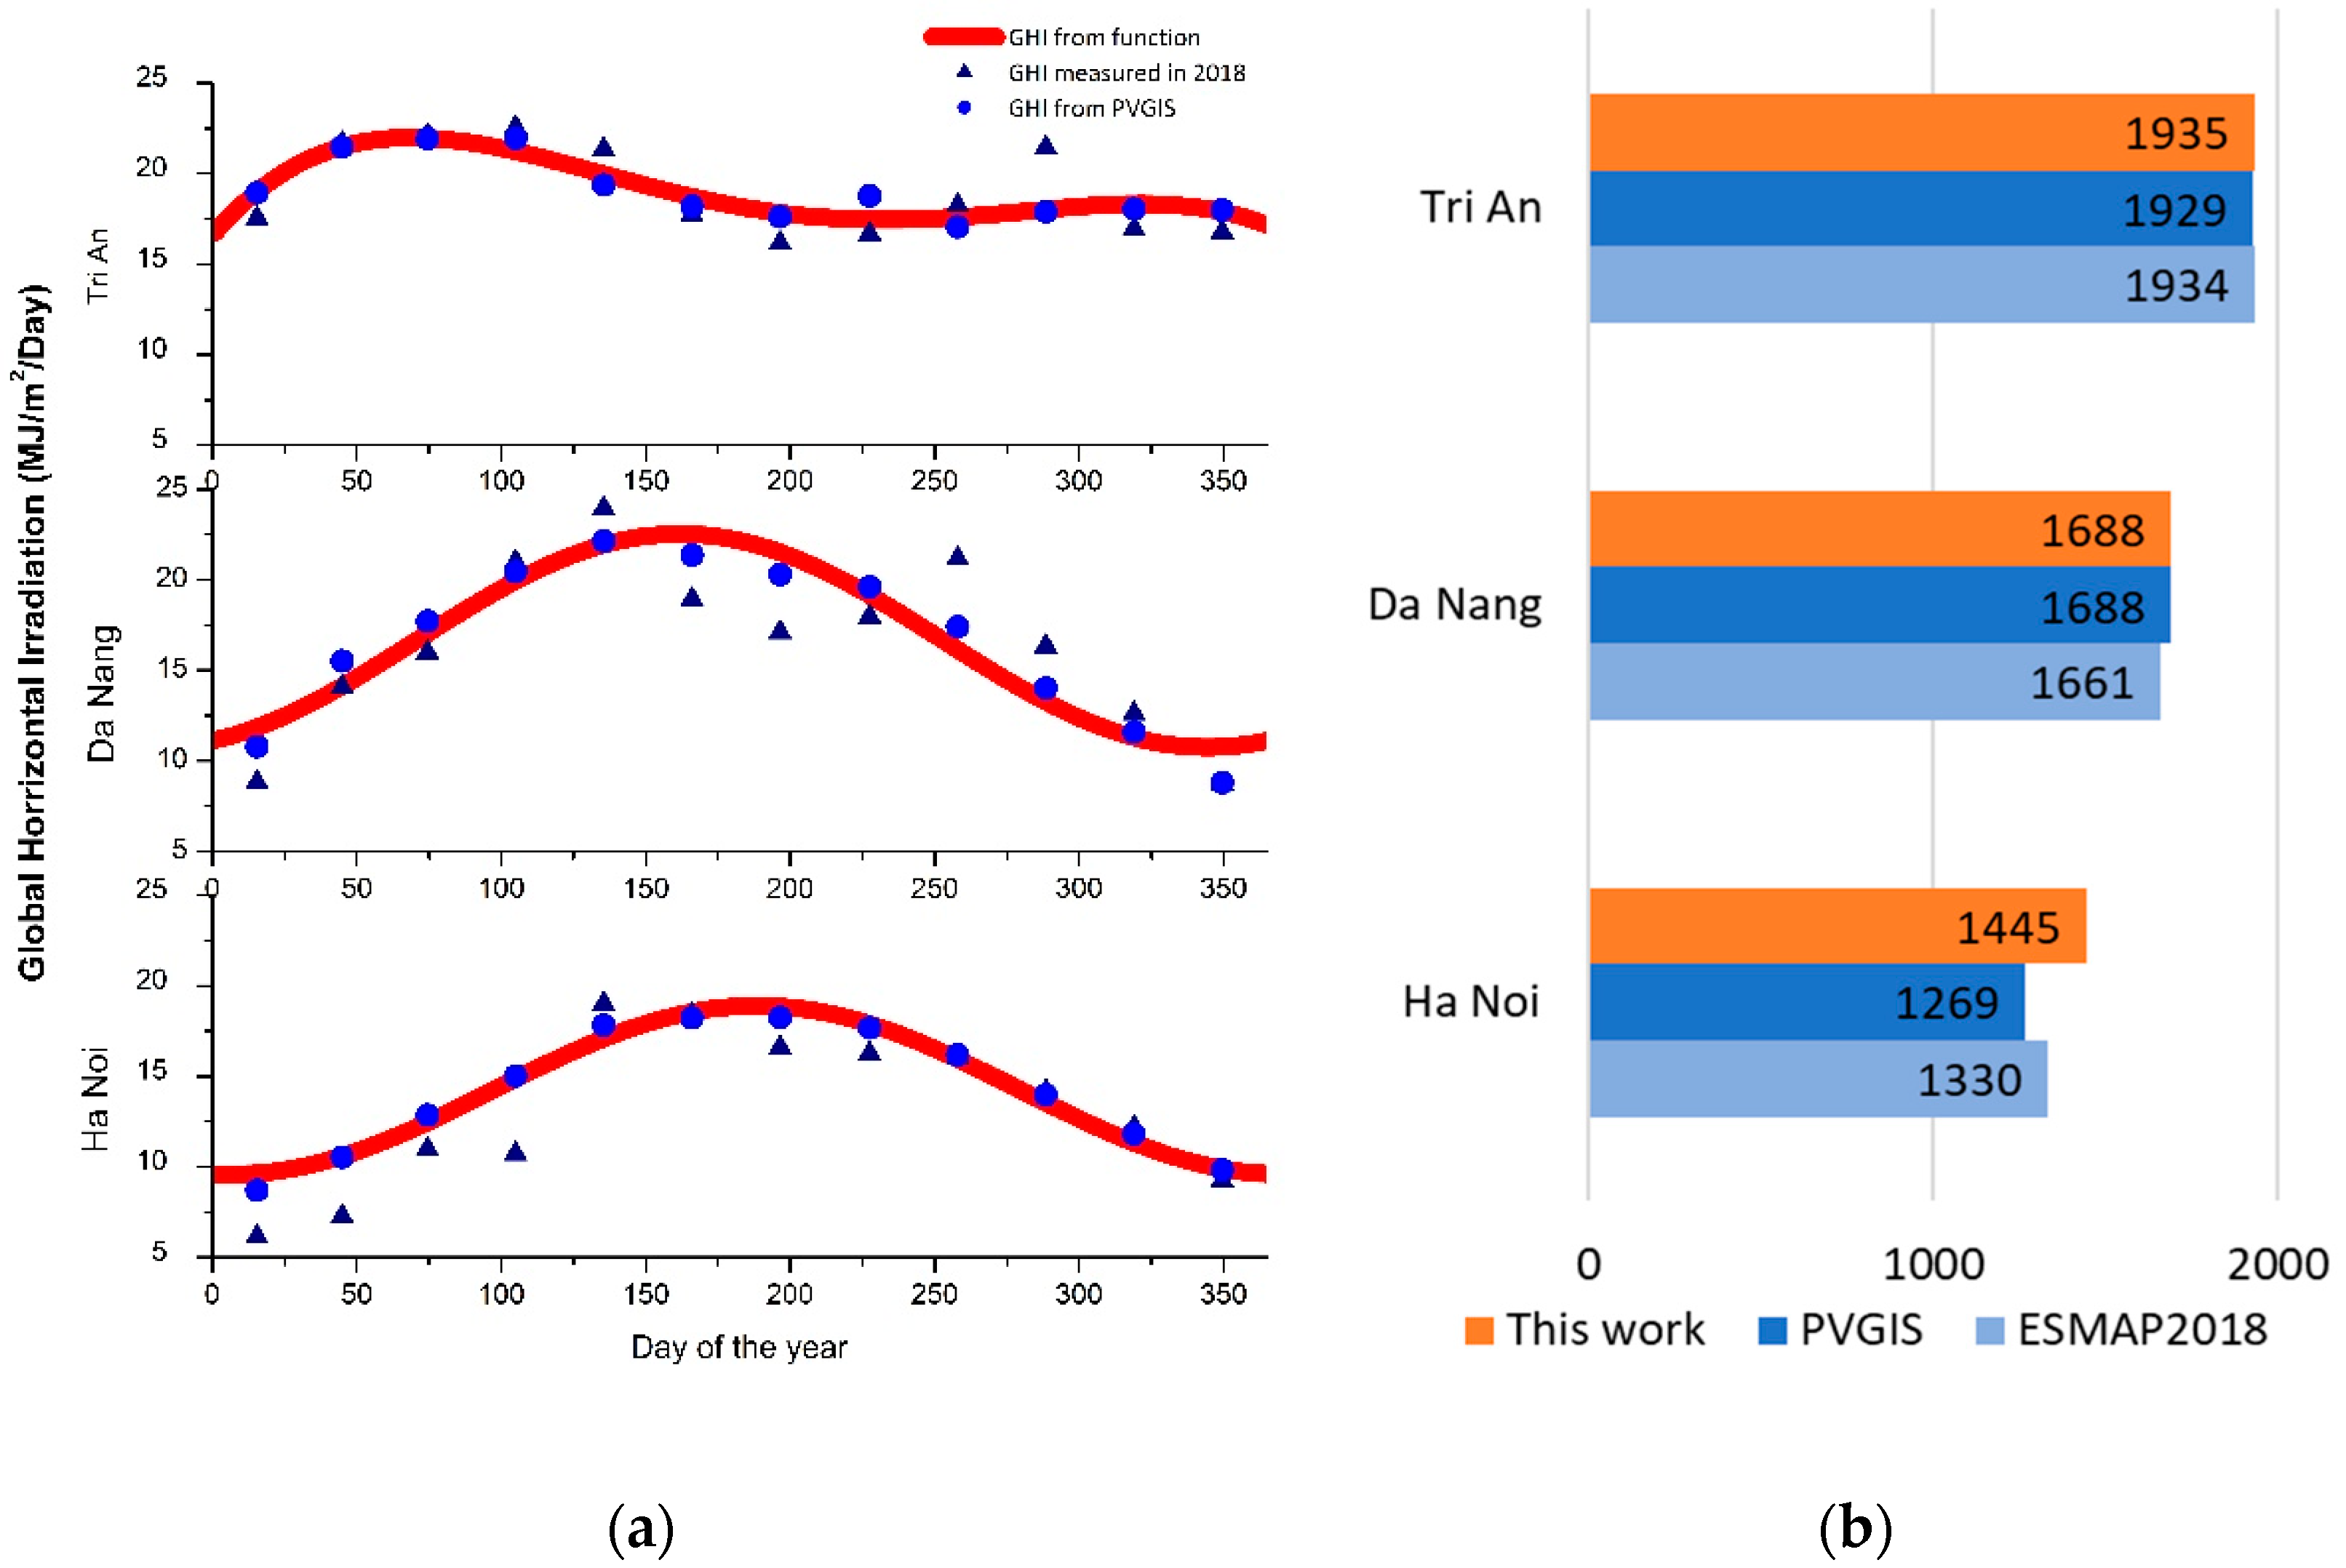
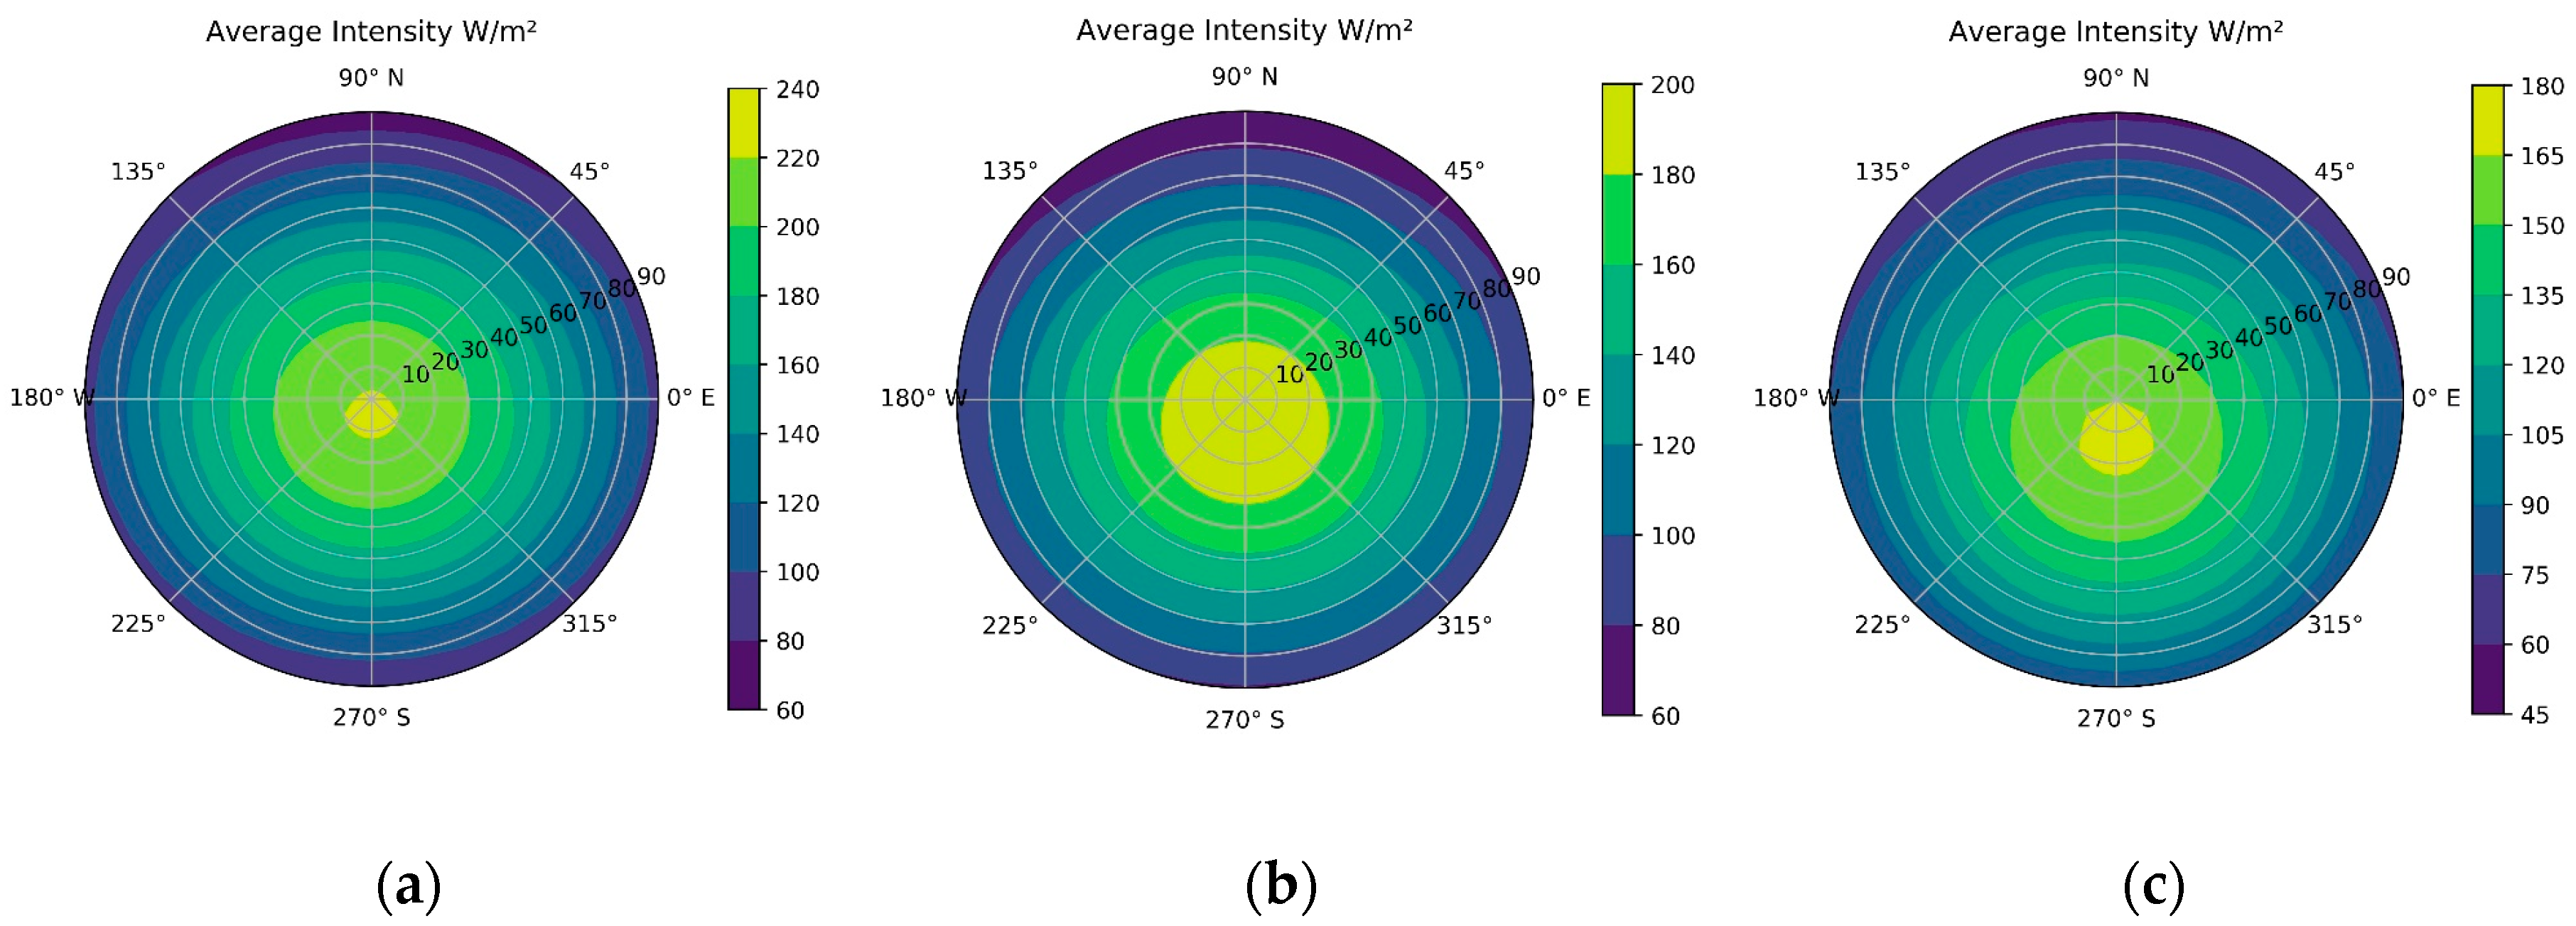
The same procedure was applied for three cities: Ha Noi, Da Nang and Tri An, which symbolize the three major climatic zones in Vietnam [27], using the online database from PVGIS. Because of the different climate, the curve fitting method applied for each region to estimate GHI was also dissimilar. The sine fitting function was used for Ha Noi and Da Dang while for Tri An, where the climate is tropical west and dry, the polynomial fitting function was applied. The estimated GHI was presented together with twelve average monthly daily GHI from database, including data from PVGIS and onsite measurements in 2018 from ESMAP, in Figure 9a showing that the fitted function worked smoothly and reliably. Subsequently, there was an insignificant difference between the calculated annual GHIs, which almost satisfies prior research about solar irradiation in Vietnam [27,40], and the measurements in 2018 as well as PVGIS data (Figure 9b). Furthermore, the annual average intensity distribution acting as a function of tilt and azimuth angles was illustrated in Figure 10 to give an overview about the energy potential of each location. Table 4 shows a comparison between the monthly and annual yield for 1 kWp Silicon commercial panel placed horizontally calculated by this study and other online models, PVIGS and PVWATTS [41].
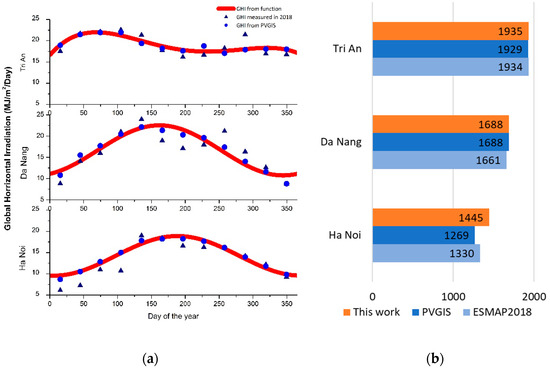
Figure 9.
(a) Comparison between twelve values of the database and the fitted function of daily GHI; (b) Comparison of total annual GHI at three regions in Vietnam.
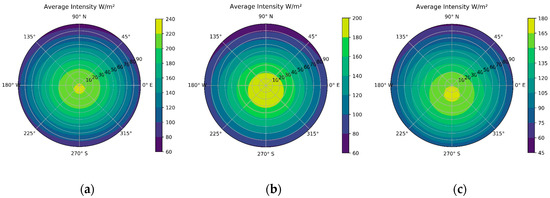
Figure 10.
Distribution of annual average daily intensity as a function of tilt and azimuth angles of the slope. (a) Tri An; (b) Da Nang; (c) Tri An.

Table 4.
Electricity energy yield of 1 kWp horizontal Si-based commercial PV installation for different regions in Vietnam.
4.4. Estimation Using EQE of State-of-the Art Solar Cells
To calculate the energy harvesting of tandem solar cell, the solar spectral irradiance on cell surface, which were computed using Equation (18), and reference EQE of sub-cells obtained from [7] were applied. The predicted annual energy yields of those Si-based tandem solar cells, the tilt and azimuth angles of which were 0°, for specific regions in Belgium and Vietnam, are presented in Table 5. Compared to the Si heterojunction, both 2-T and 4-T GaInP/Si tandem cells provided a significantly larger annual energy production with an average over 60% higher than that of Si solar cell. However, GaAs/Si performed in absolutely different ways, while the energy yield of 4-T tandem cell is higher than that of Si cell and nearly equals the yield of 2-T GaInP/Si tandem cells. The 2-T tandem cell, in contrast, the production decreased approximately a half compared to Si cell for each location. This indicated that a series connection is not suitable for GaAs/Si tandem cell in these regions, while it seems not to be a big issue for GaInP/Si tandem cell. However, to satisfy both efficiency and cost, higher bandgap GaInP is required to apply for the two-terminal tandems while lower bandgap GaAs is suitable for four-terminal tandem cells [42].

Table 5.
Annual yield of Si-based tandem solar cells (kWh/m2) for different regions.
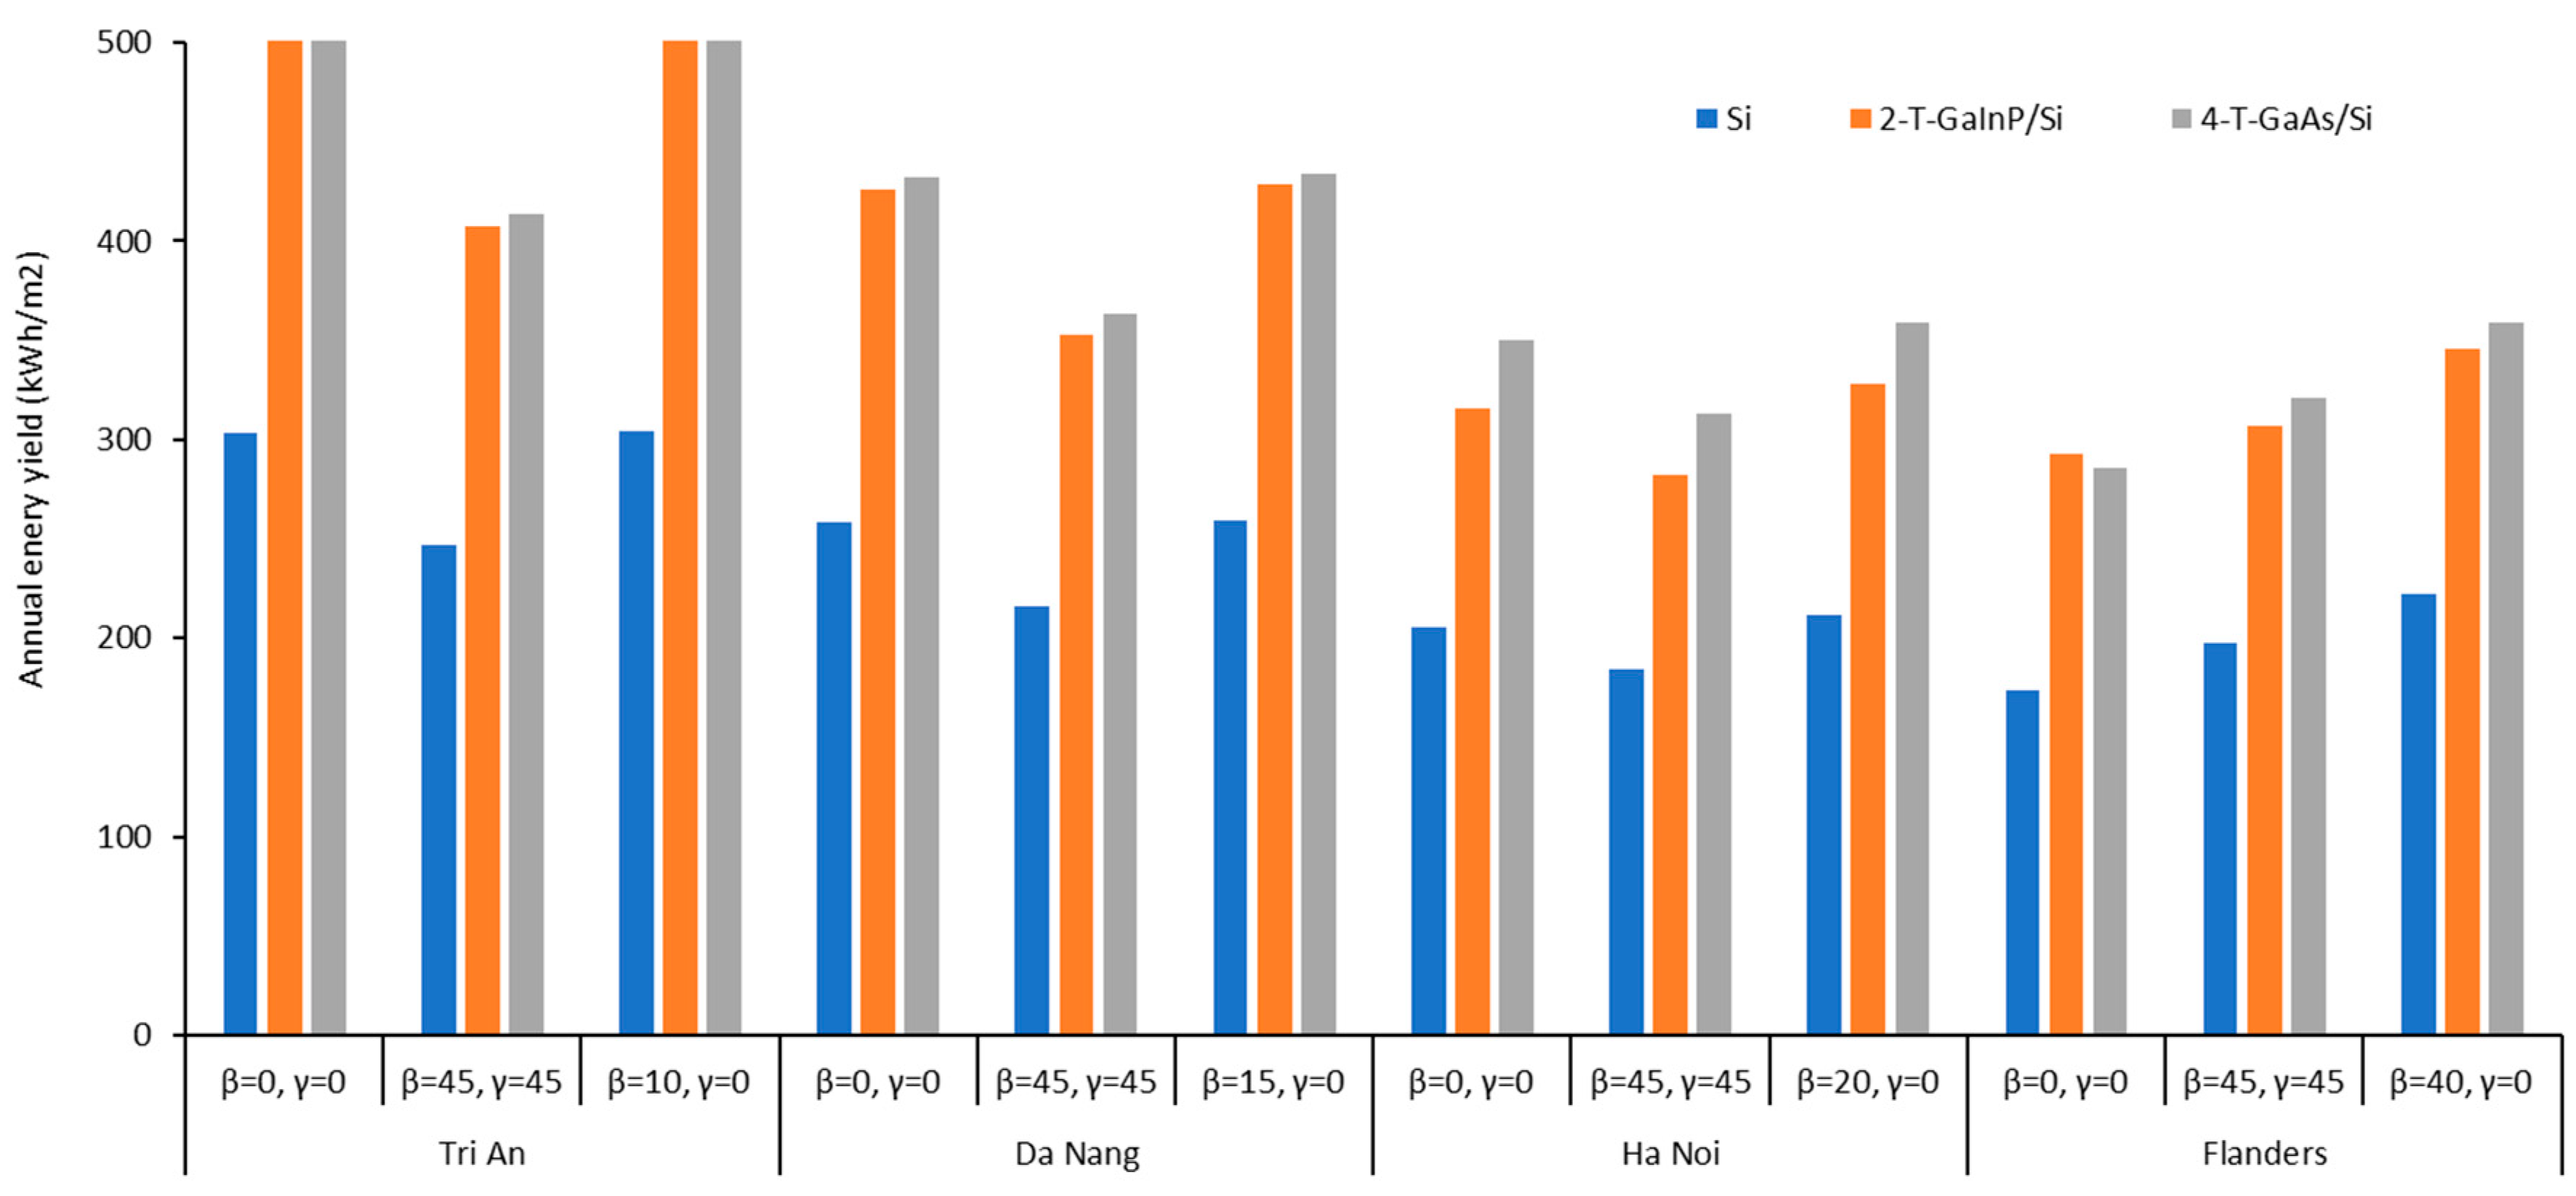
Figure 11 illustrated the annual harvesting of tandem PV cells under three different combinations of azimuth and tilt angle of the collector. The first two combinations were chosen arbitrarily while the latter approximated to the optimal orientation. It again clarified that the energy yield of tandem solar cells was also able to enhance by improving the tilt and azimuth angle of the PV panel. This is very useful in the case of predicting the harvesting energy for a building-integrated PV system which is usually installed on a fixed existed slope or azimuth angle. On the other hand, the annual harvesting energy of tandem solar cells in Tri An and Da Nang is significantly greater than that of Si solar cell, while the difference between them is inconsiderable for Ha Noi and Flanders regions.
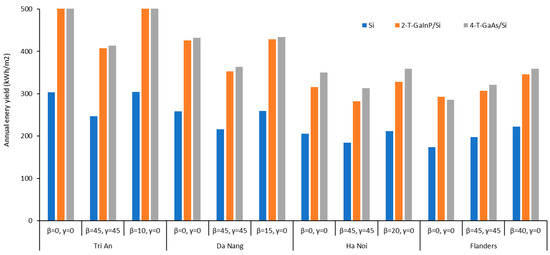
Figure 11.
Comparison between annual yield in various orientations of different PV technologies.
5. Conclusions
This paper showed that with a minimum input parameter of the weather conditions and product properties, the solar energy yield of a commercial Si-based solar panel can be calculated precisely. In practical operating conditions, the variation of solar spectrum and the incident angle of light have a strong effect on the performance of solar cell. Therefore, predictability of energy yield under real conditions can provide a better solution for setting up a solar energy system which performs under various available orientations and locations. Furthermore, this method can be used to calculate the energy production of the state-of-the art tandem solar cells which are strongly affected by the variation of the solar spectrum.
This study took into account the effects of the solar spectrum, the time of day and panel orientation, which are the major mechanisms affecting the harvesting of an actual PV installation. Operating temperature has remained constant, aiming to keep it sufficient, simply to be able to transfer smoothly to other locations. The future work could focus on the effect of onsite temperature to the solar spectrum and performance of the solar cells to optimize the accuracy of this methodology. In addition, the actual harvesting energy calculating for other cutting-edge tandem solar cells could be taken into account.
Author Contributions
Conceptualization, J.L. and D.P.N.N.; methodology, J.L.; software, J.L. and D.P.N Nguyen; validation, J.L.; formal analysis, D.P.N.N.; investigation, J.L. and D.P.N.N.; resources, J.L.; data curation, J.L. and D.P.N.N.; writing—original draft preparation, D.P.N.N.; writing—review and editing, J.L. and D.P.N.N.; visualization, D.P.N.N.; supervision, J.L.; project administration, J.L.; funding acquisition, J.L. All authors have read and agreed to the published version of the manuscript.
Funding
This research received no external funding.
Conflicts of Interest
The authors declare no conflict of interest.
References
- Philips, D.S.; Warmuth, W. Fraunhofer ISE: Photovoltaics Report. Available online: https://www.ise.fraunhofer.de/en/publications/studies/photovoltaics-report.html (accessed on 19 April 2020).
- Battaglia, C.; Cuevas, A.; De Wolf, S. High-efficiency crystalline silicon solar cells: Status and perspectives. Energy Environ. Sci. 2016, 9, 1552–1576. [Google Scholar] [CrossRef]
- Yamamoto, K.; Yoshikawa, K.; Uzu, H.; Adachi, D. High-efficiency heterojunction crystalline Si solar cells. Jpn. J. Appl. Phys. 2018, 57. [Google Scholar] [CrossRef]
- Andreani, L.C.; Bozzola, A.; Kowalczewski, P.; Liscidini, M.; Redorici, L. Silicon solar cells: Toward the efficiency limits. Adv. Phys. X 2019, 4. [Google Scholar] [CrossRef]
- Richter, A.; Hermle, M.; Glunz, S.W. Reassessment of the limiting efficiency for crystalline silicon solar cells. IEEE J. Photovolt. 2013, 3, 1184–1191. [Google Scholar] [CrossRef]
- Yamaguchi, M.; Lee, K.H.; Araki, K.; Kojima, N. A review of recent progress in heterogeneous silicon tandem solar cells. J. Phys. D. Appl. Phys. 2018, 51. [Google Scholar] [CrossRef]
- Essig, S.; Allebé, C.; Remo, T.; Geisz, J.F.; Steiner, M.A.; Horowitz, K.; Barraud, L.; Ward, J.S.; Schnabel, M.; Descoeudres, A.; et al. Raising the one-sun conversion efficiency of III-V/Si solar cells to 32.8% for two junctions and 35.9% for three junctions. Nat. Energy 2017, 2. [Google Scholar] [CrossRef]
- Mathews, I.; O’Mahony, D.; Corbett, B.; Morrison, A.P. Theoretical performance of multi-junction solar cells combining III-V and Si materials. Opt. Express 2012, 20, A754. [Google Scholar] [CrossRef]
- Faine, P.; Kurtz, S.R.; Riordan, C.; Olson, J.M. The influence of spectral solar irradiance variations on the performance of selected single-junction and multijunction solar cells. Sol. Cells 1991, 31, 259–278. [Google Scholar] [CrossRef]
- Eke, R.; Betts, T.R.; Gottschalg, R. Spectral irradiance effects on the outdoor performance of photovoltaic modules. Renew. Sustain. Energy Rev. 2017, 69, 429–434. [Google Scholar] [CrossRef]
- Pérez-López, J.J.; Fabero, F.; Chenlo, F. Experimental solar spectral irradiance until 2500 nm: Results and influence on the PV conversion of different materials. Prog. Photovolt. Res. Appl. 2007, 15, 303–315. [Google Scholar] [CrossRef]
- Gulkowski, S.; Zdyb, A.; Dragan, P. Experimental efficiency analysis of a photovoltaic system with different module technologies under temperate climate conditions. Appl. Sci. 2019, 9. [Google Scholar] [CrossRef]
- Liu, H.; Ren, Z.; Liu, Z.; Aberle, A.G.; Buonassisi, T.; Peters, I.M. Predicting the outdoor performance of flat-plate III–V/Si tandem solar cells. Sol. Energy 2017, 149, 77–84. [Google Scholar] [CrossRef]
- Al Garni, H.Z.; Awasthi, A.; Wright, D. Optimal orientation angles for maximizing energy yield for solar PV in Saudi Arabia. Renew. Energy 2019, 133, 538–550. [Google Scholar] [CrossRef]
- Abdallah, R.; Juaidi, A.; Abdel-Fattah, S.; Manzano-Agugliaro, F. Estimating the optimum tilt angles for south-facing surfaces in Palestine. Energies 2020, 13. [Google Scholar] [CrossRef]
- Mubarak, R.; Luiz, E.W.; Seckmeyer, G. Why PV modules should preferably no longer be oriented to the south in the near future. Energies 2019, 12. [Google Scholar] [CrossRef]
- Ustun, T.S.; Nakamura, Y.; Hashimoto, J.; Otani, K. Performance analysis of PV panels based on different technologies after two years of outdoor exposure in Fukushima, Japan. Renew. Energy 2019, 136, 159–178. [Google Scholar] [CrossRef]
- Bora, B.; Kumar, R.; Sastry, O.S.; Prasad, B.; Mondal, S.; Tripathi, A.K. Energy rating estimation of PV module technologies for different climatic conditions. Sol. Energy 2018, 174, 901–911. [Google Scholar] [CrossRef]
- Schulte-Huxel, H.; Silverman, T.J.; Deceglie, M.G.; Friedman, D.J.; Tamboli, A.C. Energy Yield Analysis of Multiterminal Si-Based Tandem Solar Cells. IEEE J. Photovolt. 2018, 8, 1376–1383. [Google Scholar] [CrossRef]
- Müller, B.; Hardt, L.; Armbruster, A.; Kiefer, K.; Reise, C. Yield predictions for photovoltaic power plants: Empirical validation, recent advances and remaining uncertainties. Prog. Photovolt. Res. Appl. 2016, 24, 570–583. [Google Scholar] [CrossRef]
- Virtuani, A.; Strepparava, D. Modelling the performance of amorphous and crystalline silicon in different typologies of building-integrated photovoltaic (BIPV) conditions. Sol. Energy 2017, 146, 113–118. [Google Scholar] [CrossRef]
- Muñoz, J.; Perpiñán, O. A simple model for the prediction of yearly energy yields for grid-connected PV systems starting from monthly meteorological data. Renew. Energy 2016, 97, 680–688. [Google Scholar] [CrossRef]
- Royal Meteorological Institute of Belgium. Available online: https://www.meteo.be/resources/climatology/climateCity/pdf/climate_INS44021_nl.pdf (accessed on 19 April 2020).
- Amillo, A.G.; Huld, T.; Müller, R. A new database of global and direct solar radiation using the eastern meteosat satellite, models and validation. Remote Sens. 2014, 6, 8165–8189. [Google Scholar] [CrossRef]
- Huld, T.; Müller, R.; Gambardella, A. A new solar radiation database for estimating PV performance in Europe and Africa. Sol. Energy 2012, 86, 1803–1815. [Google Scholar] [CrossRef]
- PVGIS. Available online: http://re.jrc.ec.europa.eu/pvgis/ (accessed on 19 April 2020).
- Polo, J.; Gastón, M.; Vindel, J.M.; Pagola, I. Spatial variability and clustering of global solar irradiation in Vietnam from sunshine duration measurements. Renew. Sustain. Energy Rev. 2015, 42, 1326–1334. [Google Scholar] [CrossRef]
- Kalogirou, S.A. Solar Energy Engineering: Processes and Systems; Elsevier Inc.: Amsterdam, The Netherlands, 2009; ISBN 9780123745019. [Google Scholar]
- Strubble, F.; Beekman, J. Solar Cells; Ghent University: Ghent, Belgium, 2016; pp. 22–27. [Google Scholar]
- Demoulias, C. A new simple analytical method for calculating the optimum inverter size in grid-connected PV plants. Electr. Power Syst. Res. 2010, 80, 1197–1204. [Google Scholar] [CrossRef]
- Faranda, R.S.; Hafezi, H.; Leva, S.; Mussetta, M.; Ogliari, E. The optimum PV plant for a given solar DC/AC converter. Energies 2015, 8, 4853–4870. [Google Scholar] [CrossRef]
- Nann, S.; Riordan, C. Solar spectral irradiance under clear and cloudy skies: Measurements and a semiempirical model. J. Appl. Meteorol. 1991, 30, 447–462. [Google Scholar] [CrossRef]
- Krishnan, P.; Schüttauf, J.W.A.; van der Werf, C.H.M.; Houshyani Hassanzadeh, B.; van Sark, W.G.J.H.M.; Schropp, R.E.I. Response to simulated typical daily outdoor irradiation conditions of thin-film silicon-based triple-band-gap, triple-junction solar cells. Sol. Energy Mater. Sol. Cells 2009, 93, 691–697. [Google Scholar] [CrossRef]
- Reference Solar Spectral Irradiance: Air Mass 1.5. Available online: https://rredc.nrel.gov/solar//spectra/am1.5/ (accessed on 20 February 2020).
- International Electro-Technical Commission. Standard IEC 60904-3: Photovoltaic Devices. Part 3: Measurement Principles for Terrestrial Photovoltaic (PV) Solar Devices with Reference Spectral Irradiance; International Electro-Technical Commission: Geneva, Switzerland, 2008. [Google Scholar]
- Abdul Jalil, M.A.; Abdul Karim, S.A.; Baharuddin, Z.; Abdullah, M.F.; Othman, M. Forecasting Solar Radiation Data Using Gaussian and Polynomial Fitting Methods; Springer: Singapore, 2018; pp. 11–24. ISBN 978-981-13-0434-7. [Google Scholar]
- Frankdeboosere. Available online: https://www.frankdeboosere.be/zonnepanelen/zonnepanelen.php (accessed on 30 March 2020).
- T_36_Brugge_Belgium. Available online: https://pvoutput.org/ (accessed on 20 April 2020).
- Polo, J.; Bernardos, A.; Navarro, A.A.; Fernandez-Peruchena, C.M.; Ramírez, L.; Guisado, M.V.; Martínez, S. Solar resources and power potential mapping in Vietnam using satellite-derived and GIS-based information. Energy Convers. Manag. 2015, 98, 348–358. [Google Scholar] [CrossRef]
- Nguyen, B.T.; Pryor, T.L. The relationship between global solar radiation and sunshine duration in Vietnam. Renew. Energy 1997, 11, 47–60. [Google Scholar] [CrossRef]
- PVWatts Calculator. Available online: https://pvwatts.nrel.gov/index.php (accessed on 20 April 2020).
- Almansouri, I.; Ho-Baillie, A.; Bremner, S.P.; Green, M.A. Supercharging Silicon Solar Cell Performance by Means of Multijunction Concept. IEEE J. Photovolt. 2015, 5, 968–976. [Google Scholar] [CrossRef]
© 2020 by the authors. Licensee MDPI, Basel, Switzerland. This article is an open access article distributed under the terms and conditions of the Creative Commons Attribution (CC BY) license (http://creativecommons.org/licenses/by/4.0/).

