Abstract
A one-dimensional model of the diesel engine working process was established, and thermal boundary conditions of gases contacting with a cylinder head were determined by comparing them with the results of a routine test. A fluid-structure interaction model between the cooling water and cylinder head passages was established in which boundary conditions of cooling water were obtained by computational fluid dynamics analysis. Simultaneously, considering the pressure mechanical load in the cylinder, temperature and the stress distribution of the cylinder head were analysed by the model with a thermo-mechanical coupling load. The model was validated using the temperature hardness plug method. Four parameters of intake valve opening, exhaust valve opening, fuel supply beginning, and compression ratio were selected as influencing factors, and the thermo-mechanical coupling load of the cylinder head was optimised by the Taguchi and analysis of variance method subsequently. The study indicates that the error of the calculation model for the cylinder head’s thermal-mechanical coupling load is within ±1.5%, and the proportion of the thermal stress in the cylinder head thermal-mechanical coupling stress is above 90%. The fuel supply beginning has the greatest influence on the thermal load of the cylinder head. Based on the optimisation methods within the required power range, the maximum temperature and maximum thermo-structural coupling stress of the cylinder head are decreased by about 10.05 K and 7.13 MPa in the nose bridge area, respectively.
1. Introduction
The complicated structures of the marine diesel engine’s cylinder head with many accessory parts cause the cooling system to be limited in size, and uneven temperature of various areas of the cylinder head is brought about [1,2] during the operation of the diesel engine. Simultaneously, the cylinder head flame surface has been directly contacted with the gas and suffers from a harsh environment with high temperature and pressure. Thus, it is prone to ablation and cracking [3]. Therefore, the cylinder head is one of the parts in the diesel engine, which endures severe working conditions.
The four-valve design of the cylinder head of the marine diesel engine brings convenience for gas exchange and high-efficiency combustion. Nevertheless, it also causes problems such as high temperature and stress concentration of local areas. The heat transfer optimisation design [4] was carried out in harsh areas with an internal cooling system to reduce the impact of the above problems on the fatigue life of the cylinder head. On one hand, the thermal optimisation of cooling and heating passages was improved using engineering fluids such as nanofluid, and the heat transfer coefficient could be enhanced for a micro-structured surface [5,6]. Thermal performance augmentation was validated using water-based nanofluid in heat exchanger [7] and oil cooler [8] of diesel engines. Heat exchange was explored using nanofluid jet impingement cooling and a cooling jacket of cylinder head of diesel engine was strengthened as well [9]. On the other hand, the cooling passages between valves were optimised to improve the maximum temperature and thermal stress on the flame surface by Wu Q W [10]. The water flow and rate of cooling system were analysed and had great influence on the thermal load of a high-temperature area. Cooling performance of the cylinder head considering the fluid-structure interaction was conducive to the accuracy of its thermal load and structural strength analysis by Fontanesi S [11]. The stress concentration phenomenon of the cylinder head was clear with the impact transmitted by the cold and heat sources and the pressure in the cylinder [12]. The reciprocating effects of the thermal and mechanical load made the problem of low-cycle and high-cycle fatigue more prominent in the bottom area of the cylinder head. It was prone to failure for the nose bridge areas [13,14]. Thermo-mechanical coupling load analysis of the cylinder head is beneficial to assess its working status accurately.
New technologies of high-power density, high-efficiency combustion, and low emission make the marine diesel engine more advantageous and competitive. At the same time, they put forward new challenges to the thermal and mechanical load of the cylinder head [15,16]. Xu Z. [17] studied the parameters of the injection system and the size of the intake port through computational fluid dynamics (CFD) simulation, optimised the fuel injection and the intake system, and improved the power (P) and the brake specific fuel consumption (BSFC) of the diesel engine. Krishnamoorhi M. [18] raised the engine’s thermal efficiency and reduced the emissions of NOx and CO by the design of the experiment (DoE) method based on the parameters, such as the compression ratio, the injection pressure, and injection timing. Belgiorno G [19] let NOx and PM emissions down by changing the compression ratio, the injection pressure, the air-fuel ratio, and other parameters. Nevertheless, it is also necessary to study the thermal and mechanical load of the cylinder head for applying the optimisation. Liu ZT [20] analysed the temperature and the thermal stress fields of the cylinder head, studied the influence of the explosion pressure and cooling water jacket on the evaluation index of the maximum temperature and the thermal stress, and put forward the optimisation scheme of the thermal load and structural strength of the cylinder head. Chen XQ [21] studied the contribution of the parameters such as the injection timing, the intake timing, and the turbocharger compression ratio to the P density of a diesel engine. The influence of P density on the thermal load and structural strength of the diesel engine’s cylinder head was pointed out. The results revealed that the parameters had different effects on the maximum temperature and the thermal stress of the cylinder head. In the top-down design of a diesel engine, the optimisation of important parameters such as the fuel system, valve system, cooling system, and the cylindrical head structure could improve the thermo-mechanical coupling load of the diesel engine’s cylinder head [12,16]. The research mentioned above was of great significance for the reliability evaluation and upgrading.
The cylinder head of a marine high-power diesel engine was taken as the object in the paper. By calculating the diesel engine working process and the cylindrical head cooling system with the fluid-structure interaction, the thermal boundary conditions (TBCs) of the cylinder head were analysed and determined. The finite element (FE) model with thermo-mechanical coupling load of the cylinder head was established. The temperature and the stress fields of the cylinder head were analysed. The temperature of key points of the cylinder head’s flame surface were measured using the temperature hardness plug (THP) method and the correctness of the model was validated. Four parameters of the intake valve opening (IVO), the exhaust valve opening (EVO), the fuel supply beginning (FSB), and the compression ratio (CR) were taken as the influencing factors, and the thermo-mechanical coupling load of the cylindrical head was optimised by using Taguchi and the analysis of variance (ANOVA) method. Simultaneously, the P was ensured to not be lower than 98% of the design. The combination of various influencing factors had been proposed, which provided a basis for optimising the thermal load and structural strength of the diesel engine cylindrical head.
2. Determination of TBCs
2.1. TBCs of Gas Passages and Flame Surface
TBCs of the cylinder head are very important for the thermal load analysis. They mainly include the TBCs of the gases passage, the flame surface, the outer surface, and the sealing surface with the cylinder liner. Due to the complicated structures of the cylinder head and the harsh working environment, the former two are generally obtained through numerical simulation instead of the experimental measurement.
Heat transfer gases with the cylinder head mainly include intake gas, exhaust gas, and combustion gas in the cylinder, which are, respectively, in contact with the intake passage, the exhaust passage, and the flame surface of the cylindrical head to achieve heat transfer. To obtain their accurate TBCs, it is necessary to perform calculation analysis and test validation in the working process of the diesel engine. The basic parameters of the marine diesel engine with a single-stage turbocharger are shown in Table 1.

Table 1.
Basic parameters of the diesel engine.
The working process of the diesel engine is complicated. It involves multiple physical and chemical processes such as fuel injection and evaporation, air-fuel mixing, combustion, intake, and exhaust flow [22,23]. To simulate this complex working process, a one-dimensional model of unsteady flow with conservation equations of mass, momentum, energy, and composition was established for the intake and exhaust systems of the diesel engine, and numerical method with finite volume was used to solve it. To improve the calculation accuracy of the TBCs of the intake, the exhaust, and the in-cylinder gases, the multi-zone model with a Woschni heat transfer model was used for the combustion processes. The graphical discrete data was input into the compressor module, and the establishment of the turbine module was based on the empirical formula of the flow rate and the efficiency changing with the expansion ratio. Therefore, the gas composition and engine performance parameters in the cylinder, exhaust pipe, and intake pipe were obtained from the model [24]. A professional engine working process simulation software GT-Power could solve the heat transfer laws of the multi-cylinder combustion process by defining appropriate combustion, and heat transfer modules, the transient temperatures, and heat transfer coefficients of the cylinder head’s flame surface, intake, and exhaust passages that were obtained. Through the diesel engine structural parameters and test data, the sub-models of the intake system, the valve system, the combustion chamber, the exhaust system, the crankcase, the injector, and the turbocharger were established, and the whole simulation model of the diesel engine’s working process is shown in Figure 1 by GT-Power software.
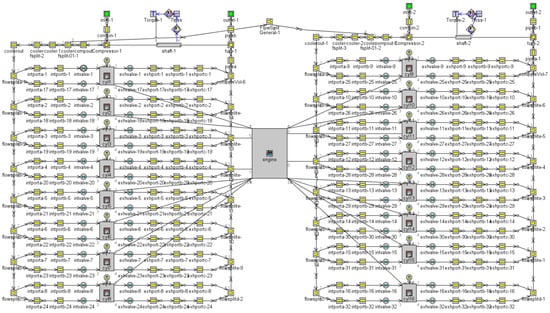
Figure 1.
Model of the diesel engine working process.
The routine test bench and measurement system of the diesel engine are composed as shown in Figure 2. The cylinder pressure (CP), top dead centre (TDC), and crank angle (CA) are measured through Kistler7013C sensor and 5018B charge amplifier and SZMB-18 magnetoelectric sensor with combustion acquisition and analysis system. The pressures before and after the intercooler are mainly obtained by the PT301 sensors, and the pressures of turbine inlet and outlet are mainly obtained by the PT421 sensors. The temperature after intercooling is measured by the PT100 sensor, and the temperatures before and after the turbine are measured by K-type thermocouples sensors. The fuel consumption rate of diesel engine is obtained through a fuel consumption meter and hydraulic dynamometer. All of the physical parameters above are collected, converted, and analyzed by the test and control system of the bench.
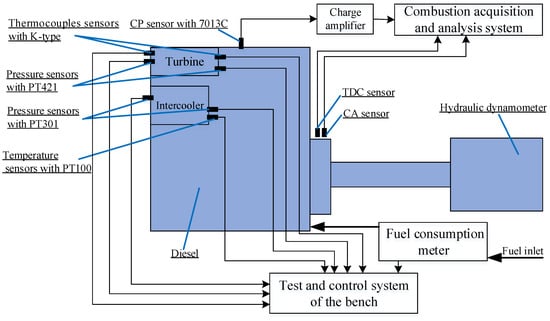
Figure 2.
The routine test bench and measurement system of the diesel engine.
Since the heat source of the diesel engine is mainly produced in the combustion stage, the deviations from cylinder pressure curves of the calculation and routine test of 50 °C before and after TDC are extracted. The comparison of the whole curves of the calculation and the test at the rated speed and 100% load of the diesel engine is shown in Figure 3. The characteristic parameters of the cylinder pressure including the peak fire pressure and its angle, the pressure at TDC, and indicated mean effective pressure are shown in Table 2. By extracting the performance and thermal parameters of the diesel engine, the comparison results of the calculation and routine tests are shown in Table 3.
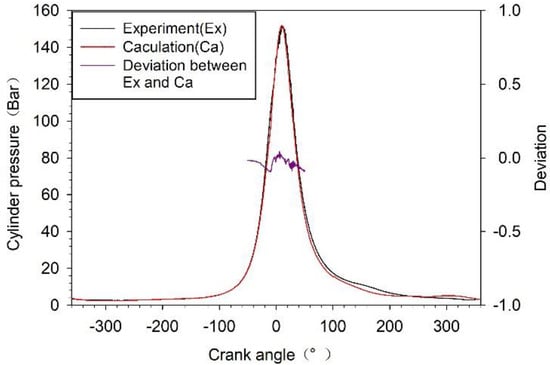
Figure 3.
Comparison of the cylinder pressure curves of the calculation and routine tests.
Table 2.
Comparison of the characteristic parameters of the cylinder pressure’s calculation and routine test.
Table 3.
Comparison of calculation and routine test on the performance and thermal parameters.
From the comparison results of Figure 3 and Table 2, it can be seen that the deviation of the cylinder’s pressure at each point is less than 9.5% during the combustion stage and the average value of them is 3.68%. The errors of the characteristic values are within ±5.5%. It indicates the calculated cylinder pressure curve in a positive agreement with the experimental result. The errors between the calculated value on the performance and thermal parameters of the diesel engine with the test results are within ±3.5% in Table 3, which validates the accuracy of the model.
The intake passage gas transient temperature (Ti), exhaust passage gas transient temperature (Te), and in-cylinder gas transient temperature (Tg) curves are shown in Figure 4. The intake passage gas transient heat transfer coefficient (Hi), the exhaust passage gas transient heat transfer coefficient (He), and the in-cylinder gas transient heat transfer coefficient (Hg) curves are shown in Figure 5.
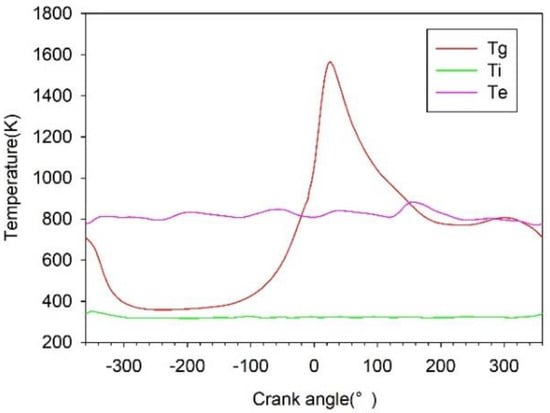
Figure 4.
Curves of the transient temperature.
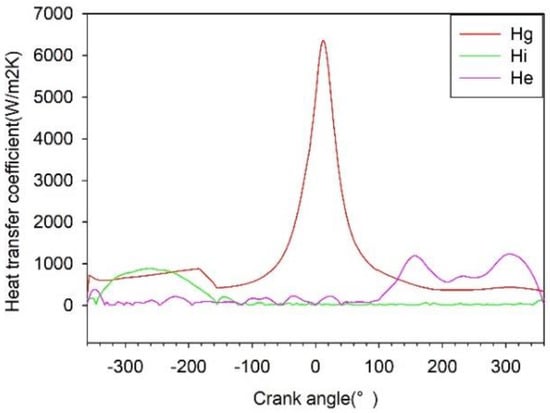
Figure 5.
Curves of the transient heat transfer coefficient.
The steady-state load of the cylinder head is studied in this paper, and the average temperature and the heat transfer coefficient are processed based on the above curves. The average heat transfer coefficient (Hav) and the average temperature (Tav) of in-cylinder gas in a working cycle of the diesel engine can be obtained by using Formula (1) and Formula (2) [25]. In addition, the average heat transfer coefficient and the average temperature of the intake and exhaust gases are obtained according to the same method. Therefore, the average heat transfer coefficient and the average temperature of intake gas, exhaust gas, and combustion gas are calculated.
2.2. TBCs of Cooling Water Jacket
The cooling water jacket in the cylindrical head has a greater influence on the TBCs. The calculation of the temperature and heat transfer coefficient between the water jacket and the wall of the cylindrical head directly affected the results of the thermal and mechanical load [26]. Establishing the fluid-structure interaction model of the cooling water jacket and the cylindrical head was conducive to accurately obtaining the TBCs of the cylindrical head [27,28].
Although the flow and heat transfer of the cylinder head considering the fluid-structure interaction system are complicated, it follows three physical laws, which include the law of conservation of mass, the law of conservation of momentum, and the law of conservation of energy. The equations of the laws are, respectively, shown in Equations (3)–(5). Realising the heat transfer between the fluid and structure of the interface wall is the key to the fluid-structure interaction heat transfer calculation. From the conservation of energy, the heat transferred from the fluid should be equal to the heat absorbed by the structure at the boundary. The fluid-structure interaction heat transfer equation is obtained by the Fourier heat conduction equation and fluid convection heat transfer, shown in Equation (6) [29].
where is the velocity vector, is the fluid pressure, is the fluid dynamic viscosity, is the fluid specific heat capacity, is the fluid density, is the heat transfer coefficient of the fluid, is the mass force acting on the fluid in the gravity field, = g, is the fluid absorbed heat, is the fluid temperature, is the energy dissipation function, is the thermal conductivity of the structure, is the local transfer heat, is the local heat transfer coefficient, and is the wall temperature.
The unidirectional fluid-structure interaction method was adopted in this paper. The cooling water jacket was regarded as the fluid region, the cylinder head was regarded as the structural region, the simulation model of the fluid region was established, and the results of the fluid region were mapped on the structural region.
The cooling water jacket of the cylinder head is complex and the three-dimensional geometric model cannot be obtained directly from the model of the cylindrical head. It needs to be wrapped from the model of the cylindrical head in HyperMesh software. Other unrelated structures of the cooling water jacket were removed by delete command, and the inlet and outlet passages were closed by using the command of the surface-spline/filler, which was convenient for mesh and boundary completeness of the model. According to the mesh division and element attribute definition for the water jacket, the FE model of the fluid region with 43,696 nodes and 186,600 elements in total are shown in Figure 6. The requirements of CFD calculation on mesh quality mainly include skewness, growth rate, aspect ratio, and alignment with the flow of the gird. Specifically, the grid skewness cannot be higher than 0.95, the growth rate cannot exceed 1.4, the aspect ratio is less than 5:1, and the alignment with the flow grid line is consistent with the flow direction to reduce false diffusion. At the same time, it ensures that the flow monitoring curve does not change drastically with the increase of the iteration numbers after the calculation residuals converge. The mesh quality of the cooling water jacket meets the requirements of the calculation and algorithm convergence.
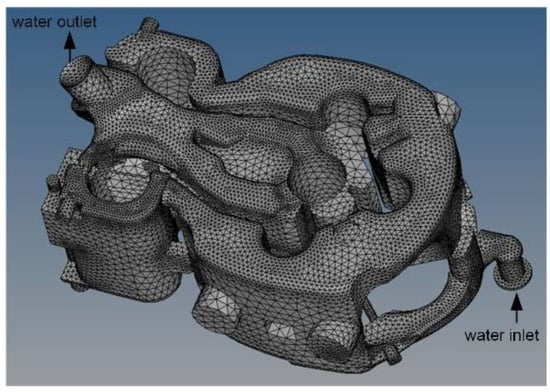
Figure 6.
FE model of the cooling water jacket.
The model was imported into the ANSYS-Fluent module. The flow field of cooling water could be regarded as a steady-state incompressible turbulent state. According to References [3,29,30], the temperature and the heat transfer coefficient in the different areas were dissimilar. The cross-pipe area was close to the flame surface and the fuel injector, and its temperature was relatively high. The cooling water jacket area occupied the vast majority of the heat transfer area, but it was far away from the flame surface, and its temperature was relatively low. Therefore, different boundary conditions were set according to the different location of the areas to improve the calculation accuracy. The cooling water jacket was divided into two areas: the cross-pipe area (CPA) and the main cooling water passage area (MCPA).
The wall temperature of the CPA under the flame surface was calculated by the wall heat exchange formula (7) [16]. The boundary condition of the cooling water jacket’s wall surface was determined by the energy conservation and ensures the experimental value of the outlet temperature of the cooling water.
where is the wall temperature of cooling water (°C), is the saturation temperature of the cooling medium (°C), and is the total heat absorbed by cooling water (W).
The parameters of the cooling water jacket set in general, models, materials, cell zone conditions, and boundary conditions module of ANSYS-Fluent are shown in Table 4. The parameter values are assigned to the inlet and outlet cooling water area and the CPA, mainly including the definition of the cooling water attribute, the inlet and outlet cooling water temperature, flow rate, other parameters, the CFD calculation method, the calculated control factor, and the number of iteration steps.
Table 4.
Basic setting parameters and boundary conditions of cooling water.
The temperature of the cooling water in the cylindrical head was high. It was easy to form turbulence or even boiling state [31] as well as certain speed fluctuation, cavity flow, vortex, and rotation in the cooling water jacket of the cylindrical head existed at the same time. The CFD calculation of the cooling water jacket was suitable for double-precision, a steady-state coupled algorithm, and a realisable k-epsilon turbulence model. The cooling water jacket wall surface was set as a no-slip condition. The flow difference between the inlet and outlet was monitored to ensure that the flow monitoring curve did not change dramatically with the increase of the number of iterations after the residual convergences. The calculation contours of the steady-state temperature and heat transfer coefficient of the cooling water jacket are shown in Figure 7 and Figure 8.
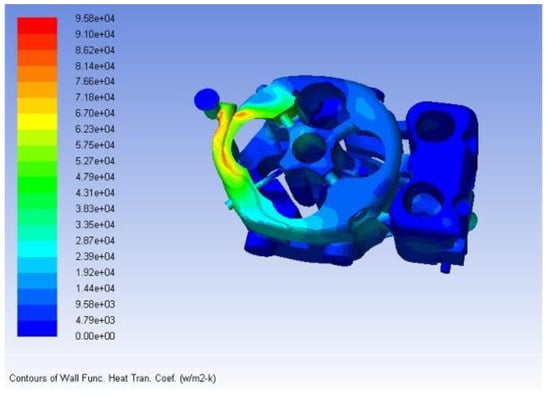
Figure 7.
Contours of the cooling water jacket’s heat transfer coefficient.
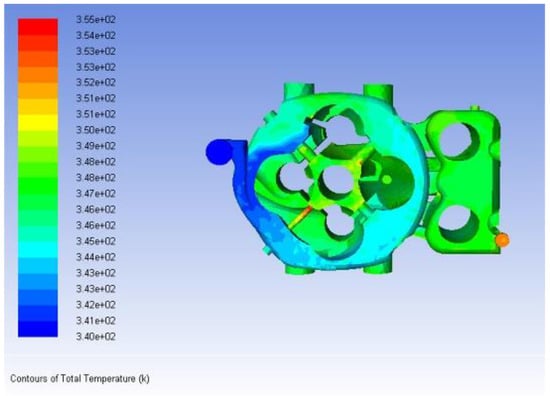
Figure 8.
Contours of the cooling water jacket’s temperature.
2.3. Other TBCs
The surface of the cylindrical head exposed to the atmospheric environment is called free surface, which is characterised by its weak heat exchange with the surrounding environment. Generally, the heat transfer coefficient was selected as 20 W/m2 K [27,32], and the temperature was measured near the cylindrical head during the test.
The sealing surface at the bottom of the cylindrical head is directly contacted with the gasket pressed by the cylinder liner. The heat transfer of the gasket was slower than the in-cylinder combustion process. The area was considered as an adiabatic process [32].
3. Calculation and Verification of Thermo-Mechanical Coupling Load
3.1. Pre-Treatment
3.1.1. Heat Transfer Coefficient of the Flame Surface
Heat transfer coefficient was related to the thermal physical properties of the fluid, the dynamic factors of the fluid flow, the state of the fluid flow, the thermal state of the heat transfer wall, and the geometric factors of the heat transfer wall [33]. The heat transfer coefficient of the cylinder head’s flame surface calculated by the working process could not reflect the thermal state and geometric factors of the actual cylinder head’s flame surface. If the heat transfer coefficient of the flame surface was taken as a unified value, there was a large error between the calculated results and the test results in some areas [34]. The method for improving the calculation accuracy was implemented in which the flame surface was divided into different areas, according to the general law of thermodynamics followed in Formula (8) [35,36]. The minimum error was taken as the target to determine the heat transfer coefficients of each area. Through the cooling, structure, geometry, and thermal state, the flame surface was divided into seven areas: the exhaust valve area (Area 1), the flame surface area between exhaust valves (Area 2), the flame surface area between the exhaust valve and intake valve (Area 3), the flame surface area between the intake valve and exhaust valve (Area 4), the flame surface area between the intake valves (Area 5), the intake valve area (Area 6), and the flame surface area around the injector (Area 7). They are shown in Figure 9. TBCs of the cylindrical head by the above methods are shown in Table 5.
where is the number of areas, is the area of each area, is the average heat transfer coefficient of the in-cylinder gas for each area, and is the total area of the flame surface.
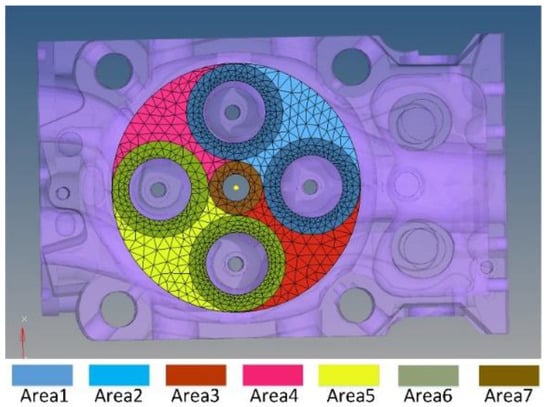
Figure 9.
Areas of the cylindrical head’s flame surface.
Table 5.
TBCs of different areas of the cylindrical head.
3.1.2. Fluid-Structure Interaction
The cylindrical head solid region was meshed by Hypermesh. By checking the quality grid of the cylindrical head, the parameters, such as aspect ratio, jacobian, warpage, and tetra collapse, are within required ranges, and the failure rate of the gird is 0.1%. Therefore, the grid quality of the cylindrical head’s solid region meets calculation requirements. The model of the fluid region was imported into the cylindrical head solid region by the ANSYS Workbench software, and the TBCs of the fluid region’s calculation results were transferred to the steady-state thermal module through the data connection method. Then the fluid-structure interaction model was established.
3.1.3. Boundary Conditions of the Mechanical Load
The boundary conditions of the mechanical load of the cylindrical head mainly include the forces and the constraint. The forces affecting the cylindrical head are mainly composed of the gas combustion pressure and the valve seating forces [37]. The valves opening and closing process had transient impacts on the cylinder head. The valves seat withstood the changeable pressure, which was small during the valves opening and closing process. Therefore, the peak fire pressure in the combustion process was used for the mechanical strength evaluation of the cylindrical head and was applied vertically to the flame surface. In terms of constraints, there were full constraints on the contact surface of the cylindrical head and the cylindrical liner. These constraints were caused by the cylindrical head bolts. Consequently, the six degrees of freedom of the cylindrical head bolt holes were fully constrained.
3.2. Calculation of the Coupling Load
By defining the material properties of the cylindrical head and selecting the type of calculation, the temperature and thermal stress field of the cylindrical head calculated by workbench are shown in Figure 10 and Figure 11. The thermal load results above were imported into the static structural module, and then the boundary conditions, such as the pressure of the flame surface and the constraints of the bolt holes, were exerted, and then thermo-mechanical coupling stress field is calculated, as shown in Figure 12.
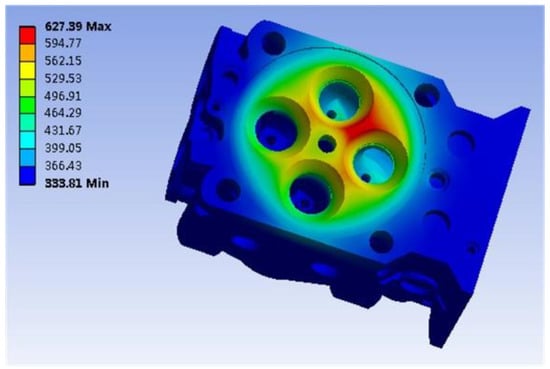
Figure 10.
Contour map of the cylindrical head’s temperature field.
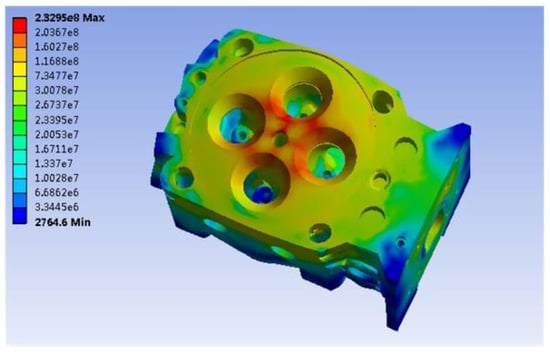
Figure 11.
Contour map of the cylindrical head’s thermal stress.
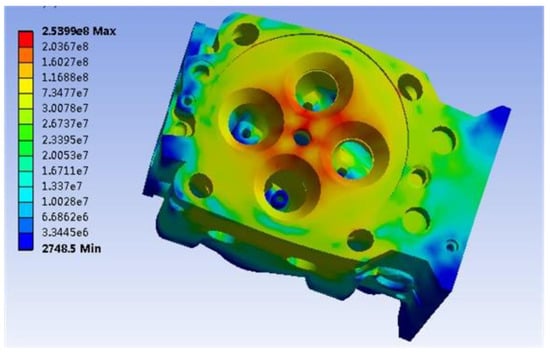
Figure 12.
Contour map of the cylindrical head’s thermo-mechanical coupling stress.
It can be seen from Figure 10 that the temperature at the fuel injection port and the nose bridge of each valve is higher, the maximum temperature (Tm) is 627.39 K, and the radial temperature gradient of the nose bridge is larger. This is due to the narrower structure and the cross-cooling water pipe, which are key areas for thermal load evaluation. Figure 11 and Figure 12 demonstrate that the pattern of the thermal stress distribution is consistent with that of the temperature field distribution. A pattern of coupling stress field considering the mechanical load is consistent with thermal stress. The maximum thermal stress is 232.95 MPa, the maximum thermo-structural coupling stress (Sm) is 253.99 MPa, and the values of Sm in the areas of the exhaust nose bridge and fuel injection port are higher than the other areas. Consequently, the mechanical load has a low influence on the coupling stress of the cylinder head, accounting for only about 8.28%. It reveals that thermal stress in evaluating the cylindrical head’s structural strength is much higher than the mechanical stress.
3.3. Verification and Error Analysis
The current cylindrical head temperature measurement methods include the THP method and the thermocouple method [4,38,39]. The THP method was used by the characteristic relationship between the hardness of the metal material with temperature. Due to its convenient installation, the flexible detection, and the low amount of damage to the structure, the THP method was applied to measure the temperature of the cylindrical head’s flame surface. The physical arrangement of the 13 measurement points is shown in Figure 13. It is helpful to obtain small measurement errors by maintaining a period of the highest temperature and rapid cooling for the cylindrical head [40]. The positional relationship and the errors for measuring points are shown in Figure 14 and Table 6.
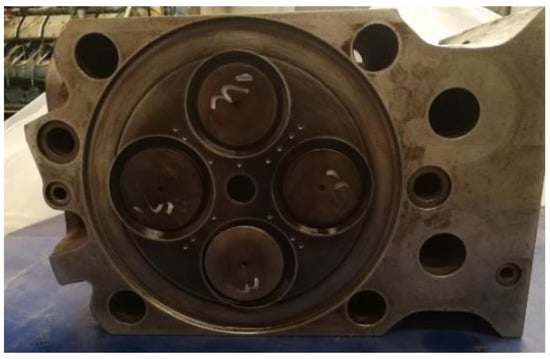
Figure 13.
Physical layout of the measuring points.
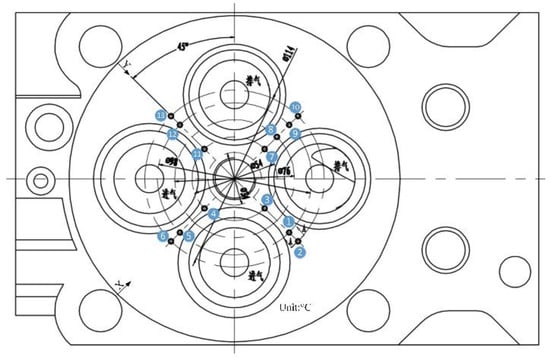
Figure 14.
Positional relationship of the measuring points.
Table 6.
Comparison of the error between calculation and measured values of temperature.
It can be seen from Table 5 that the maximum deviation between the calculated temperature value and the measured temperature value is 5.75 K, and the maximum error is within ±1.5%. It indicates that the FE model of the cylindrical head’s thermal load and the thermal boundary conditions are reasonable. Due to the limited test conditions, the stress of the cylindrical head is not measured. Nevertheless, the thermo-mechanical model coupled can provide some guidance for predicting and evaluating structural strength.
4. Optimisation Analysis and Discussions
4.1. Configuration of the Influencing Factors
Parameters based on the valve, the fuel system, and compression ratio have great influence on the performance and the thermal efficiency of the diesel engine [41]. Simultaneously, they are the focus of attention in terms of diesel engine design and testing, the structural strength, and working reliability of the thermal load of the cylindrical head are affected at different parameter values. The IVO, EVO, FSB, and CR were taken as influencing factors. The five values of level (level 3 is the design value) were set for matching. The configuration of the influence factors is shown in Table 7.
Table 7.
Configuration of the influencing factors.
4.2. Taguchi’s Experimental Design
The Taguchi method is an optimisation design method established by Taguchi G based on the orthogonal experiments and the signal-to-noise ratio (SNR) technology [42]. It is a local optimisation algorithm that optimises the multiple indexes by the design of an orthogonal table of influencing factors, and the optimal matching influencing factors can be obtained with the least number of experiments. The Taguchi method is a DoE of multi-parameters and multi-optimisation objectives, and the method is developed from the DoE principles and has been widely used in various mechanical designs and other related fields [43]. The four parameters of the diesel engine (IVO, EVO, FSB, and CR) were selected as the influencing factors. Tm and Sm of the cylindrical head and P of the diesel engine were used as optimisation objectives. Simultaneously, the value of P was not less than 98% of the rated power after the optimisation. Optimal matching influencing factors were determined by reducing the Tm and Sm and increasing P by the Taguchi method in the paper.
Thermo-mechanical coupling load of the cylinder head was optimised with the four influencing factors and five levels to form an L25 (54) orthogonal table. The DoE for each influencing factor combination in the orthogonal table were 25 groups.
The TBCs on the flame surface of the cylindrical head were applied with the same method as calculating the temperature field of the cylindrical head under rated condition. The average gas temperature applied to each area is the same. To ensure the consistent distribution pattern of the average heat transfer coefficient on the flame surface with the rated condition, Formula (9) was used to calculate the average heat transfer coefficient of each area at each optimised experiment [29].
where is the average heat transfer coefficient of the ith area at each optimised experiment, . The average heat transfer coefficient of the in-cylinder gas was in the working cycle of the diesel engine at each optimised experiment.
Through the fluid-structure and thermal-mechanical models, each combination of the influencing factors was set and performed with other parameters unchanged, and different optimisation objectives of Tm, Sm, and P are obtained. The orthogonal table and optimisation objectives are established, as shown in Table 8.
Table 8.
Taguchi’s orthogonal table and optimisation objectives.
4.3. Optimisation and Discussions
SNR is the optimisation objective’s index of the Taguchi method and is used to express the robust performance of the optimisation objective under other external influences. The larger the value, the greater the ability of the optimisation objective to resist external influences, and the better the optimisation objective is [42,44]. According to the different requirements of optimisation objectives based on the Taguchi method, Tm and Sm were the smaller-the-better, whereas P was the larger-the-better. The SNR was calculated by the formulas shown in Equations (10) and (11), respectively [37].
where is the optimisation objective and is the total number of experiments.
By calculating the SNR of the optimisation objectives in Table 7, the effect diagrams of the SNR for Tm, Sm, and P at different levels of influencing factors are determined and shown in Figure 15, Figure 16 and Figure 17.
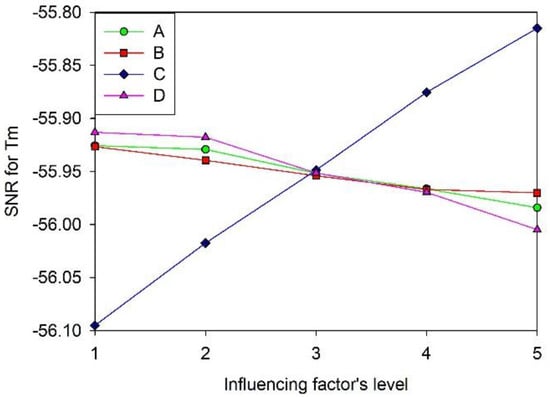
Figure 15.
Effect diagram of SNR at different levels for Tm.
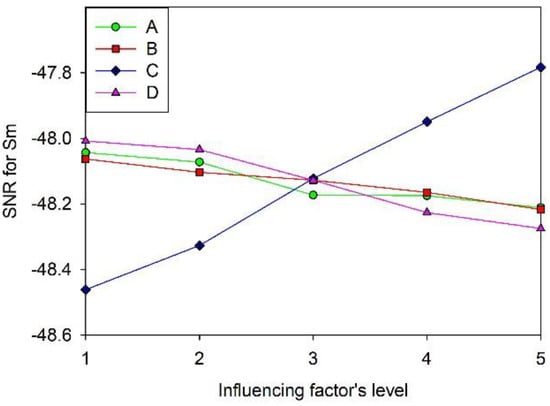
Figure 16.
Effect diagram of SNR at different levels for Sm.
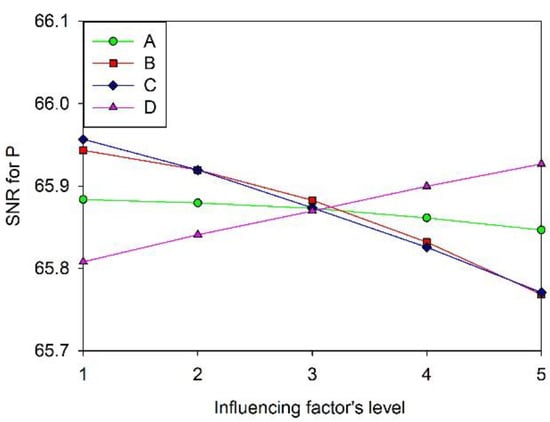
Figure 17.
Effect diagram of SNR at different levels for P.
To get the optimal matching influencing factors, it is necessary to determine the relative importance of each influencing factor on the different optimisation objectives by analysing the proportion. The ANOVA method was used to calculate the degree of the deviation from the average value of the optimisation objective at the different factor levels. The proportion of each influence factor on the optimisation objectives was obtained. The calculation method of variance is shown in Equation (12) [45,46]. The variances of each influence factor and its proportion are shown in Table 9.
where is the variances and is the number of influencing factor levels.
Table 9.
Variances of each influence factor and its proportion.
Table 9 indicates the proportions of each influence factor for the optimisation objectives. Since the principle of selecting the optimised combination is that the larger the value of the SNR, the better the optimisation objectives. Considering the rank of proportions, it can be seen from Figure 15, Figure 16 and Figure 17 that the influence factor C has the largest proportion to Tm and Sm. Therefore, when level C is taken as 5, the SNR for Tm and Sm is the largest. The proportions of the influence factor B and D to P is larger than those to Tm and Sm, and larger P is ensured when taking level 1 of B and level 5 of D. The influence factor A has the same effect trend on Tm, Sm, and P. Therefore, the maximum SNR at level 1 is selected. Therefore, the optimised combination of the influence factor levels is A1B1C5D5. As such, IVO is 304.5 °CA, EVO is 107.5 °CA, FSB is 15 °CA, and CR is 13.9.
4.4. Comparison Results
To compare and verify the results of the optimisation scheme, an optimised combination of the influence factor levels was substituted into the models for the solution. The value of P was 1976.16 kW, which met the requirement and was slightly increased by 0.3%. Simultaneously, the temperature and stress values of the cylindrical head’s nose bridge area were extracted at a certain distance in the radial direction of X (through the line of the measuring points 6 and 10 numbers shown in Figure 14) and Y (through the line of the measuring points 13 and 2 numbers shown in Figure 14). The comparisons of the design and optimum in the X and Y directions are shown in Figure 18 and Figure 19.
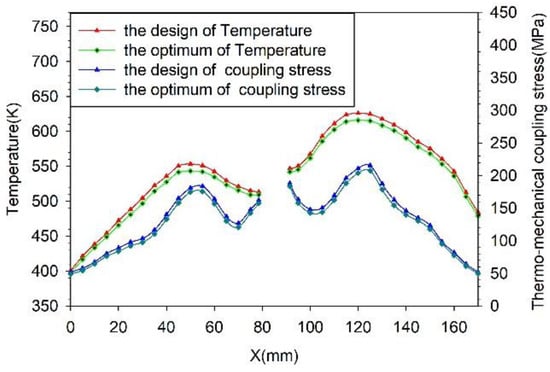
Figure 18.
Comparison of thermo-structure coupling load in the radial direction X of the cylindrical head.
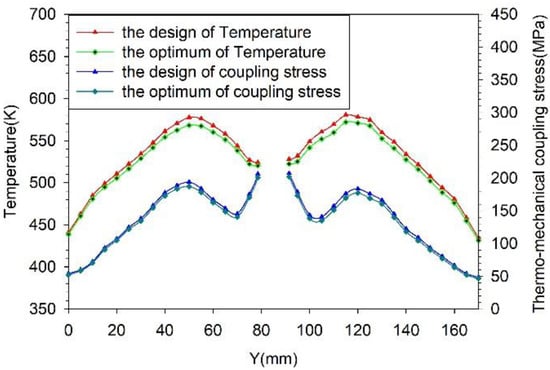
Figure 19.
Comparison of thermo-structure coupling load in the radial direction Y of the cylindrical head.
As can be seen from Figure 18 and Figure 19, the distribution curves of the temperature and thermo-structure coupling stress of the cylindrical head’s nose bridge area are decreased in both X and Y directions after optimisation. Among them, the maximum temperature in the X direction is decreased at about 10.05 K, and the maximum thermo-structure coupling stress is decreased at about 7.13 MPa. Simultaneously, the maximum temperature drops at about 8.57 K, and the maximum thermo-structure coupling stress drops at about 6.82 MPa in the Y-direction.
5. Conclusions
By establishing the diesel engine working process’s model, the CFD model with the cooling water jacket and the FE model of thermo-mechanical coupling load of the cylinder head, the temperature, thermal stress field, and the thermo-mechanical coupling stress field of the cylindrical head were obtained. The THP method was applied to validate the cylindrical head’s thermal load model, and the four influencing factors were matched to optimise the thermo-mechanical coupling load of the cylinder head by Taguchi and the ANOVA method. The main conclusions are as follows.
- (1)
- The calculated marine high-power diesel engine performance, the thermal parameters, and the cylindrical pressure curve have small errors within ±5.5% compared with the test values. The simulation model of the marine high-power diesel engine working process is reliable. The error between the cylindrical head measured temperature and the calculated results of the thermal load model is within ±1.5%. The thermo-structural coupling load model of the cylindrical head considering a fluid-structure interaction can meet the requirements of evaluation and prediction.
- (2)
- The values of Tm and Sm of the cylinder head are 627.39 K and 253.99 MP, respectively. The nose bridge of the cylindrical head is the key area of the thermo-mechanical coupling load evaluation. The value of thermal stress is above 90% of thermo-structure coupling stress.
- (3)
- Within the set ranges of the four influencing factors, the FSB is above 77% proportion of the influence on the thermo-mechanical coupling load of the cylindrical head. The EVO is less than 4% proportional to the effect on it.
- (4)
- Through an optimal combination of influencing factor levels for the diesel engine using the Taguchi and ANOVA methods, the maximum temperature and maximum thermo-structural coupling stress in the two vertical directions of the cylindrical head’s nose bridge area decrease by about 10.05 K and 7.13 MPa, respectively, and the value of power is slightly increased.
Author Contributions
L.H., J.Y., Y.Y., and F.D. worked together to conceive the methods of analysis and optimization. L.H. completed the establishment of the cylindrical head FE model and thermo-mechanical coupling load calculation, and designed the optimization method. J.Y. and Y.Y. discussed the TBCs and the correctness of the calculation results. L.H. and F.D. worked together to completed the working process simulation diesel engine and related tests. All authors have read and agreed to the published version of the manuscript.
Funding
The project ‘Research on Diesel Engine Thermal Load Control Technology’ (Grant No. 20183f0043) and ‘Development of 400 mm Bore Low-speed Dual-fuel Engine Prototype (Ministry of Industry and Information Technology of P. R. China Grant No. MC-201501-D01-03)’ funded this work.
Acknowledgments
This research was also financially supported and conducted in the Key Laboratory of Marine Power Engineering & Technology under Minister of Communication P.R. China. The authors are grateful to Henan Diesel Engine Industry Co., Ltd. for the related parameters. We also appreciate the Shanghai Research Institute of Marine Diesel Engine for the experimental support and coupled method of the model. The authors truly express the depth of gratitude to the School of Energy and Power Engineering at Wuhan University of Technology for the calculation support on the project. The authors appreciate the anonymous reviewers and the editor for carefully reading and providing many constructive comments and suggestions for enhancing the manuscript.
Conflicts of Interest
The authors declare no conflict of interest.
References
- Wei, J.C.; Wang, Y.L.; Zhang, L.; Xu, C.G.; Yin, Y.J.; Li, P.; Lu, Y.Q. Optimization design of the exhaust bridge zone of cylinder head. Mach. Des. Res. 2019, 35, 185–188. [Google Scholar]
- Mu, Z.Q.; Chen, S.; Lv, Z.K.; Wei, X.G. Design of cylinder head of dual fuel engine. Intern. Combust. Engine Power Plant 2017, 34, 22–24, 44. [Google Scholar]
- Ji, Y.P.; Sun, P.; Zhao, S.B. Analysis of temperature field of high Speed diesel engine parts and their structural optimization. Appl. Mech. Mater. 2014, 490–491, 1003–1007. [Google Scholar] [CrossRef]
- Jahangirian, S.; Srivastava, A.; Hosseini, S.A.; Ballard, S.; Wu, N.Q.; Kiedaisch, J. A Multi-Physics 3D Modeling Methodology for Multi-Cylinder Diesel Engine Thermal Management and Fatigue Life Prediction. Sae Int. J. Mater. Manuf. 2015, 8, 893–904. [Google Scholar] [CrossRef]
- Sarafraz, M.M.; Hormozi, F.; Peyghambarzadeh, S.M. Pool boiling heat transfer to aqueous alumina nano-fluids on the plain and concentric circular micro-structured (CCM) surfaces. Exp. Therm. Fluid Sci. 2016, 72, 125–130. [Google Scholar] [CrossRef]
- Sarafraz, M.M.; Hormozi, F. Experimental study on the thermal performance and efficiency of a copper madethermosyphon heat pipe charged with alumina-glycol based nanofluids. Powder Technol. 2014, 266, 378–387. [Google Scholar] [CrossRef]
- Barzegarian, R.; Aloueyan, A.; Yousefi, T. Thermal performance augmentation using water based Al2O3-gamma nanofluid in a horizontal shell and tube heat exchanger under forced circulation. Int. Commun. Heat Mass Transf. 2017, 86, 52–59. [Google Scholar] [CrossRef]
- Zhong, X.; Yu, X.L.; Zhang, Y.; Liu, X.J. Design of heat transfer experiment for nanofluid in diesel oil cooler. Trans. Csice 2011, 29, 67–71. [Google Scholar]
- Su, Z.G.; Zheng, W. Exploration of using nanofluid jet impingement cooling to strengthen heat exchange in diesel engine cylinder head. Chin. Intern. Combust. Engine Eng. 2013, 34, 61–67. [Google Scholar]
- Wu, Q.W. Research on Thermal Load of the Cylinder Head and Heat Transfer Enhancement inside the Cooling Water-Jacket. Master’s Thesis, Shandong University, Jinan, China, 2016. [Google Scholar]
- Fontanesi, S.; Giacopini, M. Multiphase CFD–CHT optimization of the cooling jacket and FEM analysis of the engine head of a V6 diesel engine. Appl. Therm. Eng. 2013, 52, 293–303. [Google Scholar] [CrossRef]
- Fadaei, M.; Vafadar, H.; Noorpoor, A. New thermo-mechanical analysis of cylinder heads using a multi-field approach. Sci. Iran. 2011, 18, 66–74. [Google Scholar] [CrossRef]
- Huter, P.; Oberfrank, S.; Gruen, F.; Stauder, B. Thermo-mechanical fatigue influence of copper and silicon on hypo-eutectic Al-Si-Cu and Al-Si-Mg cast alloys used in cylinder heads. Int. J. Fatigue 2016, 88, 142–155. [Google Scholar] [CrossRef]
- Bischoff, T.; Rödling, S.; Stauder, B. Innovative testing concept for the determination of the thermo-mechanical fatigue of cylinder heads. Mater. Pruefung Mater. Test. 2012, 54, 655–662. [Google Scholar] [CrossRef]
- Zhou, X.J. Experimental Research and Numerical Simulation of the Thermal Load of the Heated Parts of Diesel Engine. Master’s Thesis, Wuhan University of Technology, Wuhan, China, 2005. [Google Scholar]
- Lu, R.S.; Lin, F.S.; Zhang, R. Heat Transfer and Heat Load of Internal Combustion Engine; China Communications Press: Beijing, China, 1988. [Google Scholar]
- Wang, G.X.; Yu, W.B.; Li, X.B.; Yang, R. Influence of fuel injection and intake port on combustion characteristics of controllable intake swirl diesel engine. Fuel 2018, 262, 116548. [Google Scholar] [CrossRef]
- Krishnamoorthi, M.; Malayalamurthi, R.; Shameer, P.M. RSM based optimization of performance and emission characteristics of DI compression ignition engine fuelled with diesel/aegle marmelos oil/diethyl ether blends at varying compression ratio, injection pressure and injection timing. Fuel 2018, 221, 283–297. [Google Scholar] [CrossRef]
- Belgiorno, G.; Blasio, G.D.; Beatrice, C. Parametric study and optimization of the main engine calibration parameters and compression ratio of a methane-diesel dual fuel engine. Fuel 2018, 222, 821–840. [Google Scholar] [CrossRef]
- Liu, Z.; Chen, S.N.; Huang, R.; Yin, X.; Yu, X.L.; Wei, Z.M.; Zhang, Q.Z. Analysis and optimization of heat load on cylinder head of high power density diesel engine. J. Zhejiang Univ. (Eng. Sci.) 2015, 49, 1544–1552. [Google Scholar]
- Chen, X.Q. Thermal Reliability Design Theory and Application Research for Cylinder Head of Combustion Enhanced Diesel Engine. Ph.D. Thesis, Zhenjiang University, Hangzhou, China, 2019. [Google Scholar]
- He, W. Thermo-Solid Coupling Analysis of Diesel Engine Cylinder Head and Its Thermal Load Performance Impact Characteristic. Master’s Thesis, Hunan University, Changsha, China, 2016. [Google Scholar]
- Zhou, S.; Wang, Y.Y.; Ming, P.J.; Zhu, Y.Q. Internal Combustion Engine Working Process Simulation Technology; Beihang University Press: Beijing, China, 2012. [Google Scholar]
- Liang, C.; Cui, Y.; Deng, K.Y.; Zhao, T.B.; Zhou, X.J.; Li, J.F. Study on the influence of back pressure on Turbocharged Diesel Engines and its Improvement Methods. Diesel 2013, 35, 16–20, 24. [Google Scholar]
- Lu, X.Q.; Li, Q.; Zhang, W.; Guo, Y.B.; He, T.; Zou, D.Q. Thermal analysis on piston of marine diesel engine. Appl. Therm. Eng. 2013, 50, 168–176. [Google Scholar] [CrossRef]
- Chen, X.B.; Wang, X.; Min, Y.; Zhang, H.F. Thermal-Mechanical Fatigue Analysis of Diesel Engine Cylinder Head Based on Fluid-Structure Interaction; SAE Technical Paper: Warrendale, PV, USA, 2015. [Google Scholar]
- Gu, F.; Cui, G.Q.; Wu, H.J. Optimization design of diesel engine cooling system based on coupled fluid-structure model. Automot. Eng. 2012, 34, 674–678. [Google Scholar]
- Li, Z.; Huang, R.H.; Wang, Z.W.; Ding, H.Y. Optimal design of cylinder head of heavy-duty diesel engine based on multi-field coupling. J. Huazhong Univ. Sci. Technol. (Nat. Sci. Ed.) 2011, 8, 15–18. [Google Scholar]
- Liu, P.F. Thermal Load Analysis and Research for Key Components in the Improvement of High-Power Specific Diesel Engine. Master’s Thesis, China Ship Research and Development Academy, Beijing, China, 2015. [Google Scholar]
- Li, M.H.; Dong, D.D. Finite element analysis of the cylinder liner of a 280 diesel engine. Adv. Mater. Res. 2012, 616–618, 1745–1750. [Google Scholar] [CrossRef]
- Divis, M.; Tichanek, R.; Spaniel, M. Heat Transfer Analysis of a Diesel Engine Head. Acta Polytech. 2003, 43, 34–39. [Google Scholar]
- Xia, Q. Finite Element Analysis and Experimental Research on Main Components of Diesel Engine. Master’s Thesis, Wuhan University of Technology, Wuhan, China, 2006. [Google Scholar]
- Yue, D.T. Engineering Thermodynamics and Heat Transfer; Dalian Maritime University Press: Dalian, China, 2002. [Google Scholar]
- Chen, M.Y. Thermal Load Analysis of Supercharged and Intercooled Diesel Engine. Master’s Thesis, Kunming University of Science and Technology, Kunming, China, 2013. [Google Scholar]
- Avramenko, A.N.; Abramchuk, F.I. Numerical simulation of heat-and-mass transfer processes in the cooling passages of a cylinder head in a diesel locomotive engine. Period. Polytech. Mech. Eng. 2018, 63, 26–32. [Google Scholar] [CrossRef]
- Liu, Q.; Peng, H.X.; Xin, H. Research on improvement of thermal load and structural design of cylinder head thermal surface. Intern. Combust. Engine 2016, 5, 27–29, 34. [Google Scholar]
- Fang, Q.; Zu, B.F.; Xu, Y.L.; Wang, Z.; Liu, J.; Liu, M. Steady heat transfer study of China-V diesel engine cylinder head based on fluid-solid coupling. Chin. Intern. Combust. Engine Eng. 2014, 35, 90–95. [Google Scholar]
- Suzuki, Y.; Shimano, K.; Enomoto, Y.; Emi, M.; Yamada, Y. Direct heat loss to combustion chamber walls in a direct-injection diesel engine: Evaluation of direct heat loss to piston and cylinder head. Int. J. Engine Res. 2005, 6, 119–135. [Google Scholar] [CrossRef]
- Selim, M.Y.E.; Helali, A.H.B. Effect of coolant additives on thermal loading of a diesel engine. Proc. Inst. Mech. Eng. Part D: J. Automob. Eng. 2001, 215, 1131–1142. [Google Scholar] [CrossRef]
- Madison, D.P.; Miers, S.A.; Barna, G.L.; Richerson, J.L. Comparison of Piston Temperature Measurement Methods: Templugs Versus Wireless Telemetry with Thermocouples. In Proceedings of the ASME 2012 Internal Combustion Engine Division Fall Technical Conference, Vancouver, BC, Canada, 23–26 September 2012. [Google Scholar]
- Li, B. Marine Diesel Engine, 2nd ed.; Dalian Maritime University Press: Dalian, China, 2015. [Google Scholar]
- Saravanan, S.; Nagarajan, G.; Ramanujam, R. Application of Taguchi’s orthogonal array in reducing the NOx emission of a stationary diesel engine. Int. J. Oil Gas Coal Technol. 2011, 4, 398–409. [Google Scholar] [CrossRef]
- Shraddha, S.; Arun, G. Medium Optimization of Fermentation for Enhanced Dextran Production from Weissella confusa Cab3 by Statistical Methods. Adv. Microbiol. 2012, 2, 277–283. [Google Scholar]
- Sangram, D.J.; Madhukar, S.T. Multi-objective Performance Optimization of Compression Ignition Engine Operated on Mangifera Indica Biodiesel by Applying Taguchi Grey Relational Analysis. Waste Biomass Valorization 2016, 7, 1309–1325. [Google Scholar]
- Zhao, P.C.; Li, Z.; Shang, Z.; Wang, J.F. Experimental study on surface roughness of fused deposition based on Taguchi method. Exp. Technol. Manag. 2020, 3, 162–164. [Google Scholar]
- Li, Z.X. Application study of the quality defect causes analysis by Taguchi method. J. South. Vocat. Educ. 2013, 4, 4–10. [Google Scholar]


© 2020 by the authors. Licensee MDPI, Basel, Switzerland. This article is an open access article distributed under the terms and conditions of the Creative Commons Attribution (CC BY) license (http://creativecommons.org/licenses/by/4.0/).