1. Introduction
Hydrogen production from photocatalytic water splitting by using semiconductor photocatalysts has become one of the most promising ways of clean energy generation. For an efficient system of water splitting a semiconductor, photocatalyst requires to have a narrow bandgap (<3.0 eV) and a relatively high conduction band potential to allow the absorption of visible light and the reduction of water, respectively [
1,
2]. Among various semiconductor photocatalysts, a narrow bandgap of 2.4 eV makes cadmium sulfide (CdS) a visible-light-sensitive photocatalyst. Moreover, the flat band potential of CdS (−0.9 V vs. NHE) is more negative than the reduction potential of H
+/H
2 (0 V vs. NHE) [
3]. These two criteria enable CdS an excellent candidate to be studied for photocatalytic water splitting. However, low energy conversion efficiency and severe photo corrosion under light irradiation inhibit its practical application in water splitting as well as other photocatalytic systems [
4,
5,
6].
To improve its energy conversion efficiency, many researchers have reported the fabrication of nanoparticles with different shapes and sizes [
7,
8,
9,
10]. Miniaturization of the CdS particles into nanoscales resulted in a high specific surface area and an improved light-harvesting ability, which could enhance their photocatalytic activities. On the other hand, a stable H
2 evolution can be obtained over CdS photocatalyst in the presence of S
2− and SO
32− as election donors, which come from sulfur-based sacrificial reagents. However, the stability is still insufficient and for an enhanced stability some researchers have reported the fabrication of nanocomposites in which a material or molecules is introduced to CdS nanoparticles. The addition of such material also can improve the specific surface area, light absorption, and charge separation in CdS leading to improved photocatalytic activities. For example, Zhang et al. [
11] reported ferrous oxalate dehydrate (FOD)/CdS composites, which shows 5.9 times higher photocatalytic activity compared to pure CdS. In the case of pure CdS, the activity was decreased by 36.3% after the fourth cycle of hydrogen production, whereas for FOD/CdS only 5.2% hydrogen production was decreased after the fourth cycle. Lu et al. have reported PANI/CdS nanocomposite supported on SiO
2 hydrogen for the enhanced and stable photocatalytic activity of CdS. Their results showed that the recovery rate of the composite catalyst reached 90%, and hydrogen production efficiency remained unchanged after five cycles, indicating excellent stability of CdS. They have shown that the conductive polymer PANI played the role of charge separation and effectively inhibited the photocorrosion of CdS [
12]. Recently, Wang et al. [
13] have shown that the addition of histidine to CdS can improve its photocatalytic activity and simultaneously reduce its photo corrosion. After consecutive stable H
2 production for four cycles, the amount of H
2 production was decreased by 12%. Although the detailed mechanism of improved activity of CdS is not clear yet, it is assumed that the lone pair electrons in histidine molecule can interact with the photogenerated holes in CdS, which leads to enhanced charge separation as well as reduced photo corrosion. However, the performance of the photocatalyst in still low for its practical application in H
2 production. One of the reasons for low performance might be its large particle size (2~5 μm) and small surface area (3.26 m
2/g). To improve the hydrogen production ability, we attempted to increase the surface area of histidine/CdS composite by miniaturization of the particles. Here, we report the successful synthesis of histidine decorated CdS nanoparticles by a solvothermal method with about three times higher hydrogen production compared to the report by Wang et al. [
13]. It is worth to note that in most cases, toxic chemicals are used to synthesize the nanoparticles of CdS [
2,
7,
14,
15,
16,
17,
18]. But in this report, we used ethylene glycol (EG) as a reaction solvent, which is widely used, cheap and non-toxic to the environment [
19,
20]. Moreover, the present method is easy and a low-temperature process and thus friendly to the environment.
2. Materials and Methods
Cadmium nitrate tetrahydrate (Cd(NO3)2·4H2O, thiourea (H2NCSNH2), histidine (C6H9N3O2), Ethylene glycol ((HOCH2CH2OH) were purchased from FUJIFILM Wako Pure Chemical Co. Ltd. All chemicals were of analytical grade and used as received without further purification. For all experimental works, deionized and doubly distilled water was used.
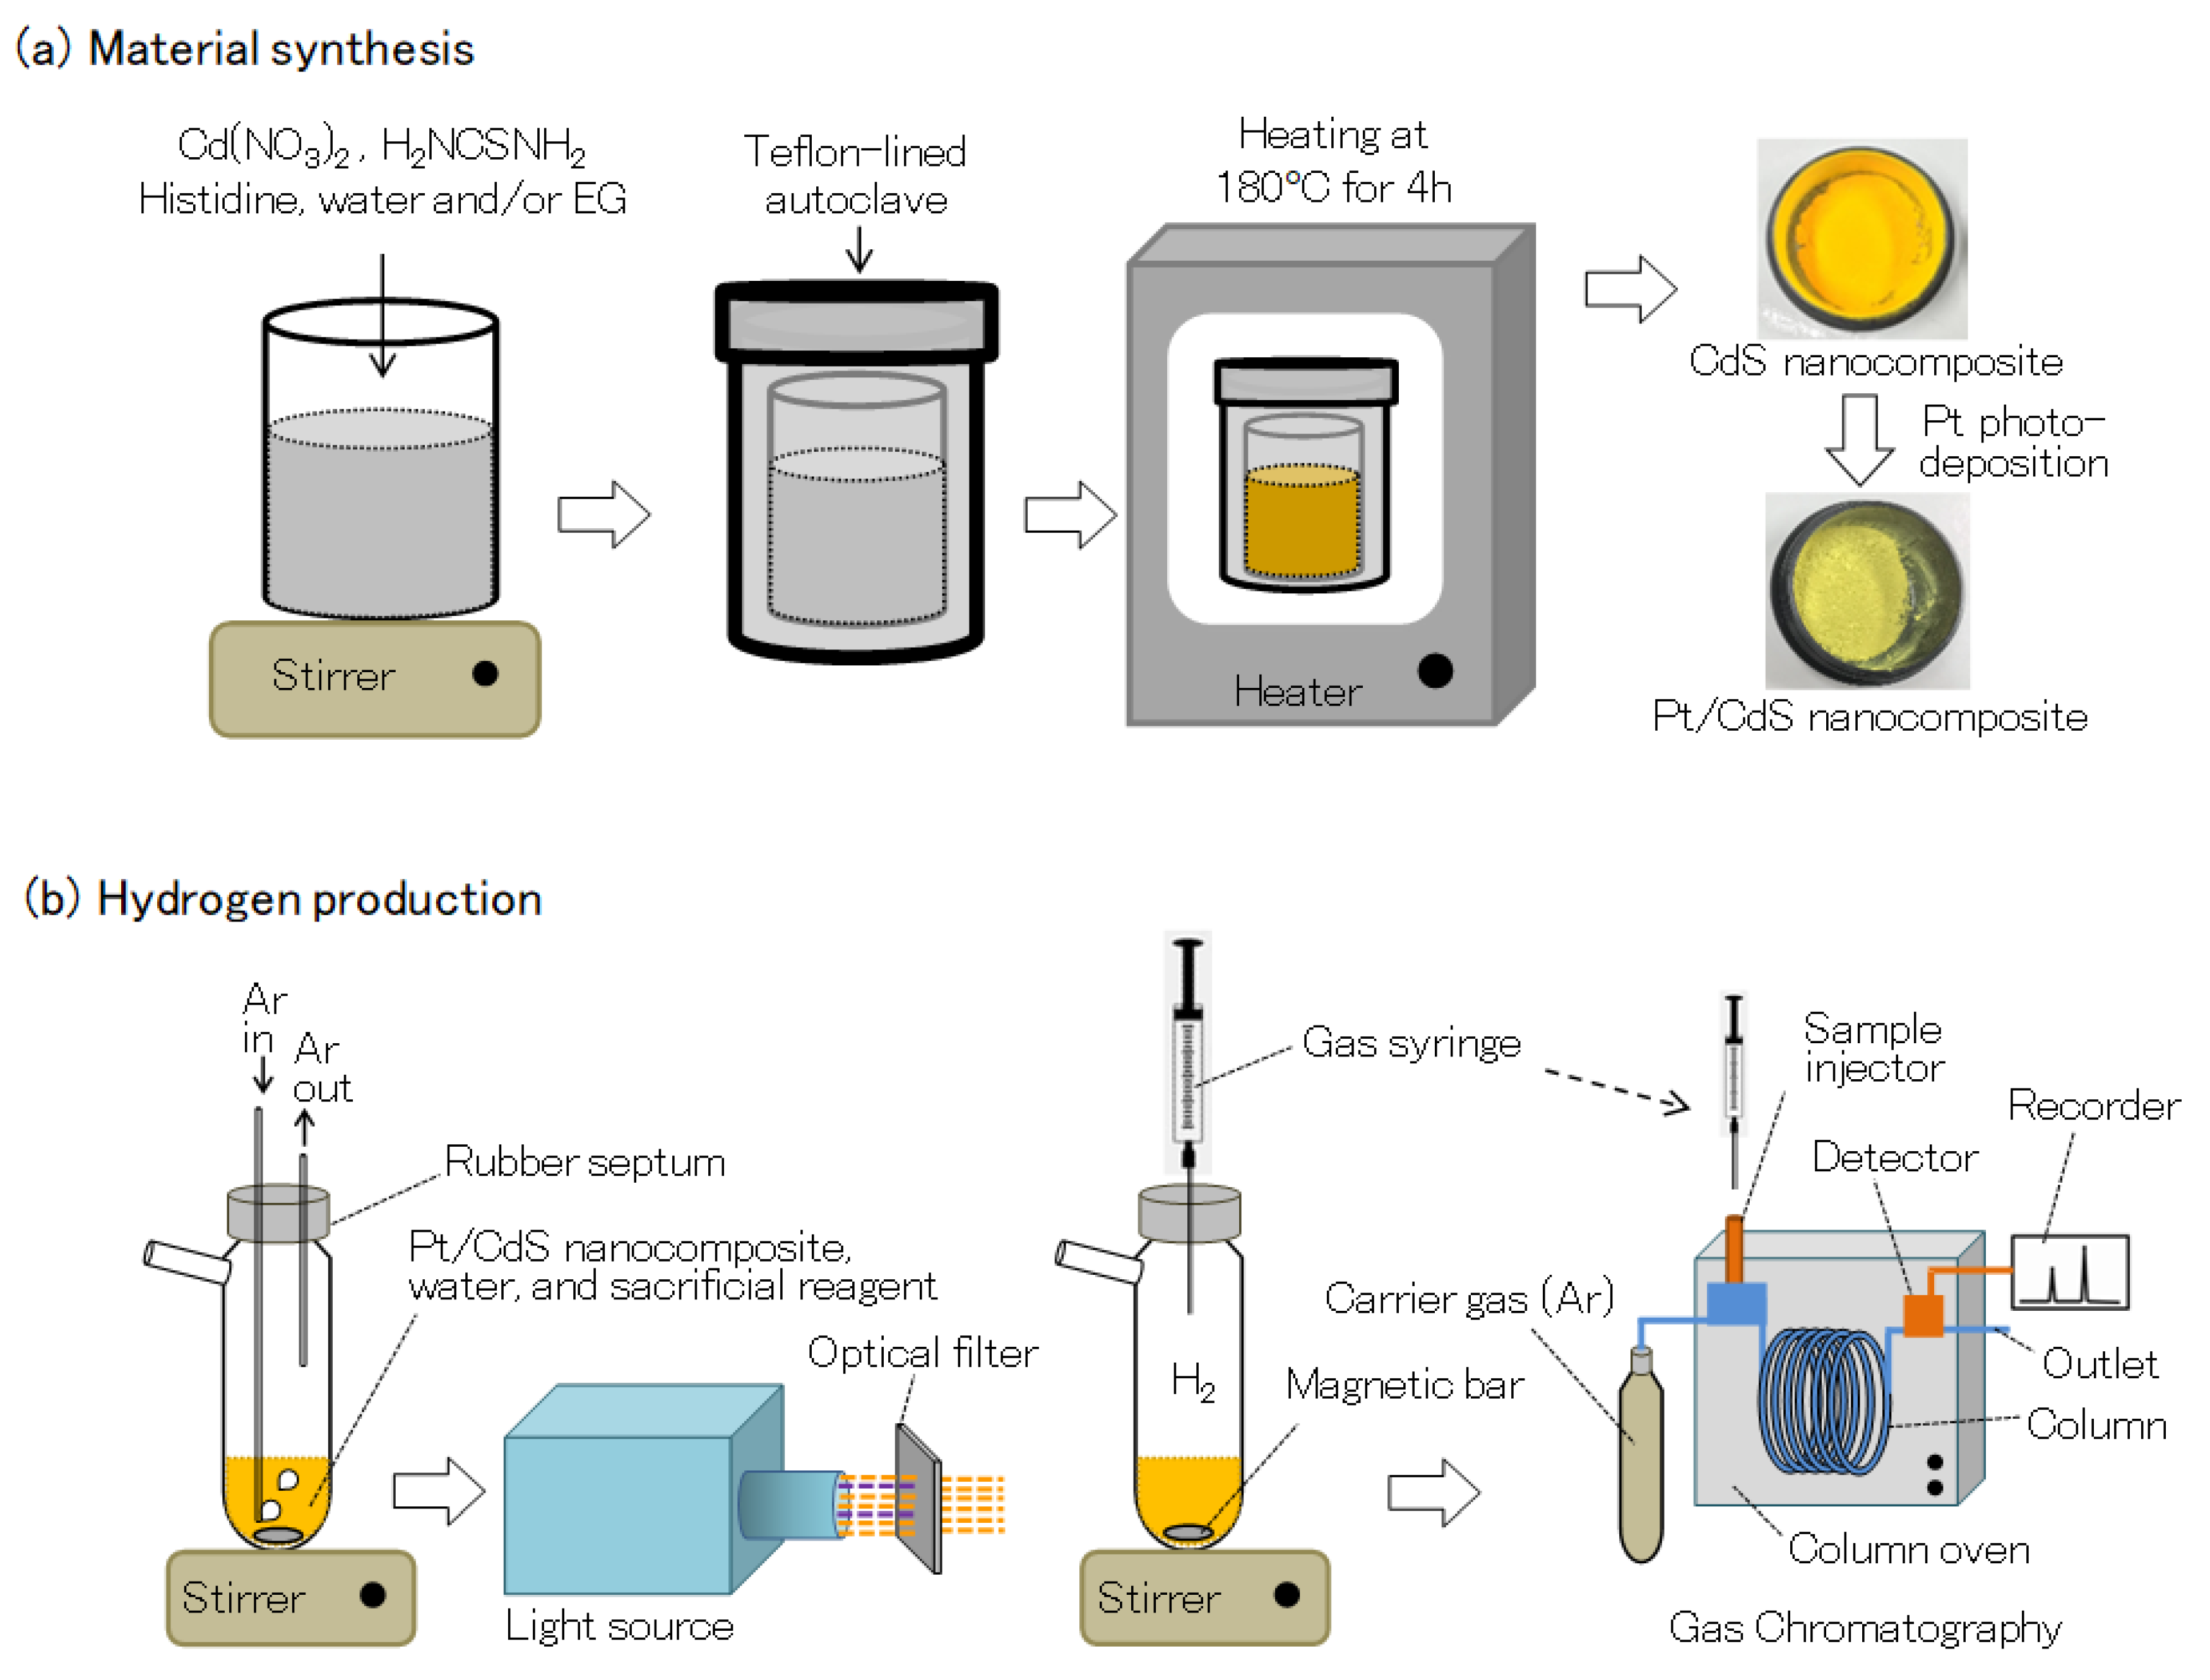
Cadmium sulfide (CdS) and L-histidine decorated CdS are prepared by a low-temperature hydrothermal or solvothermal method, as shown in
Figure 1a. In a typical experiment, Cd(NO
3)
2·4H
2O (0.005 mmol), histidine (0.0015 mmol) and thiourea (0.015 mmol) were dissolved in water or/and ethylene glycol (EG). The solution is stirred for another 60 min and then transferred into a Teflon-lined autoclave followed by heating at 180 °C for 4 h. Finally, the product was washed with plenty of water and ethanol and dried in a furnace at 80 °C for 8 h.
CdS samples with histidine (+H) and without histidine (−H) were synthesized using different amounts of EG (0~100%) to water as a reaction solvent, and the samples were denoted as EG0+H, EG25+H, EG50+H, EG75+H, EG100+H, EG100-H. Platinum (Pt, 0.3~4.8 wt%) was deposited on CdS nanoparticles by the conventional photoreduction method. Briefly, the as-prepared CdS sample and required amount of H2PtCl6 was dissolved in an aqueous NaOH solution. The solution was irradiated by light for 30 min to 300 min under the Ar atmosphere. After irradiation, the filtered Pt-loaded sample was washed with distilled water and ethanol and dried in a desiccator.
For hydrogen production measurements, 30 mg of CdS photocatalyst was dispersed in an aqueous solution (
Figure 1b) of Na
2SO
3 (0.1 M) and Na
2S (0.1 M) as a sacrificial reagent. The catalyst was maintained in suspension by a magnetic stirrer, and the top of the flask was sealed with a silicone rubber septum. To remove oxygen, the suspended solution was bubbled with Ar gas (about 5 mL/min) for 1 h with stirring. The light irradiation was carried out under an Ar atmosphere by using a xenon lamp (Ushio, 300 W) equipped with an optical filter (λ > 390 nm). The evolved gas was sampled through the silicone rubber septum by using a locking-type syringe at a constant time interval, and the gas was quantitatively analyzed by a gas chromatography (GG-8A, Shimadzu corp., detector: thermal conductivity detector (TCD), column packing: molecular sieve 5 Å, carrier gas: Ar) at 25 °C.
The X-ray diffraction (XRD) patterns were recorded using an X-ray diffractometer (Rigaku Ultima IV) with a Cu X-ray source (Wavelength λ: Kα = 1.544426 Å). The morphology of the catalyst was examined using field emission scanning electron microscopy (FE-SEM; JSM-7600FA, JEOL Ltd., Akishima, Japan) with an accelerating voltage of 15 kV. For the particle size distribution, sizes of about 150~300 particles in several SEM images for each sample were calculated. The specific surface areas of the photocatalysts were determined by applying the Brunauer-Emmett-Teller (BET) method to the N2 adsorption/desorption isotherms measured by a BELsorp-max (BEL Japan Inc., Osaka, Japan). The pore size and pore volume the samples were determined from the nitrogen adsorption-desorption isotherm by the Barrett-Joyner-Halenda (BJH) method. UV-visible diffuse reflectance spectra and photoluminescence spectra were recorded using a spectrophotometer (UV-2700, Shimadzu Corp., Kyoto, Japan) and photoluminescence spectroscopy (RF-5300PC, Shimadzu Corp., Kyoto, Japan), respectively.
3. Results and Discussion
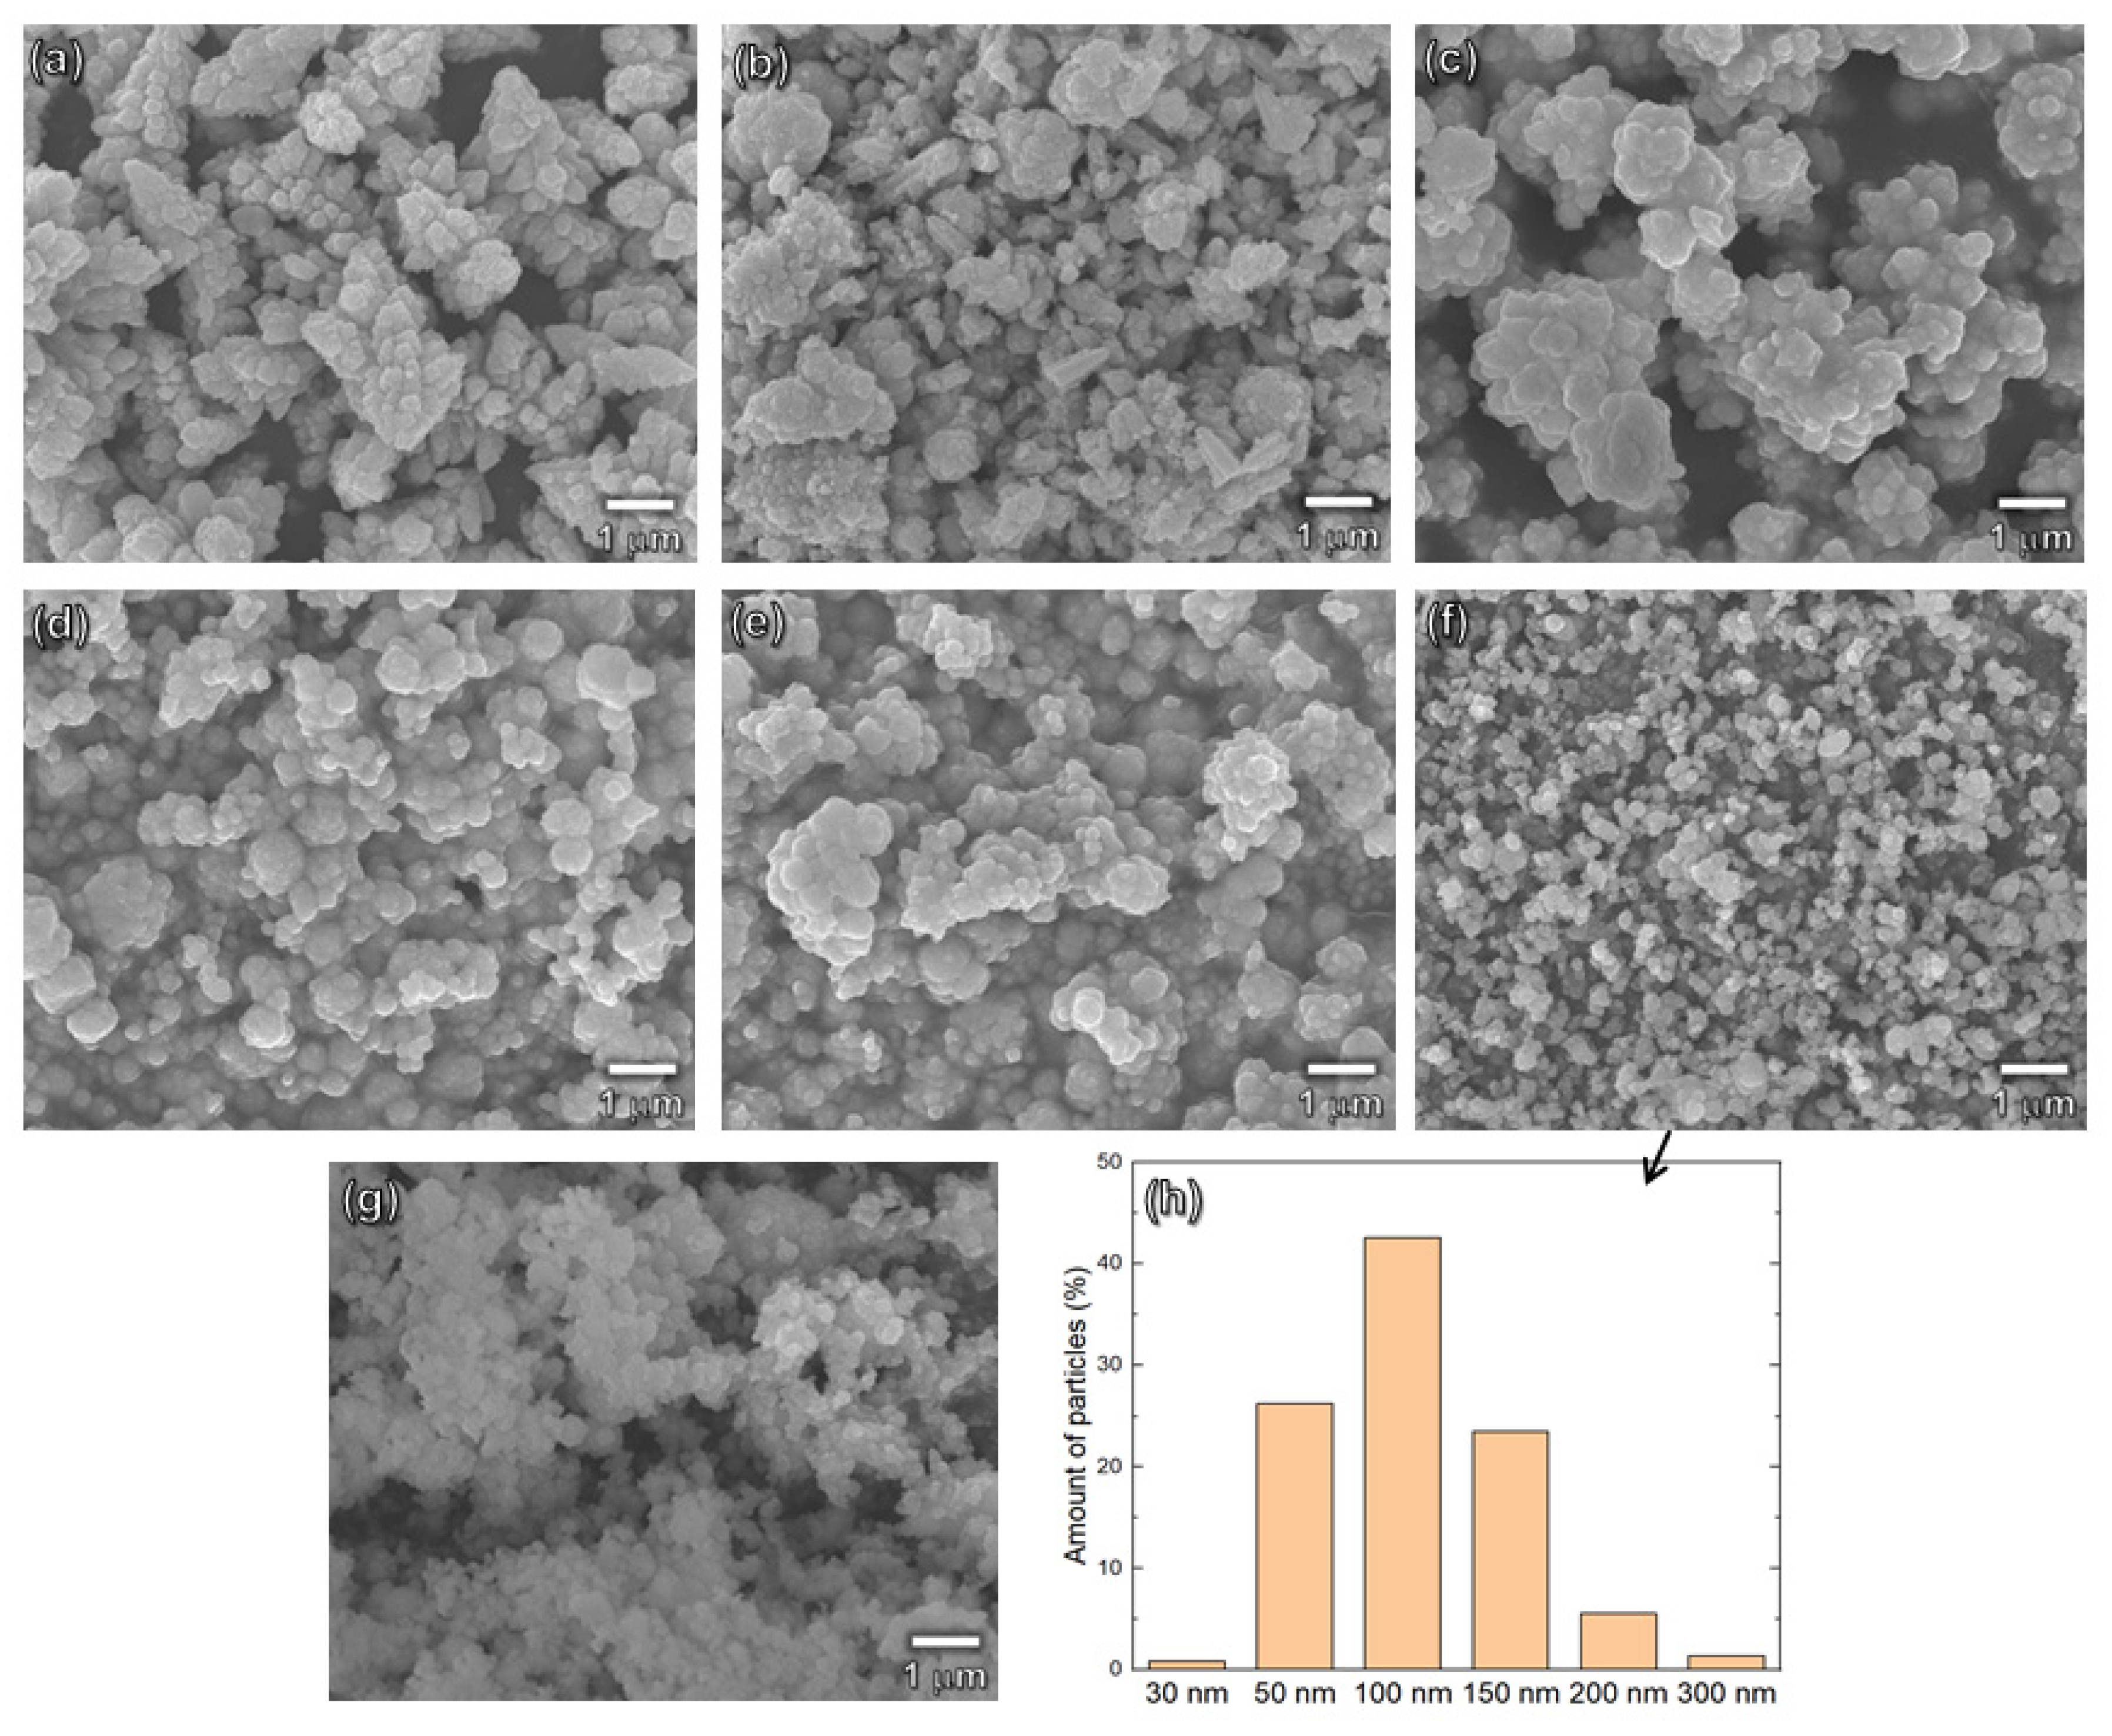
Figure 2 shows the SEM images of CdS samples prepared by water or/and ethylene glycol as a reaction solvent. It is seen that the samples prepared by using 100% water solvent (EG0+H and EG0-H) have a particle size range of 0.75~3.0 μm (
Figure 2a,b). With increasing the amount of EG to water, particle sizes gradually decrease. The particle size distribution of EG100+H sample is shown in
Figure 2h and the average particle size was calculated to be 105 nm. It should be noted that the particle size distributions of (EG100+H) and (EG100-H) samples were almost similar (see
Figure 2g,h). This result indicates that histidine does not have a considerable effect on the particle size of CdS.
However, the reason for the miniaturization of particle size might be explained in terms of the dielectric constant of the solvent. The dielectric constant of water is 80.1, which is much higher than that of EG (38.66) [
21]. Since Cd
2+ and S
2− ions are hardly saturated in a high dielectric constant solution, the monomer concentration of CdS is lower in a water solvent. In this case, the growth of CdS crystals is controlled by the thermodynamic equilibrium [
15] and due to the minimization of surface tension, larger particles are formed. With an increase in the amount of EG to water, dielectric constants of the solutions decrease. The growth of CdS particle in the low dielectric constant solvent is controlled by the kinetics [
8] because the solubility of Cd
2− and S
2− in high dielectric constant solution becomes limited and solvent can be saturated more rapidly. The high specific surface tension could slow the formation of CdS crystal leading small particles. Similar results were observed in other reports, too [
22].
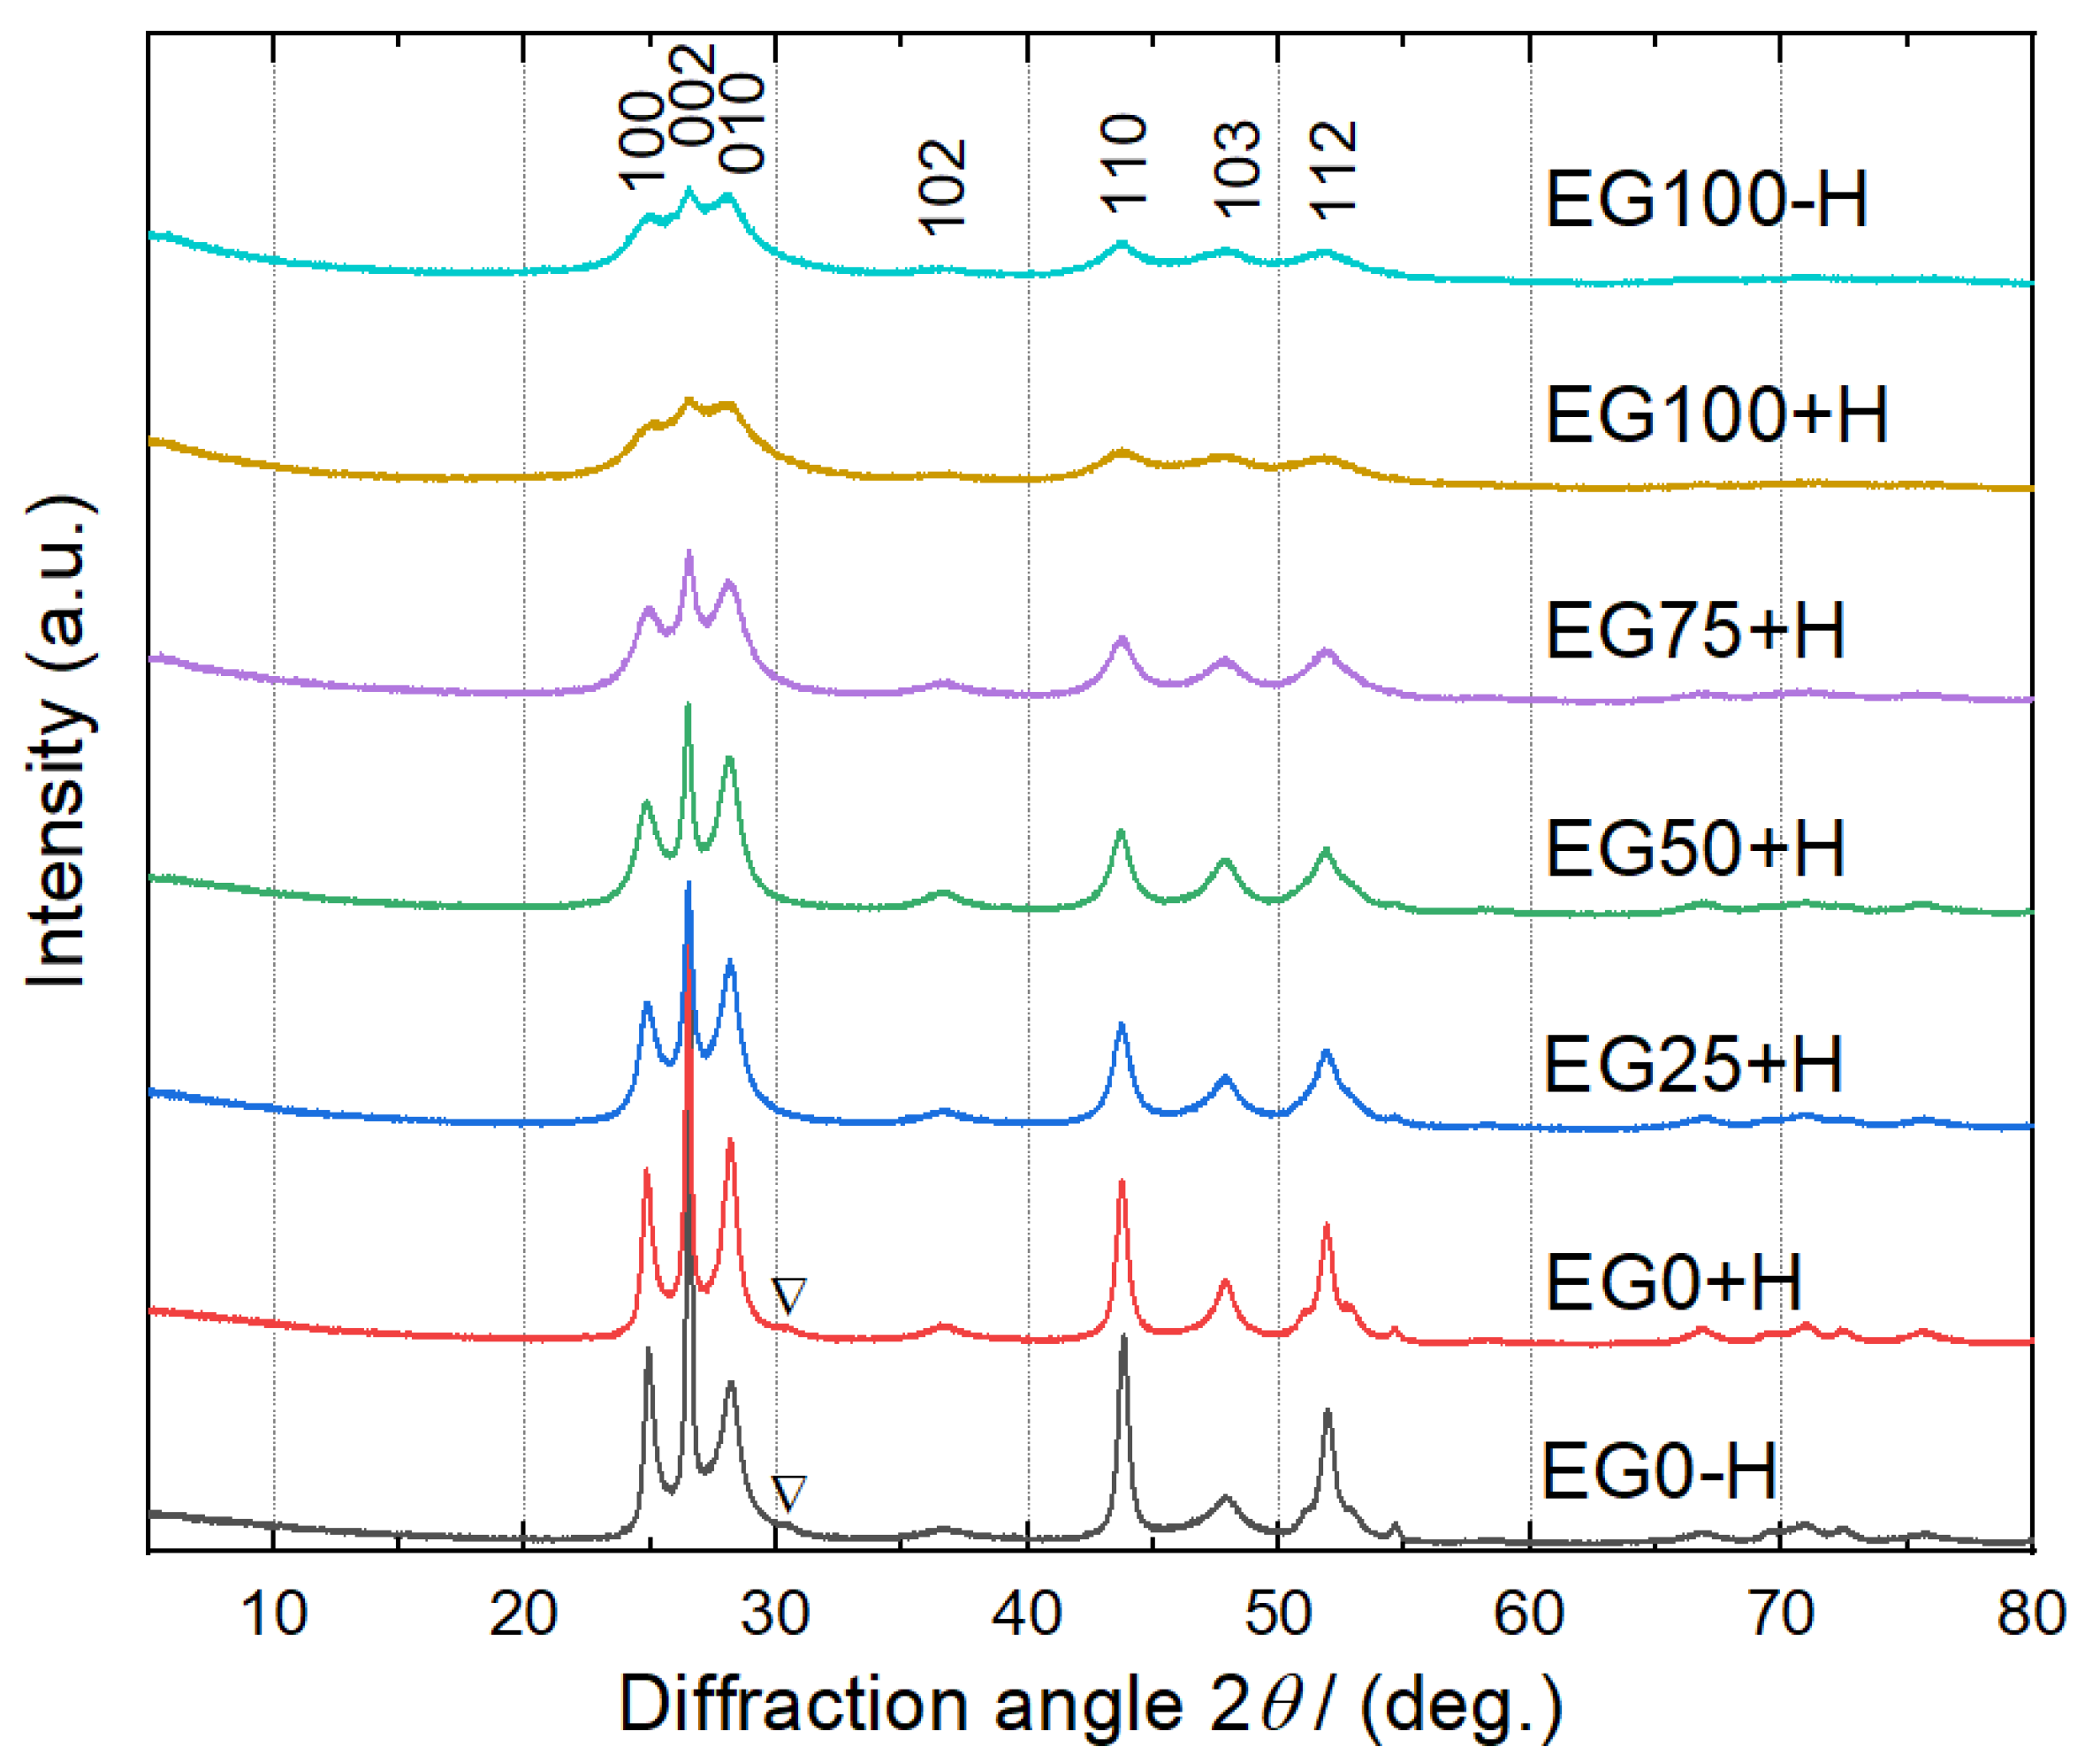
XRD analysis was used to investigate the crystal phases of the samples. The XRD patterns, shown in
Figure 3, can be readily indexed as the (100), (110), (103) and (122) plane of the hexagonal phase of the wurtzite CdS structure (space group: P63mc) with lattice parameters α = 4.141 Å and c = 6.720 Å, which match well with the standard values (JCPDS No: 41-1049). However, the CdS samples prepared by water only (EG0-H and EG0+H), a small reflection (marked by ∇) corresponding to the (200) plane of cubic phase (JCPDS 80-0019) appears at 2θ = 30.58°. This result indicates that these samples have mixed hexagonal and cubic crystals. Interestingly, even with the addition of only 25 vol% of EG to water solvent, the peak at 2θ = 30.58° is disappeared. Murugan et al. have shown that EG with lower dielectric constant can minimize the free energy difference between the hexagonal and the cubic phases, and thus favor the formation of pure hexagonal phase CdS [
16].
However, with increasing the amount of EG, the peak intensities of the sample decrease, which implies that the crystallinity of the nanoparticles decreases gradually. Li et al. [
23] reported that a decrease in particle size results in peak broadening and poor crystallization of the particle. Debye-Scherrer formula was used to calculate the crystal sizes of the samples by using the full width at half maximum of 2θ = 43.69° (110) and the results are shown in
Table 1. It is seen that with increasing EG content to water, crystal sizes decrease. Since the crystal sizes of CdS samples are smaller than their particle sizes, it can be concluded that a particle consists of several CdS crystals.
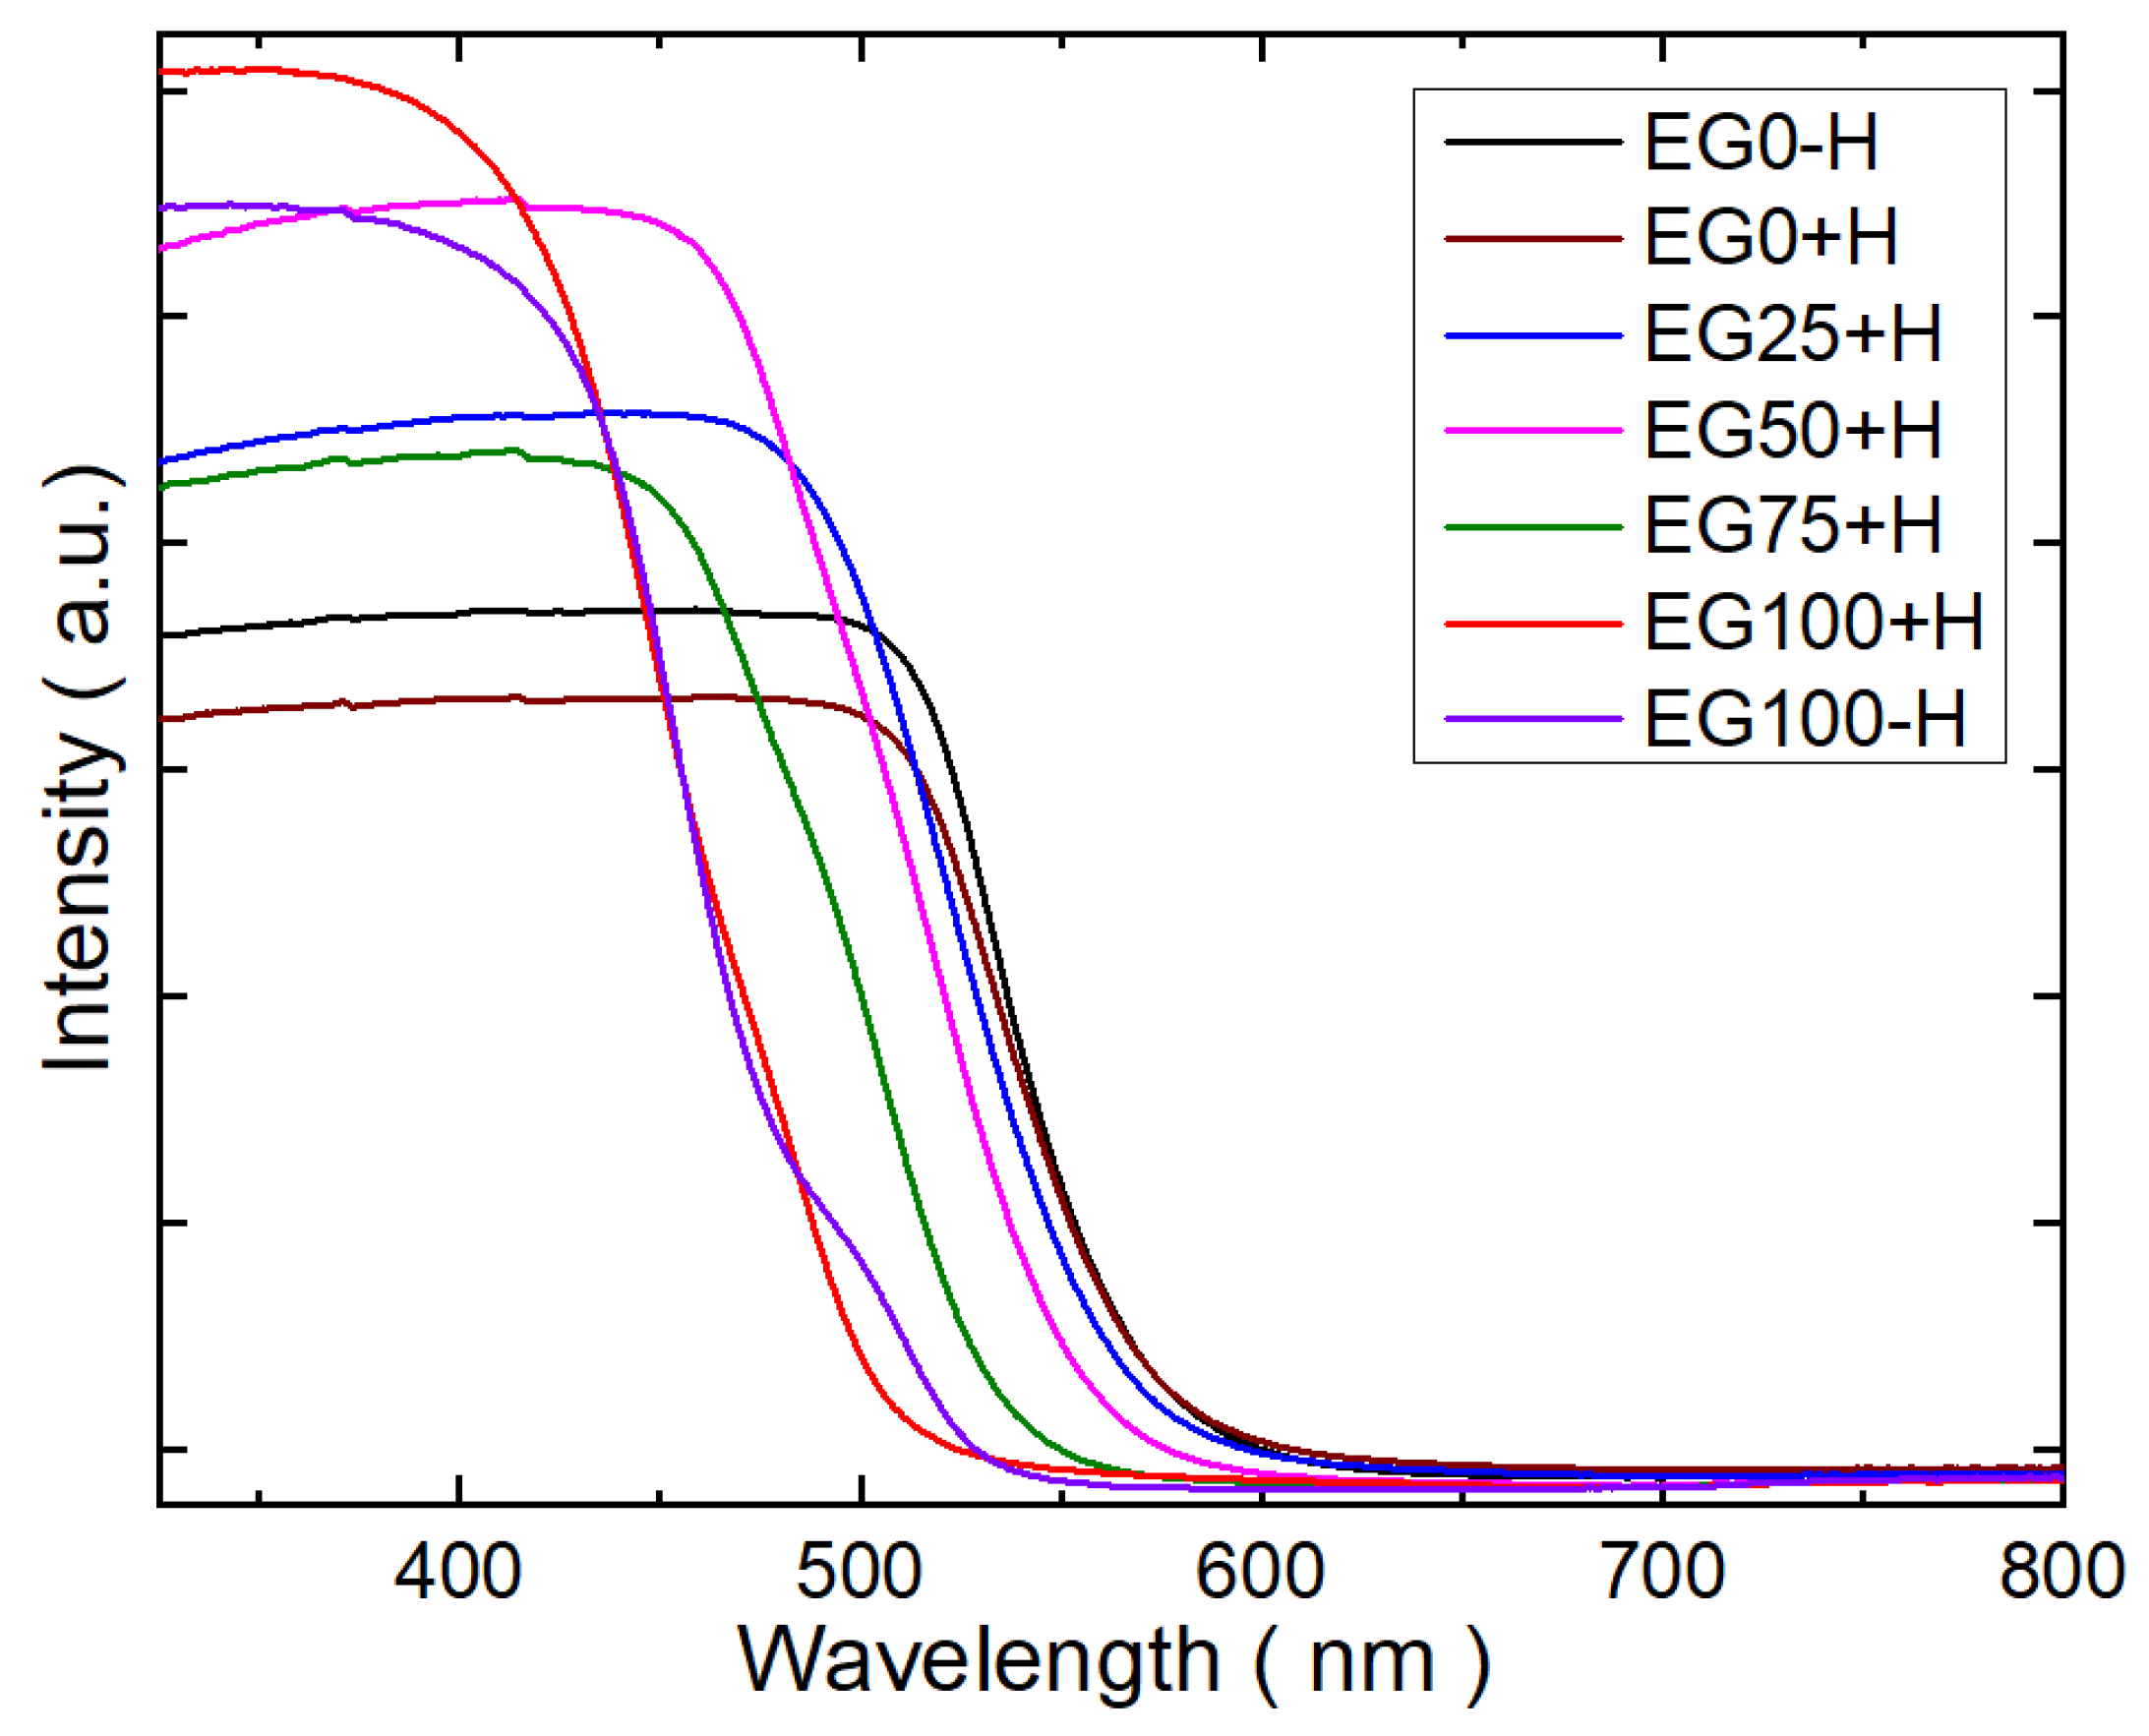
UV-visible absorption spectra for CdS samples are shown in
Figure 4. The absorption intensity EG0-H and EG0+H shows a rapid increase at ca. 550 nm. Applying the equation for bandgap EG = 1240/λ, the bandgap for both samples is found to be 2.25 eV. However, it is seen that with increasing the amount of EG as a reaction solvent, the absorption edges show blueshifts. The calculate bandgaps and the corresponding wavelengths (used to calculate the bandgaps) of the samples are tabulated in
Table 2. For the sample, EG100+H, the calculated bandgap is 2.56 eV. The widening of the bandgap could be attributed to quantum confine effect due to the miniaturization of the particles. This quantum confines effect is common in semiconductor nanoparticles and consistent with the other reports [
17,
24].
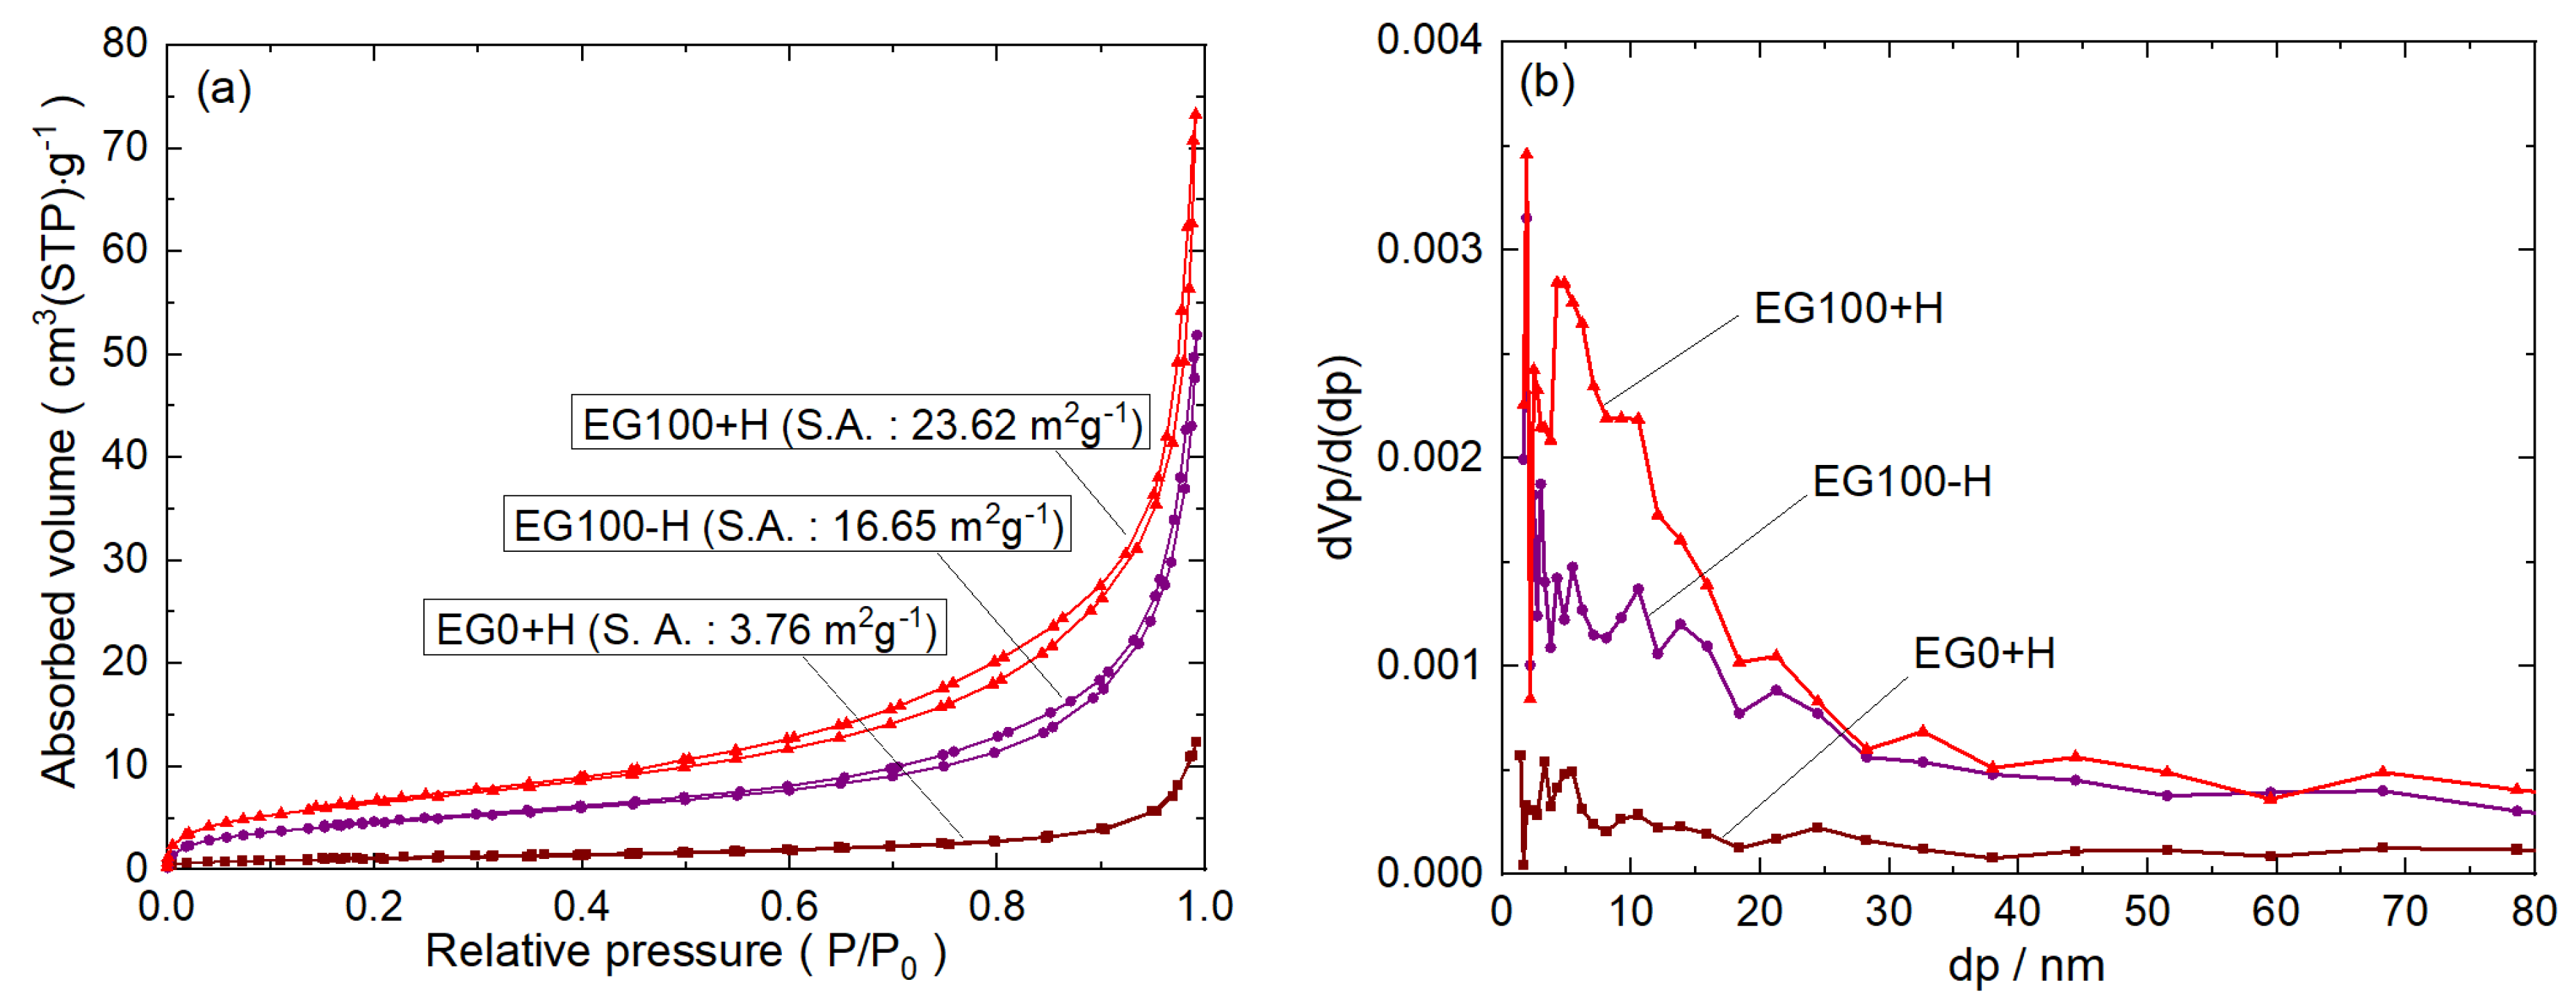
To give further insight into the surface properties (surface area, pore size, pore volume) of the as-prepared photocatalysts, N
2 adsorption-desorption isotherms, and pore-size distribution were investigated.
Figure 5a shows the N
2 adsorption-desorption isotherms of selected as-prepared CdS samples. According to Brunauer-Deming-Deming-Teller classification of N
2 adsorption-desorption isotherms, the majority of physisorption isotherms can be grouped into six types [
25]. EG0+H sample has an isotherm of type II, indicating the presence of micropores. On the other hand, EG100-H and EG100+H samples have isotherms of type IV and the shape of the hysteresis loops are of type H3, which indicate the presence of mesopores with a low contribution of micropores [
2].
The pore size distribution of the corresponding samples, obtained by the BJH method, are shown in
Figure 5b. Broad pore size distributions were found for both EG100-H and EG100+H samples. The pore volume for the EG100-H and EG100+H was found to be 0.074 and 0.11 cm
3g
−1, respectively. The BET surface areas of the EG0+H, EG100-H, EG100+H samples are calculated to be 3.7, 16.65, and 23.6 m
2/g, respectively. The surface area for EG0+H is the same as reported by Wang [
13]. However, both samples prepared by the solvothermal method have a larger surface area compared to that prepared by the hydrothermal method. The increased surface area is attributed to decreased particle sizes and the presence of mesopores in the samples. Generally, the higher specific surface area provides a higher number of active sites for photocatalytic reactions and thus a crucial factor in the enhancement of catalytic performance of the material [
13,
23,
26].
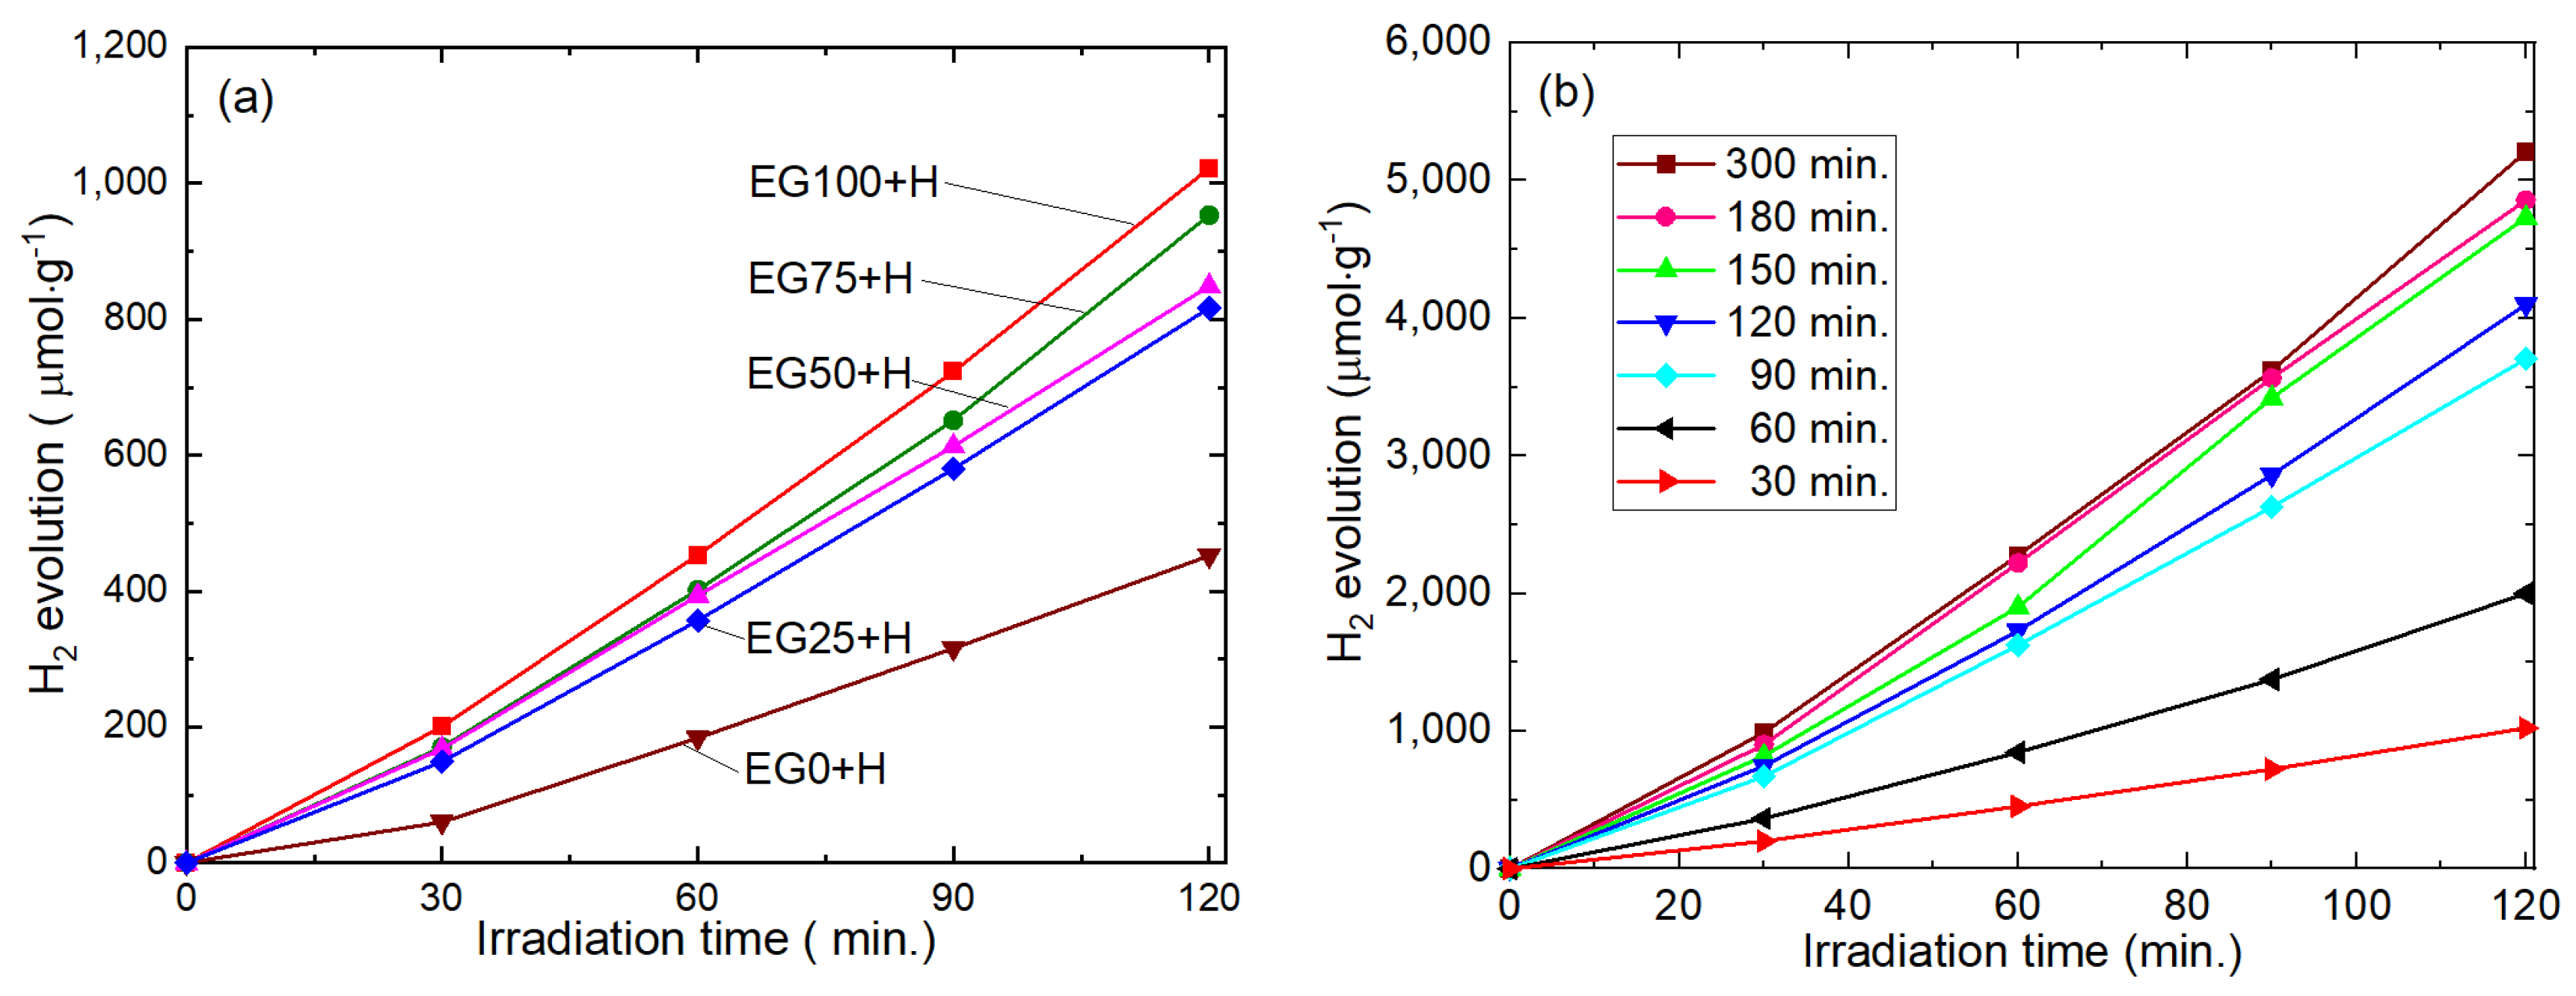
The photocatalytic performance of the samples was evaluated in terms of H
2 production under visible light irradiation. The irradiation time vs. amounts of H
2 production curves for various samples (with 0.3 wt% Pt deposition) are shown in
Figure 6a. It is seen that hydrogen production from all samples increases linearly with irradiation time. Moreover, the amounts of H
2 increase with increasing the EG content during CdS sample synthesis. After two hours of light irradiation, the amount of produced gas from EG0+H and EG100+H samples were 400 μmol·g
−1 and 1200 μmol·g
−1, respectively. This means that H
2 production is increased by three times when 100% EG is used for histidine/CdS composite preparation. This increment is attributed to the miniaturization of particles and the increased specific surface area of the samples.
The time of Pt photo-deposition also found to affect the amount of H
2 evolution [
3]. Therefore, to optimize the Pt photo deposition, the irradiation time was changed from 30 min to 300 min (keeping the Pt content fixed to 0.3 wt%), and the results are shown in
Figure 6b. With increasing the Pt contents to CdS, H
2 production increases continuously. However, the increment after 180 min was negligible, and therefore, we decided to keep the irradiation time for Pt photo-deposition to be fixed at 180 min.
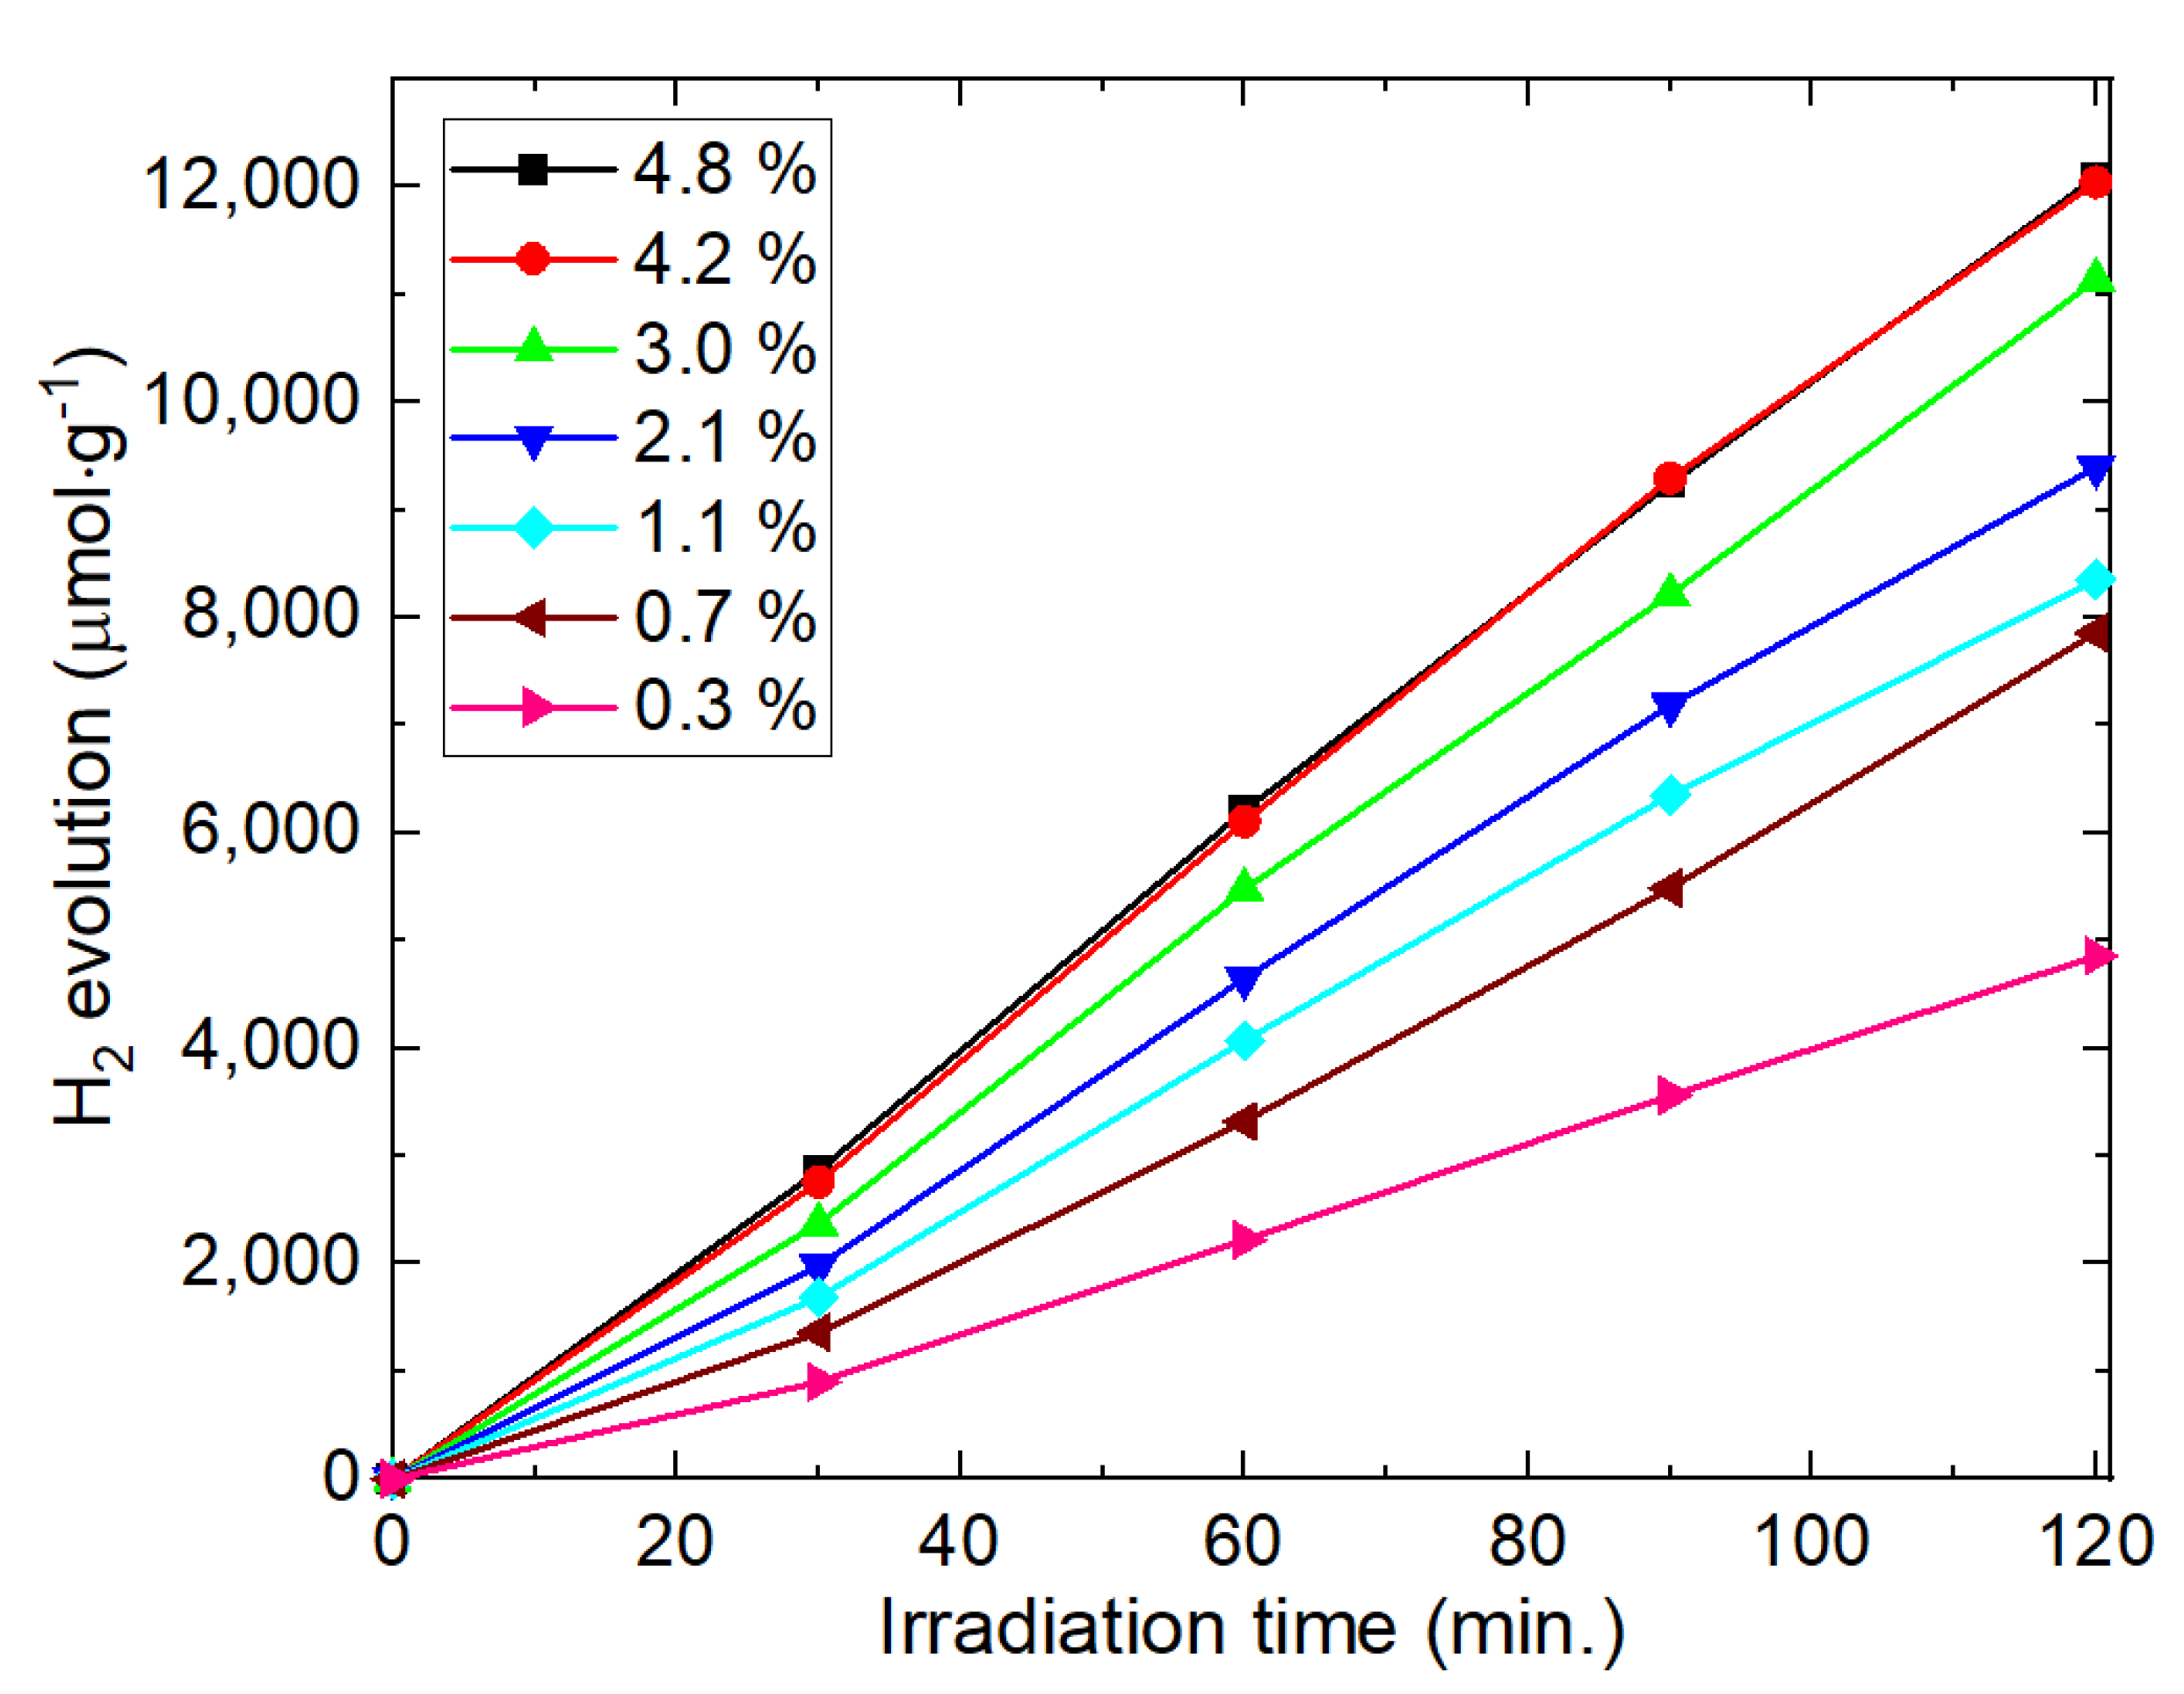
To observe the effect of Pt content on H
2 evolution, the amounts of Pt-loading on EG100+H sample were changed from 0.3 wt% to 5 wt%. The results in
Figure 7 show that with increasing the Pt contents, H
2 production also increases. With increasing the Pt content, effective charge separation, as well as the number of active sites for the reactions ise increased. As a result, H
2 evolution increases. The highest rate of the H
2 production observed for the sample with 4.2 wt% of Pt. Above this content of Pt, H
2 production was not increased considerably. It is known that the excess amount of Pt deposition inhibits the light absorption by the photocatalyst [
7]. This trend of Pt co-catalyst is consistent with the other literature [
3,
18,
27,
28], and similar trends are also observed in other co-catalysts [
23,
28,
29] in the photocatalytic systems.
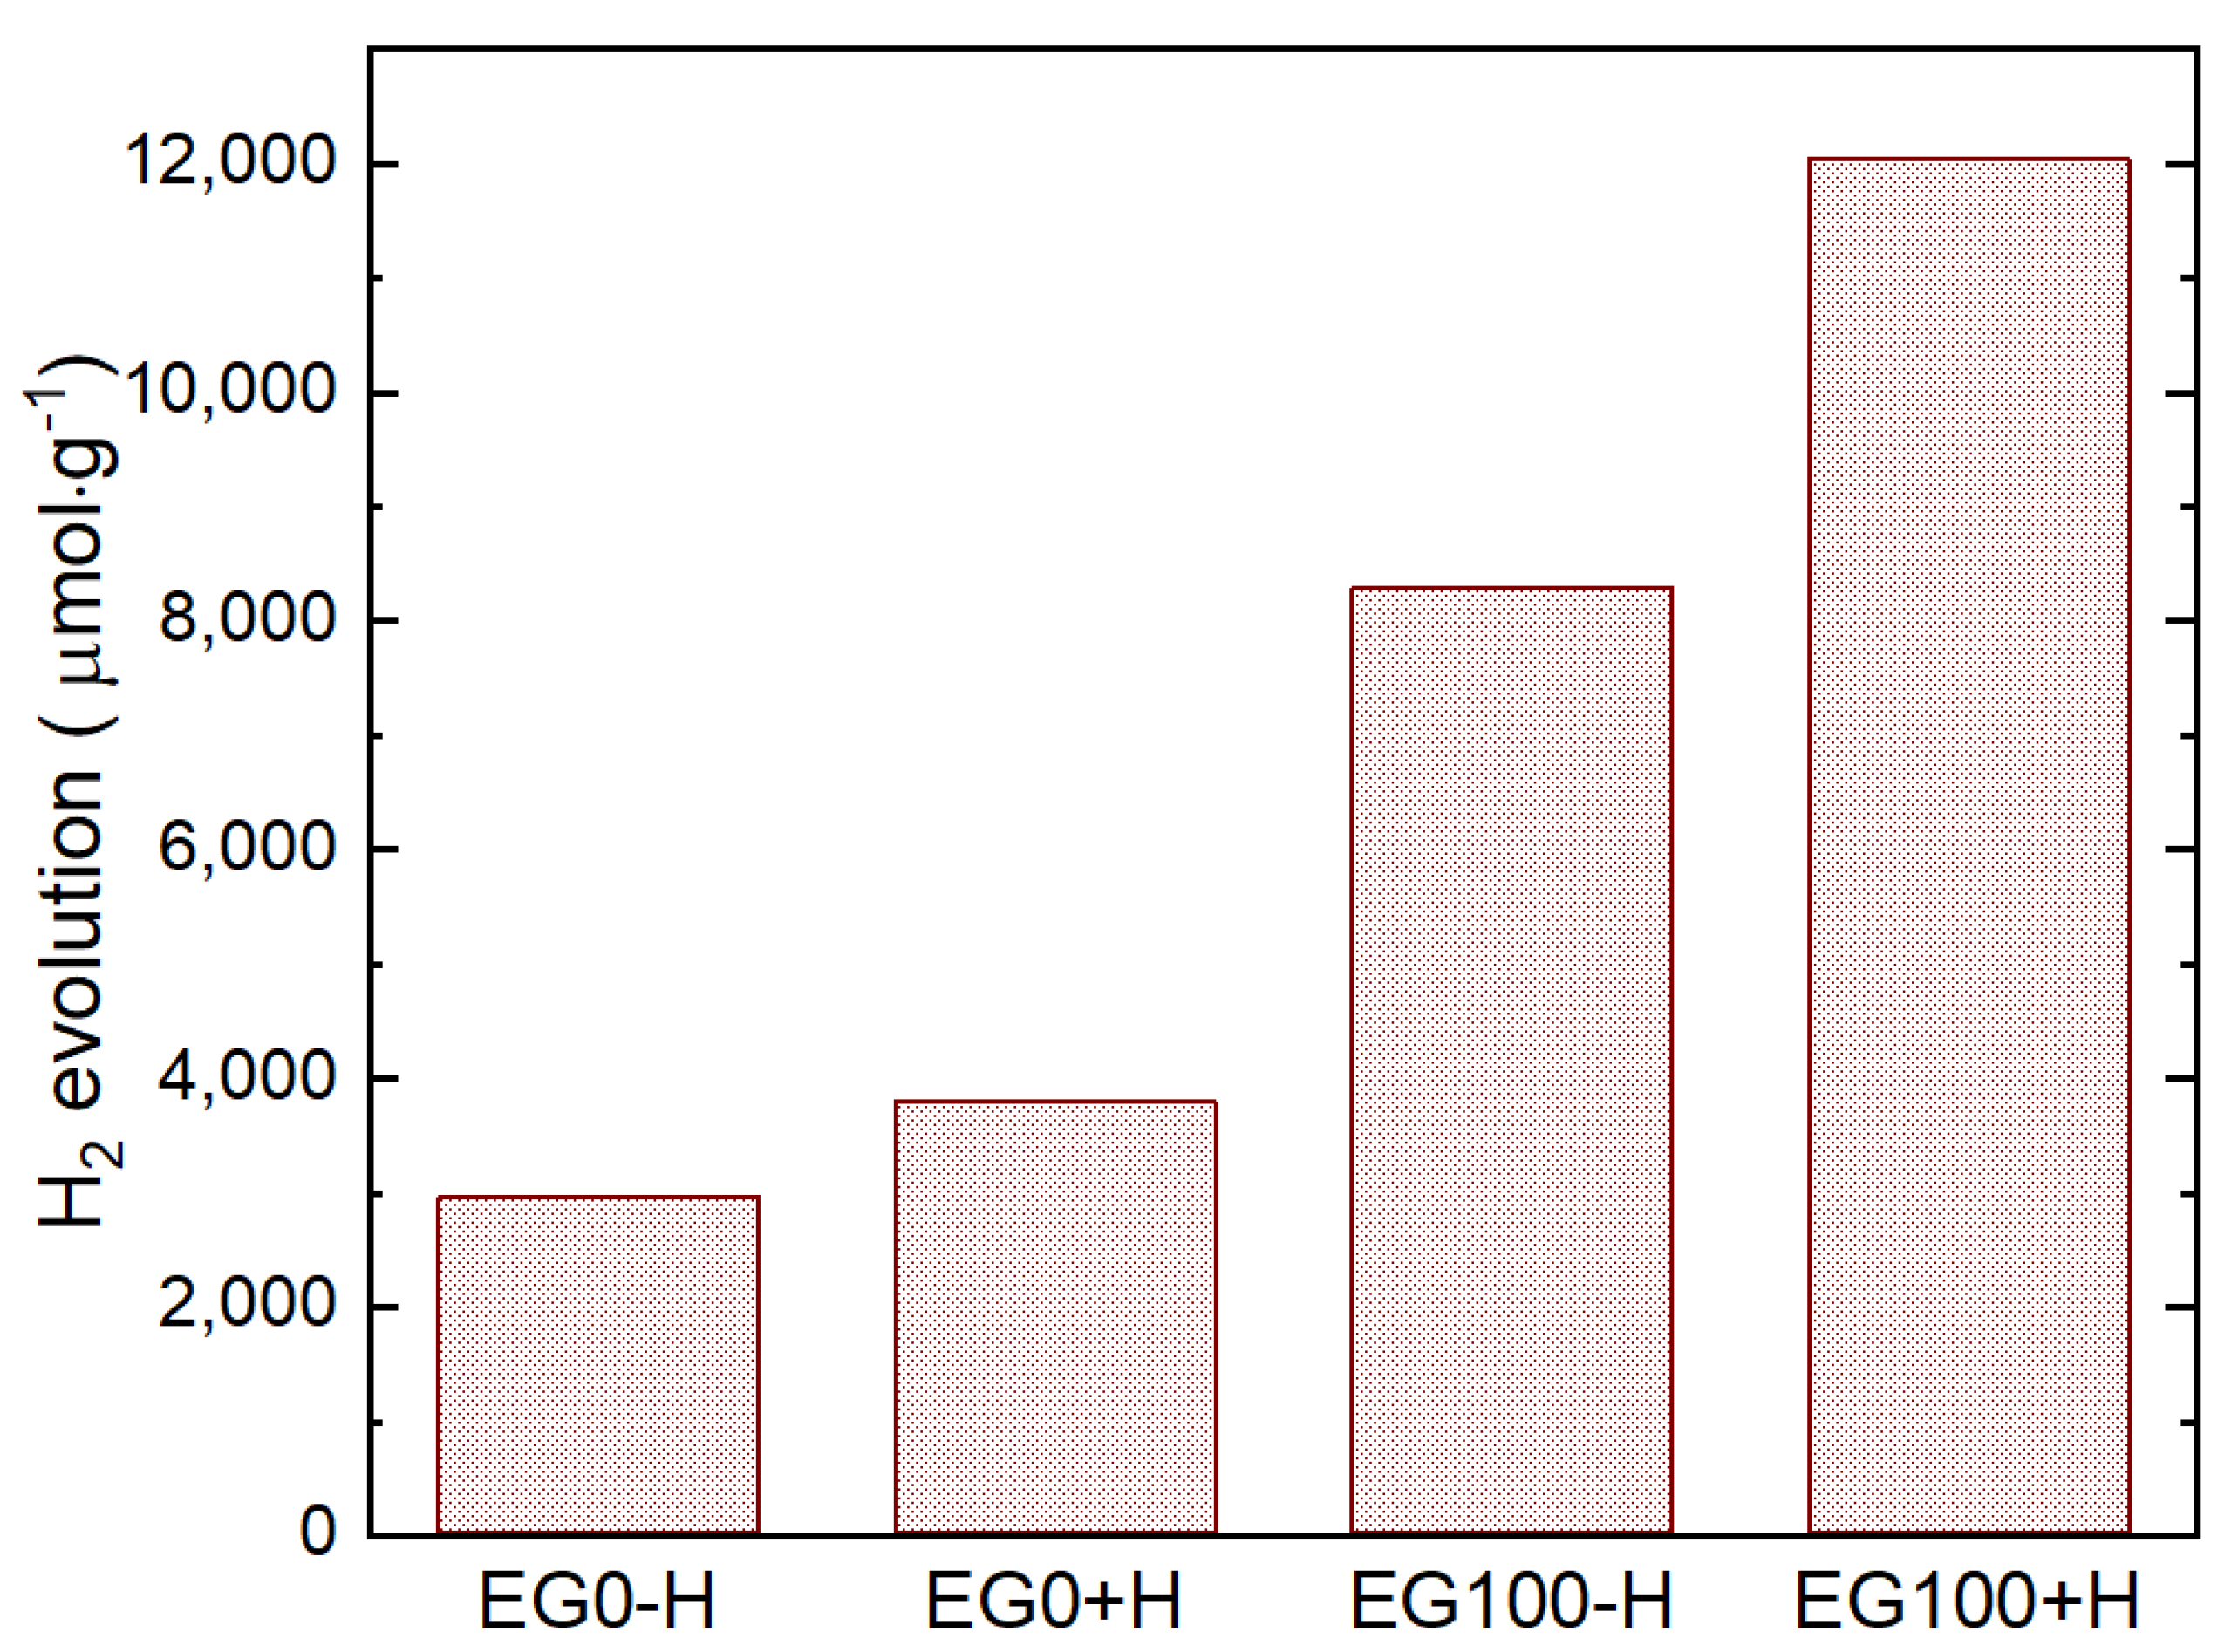
Finally, we made a comparison of H
2 evolution from 4.2 wt% of Pt deposited EG100+H sample with EG0-H, EG0+H, and EG100-H samples and the results are shown in
Figure 8. It is seen that the CdS sample with histidine (EG0+H) shows a higher (about 1.56 times) amount of H
2 production compared to the CdS sample without histidine (EG0-H). This result indicates that histidine has a synergic effect of improving the photocatalytic activity of CdS, which is discussed later in this manuscript. However, even without histidine, the CdS sample prepared by using 100 % EG (EG100-H) has about two times higher H
2 production than the EG0+H sample.
The improvement of H
2 production from EG prepared samples could be explained by the following points—(1) the increased specific surface area by the miniaturization of the particles resulted in an increased number of active sites for reactions; (2) Widening of bandgap might lead shifting of CdS conduction band to more negative in the redox potential. Shifting of band edge by bandgap widening could increase the rate of electron transfer from the photocatalyst to the solution, resulting in the improved photocatalytic performance [
30]. Similar trends are also observed in other photocatalytic systems [
2,
31,
32]; (3) It is reported that in the case of small or nanoporous particles, the distance that photogenerated electrons and holes have to migrate to reaction sites on the surface is shortened, which benefits the suppression of the electron/hole recombination in bulk [
1,
23].
The sample EG100+H shows a further improvement of H
2 production, which implies that the synergic effect of histidine is not affected by EG solvent used in our method. The sample with histidine (EG100+H) shows more than three times higher H
2 evolution compared to that of EG0+H. We compared this hydrogen production rate (6020 μmol·h
−1·g
−1) with the other 18 reports [
2,
7,
8,
9,
10,
13,
14,
33] that used only a single semiconductor photocatalyst (CdS) system. It was found that our material shows the third-highest hydrogen evolution rate. By improving the crystallinity of EG100+H sample or combining with a second semiconductor material (e.g., TiO
2), we are expecting a further improvement of hydrogen evolution, and the detail will be published in our next report.
However, the reason of improved H
2 production by histidine is not clear yet but Wang et al. proposed that the cause of improved H
2 production could be the improved charge separation by the interaction of photogenerated hole in CdS and the lone pair electrons of amidogen and hydroxyl (-NH, -NH
2 and -OH) groups in histidine, which is introduced in CdS [
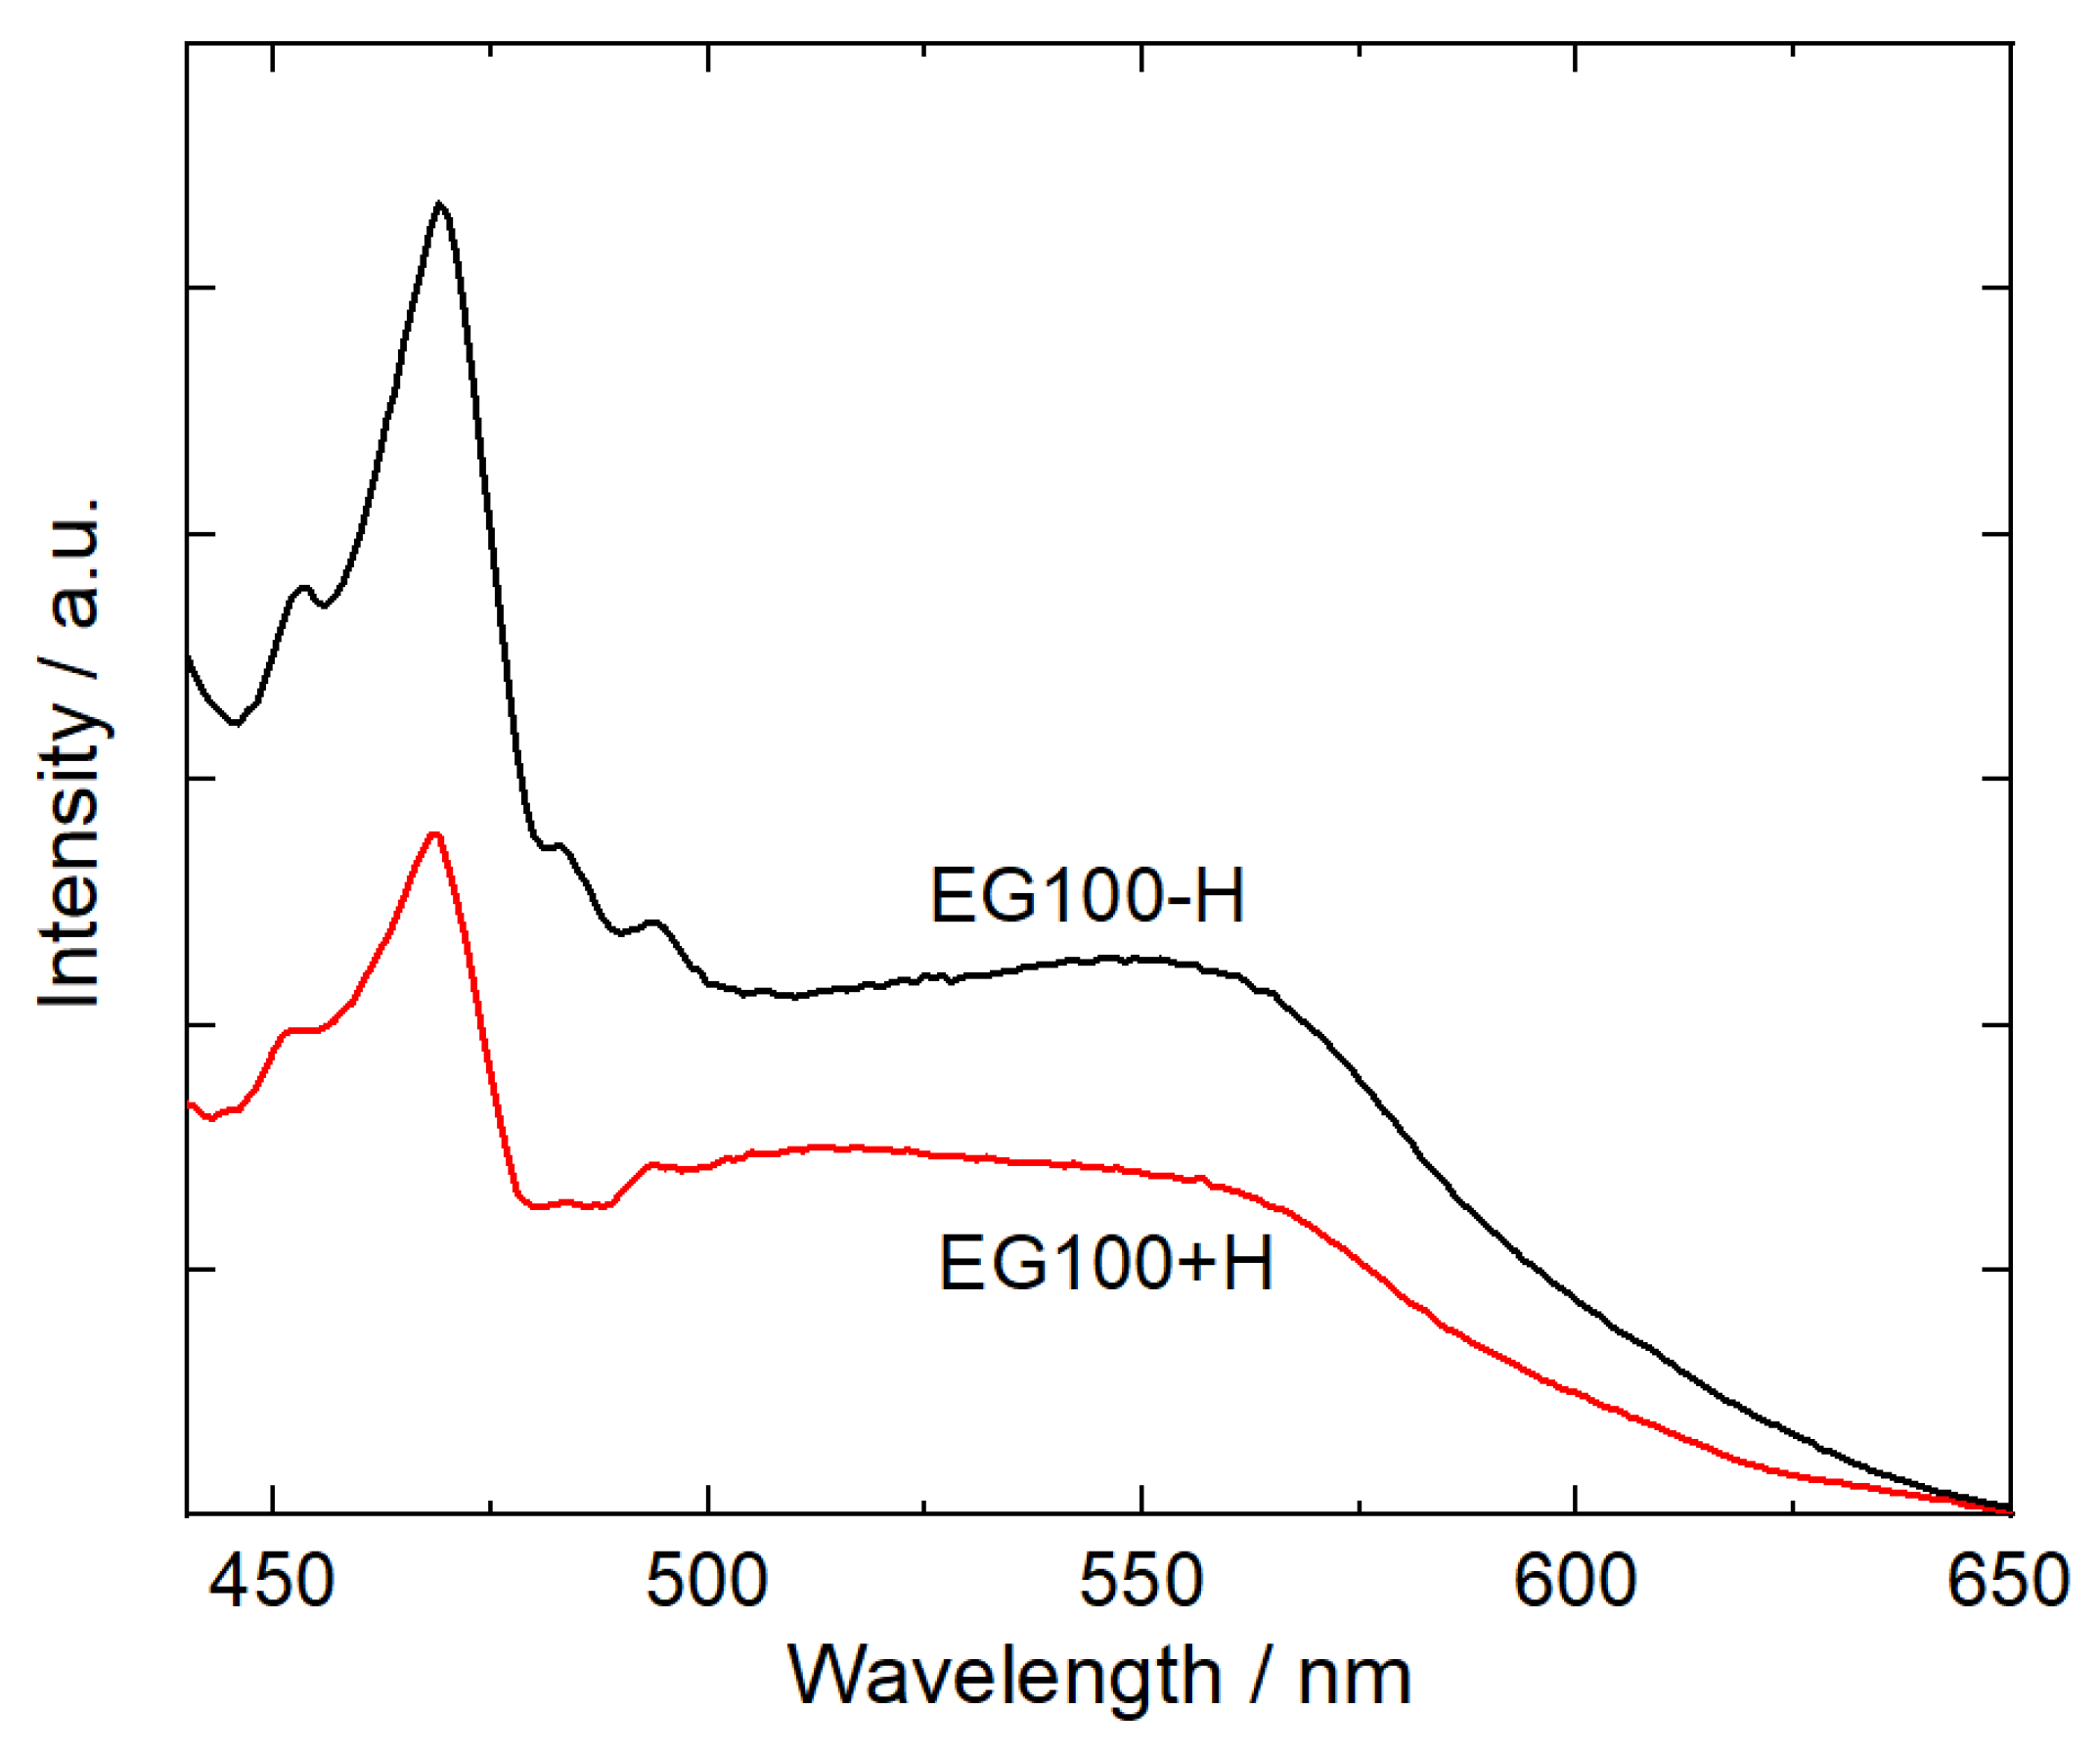
13]. This fact can be confirmed by the photoluminescence spectra for CdS nanoparticles with (E100+H) and without histidine (EG100-H). As shown in
Figure 9, both samples show an emission peak at 470 nm, which is attributed to the band-edge emission of CdS nanocrystals [
34] and the broad peak between 510–560 is commonly attributed to the recombination of the charge carriers in the surface states [
35]. The lower emission intensity for EG100+H sample implies the better charge separation of photogenerated electrons and holes pairs of the semiconductor photocatalyst.


