Article

Numerical Study on the Influence Mechanism of Crosswind on Frozen Phenomena in a Direct Air-Cooled System

School of Energy and Power Engineering, Shandong University, 17923 Jingshi Road, Jinan 250061, China
*
Authors to whom correspondence should be addressed.
Energies 2020, 13(15), 3831; https://doi.org/10.3390/en13153831
Submission received: 26 May 2020 / Revised: 15 July 2020 / Accepted: 23 July 2020 / Published: 25 July 2020
(This article belongs to the Special Issue Heat Exchangers: Cooling and Heating Systems)

Abstract

:
The frozen phenomenon is unfavorable for the direct air-cooled condensers (DACCs) in a very cold area. The effect of crosswind on frozen phenomena in DACCs at the representative 2 × 350 MW thermal power units was investigated numerically. Results showed that when the crosswind velocity was 4 m·s−1, the number of frozen air-cooled units reached a maximum of six. The increase of vortex range in the air-cooled unit was one of the important reasons to restrain the formation of frozen phenomena at a crosswind velocity from 4 m·s−1 to 12 m·s−1. The frozen phenomena in the DACC disappeared when the crosswind velocity was 12 m·s−1. As the crosswind velocity continued to increase to 28 m·s−1, the frozen region mainly appeared at the position of column 1 row 4, where the airflow rate was the maximum and the inlet air temperature was the minimum among all air-cooled units. This phenomenon occurred because there existed a relatively high-pressure zone near the inlet of each frozen air-cooled unit. In addition, although the frozen area increased from one-third of the air-cooled unit surface to half with the crosswind velocity from 20 m·s−1 to 28 m·s−1, the flow characteristics and the size of vortices in the air-cooled unit were similar in the above two crosswind conditions. Therefore, the key influencing factor became the airflow rate and the inlet air temperature of the air-cooled units under strong crosswind conditions. This study has important guiding significance for the antifreezing design and operation of DACCs.

1. Introduction

The electrical power industry has been booming quickly with the economy taking off. In particular, the number of coal-fired power plants has increased dramatically. Large-capacity coal-fired power plants require not only large amounts of coal, but also large amounts of water. However, in areas rich in coal resources, water resources may not be sufficient. The water-saving effect of direct air-cooled condensers (DACCs) is remarkable. Therefore, the study of the flow and heat transfer characteristics of DACCs becomes more and more important. At present, there are also shortcomings in DACCs. The DACCs are generally built in drought-scarce areas, such as Inner Mongolia, China. In these areas, the direct air-cooling system is in extremely cold weather in winter, and the winter time is relatively long. The safety and normal operation of the DACCs will be challenged. Crosswind is one of the important factors affecting the thermal performance of the DACCs. This study lays a theoretical foundation for the design of a direct air-cooled system and the formulation of antifreezing measures.
Several factors such as fan performance, windproof structures, inlet flow distortions, and ambient crosswind have great effect on the thermal-flow performances of DACCs. The effect of an axial-flow fan performance showed that different installation angles of the blade affected the plenum chamber aerodynamic behavior [1]. Apart from fan performance, the influence of the inlet air distortion in the direct air condenser has negative effects on the DACC performance [2]. Wang [3] found that wind effect and fan suction were the main reasons for the hot air recirculation, and the installation of a wind wall above and below the fan platform could avoid the occurrence of hot air recirculation. Liu [4] studied the influence mechanism of crosswind speeds and directions on hot air recirculation, and the author put forward measures to effectively reduce the occurrence of hot air recirculation. The effect of windproof structures and windshield devices could gain excellent thermal-flow performances of DACCs [5]. Wang [6,7] proposed methods to improve the thermal performance of a natural draft dry cooling tower by installing windproofing. Bustamante [8] compared the wet cooling tower with the direct air-cooling system, and found that if the direct air-cooling system was used in the power plant, the efficiency of the power plant dropped by about 5–10%. Based on this, a technique for reducing air-side resistance was proposed. Finally, the air flow rate was increased by 68%. The power plant had reached the same level of efficiency as the wet cooling tower. Because the cooling performance in different areas of the air-cooling system was complicated and variable under the action of natural wind, Liu [9] conducted a zone adjustment experiment on the axial fan group, and the result showed that the speed of the axial fan had a more direct impact on the performance of the unit.
Owen and Kroger [10] confirmed that fan performance deterioration led to a decrease in the thermal performance of the air-cooled condenser (ACC) with wind speed increasing. Meanwhile, Al-Waked [11,12] reconfirmed that ambient wind had a bad influence on the thermodynamic properties of the natural draft dry cooling tower. Yang and Du [13] mainly studied the thermal performances of DACCs at various ambient wind speeds by building a mathematical physics model. Through further research, it was found that the crosswind effect inside the direct air-cooling system quickly attenuated along the direction of the crosswind under the joint effect of the hot plume and the surrounding environment. When the wind direction was 90°, the thermal-flow performance of the air-cooling system was insufficient, mainly due to the air flow rate of the air-cooled unit decreasing in the upwind direction [14]. The historical crosswind condition distributions for a specific location was important for trying to optimize the performance of a modular air-cooled condenser [15]. Zhang [16] used numerical simulation method to study the thermal performance of the air-cooling system by installing a diffuser orifice plate at different velocities. The study found that the diffuser orifice plate could effectively improve the thermal performance of the cooling tower, and gave the design scheme of the diffuser orifice plate.
Fabbri [17] studied the direct and reverse flow proportional configuration of the direct air condenser tube bundle, and selected the optimal proportional configuration to ensure that the DACC can effectively prevent low-temperature phenomena under severe cold weather or low load working conditions. O’Brien [18] found that the frozen phenomena of the tube bundle was mainly because the cooling capacity of the finned tube was greater than the thermal load of the steam in the tube bundle by the experimental method. Li [19] improved the air-cooled island structure and effectively overcame the freezing problem in the operation of the direct air-cooled unit.
The recently reported achievements in terms of computer models for ACCs is presented. Klimeš [20] established a semi-empirical balance-based computational model for the ACC. Compared with the computational fluid dynamics (CFD) model of the ACC, this computational model was more efficient and economical. The computational results were compared with the data of a municipal waste incineration power plant and the results showed that this computational model was suitable for the design and evaluation of the ACC. Moore [21] used a series of experiments to establish a concentrated solar power (CSP) system analysis computer model for 50MW CSP. The computer model could be used to analyze the thermal performance and friction performance of the ACC finned-tube radiator. The research results showed that whether the single-row finned-tube design was two-row or four-row, they were similar in technical performance. He [22] created a CFD model by using Fluent, and studied the influence of crosswind on the thermal performance of the ACC by this method. Using the dynamic boundary model and the zone model, Xue [23] established a dynamic mathematical model of the ACC. The temperature of the air and the flow rate of air were studied by applying this model, and the results were satisfactory. Medina [24] researched the results of the differential equation of the velocity distribution, and considered that the steam was membrane condensation. Finally, Rohsenow’s empirical conditions and theoretical results were combined to obtain a mathematical calculation model. Using this numerical model, the results’ deviation in 692 tests was 2%.
To date, the research on crosswind has mainly focused on the influence of the temperature field, velocity field, and heat transfer characteristics of the DACCs. However, the effect of crosswind on the frozen phenomena in a DACC was seldom studied under extreme cold weather conditions. In this study, the temperature field and flow field of DACCs were studied by FLUENT software in a representative 2 × 350 MW power plant located in Inner Mongolia. The purpose was to get distribution regularity of the flow field within and around the air-cooling platform under different crosswind conditions and the change of the minimum temperature on the surface of the DACC. Further, the characteristics of flow fields in the frozen regions were studied.

2. Mathematical Model

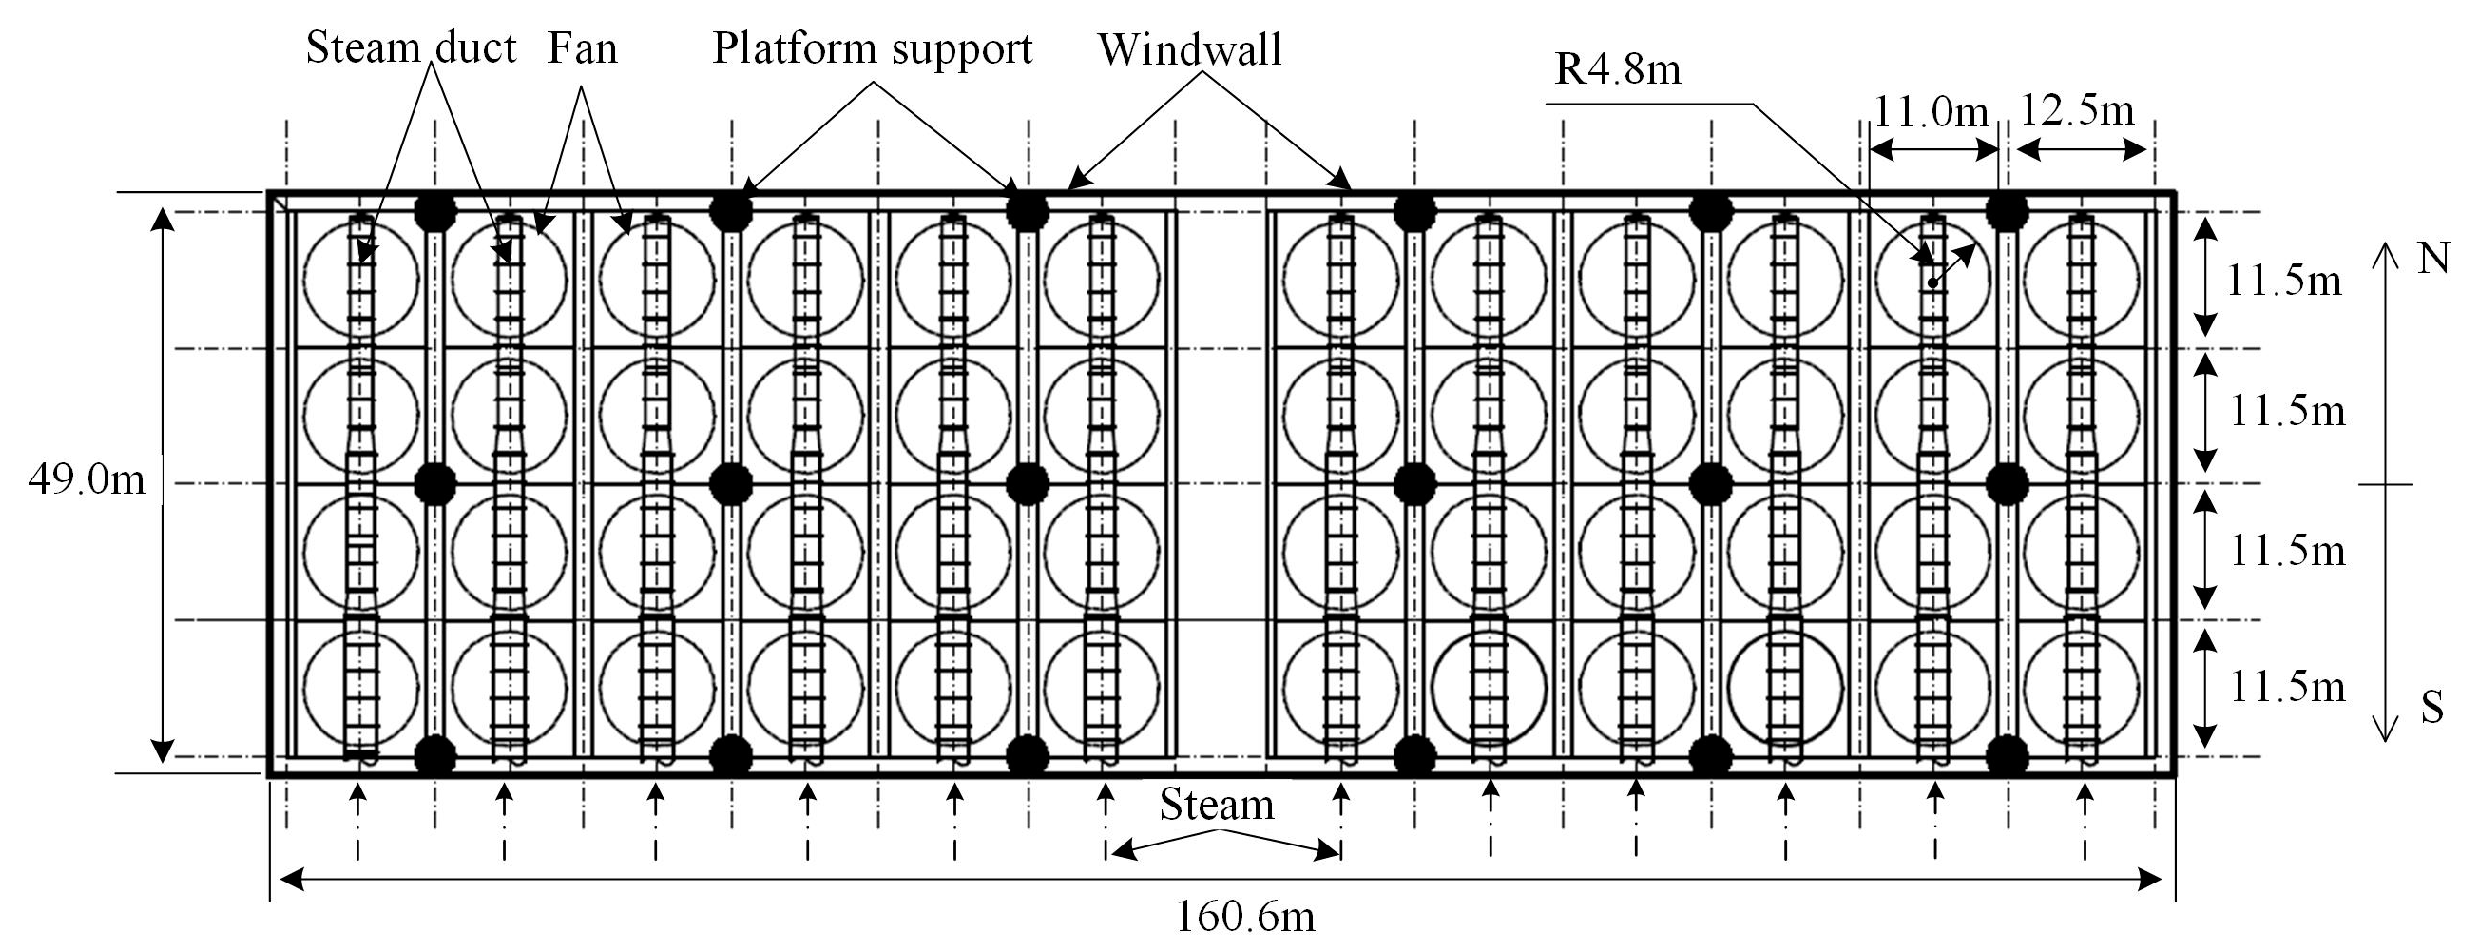
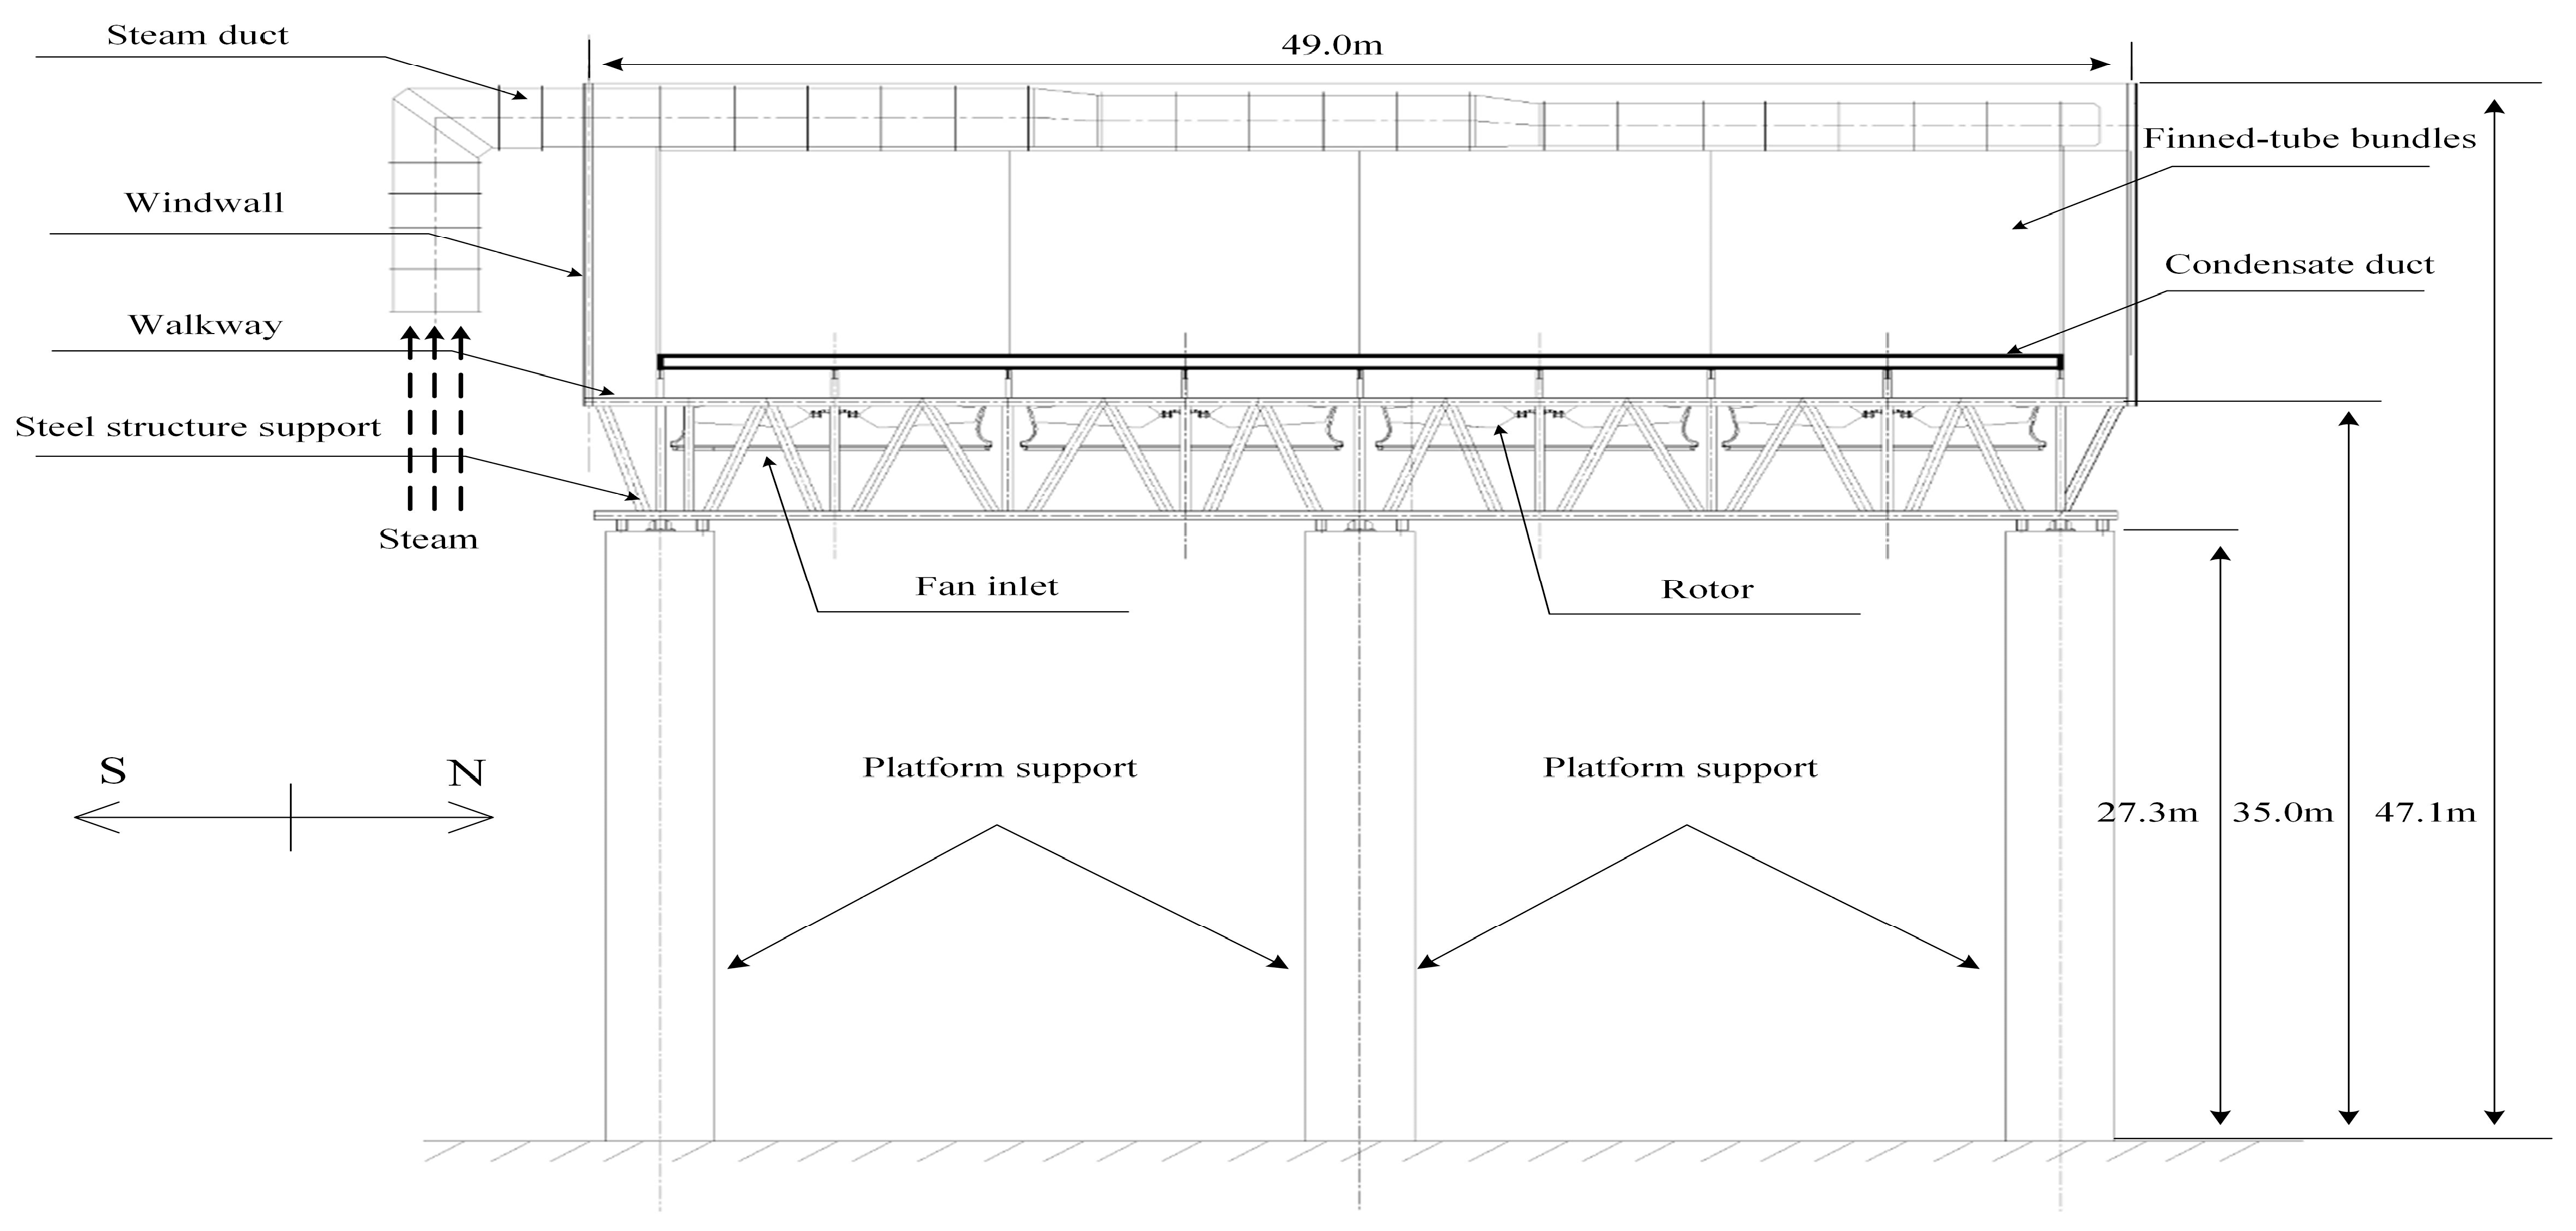
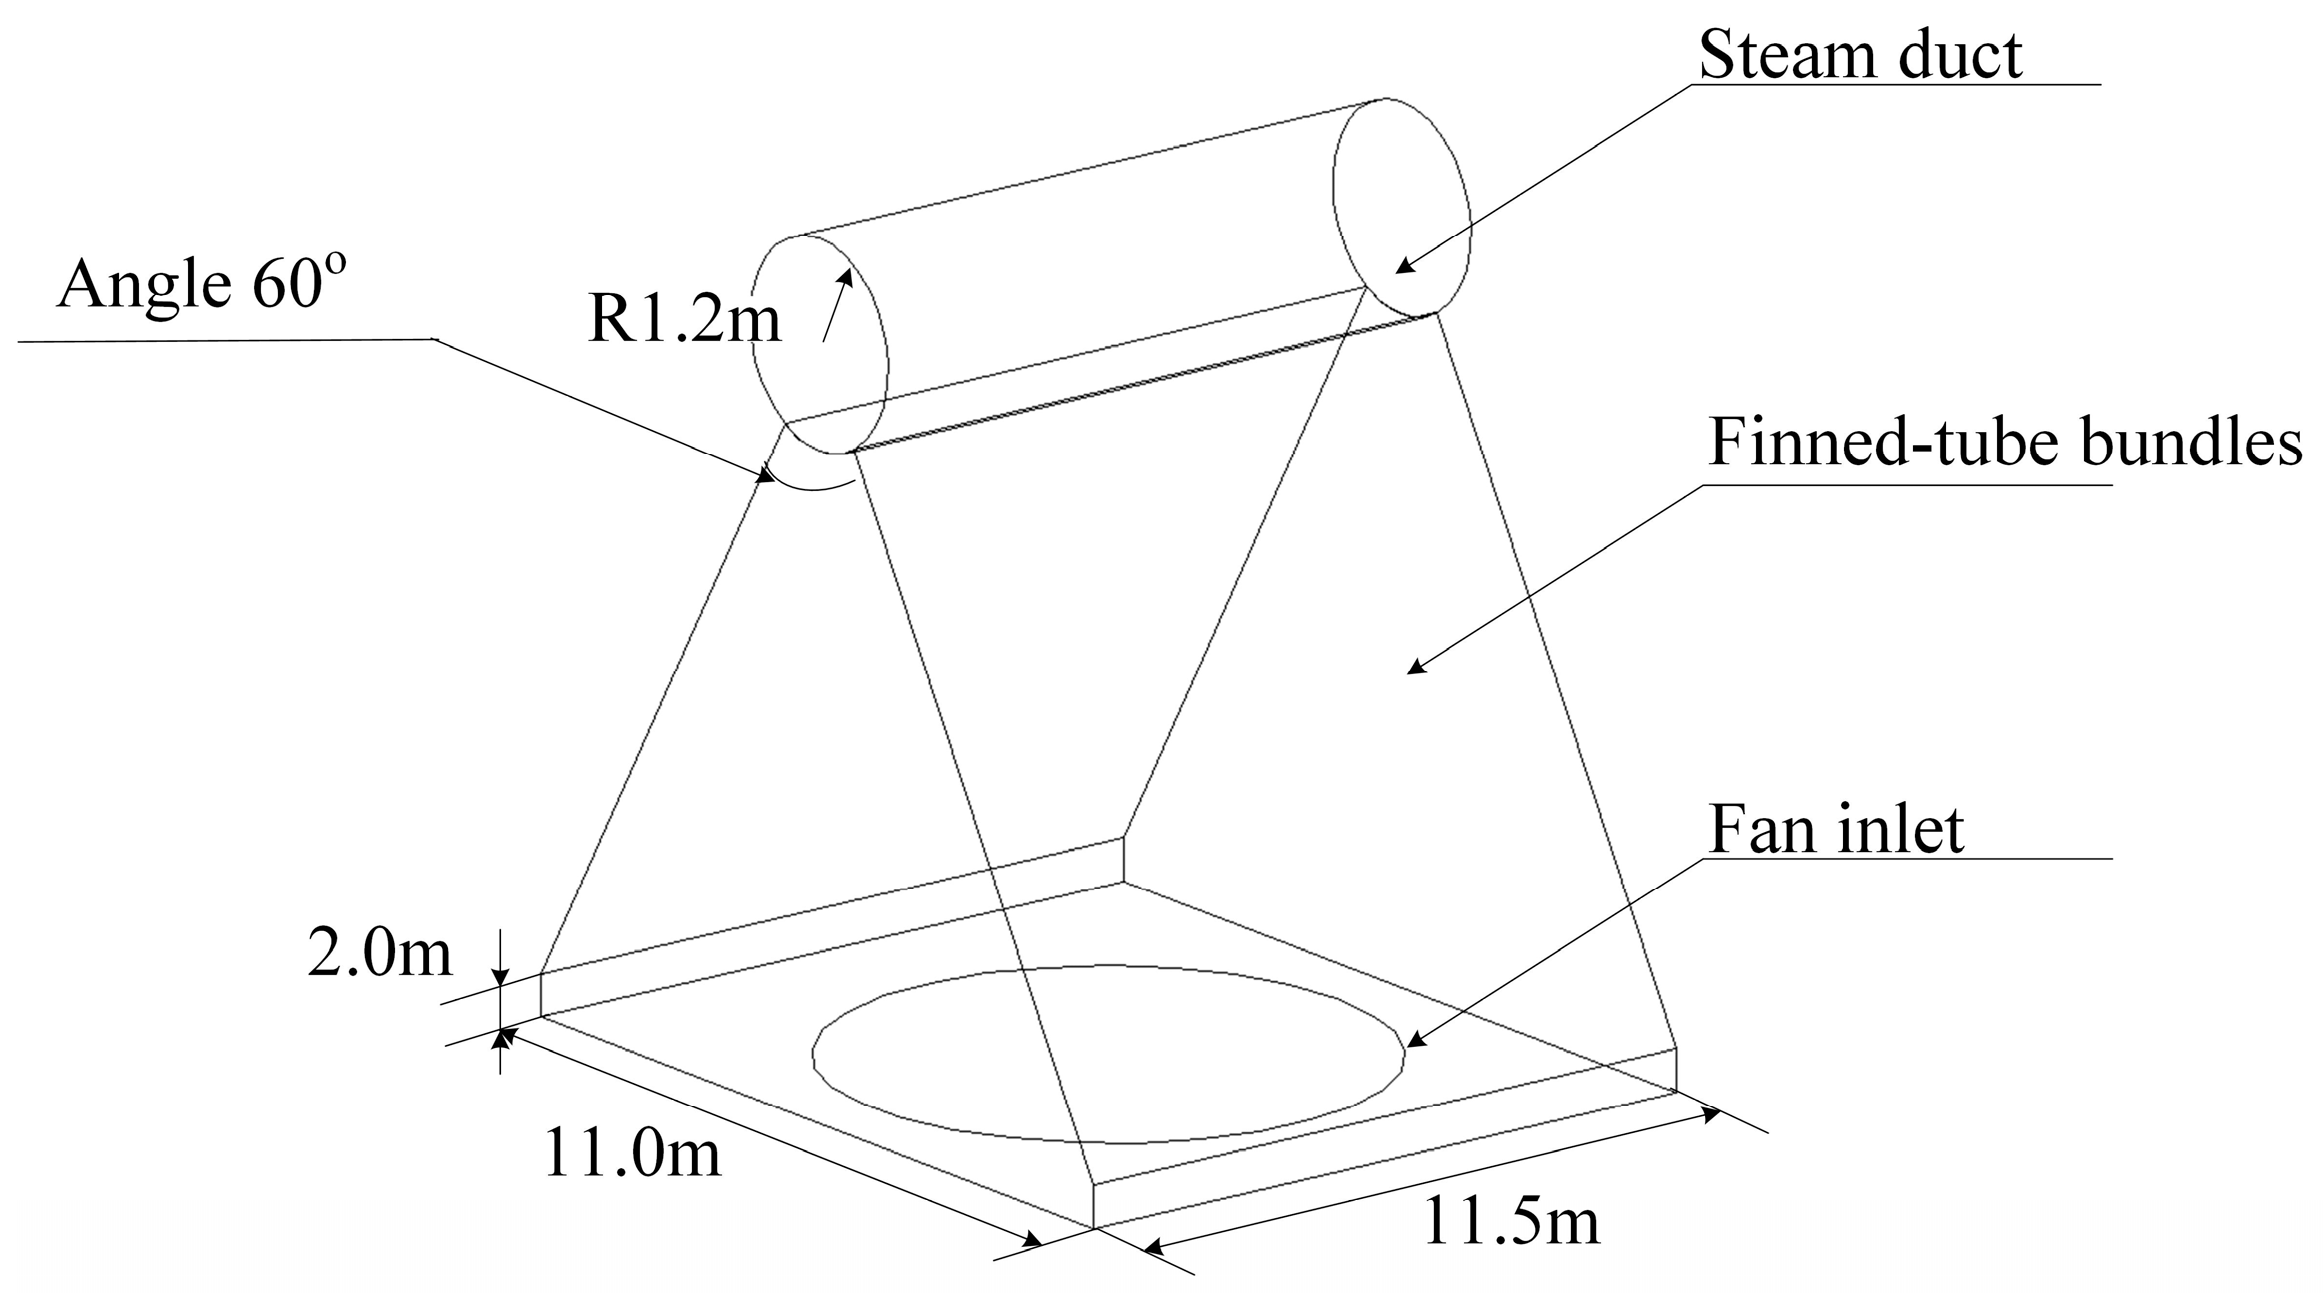
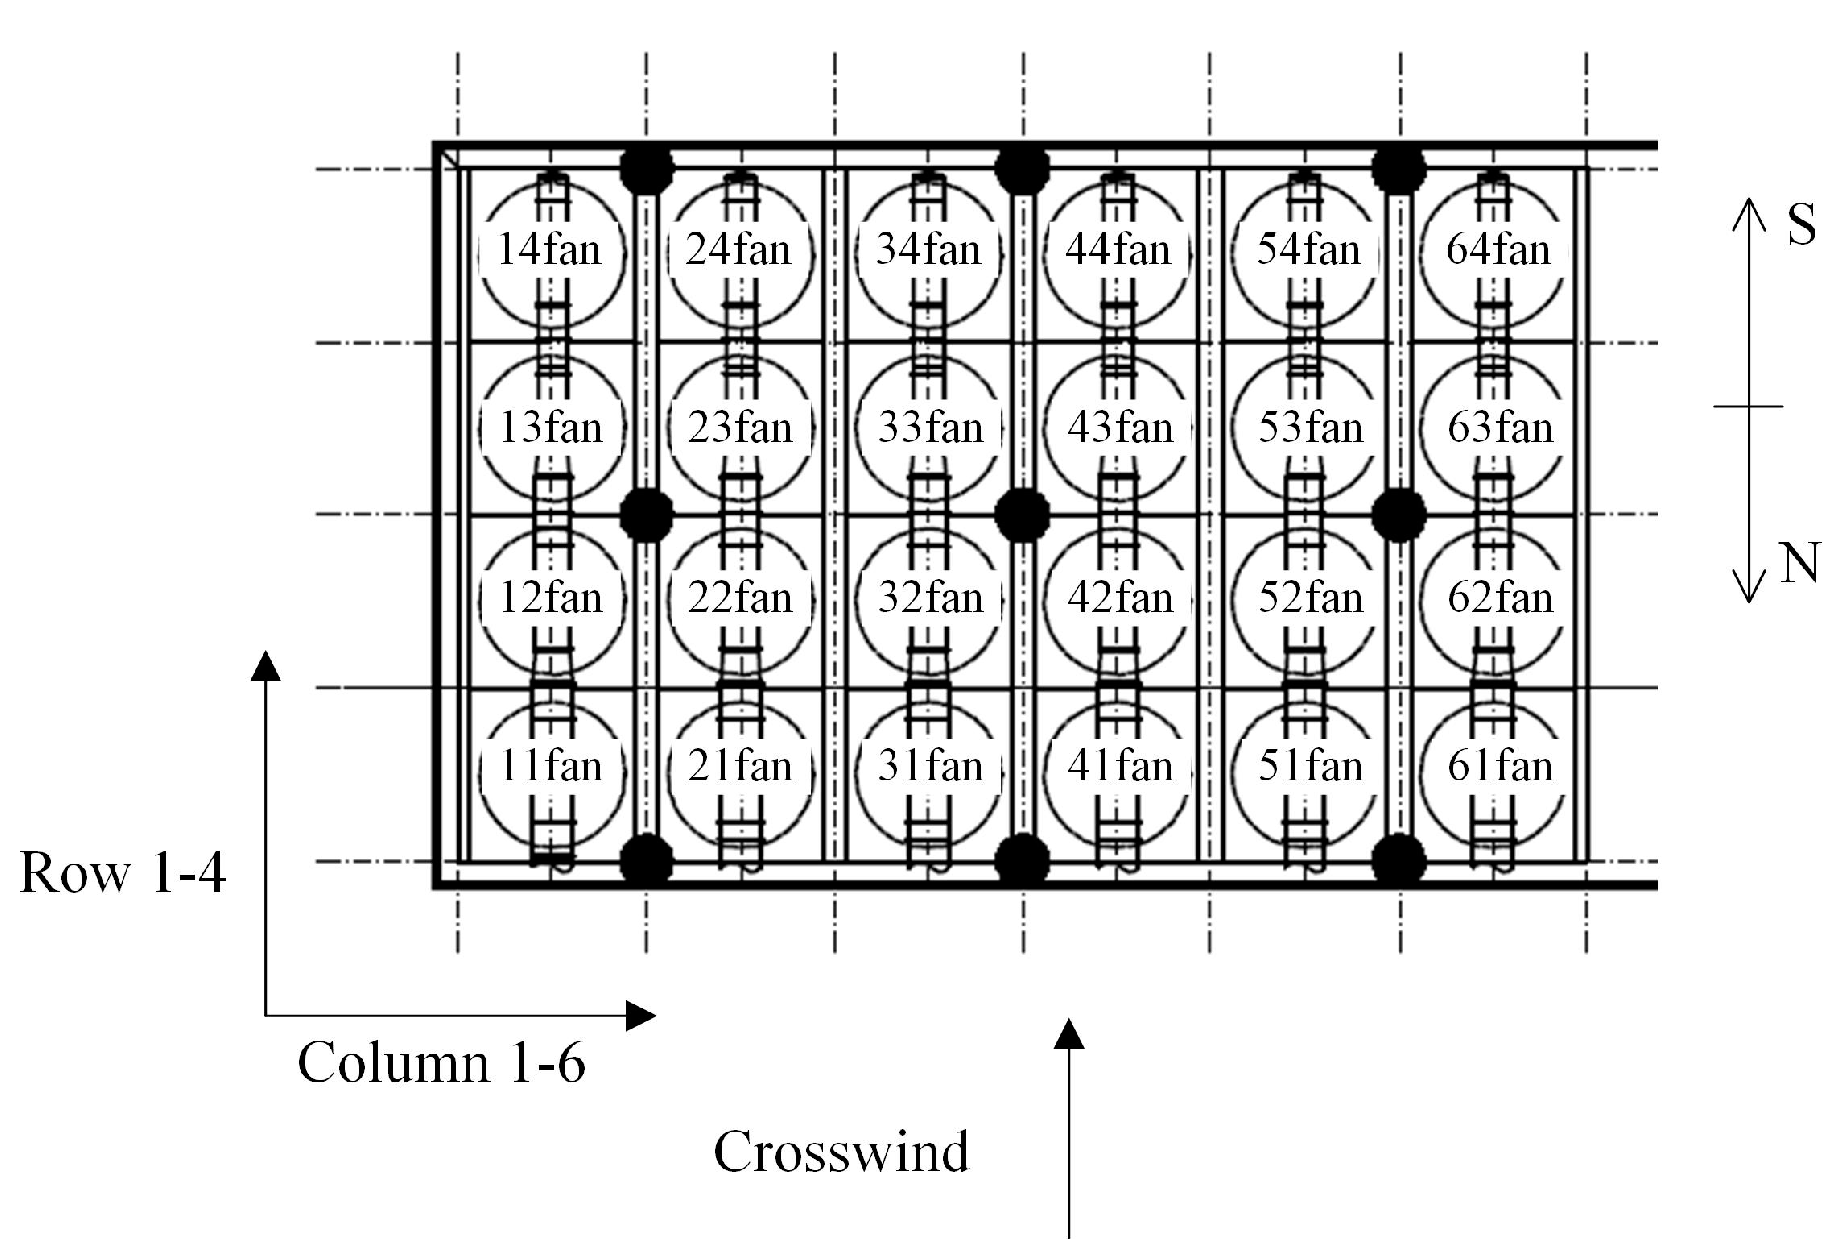
2.1. Geometric Model

Figure 1 and Figure 2 show the top and side views of the DACC. The direct air-cooled system had a total of 48 air-cooled units in 4 rows and 12 columns. There were 12 steam ducts at the top of the air-cooling unit. The steam entered from the inlet at the south end and flowed northward along the steam duct. The diameter of the steam duct was divided into three sections, and the diameter decreased from south to north. The inlet radius of the fan at the bottom of the air-cooling unit was 4.8 m, and the air-cooling unit was 11.5 m long and 11 m wide. The direct air-cooling system was 49 m wide and 160.6 m long. It was supported by 18 platform supports with a height 35.0 m. The columns of the air-cooled units were separated by a walkway, surrounded by 12.1 m high wind walls.
To simplify the numerical model of the DACC, the steel structure support in the air-cooled system was neglected. The axial fans and finned-tube bundles in the air-cooled units were simplified to a surface. Different diameters of steam duct were unified into one diameter, and the specific dimensions are shown in Figure 3.

2.2. Governing Equations

The steady Reynolds-Averaged Navier–Stokes equations (RANS) were used in this study. The governing equations of the mass, momentum, and energy conservation were obtained as follows [13,25].
u i x i = 0
x j ( ρ u i u j ) = x j [ μ e f f ( u i x j + u j x i ) 2 3 δ i j ρ k ] p x i
x i [ u i ( ρ e + p ) ] = x i [ k e f f T x i + u j ( τ i j ) e f f ] + S h
where u i represents component velocity in direction x i , p represents the pressure, μ e f f represents the effective dynamic viscosity, and μ e f f = μ + μ t , e represents the specific energy, τ e f f and k e f f represent the stress tensor and effective thermal conductivity, respectively, Sh represents the heat source, namely the heat dissipation per volume of finned-tube radiators, T represents the temperature.
The 3-D computations were carried out by using the S-A models, and the turbulent kinetic energy is neglected in the S-A model. The Spalart–Allmaras turbulent model [25] was obtained as follows:
x i ( ρ v ˜ u i ) = G v + 1 σ v ˜ { x j [ ( μ + ρ v ˜ ) v ˜ x j ] + C b 2 ρ v ˜ x j v ˜ x j } Y v
μ t = ρ v ˜ f v 1 ,   f v 1 = χ 3 χ 3 + C v 1 3 ,   χ v ˜ v
G v = C b 1 ρ S ˜ v ˜ ,   S ˜ S + v ˜ κ 2 d 2 f v 2 ,   f v 2 = 1 χ 1 + χ f v 1
S 2 Ω i j Ω i j ,   Ω i j = 1 2 ( u i x j u j x i )
Y v = C w 1 ρ f w ( v ˜ d ) 2 ,   f w = g ( 1 + C w 3 6 g 6 + C w 3 6 ) 1 / 6 ,   g = r + C w 2 ( r 6 r ) ,   r = v ˜ S ˜ κ 2 d 2
where v represents the kinematic molecular viscosity, v ˜ represents the working variable of the turbulence model, μ t represents the turbulent viscosity coefficient, f v 1 represents the viscosity damping coefficient, S ˜ represents the modified vorticity, S represents the magnitude of the vorticity.
The empirical constants are set to:
C b 1 = 0.1335 , C b 2 = 0.622 , σ v ˜ = 2 / 3 , C v 1 = 7.1 , C w 1 = C b 1 / κ 2 + ( 1 + C b 2 ) / σ v ˜ , C w 2 = 0.3 , C w 3 = 2.0 , and κ = 0.4187 .

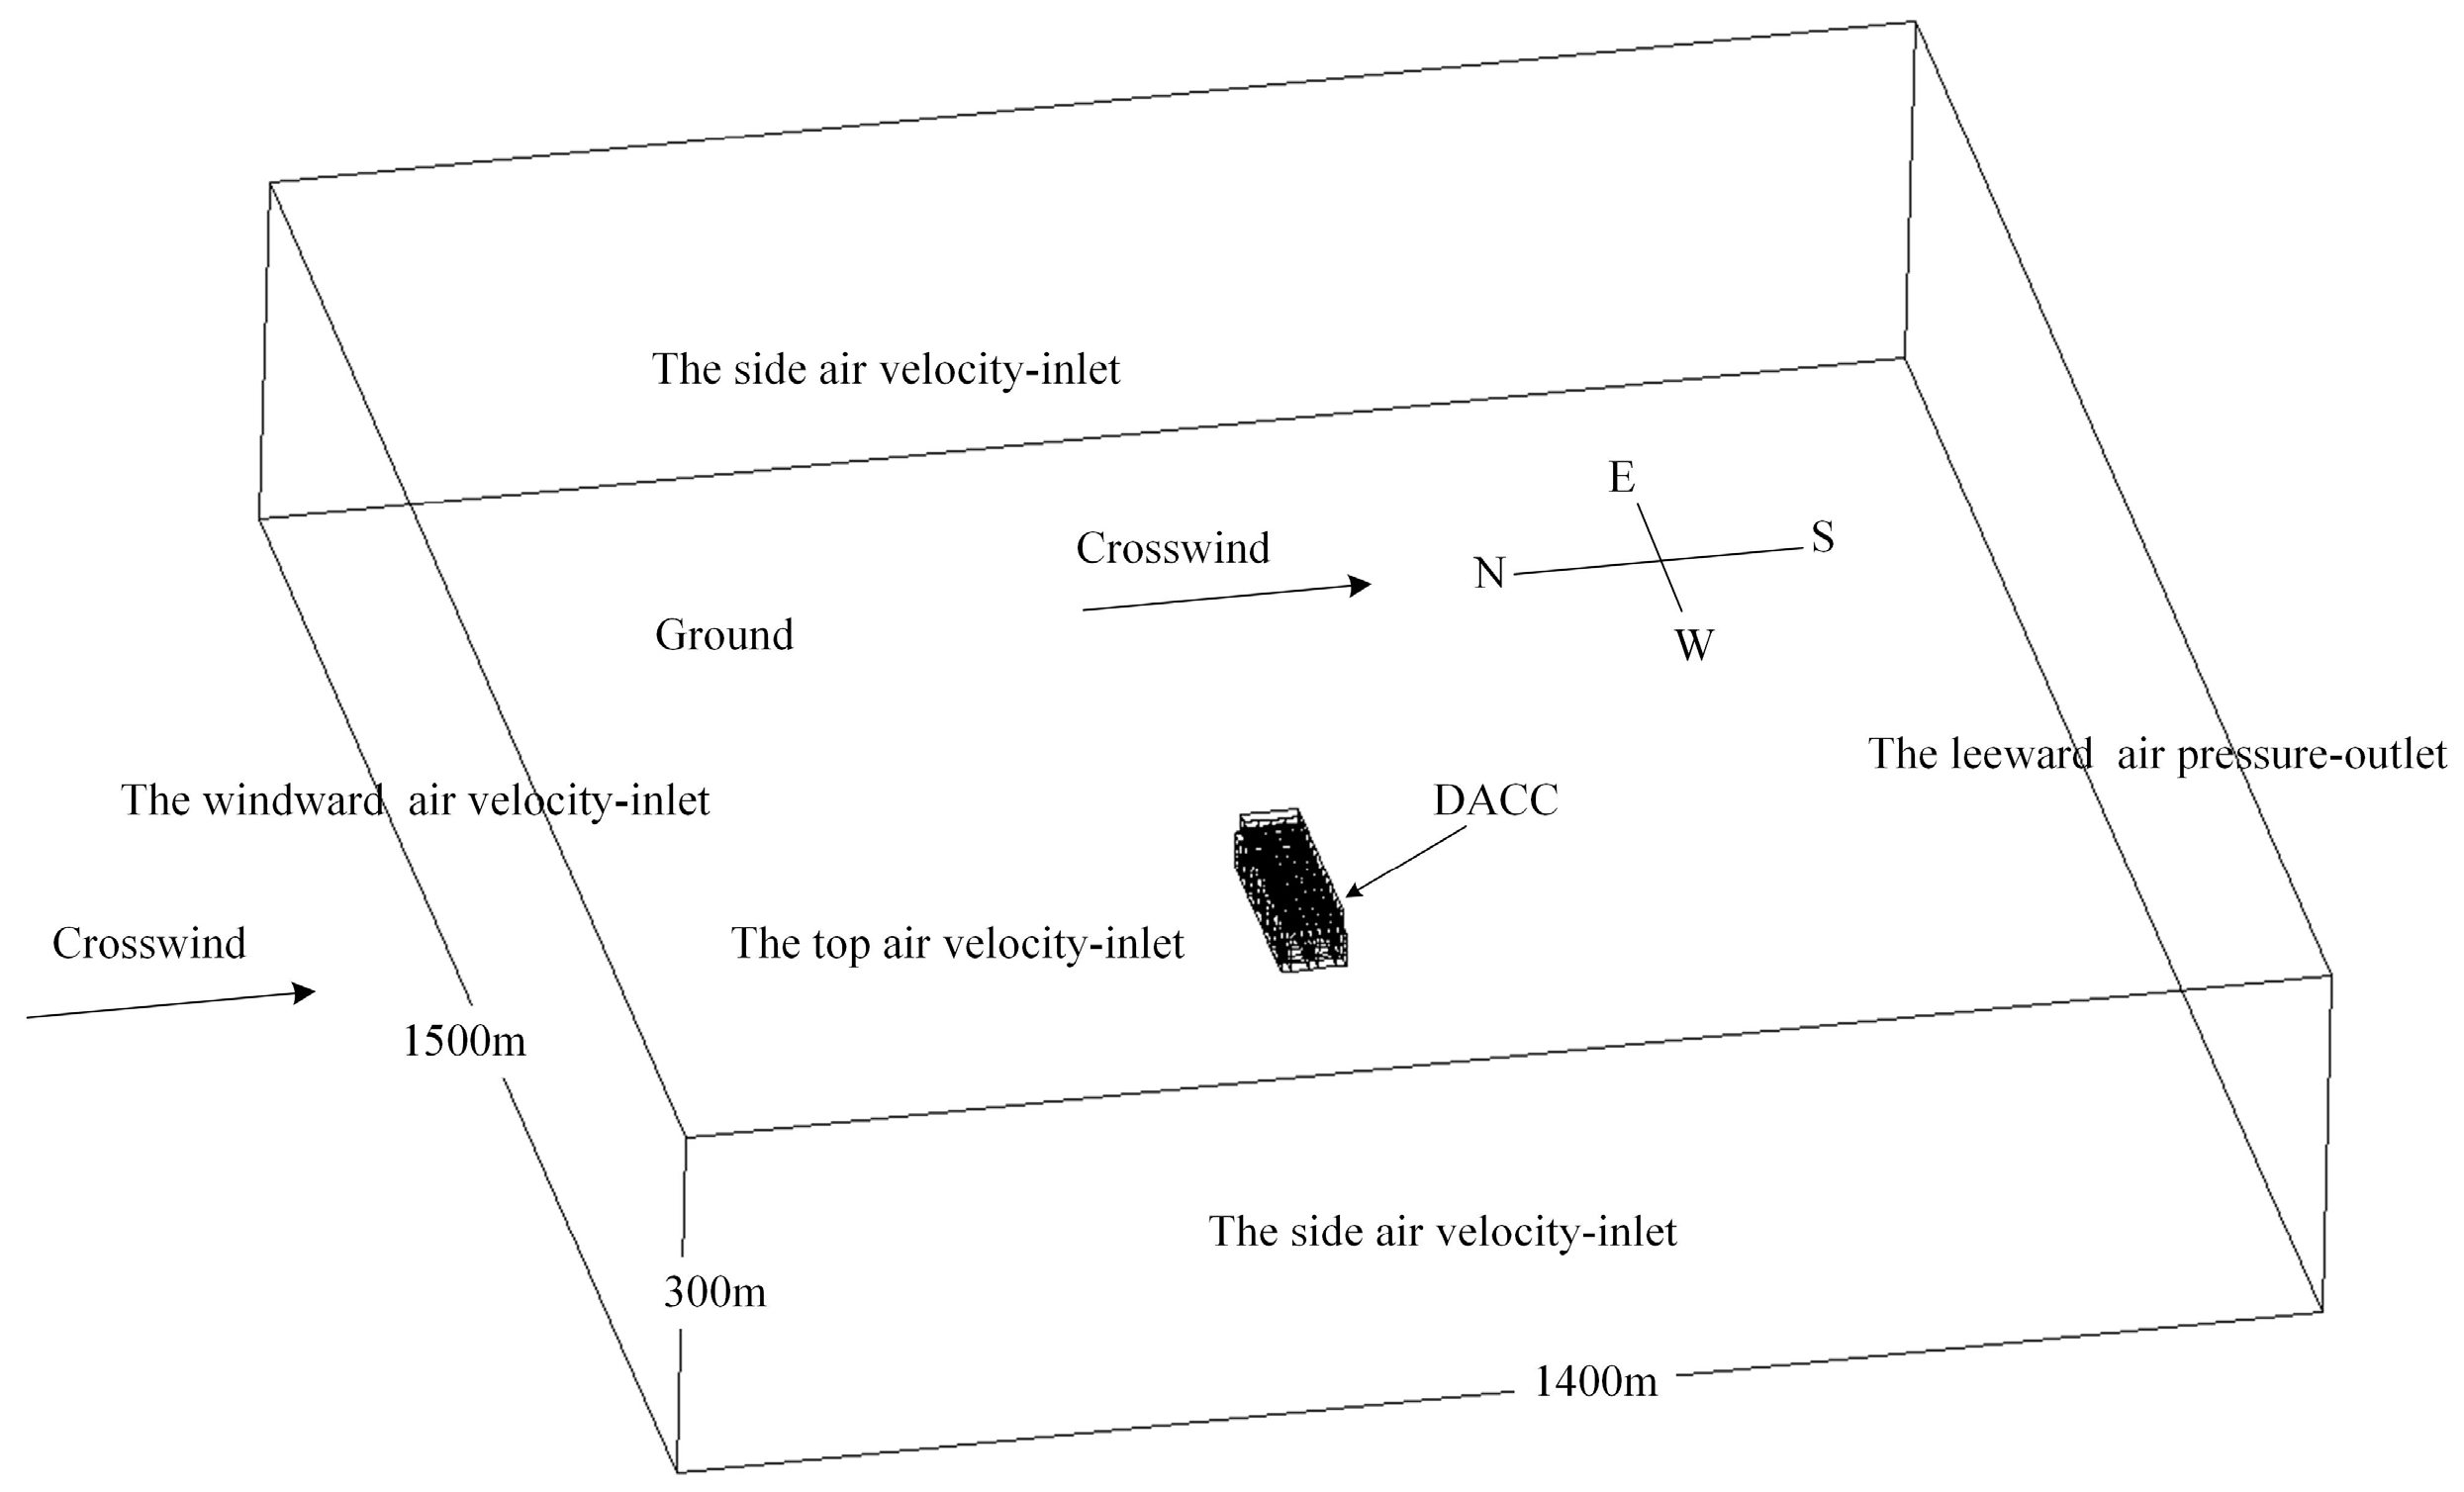
2.3. Boundary Conditions

The boundary condition in this numerical study is shown in Figure 4. The calculation domain of the DACC was 1500 m × 1400 m × 300 m. Specifically, the calculation domain was 1500 m in length, 1400 m in width, and 300 m in height. Compared with the studied DACC, the calculation domain should be large enough, and the calculation domain was 9.4 times as long, 28.6 times as wide, and 6.4 times as high as the studied DACC. The windward, top, and both sides boundaries were set as velocity-inlet, where the temperature of inlet airflow was equal to the ambient temperature. The ground was set as wall. The leeward boundary of the calculation domain was set as pressure-outlet, where the gauge pressure was set to 0 and the backflow direction specification method in FLUENT was set from the neighboring cell.
At the velocity inlets for air, the inlet ambient wind uc was set as follows:
u c = u 0 ( z 10 ) α
where uc represents the crosswind velocity at a high position 10 m above the ground, z represents the height, α represents ambient wind speed profile index, α = 0.2. The component velocity of two other axis directions are 0 m·s−1.
The platform support shell, the wind wall shell, and ground were considered adiabatic. The axial fans in the air-cooled unit were set as fan boundary condition, where the pressure jump of fans was fitted as polynomial of axial velocity of airflow. The finned-tube bundles in the DACC were set to radiator boundary condition, where the heat flux of finned-tube bundles was set according to the heat load of steam entering the DACC. The atmospheric pressure of 1.02 × 10⁵ Pa and relative humidity of 63% were selected for this simulation by consulting weather data. The second-order upwind discretization scheme was adopted in governing equations, which was discretized using the pressure staggering option (PRESTO!) discretization scheme.
Specifically, in the DACC, the fan in the cooling unit was an axial fan, as shown in Figure 1 and Figure 2. The flow field characteristics of the fan was not the focus in this study. In order to simplify the numerical model, the axial fan was set to fan boundary condition. The pressure jump of fan Δpfan was fitted as the polynomial form, which was expressed in Equation (10):
Δ p f a n = n = 1 N f n u z n 1
where fn is the polynomial coefficient, which was obtained in Table 1 [13,16].
The finned-tube radiators in the DACC was set to radiator boundary condition. In the radiator boundary condition, pressure drop of air Δ p across the finned-tube bundles was set as follows:
Δ p = 1 2 k L ρ u 2
where u represents the normal velocity of the radiator surface, k L represents the loss coefficient and is fitted as the polynomial form.
k L = n = 1 N r n u n 1
Here, r n represents the polynomial coefficient, and the values of r n are shown in Table 2 [13,16].
The heat flux q of finned-tube bundles was obtained:
q = h λ ( T s T a )
h λ = n = 1 N h n u n 1
where Ts represents the exhaust steam temperature in the DACC; if the wall conduction heat resistance and condensation heat resistance are neglected, Ts is approximately equal to the finned-tube bundles’ wall temperature. Ta represents the ambient temperature.
h λ represents the heat transfer coefficient, and the values of h n were set as in Table 3 [13,16].
For one 350 MW power plant unit, the exhaust steam flow of the turbine was 595.8 t·h−1 and the exhaust pressure was 4.9 kPa in the turbine heat acceptance working condition, and then the total heat dissipation of DACC Q was obtained, Q =2 × 4.01 × 108 J·s−1. The surface area of finned-tube bundles A had been determined at the time of design, A = 11841m2. The heat flux q was calculated by Equation (15).
q = Q A

2.4. Grid Independence Verification and Check of the Convergence
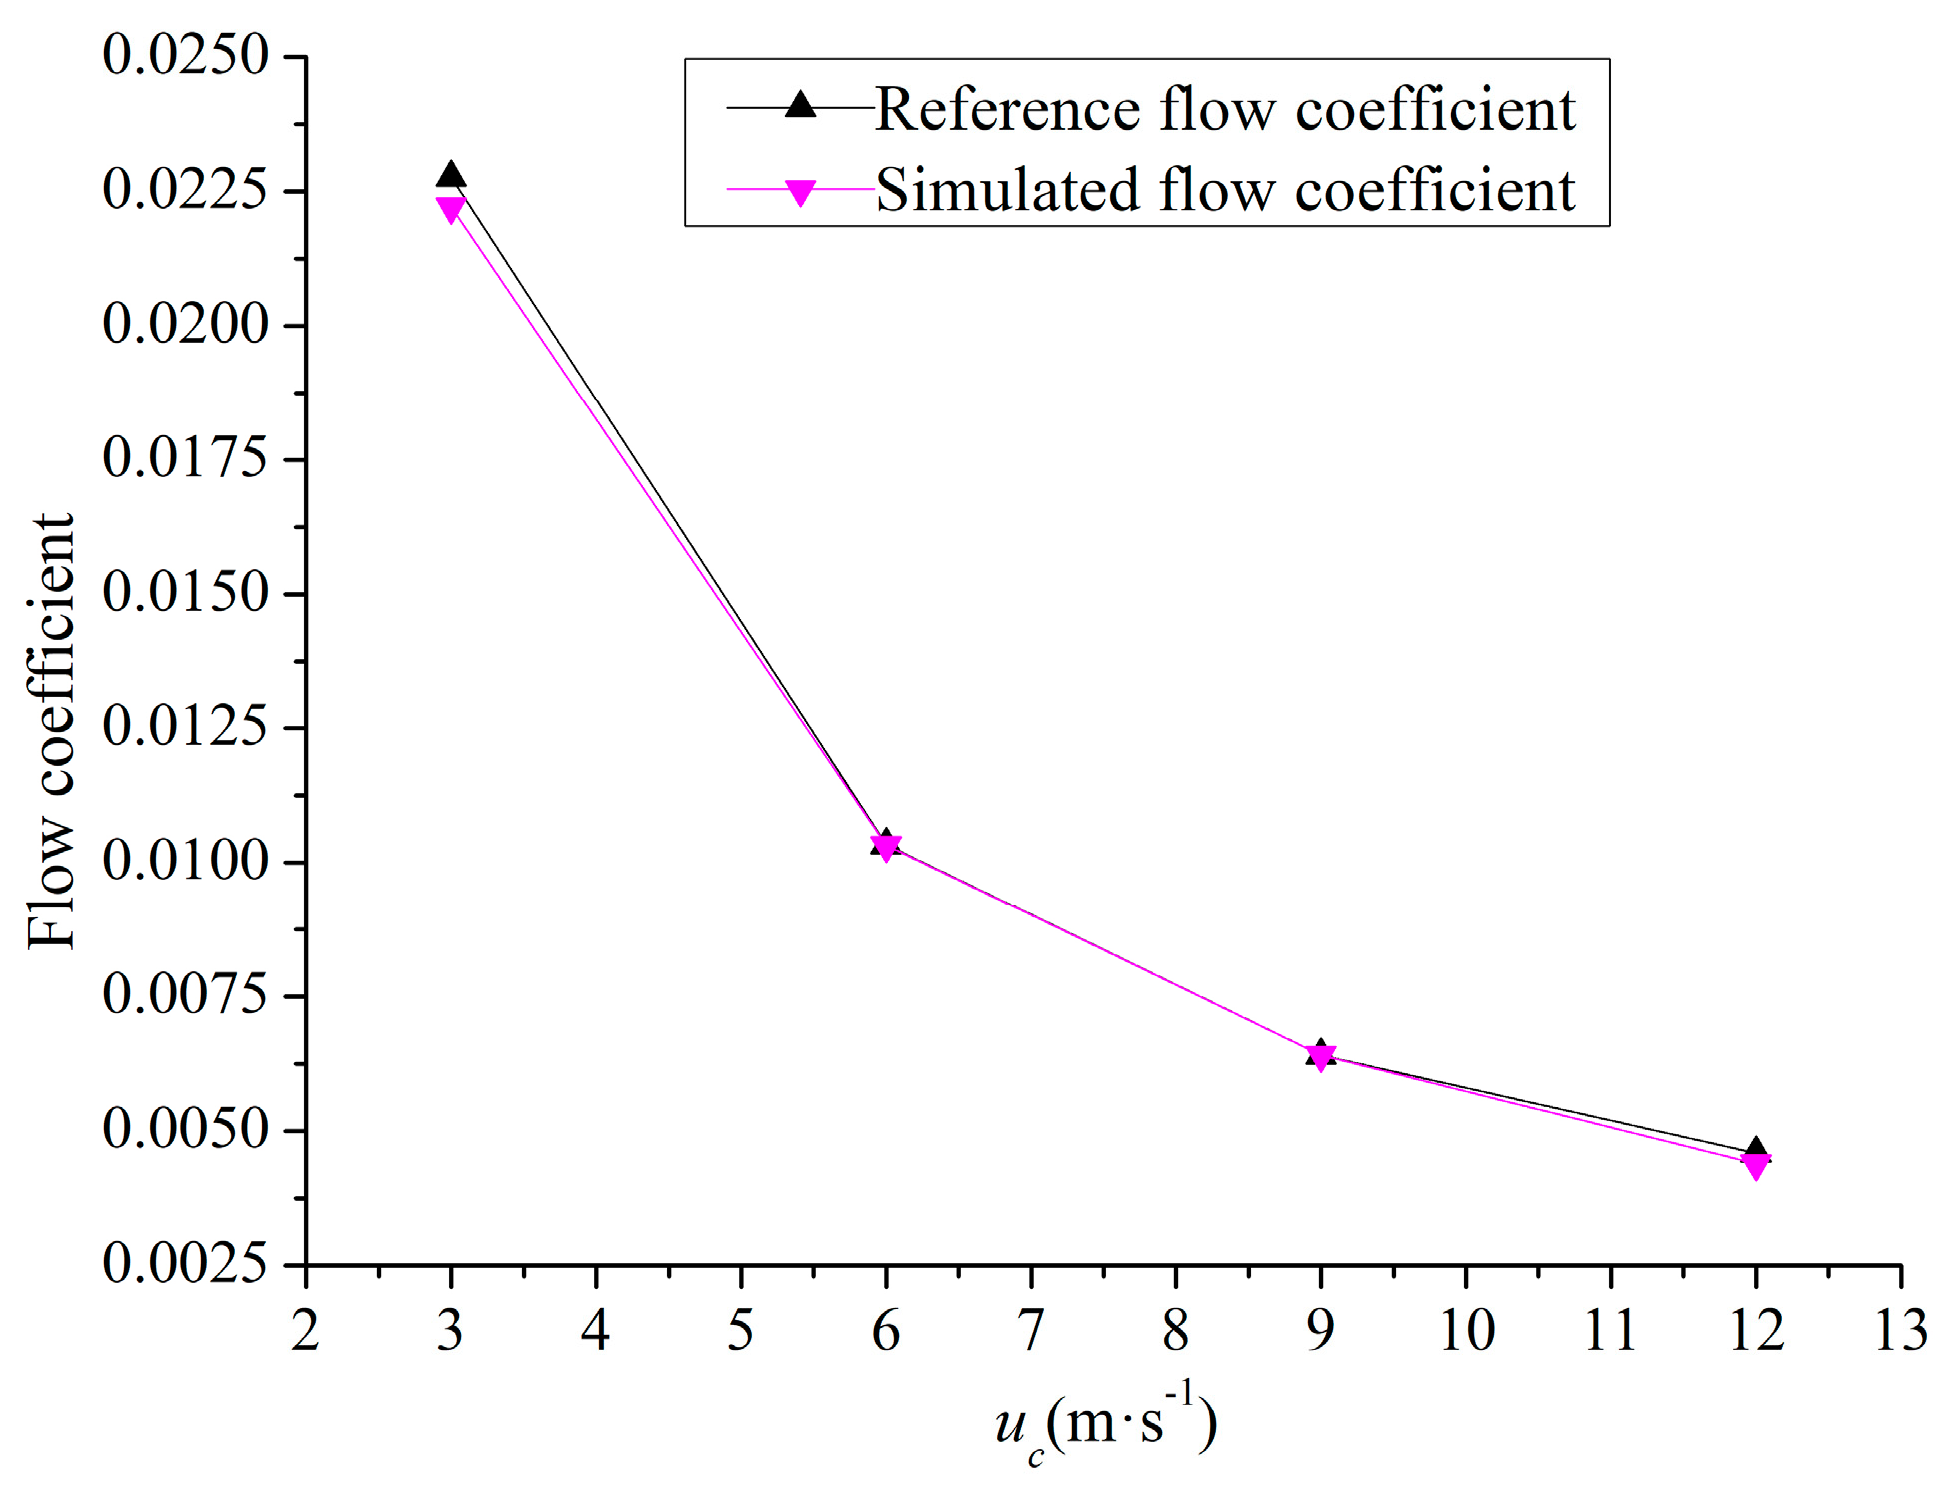
In this study, the calculation domain of the DACC was 1500 m × 1400 m × 300 m. Because the applicability of tetrahedral unstructured cells was better, the air-cooled units and the space between the air-cooled units were meshed with tetrahedral unstructured cells. The other calculation domain was meshed with hexahedral structured cells. The grid configuration of the DACC is shown in Figure 5.
In order to verify the grid independence of the numerical model, four different grid numbers, 2.57 × 10⁶, 4.16 × 10⁶, 5.05 × 10⁶, and 6.78 × 10⁶, were selected for numerical simulation. The inlet air flow rate of each fan under four different grid numbers was obtained, as shown in Figure 6. After the number of grids reached 5.05 × 10⁶, increasing the number of grids had little effect on the numerical results. To save calculation time while ensuring calculation accuracy, finally, the numerical model selected 5.05 × 10⁶ cells to simulate the effect of crosswind on frozen phenomena in the DACC.
In this study, the residual values of the energy were less than 10−6, the residual values of the continuity were less than 10−4, and the residual values of other evaluation parameters were less than 10−4. Meanwhile, the inlet flow rate of the fan did not change with the increase of iteration. At this time, the numerical calculation was considered to have converged.

2.5. Validation

Because this numerical study was the preliminary research work of a 2 × 350 MW DACC, the direct air-cooling coal-fired units project had not been formally constructed yet. Therefore, comparing with the numerical model of the published paper, in this study, Yang’s [14] paper was selected for comparative verification. In Yang’s paper, the results of numerical calculation were verified by comparing with the experimental results. It was found that the simulation results and the experimental results agreed with each other. These comparative verifications were sufficient to show that the numerical model of Yang was accurate. However, the numerical calculation model in this study and Yang’s calculation model were different in geometric dimensions and boundary conditions. Hence the accuracy of numerical results was achieved by comparing nondimensional flow coefficient of the DACC as whole with numerical simulation data of Yang’s. It can be seen from Figure 7 that four different crosswind speeds of 3 m·s−1, 6 m·s−1, 9 m·s−1, and 12 m·s−1 were selected, and the nondimensional flow coefficients of the DACC were calculated and compared at different numerical models. The results of the two different numerical models agreed with each other. The numerical model in this study had a certain accuracy as the preliminary research model of the air-cooling project.

3. Results and Discussion

The crosswind has great effect on the thermal-flow performances of DACCs. The reason for the frozen phenomena in the finned-tube radiators of the DACC is that when the ambient temperature is too low, the heat dissipation capacity of finned-tube radiators will increase. When the surface temperature of the finned-tube radiator is lower than the freezing point, the frozen phenomena will be formed. Crosswind is closely related to the heat dissipation capacity of the DACC. Therefore, there is a close relationship between frozen phenomena and crosswind. The average crosswind speed obtained from the Inner Mongolia Meteorological weather station in winter is about 4.2 m·s−1, and maximum extreme wind velocity is about 30 m·s−1. In this study, four crosswind velocities uc were selected to analyze the effect of crosswind on frozen phenomena. The direction of crosswind and the numerical values of velocity are shown in the Table 4 and Figure 4. Winter temperatures in Inner Mongolia range from approximately 243.15 K to 263.15 K and the ambient temperature 253.15 K was selected in this study.

3.1. Variation of Airflow Rate under Crosswind Conditions

The airflow rate of the air-cooled unit is closely related to the cooling capacity of the DACC. Hence, it is necessary to analyze the variation of airflow rate under different crosswind velocities. Every fan was numbered in Figure 8. Considering the symmetry of two direct air-cooled systems, only one DACC was selected as the research object to reduce unnecessary workload.
The variation of airflow rate was analyzed at different crosswind velocities of 4 m·s−1, 12 m·s−1, 20 m·s−1, and 28 m·s−1, as shown in Figure 9. For easy analysis, the same horizontal coordinate was adopted, and the ordinate coordinates were appropriate to the value of airflow rate under crosswind conditions. For the air-cooled units in columns 1, 2, 3, 4, and 5, the maximum airflow rate of fans appeared in row 4 with the crosswind velocity uc = 4 m·s−1 and uc = 12 m·s−1. In addition, when the crosswind velocity was 20 m·s−1 and 28 m·s−1, the maximum airflow rate appeared in row 4. Variation of airflow rate showed a similar law in columns 1, 2, 3, 4, and 5 under crosswind conditions. In addition, the airflow rate had a clear increasing trend along the crosswind direction. The maximum value of airflow rate appeared in row 4, and the minimum value of airflow rate appeared in row 1. However, compared with the other five columns, the rules of airflow rate showed a different trend along the crosswind direction in column 6. It was possible that the flow field in column 6 was affected by the adjacent air-cooled system. The maximum value of airflow rate appeared in column 1 row 4 at different crosswind velocities. When the crosswind velocity was lower than 12 m·s−1, the maximum value of airflow rate remained unchanged. When the crosswind velocity was greater than 12 m·s−1, the airflow rate gradually increased with the increase of crosswind velocity.

3.2. Variation of Inlet Air Temperature under Crosswind Conditions

Variation of the inlet air temperature of the fans is shown in Figure 10 under different crosswind conditions. The inlet air temperature decreased gradually along with the crosswind direction, and the minimum value appeared at the position of row 4 under four crosswind conditions. By analyzing the change curve of airflow rate in Figure 9, from column 1 to column 5, the maximum airflow rate also appeared in row 4 under crosswind conditions. Therefore, the frozen phenomena might occur in row 4. The minimum value of inlet air temperature appeared in column 2 row 4 with the crosswind velocity uc = 4 m·s−1. When the crosswind velocity was greater than 12 m·s−1, the minimum value of inlet air temperature of the fan appeared in column 1 row 4, and the minimum value decreased with the increase of crosswind velocity.

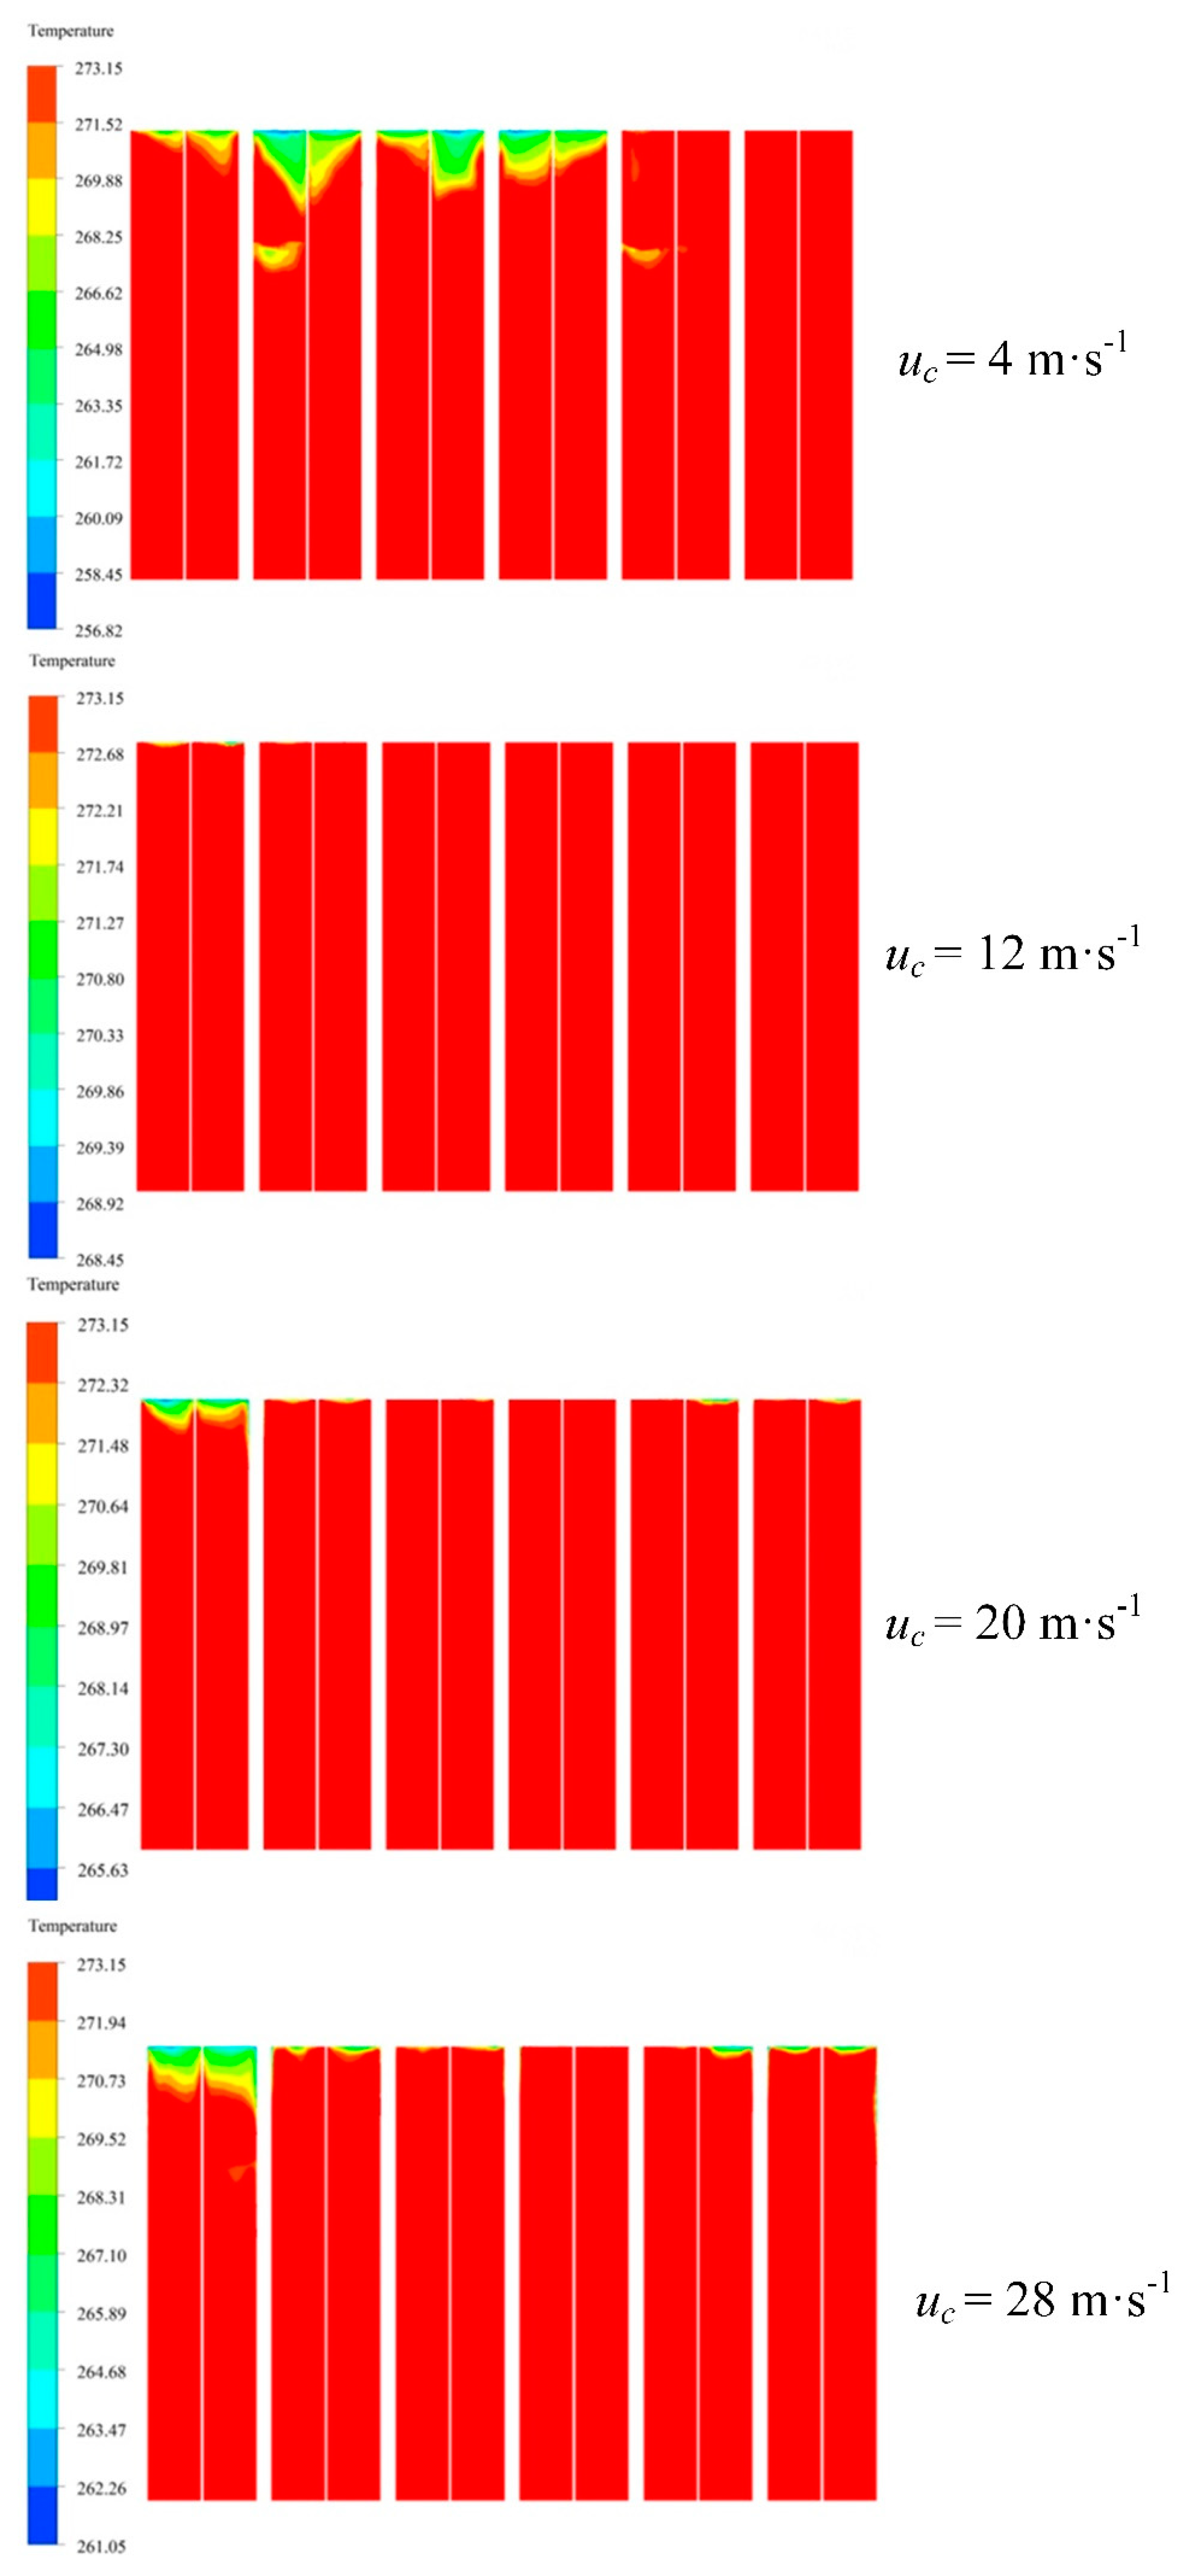
3.3. Temperature Contours of Finned-Tube Radiators

Through the above analysis, the frozen phenomena were most likely to appear in row 4. To verify this conjecture, the temperature contours of finned-tube radiators were selected at different wind speeds. In order to observe the frozen regions easily, 273.15 K as the freezing point of water was taken as the maximum temperature of the contour legend. In this way, we can clearly see which areas of the radiator surface had temperature below 273.15 K. The actual minimum temperature was set as the minimum temperature of the contour legend as shown in Figure 11. When the crosswind velocity was uc = 4 m·s−1, the number of air-cooled units was the largest in four crosswind velocities working conditions, with frozen phenomena appearing at columns 1, 2, 3, and 4, in row 4. In addition, two smaller frozen regions appeared at columns 2 and 5, in row 3. When crosswind velocity was 12 m·s−1, the whole air-cooling system had not been frozen and frozen phenomena did not occur on the surface of the finned-tube radiators except for the minimally frozen region at the edge of the air-cooled unit at column 1 in row 4.
Two working conditions of crosswind with uc = 4 m·s−1 and uc = 12 m·s−1 were mainly compared. According to Figure 9 and Figure 10, when the crosswind velocity was 4 m·s1, airflow rates in columns 1, 2, 3, 4, row 4, were 566 kg·s−1, 564 kg·s−1, 564 kg·s−1, and 559 kg·s−1, respectively. The inlet air temperatures were 270 K, 258 K, 260 K, and 260 K, respectively. The frozen area in column 2 was maximum. When the crosswind velocity was 12 m·s−1, the airflow rate in column 1, row 4 was 566 kg·s−1, and the inlet air temperature was 270 K. The frozen phenomena hardly occurred in column 1, row 4, as shown in Figure 11. However, when the crosswind velocity was 4m·s−1, the same location of the air-cooled unit had the same airflow rate and inlet air temperature, and the frozen region occupied a quarter of the area of the air-cooled unit radiator. For further analysis, the transverse section in column 1 row 4 was selected, as shown in Figure 12. Figure 13 shows the velocity vector of the transverse section. The crosswind direction was from left to right, and arrow A was the airflow direction entering the air-cooled unit. Arrow B was the airflow direction near the air-cooled unit inlet. The red circle was the range of vortex. Because two sides of the air-cooled unit were the partition walls, the smaller the included angle between the airflow and the horizontal plane, the greater the kinetic energy of the airflow loss. Compared with crosswind uc =4 m·s−1, the included angle between the airflow B2 and the horizontal plane was obviously smaller than the included angle of B1 at crosswind velocity uc =12 m·s−1 because the horizontal velocity of airflow B2 was larger than the horizontal velocity of B1. Supposing that the suction of the fan had the same value, the longitudinal velocity was the same or similar. The included angle between the airflow A2 and the horizontal plane was smaller than the included angle of A1, thus the energy of the inlet airflow loss is greater, and the range of vortex became larger when crosswind velocity was 12 m·s−1, as shown in Figure 13. The vortex was formed on the left side of the air-cooling unit, and then the part of the airflow on the left was unable to enter the heat dissipation tube, so the right side of the unit was more prone to freezing than the left. Thus, when airflow rate and inlet air temperature were the same, the increase of vortex could availably reduce the area of the frozen regions.
When crosswind velocity was 20 m·s−1, frozen regions mainly appeared in column 1 row 4, which occupied one-third of the air-cooled unit surface, as shown in Figure 11. When the crosswind velocity was 28 m·s−1, the location where the frozen region appeared was unchanged, but the area of the frozen region occupied half of the air-cooled unit surface. When crosswind velocity was 20 m·s−1, the airflow rate and inlet air temperature were 630 kg·s−1 and 263 K, respectively. The airflow rate and the inlet air temperature were 667 kg·s−1 and 261 K, respectively, at uc = 28 m·s−1. Observing the velocity vectors map of the transverse section at crosswind velocity uc = 28 m·s−1 and uc = 20 m·s−1, as shown in Figure 13, the velocity vectors distribution was similar, and the size of vortex was the same. Therefore, the key influencing factor became the airflow rate and the inlet air temperature of the air-cooled units under strong crosswind conditions.

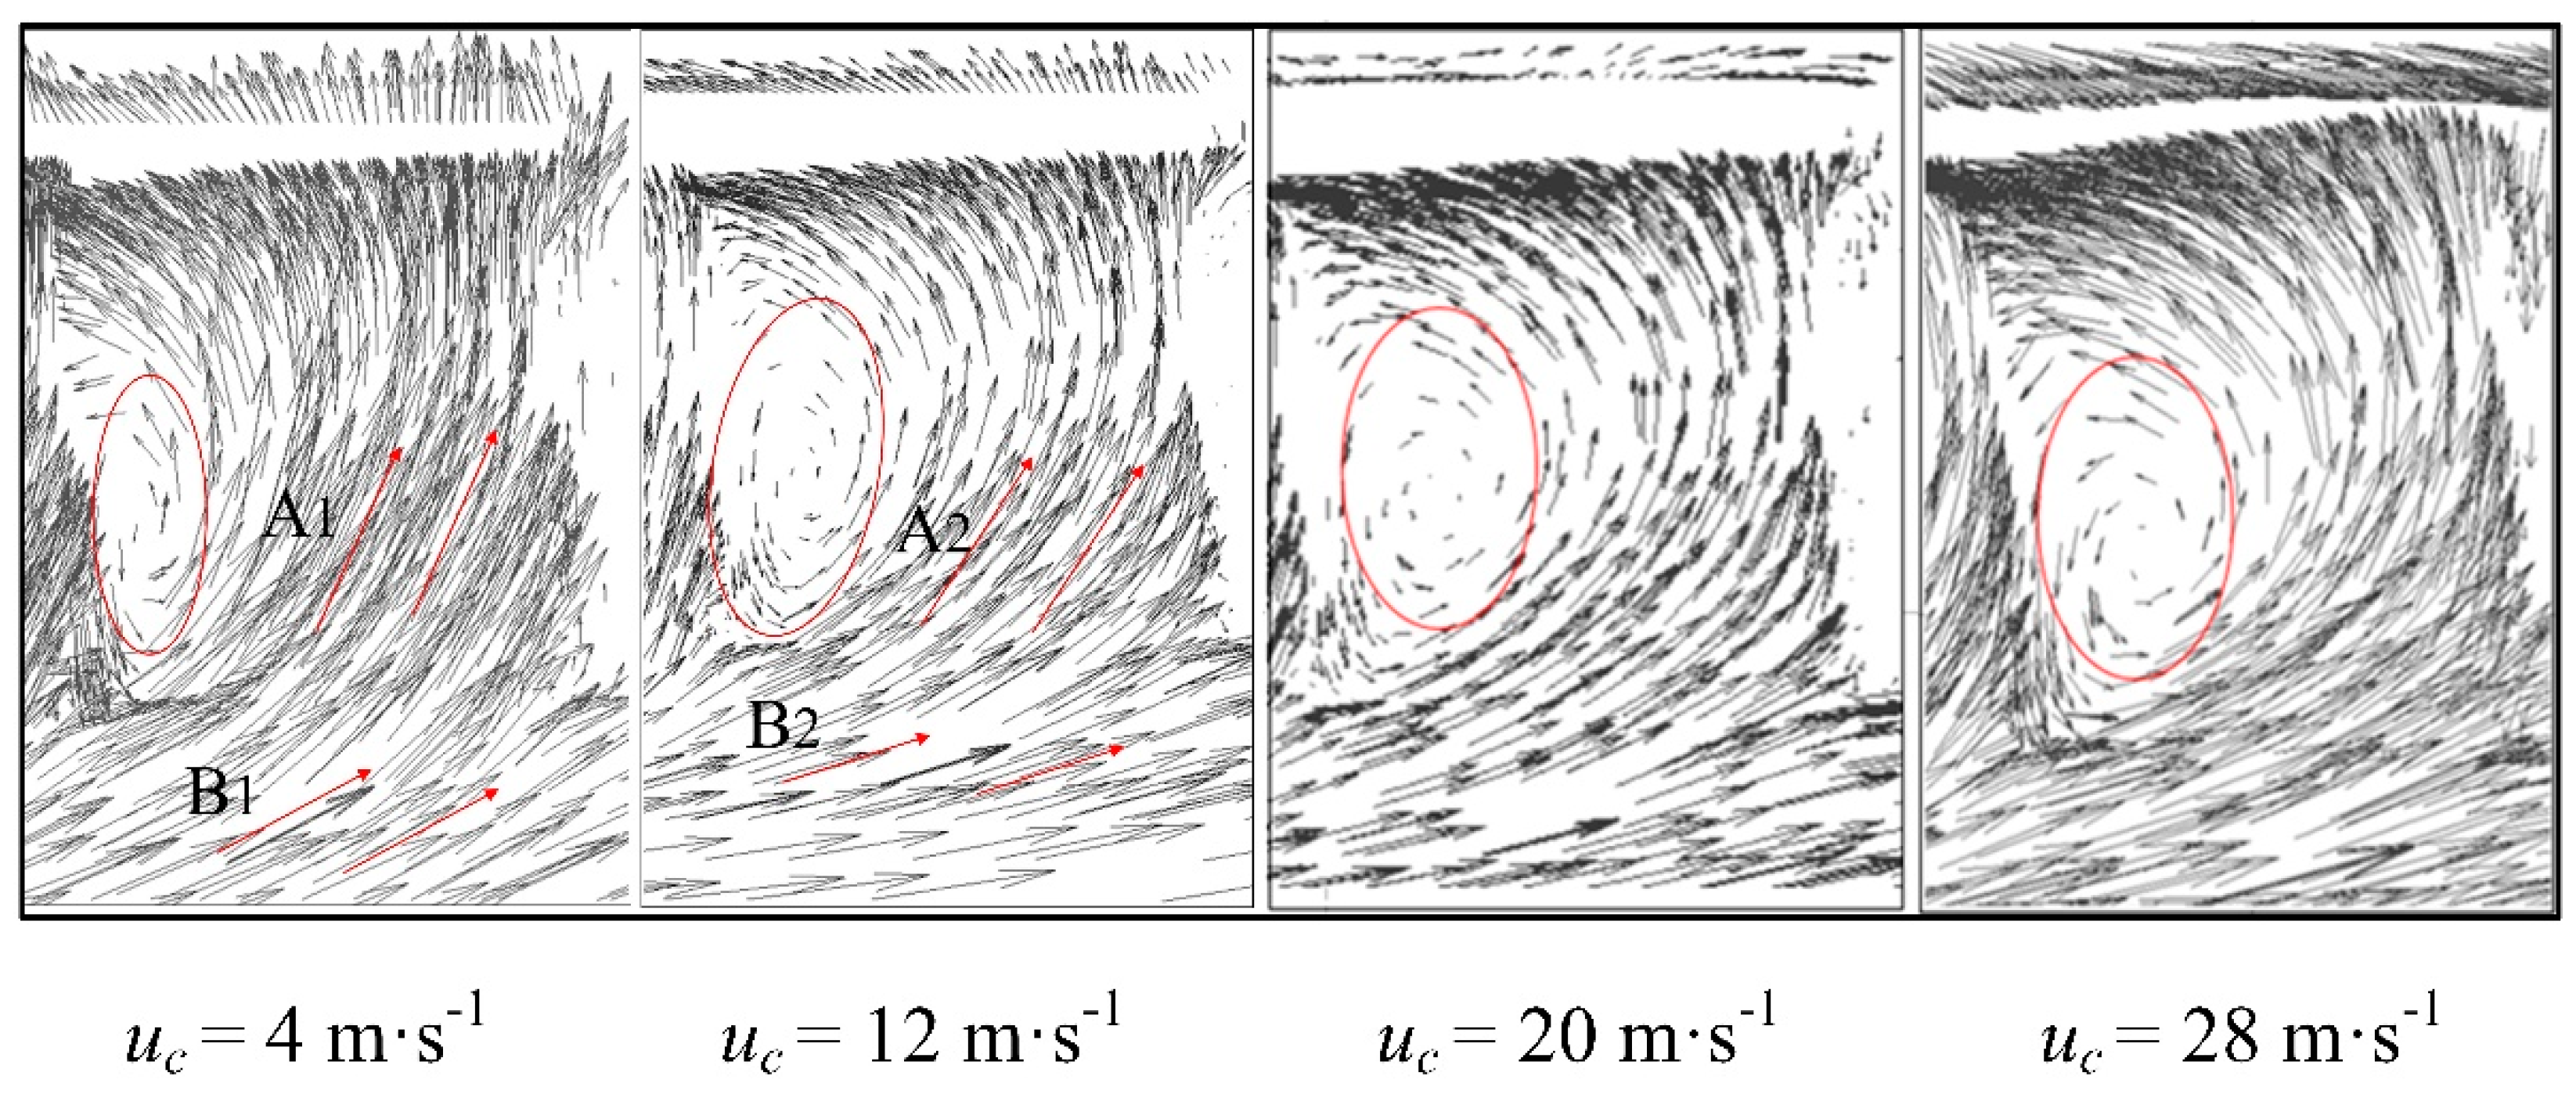
3.4. Flow Field Characteristics of Frozen Regions

The evolution rules of frozen regions of the DACC at four different crosswind velocities had been analyzed in detail. To further reveal the influence mechanism of crosswind on frozen phenomena, the vertical section in columns 1, 2, 3, 4, row 4 was selected as shown in Figure 14. The Z-section near the fan inlet and the negative direction of the Z-axis were the same as the direction of gravity. The location of the fans section was in the Z = 0 m section, and the Z = −1 m section was selected as the Z-section, near the fan inlet, as shown in Figure 14.
Figure 15a shows the flow field characteristics of each section with the crosswind velocity uc = 4 m·s−1. The vertical section was the symmetrical section of the air-cooled unit at the corresponding position above the Z-section. The pressure distribution contour and the velocity vector were in the same position. As shown with the black arrow, a part of the hot air discharged by the upstream air-cooled unit bypassed the barrier wall, and then returned to the fans, which was called “hot air recirculation phenomena”. Looking at the pressure contour in the same position of the vertical section, there was a small low-pressure zone in the black circle. Then, nearby air was driven by the differential pressure. This was the reason for forming hot air recirculation. The pressure distribution contours of the Z-section showed that the whole bottom of the air-cooled system platform had a wide region of negative pressure. However, four high-pressure zones appeared in the location of the black circle at columns 1, 2, 3, 4, row 4, as shown in Figure 15a. Assuming that the pumping power of the fan is equal, the higher the pressure in the Z-section, the larger the airflow rate of the fans. Therefore, the frozen phenomena more easily occurred in these air-cooled condensers, and the location of the frozen region in Figure 11 was the same as the location of the black circle.
Figure 15b shows the flow field characteristics of each section with the crosswind velocity uc = 12 m·s−1. Compared with uc = 4 m·s−1, when the crosswind velocity was uc =12 m·s−1, hot air recirculation phenomena were also formed inside the DACC, as shown with the black arrow. When the crosswind velocity was from 4 m·s−1 to 12 m·s−1, the frozen regions in the DACC gradually disappeared. The frozen phenomena in the DACC disappeared when the crosswind velocity was 12 m·s−1. The hot air recirculation may be one of the reasons to restrain the formation of frozen phenomena. In addition, the negative pressure region in the Z-section was further expanded along the direction of the crosswind. Moreover, the pressure was gradually decreasing along the direction of the arrow in the black box region, which might be the reason for the decrease of the airflow rate of the fans. There was a small high-pressure zone in the black circle indicating where a small frozen region appeared.
Figure 15c,d shows the flow field characteristics of each section with the crosswind velocity uc = 20 m·s−1 and uc = 28 m·s−1, respectively. Compared with the crosswind uc = 4 m·s−1 or uc = 12 m·s−1, the hot air discharged by the upstream air-cooled condenser unit in row 4 was carried away directly by the crosswind and the airflow was straight into the air-cooled unit as indicated by the black arrow, as shown in Figure 15c,d. The inlet air flow directly entered the air-cooled unit from one side, and there was no hot air recirculation phenomena in the DACC. Compared with uc = 20 m·s−1, the static pressure contour of the Z-section was similar, and the negative pressure region was spreading along the direction of the crosswind. The static pressure in the black box increased with the increase of crosswind velocity, and a relatively high-pressure region appeared in the black circle. The pressure was decreasing gradually from left to right, as shown by the long arrow in the pressure contour of the vertical section.

4. Conclusions

Using the Fluent software, this study analyzed the influence mechanism of frozen phenomena in a DACC under crosswind conditions. The following conclusions were obtained:
(a)
The frozen phenomena are most likely to appear in row 4 under different crosswind conditions. The airflow rate increases and the inlet air temperature decreases along the direction of the crosswind. When the crosswind velocity is lower than 12 m·s−1, the maximum value of airflow rate remains unchanged. When the crosswind velocity is greater than 12 m·s−1, and the maximum value of airflow rate and minimum value of inlet air temperature appear in column 1 row 4, the maximum value of airflow rate gradually increases and the minimum value of inlet air temperature decreases along with the increasing of crosswind velocity.
(b)
The number of frozen air-cooled units gradually shrinks to zero and then increases along the increase of crosswind velocity. The frozen phenomena in the DACC disappears when the crosswind velocity is 12 m·s−1. The frozen region mainly appears in column 1 row 4, and the area of the frozen region increases from one-third of the air-cooled unit surface to half when the crosswind velocity increases from 20 m·s−1 to 28 m·s−1. At a crosswind velocity of 4 m·s−1, the number and area of frozen regions reach the maximum of six.
(c)
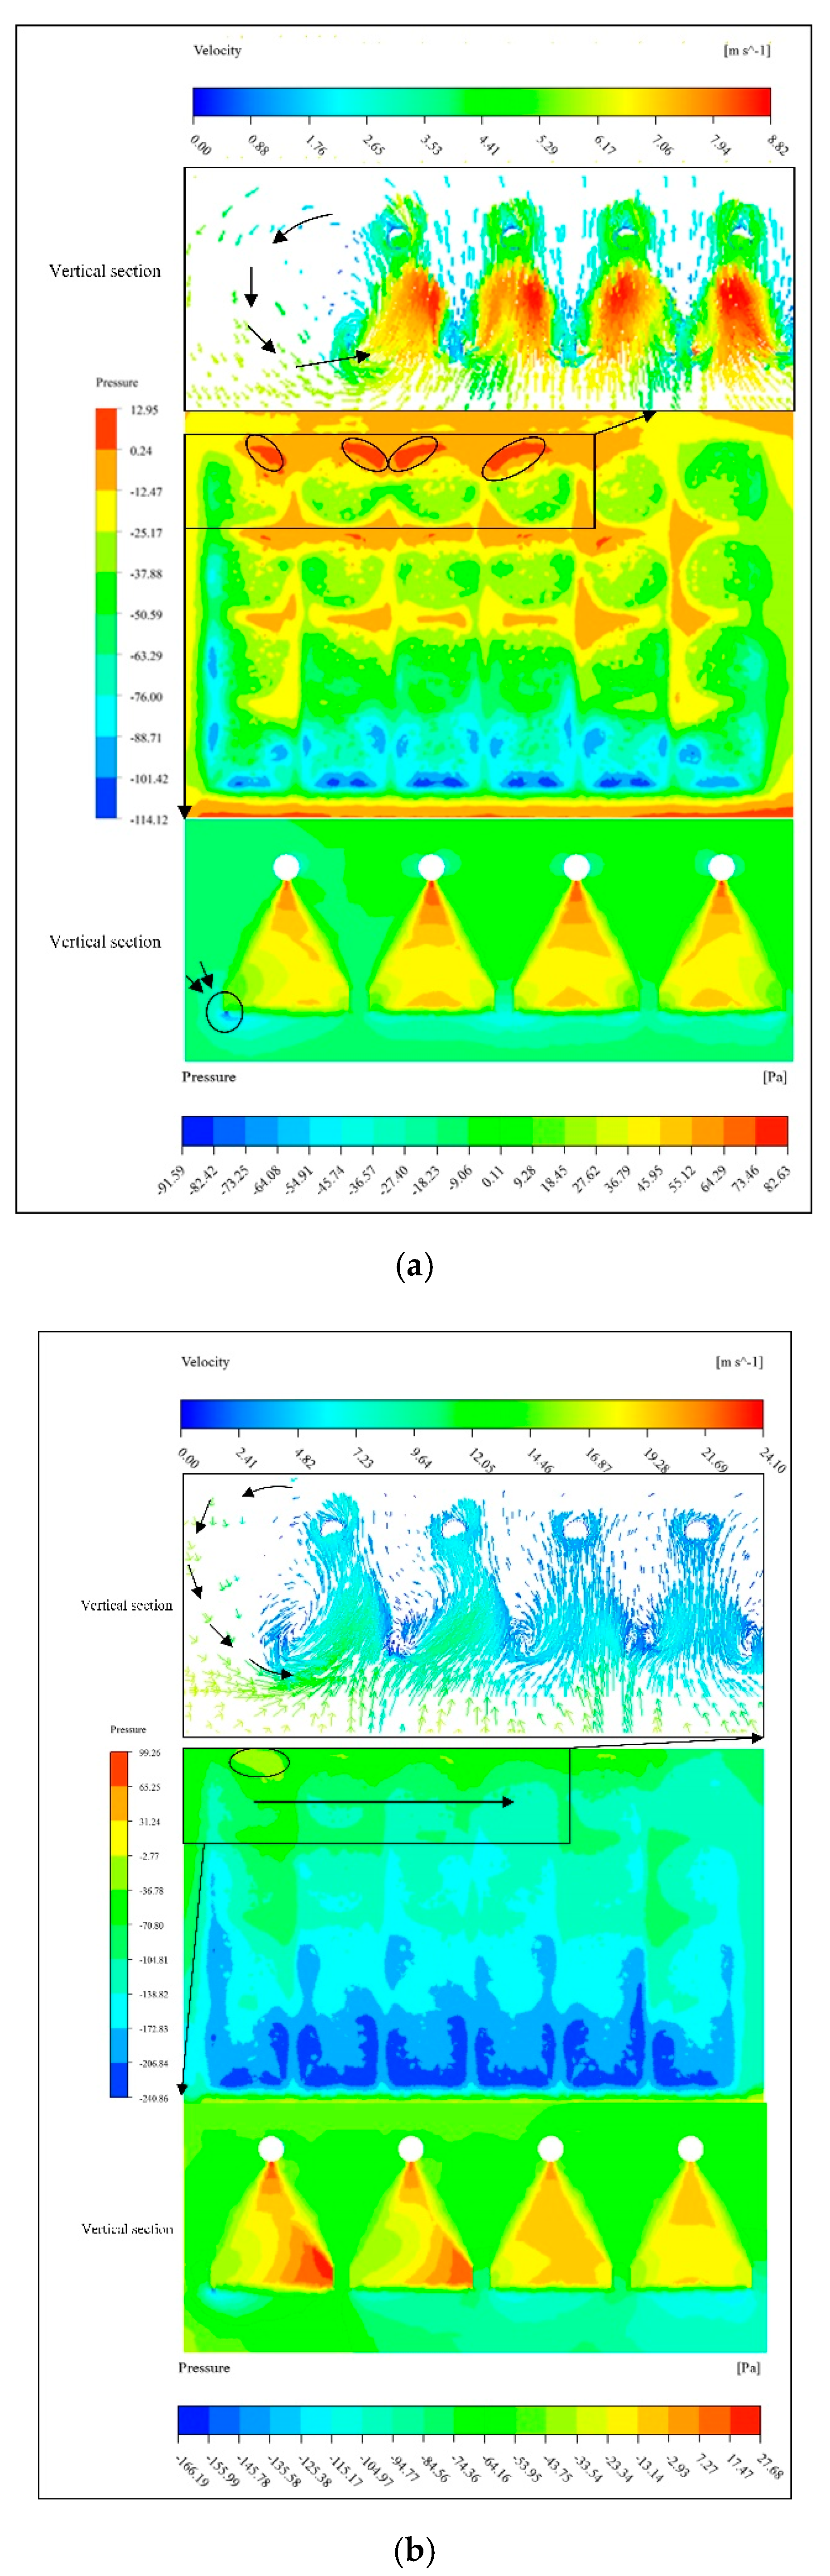
One vortex will be formed on the upwind side of the air-cooled unit under different crosswind velocities and it is not easy to form a frozen region where the vortex is formed. The increase of vortex can availably reduce the area of the frozen regions at a crosswind velocity of not more than 12 m·s−1. When the crosswind velocity is greater than 20 m·s−1, the vortices in the air-cooled unit are the same size.
(d)
There exists hot air recirculation under a crosswind velocity of not more than 12 m·s−1, which may be one of the reasons to restrain the formation of the frozen zone. The hot air recirculation disappears when the crosswind velocity exceeds 20 m·s−1. With the increase of crosswind velocity, the negative pressure region gradually increases along the direction of the crosswind velocity, and a relatively high-pressure zone appears below each frozen region.

Author Contributions

W.Y., X.C. designed the study, established the mathematical model, and conducted the numerical study; X.L., Y.L. meshed the grids of DACC; W.Y. wrote the manuscript; F.S., Y.Z. reviewed the paper. All authors have read and agreed to the published version of the manuscript.

Funding

This research received no external funding.

Conflicts of Interest

The authors declare no conflict of interest.

Nomenclature

especific internal energy (J·kg−1)
keffair thermal conductivity (W·m−1·K−1)
dthe distance to the wall (m)
C2pressure-jump coefficient (m−1)
Cb1, etcempirical constants in the turbulence model
S ˜ modified vorticity
Smagnitude of the vorticity
Gvturbulent viscous generation term
Shheat source (W·m−3)
qheat flux (W·m−2)
hspecific enthalpy (kJ·kg−1)
hλconvective heat transfer coefficient (W·m−1·K−1)
Ttemperature (K)
uiair velocity in the xi direction
ucambient natural crosswind velocity (m·s−1)
ppressure (Pa)
vkinematic viscosity (m2·s−1)
xicartesian coordinate (m)
kLnondimensional loss coefficient
Greek Letters
ρair density (kg·m−3)
μeffective dynamic viscosity (kg·m−1·s−1)
χintermediate variable
σturbulent Prandtl number
αprofile index
Subscripts
effeffective
aair

References

  1. Zhang, L.; Zhang, L.; Zhang, Q.; Jiang, K.; Tie, Y.; Wang, S. Effects of the Second-Stage of Rotor with Single Abnormal Blade Angle on Rotating Stall of a Two-Stage Variable Pitch Axial Fan. Energies 2018, 11, 3293. [Google Scholar] [CrossRef] [Green Version]
  2. Meyer, C.J. Numerical investigation of the effect of inlet flow distortions on forced draught air-cooled heat exchanger performance. Appl. Therm. Eng. 2005, 25, 1634–1649. [Google Scholar] [CrossRef]
  3. Wang, Q.W.; Zhang, D.J.; Zeng, M.; Lin, M.; Tang, L.H. CFD simulation on a thermal power plant with air-cooled heat exchanger system in north China. Eng. Comput. 2008, 25, 342–365. [Google Scholar] [CrossRef]
  4. Liu, P.; Duan, H.; Zhao, W. Numerical investigation of hot air recirculation of air-cooled condensers at a large power plant. Appl. Therm. Eng. 2009, 29, 1927–1934. [Google Scholar] [CrossRef]
  5. Gu, H.; Zhe, Z.; Wang, H.; Qi, C. A numerical study on the effect of roof windbreak structures in an air-cooled system. Appl. Therm. Eng. 2015, 90, 684–693. [Google Scholar] [CrossRef]
  6. Wang, W.; Zhang, H.; Li, Z.; Lv, J.; Ni, W.; Li, W. Adoption of enclosure and windbreaks to prevent the degradation of the cooling performance for a natural draft dry cooling tower under crosswind conditions. Energy 2016, 116, 1360–1369. [Google Scholar] [CrossRef]
  7. Wang, W.; Zhang, H.; Lv, J.; Liu, Q.; Yue, G.; Ni, W. Ventilation enhancement for a natural draft dry cooling tower in crosswind via windbox installation. Appl. Therm. Eng. 2018, 137, 93–100. [Google Scholar] [CrossRef]
  8. Bustamante, J.G.; Rattner, A.S.; Garimella, S. Achieving near-water-cooled power plant performance with air-cooled condensers. Appl. Therm. Eng. 2016, 105, 362–371. [Google Scholar] [CrossRef] [Green Version]
  9. Liu, L.; Du, X.; Xi, X.; Yang, L.; Yang, Y. Experimental analysis of parameter influences on the performances of direct air cooled power generating unit. Energy 2013, 56, 117–123. [Google Scholar] [CrossRef]
  10. Owen, M.T.F.; Kröger, D.G. An investigation of air-cooled steam condenser performance under windy conditions using computational fluid dynamics. J. Eng. Gas Turbines Power 2011, 133, 064502. [Google Scholar] [CrossRef]
  11. Al-Waked, R.; Behnia, M. The performance of natural draft dry cooling towers under crosswind: CFD study. Int. J. Energy Res. 2004, 28, 147–161. [Google Scholar] [CrossRef]
  12. Al-Waked, R.; Behnia, M. The effect of windbreak walls on the thermal performance of natural draft dry cooling towers. Heat Transf. Eng. 2005, 26, 50–62. [Google Scholar] [CrossRef]
  13. Yang, L.J.; Du, X.Z.; Yang, Y.P. Measures against the adverse impact of natural wind on air-cooled condensers in power plant. Sci. China Technol. Sci. 2010, 53, 1320–1327. [Google Scholar] [CrossRef]
  14. Yang, L.J.; Du, X.Z.; Yang, Y.P. Wind effect on the thermo-flow performances and its decay characteristics for air-cooled condensers in a power plant. Int. J. Therm. Sci. 2012, 53, 175–187. [Google Scholar] [CrossRef]
  15. Butler, C.; Grimes, R. The effect of wind on the optimal design and performance of a modular air-cooled condenser for a concentrated solar power plant. Energy 2014, 68, 886–895. [Google Scholar] [CrossRef]
  16. Zhang, X.; Wu, T. Effects of diffuser orifice plate on the performance of air-cooled steam condenser. Appl. Therm. Eng. 2016, 98, 179–188. [Google Scholar] [CrossRef]
  17. Fabbri, G. Analysis of vapor back flow in single-pass air-cooled condensers. Int. J. Heat Mass Transf. 1997, 40, 3969–3979. [Google Scholar] [CrossRef]
  18. O’Brien, J.E.; Sohal, M.S. Heat transfer enhancement for finned-tube heat exchangers with winglets. Trans. Asme-C-J. Heat Transf. 2005, 127, 171–178. [Google Scholar] [CrossRef] [Green Version]
  19. Li, J. Causes of freezing in direct air cooling system for large-scale air cooling units and freeze-preventing measures thereof. Therm. Power Gener. 2008, 37, 58–60. [Google Scholar]
  20. Klimeš, L.; Pospíšil, J.; Štětina, J.; Kracik, P. Semi-empirical balance-based computational model of air-cooled condensers with the A-frame layout. Energy 2019, 182, 1013–1027. [Google Scholar] [CrossRef]
  21. Moore, J.; Grimes, R.; Walsh, E.; O’Donovan, A. Modelling the thermodynamic performance of a concentrated solar power plant with a novel modular air-cooled condenser. Energy 2014, 69, 378–391. [Google Scholar] [CrossRef]
  22. He, W.F.; Dai, Y.P.; Wang, J.F.; Li, M.Q.; Ma, Q.Z. Performance prediction of an air-cooled steam condenser using UDF method. Appl. Therm. Eng. 2013, 50, 1339–1350. [Google Scholar] [CrossRef]
  23. Xue, X.; Feng, X.; Wang, J.; Liu, F. Modeling and simulation of an air-cooling condenser under transient conditions. Procedia Eng. 2012, 31, 817–822. [Google Scholar] [CrossRef] [Green Version]
  24. Medina, Y.C.; Khandy, N.H.; Carlson, K.M.; Fonticiella, O.M.C.; Morales, O.F.C. Mathematical modeling of two-phase media heat transfer coefficient in air cooled condenser systems. Int. J. Heat Technol. 2018, 36, 319–324. [Google Scholar] [CrossRef]
  25. ANSYS Fluent 16.2: Fluent Theory Guide. In ANSYS Help Viewer; ANSYS Software Company: Canonsburg, PA, USA, 2015.
Figure 1. The top view of the DACC (direct air-cooled condensers).
Energies 13 03831 g001
Figure 2. The side view of the DACC.
Energies 13 03831 g002
Figure 3. Numerical model of air-cooled unit.
Energies 13 03831 g003
Figure 4. Calculation domain diagram.
Energies 13 03831 g004
Figure 5. Grid configuration of DACC.
Energies 13 03831 g005
Figure 6. Air flow rate of fans at the crosswind of 4 m·s−1.
Energies 13 03831 g006
Figure 7. Dimensionless flow coefficient of the DACC as a whole at different velocities.
Energies 13 03831 g007
Figure 8. Number of fans.
Energies 13 03831 g008
Figure 9. Airflow rate under crosswind conditions.
Energies 13 03831 g009
Figure 10. Inlet air temperature under crosswind conditions.
Energies 13 03831 g010
Figure 11. Temperature contours of the finned-tube radiator at various crosswind velocities.
Energies 13 03831 g011
Figure 12. Transverse section diagram of air-cooled unit in column 1 row 4.
Energies 13 03831 g012
Figure 13. The velocity vectors of the transverse section.
Energies 13 03831 g013
Figure 14. The vertical section of air-cooled unit in row 4, Z-section and fans section.
Energies 13 03831 g014
Figure 15. The flow field characteristics of each section under crosswind conditions. (a): uc = 4 m·s−1; (b): uc = 12 m·s−1; (c): uc = 20 m·s−1; (d): uc = 28 m·s−1.
Energies 13 03831 g015aEnergies 13 03831 g015b
Table 1. The value of fn.
f1f2f3
144.8−5.860.81
Table 2. The value of rn.
r1r2r3
71.689−31.7074.798
Table 3. The values of hn.
h1h2h3
71.689−31.7074.798
Table 4. Four different crosswind conditions.
Working Conditions1234
The value of uc (m·s−1)4122028

