1. Introduction
As power consumption increases each year, the power generation and distribution industry grows in size, and the need for technologies to reduce power loss is increasing. The types of power losses are generally classified into technical losses (TLs) and non-technical losses (NTLs) [
1]. TLs occur in the process of transmission, transformation and measurement of electricity, while NTLs are mainly caused by theft, fraud or billing problems [
2].
The advanced metering infrastructure (AMI) is a central part of the smart grid system, and provides the communication and control functions needed to implement critical energy management services [
3]. However, it also creates the opportunity for a new type of energy theft. Electricity theft refers to the intentional and illegal usage of electricity by various means [
4] and paying less than the cost of the electricity actually used. Electricity theft can be accomplished by physical tampering such as unjustified changes to the meter, or by electrically tampering with the metered data in the smart meter network [
4,
5].
A number of studies have recently been conducted on the detection of energy theft in AMIs using machine learning methods [
4,
6,
7]. Classification methods such as SVM (Support vector machine), decision tree, deep learning have been applied to predict normal or illegal electricity usage in AMI. The big data obtained from smart meters can be used to apply the classification methods and promising results have been reported. However, one serious problem in applying classification methods is a lack of attack data. Normal usage data are easy to collect, but obtaining enough electricity theft data to train a classification model is difficult. On the other hand, one-class classification or outlier detection can also be used, since their application is based only on normal data and does not require attack data. However, abnormality predictions of individual data samples representing daily usage should be post-processed in order to reach a decision that energy theft has occurred.
Various outlier and anomaly pattern detection methods in a data stream have been reviewed extensively in [
8]. Outlier detection aims to predict whether a data sample is an outlier. In [
9], an anomaly pattern detection method has been presented whose goal is to find a time point in streaming data where outliers begin to occur heavily. In this paper, a method for electricity theft detection in a data stream generated by smart meters is proposed based on the anomaly pattern detection method in [
9]. The proposed method aims to perform online monitoring of electricity theft detection in a smart meter data stream without requiring the records of previous electricity use by a customer to be monitored. Energy theft detection is performed in three steps: (1) An outlier detection model is constructed using normal electricity usage data. (2) The smart meter data stream of a customer who is being monitored is transformed to a binary-valued data stream by applying the outlier prediction method. (3) Energy theft detection is performed in the transformed binary-valued data stream. Experiments were performed using the smart energy data from the Irish Smart Energy Trial [
10] and simulating energy theft by six types of malicious electricity attacks as in [
6].
The contributions in this paper can be summarized as follows:
We propose a method for electricity theft detection based on anomaly pattern detection in data streams. It focuses on online monitoring for electricity theft detection in a data stream from smart meters.
The training of an outlier detection model requires only normal energy usage records.
Building the outlier detection model does not require the previous usage records of a customer being monitored for energy theft detection. Instead, the model can be constructed using power consumption data of other normal customers. This characteristic makes the proposed method applicable in real situations.
The remainder of the paper is organized as follows. In
Section 2, energy theft detection methods based on machine learning are reviewed. In
Section 3, we present an energy detection method using anomaly pattern detection on a data stream. In
Section 4, the experimental results demonstrate the competence of the proposed method. Discussions follow in
Section 5. Conclusions are given in
Section 6.
2. Related Work
Jiang et al. discussed the background of AMI and major security requirements that AMI should meet [
11]. AMI energy-theft detection schemes were summarized into three categories, such as classification-, state estimation-, and game theory-based ones, and extensive comparisons and discussions on them were presented [
11].
Support vector machine (SVM) is widely used in classification-based energy theft detection. In [
6], if a nontechnical loss in the total energy consumption of a neighborhood is detected, for each customer on that neighborhood, an SVM model is constructed using the previous usage data of the customer and six types of synthetic attack data. A prediction of normality or attack for daily electricity usage data is performed. If an attack is suspected m or more times within a predetermined period, the customer is determined to be a case of electric theft. However, SVM model construction requires the past usage data of an individual customer. This poses a limitation to the method, in that it is difficult to obtain historical usage data for a long period of time for every customer who is being monitored.
In [
4], electric theft at different levels, such as transmission, distribution, and consumer levels was dealt with. At the consumer level, a decision tree was used to compute the expected electricity consumption of the customers from input variables such as the number of appliances, the number of residents, temperature, season, and time slot. The classification of consumers as normal or theft was performed using a SVM model with the actual and expected electricity consumption as inputs along with the previously defined input variables. However, this method can be used effectively only when both normal and theft data are sufficiently large.
Many other studies for energy theft detection based on SVM can be found in the literature [
12,
13,
14]. In [
12], the SVM-based fraud detection model (FDM) used customer load profile information and additional attributes to expose abnormal behavior that is known to be highly correlated with NTL activities. FDM was extended by the inclusion of human knowledge and expertise and the introduction of a fuzzy inference system (FIS) in [
13].
In [
7], five attributes were chosen to describe the power consumption pattern of each customer over the last six months: the average, maximum, and standard deviation in power consumption, the sum of inspection remarks, and the average power consumption in the residential area of the customer. C-means fuzzy clustering was performed to group consumers with similar power consumption patterns, and a fuzzy membership matrix of the distances between clusters and consumers was obtained. From the past and present fuzzy membership matrices obtained using the data from the last 6 months and the previous 6 months from one year ago, respectively, the Euclidean distance representing the degree of consumption change of each consumer is calculated. From the Euclidean distance, the outlier index is calculated, and consumers who exceeded a threshold are judged to be negative consumers. However, there is a limitation to this method, in that historical consumption data for at least the past 18 months are required.
In [
15], a fraud detection strategy based on class imbalance research was presented. Individual classifiers such as One Class SVM, Cost Sensitive SVM (CS-SVM), Optimum Path Forest (OPF) and C4.5 Tree were combined by using combination functions adapted to the imbalance between classes. In [
5], McLaughlin et al. proposed an AMI intrusion detection system that uses information fusion to combine the sensors and consumption data from a smart meter. Meter audit logs of physical and cyber events were combined with consumption data to more accurately model and detect theft-related behavior.
Various deep learning models were used for energy theft detection. In [
16], deep learning algorithms, CNN (Convolutional neural network) and LSTM (long- and short-term memory), were applied to classify normal users and theft users using the energy consumption data from a one-year period. The missing value estimation was applied, and synthetic data generation was also used to compensate low count of electricity theft users. In [
17,
18], Deep RNN (Recurrent neural network) and wide and deep CNN were used to exploit the time series nature of the customers’ electricity consumption.
3. Energy Theft Detection by Anomaly Pattern Detection
Energy theft using the streaming data of daily energy usage collected from a smart meter usually involves illegal energy consumption committed continuously for some period. Hence, beyond predicting whether the energy usage in a day is abnormal or not, energy theft detection needs to consider a pattern, where the prediction for abnormal energy consumption is repeated. Anomaly pattern detection on streaming data aims to find a time point on a data stream where outliers begin to burst abnormally. We apply the anomaly pattern detection method from [
9] for energy theft detection in smart meter stream data. The three steps employed for energy theft detection are presented in the following subsections.
3.1. Step1: Construction of Outlier Detection Model
Power consumption records can be collected on a smart meter at fixed time intervals, such as 15 or 30 minutes. Let us denote power consumption for a day as a vector . We call vector a data sample and an attribute. Let be a set of data samples representing the daily power consumption of normal consumers for a certain period. In order to minimize variations that may occur with different lifestyles during the season, weekdays, and weekends, a normalization such as min–max normalization or the standard normalization in Equations (1) and (2) can be processed for .
An outlier detection model is built based on the normal data samples in . By applying k-means clustering on a subset of , the normal data region is covered by k hyperspheres where each hypersphere is represented by a center and a distance from the center to the farthest data sample within it. When a new data sample is included in one of hyperspheres, it can be considered a normal data sample. By partitioning into M subsets and applying k-means clustering to each subset, we can obtain M models representing the different boundary descriptions of normal data regions. When a new data sample is not considered as normal in any of the M models, it can be predicted as an outlier. If a large number k is used in k-means clustering, the boundary of the normal data region is described tightly, while a small number k gives a loose boundary description.
3.2. Transformation of a Smart Meter Data Stream into a Binary-Valued Data Stream
Assume that a data stream, , from a smart meter of a customer is being received. The outlier detection model constructed on the normal training data is applied for each of the data samples in a data steam. Denoting outlier prediction by 1 and normal prediction by 0, the data stream is transformed into a stream of binary values.
3.3. Energy Theft Detection in a Binary-Valued Data Stream
In a binary-valued data stream, APD-HT (Anomaly Pattern Detection based on Hypothesis Testing) [
9] is applied where a reference window is set in the beginning part of the stream, which is considered to correspond to normal power consumption and a detection window is moved forward one by one as a new data sample arrives in the data stream. The binomial distributions within two windows are compared to detect the burst of 1’s in the detection window. The difference in binomial distributions in the two windows is detected by hypothesis testing. The hypothesis is set to test the equivalence of the proportions in the binomial distributions of the reference window and the detection window. If an outbreak of outliers is detected in a detection window, energy theft detection is signaled. Otherwise, the detection window moves forward and the same process is repeated.
4. Experimental Results
To test the performance of the proposed energy theft detection method, we used the smart energy data from the Irish Smart Energy Trial [
10]. It contains electricity usage reports collected through smart meters from over 5000 Irish homes and businesses during 2009 and 2010. For each customer, half hourly metering reports for an average 511 days are given where the report date is indexed from 195 to 730. By summing successive half hourly usages up into an hourly usage, daily electricity usage can be represented as a 24-dimensional vector.
Since all of the participants were expected to be legal electricity users, energy theft was simulated using six types of malicious attacks, as in the paper [
6]. For a vector
representing a normal daily usage, six types of attack data were generated as follows for
.
random (0.1, 0.8)
, for start-time < t < end-time, and 1 else
start-time = random (0, 23-minOffTime)
duration = random (minOffTime, 24)
end-time = start-time + duration
here minOffTime = 4
= random (0.1, 0.8)
mean(), = random(0.1, 0.8)
mean()
The anomaly pattern detection model was applied to a test data stream where simulated energy theft data follows a data sequence of normal energy consumption. The starting point of energy theft should be detected with minimum delay. If the detection is performed successfully after the theft point, then it is considered to be a TP (true positive) and the distance between the actual theft point and detection point is counted as Delay. If the detection is issued before the real theft point, it is considered an NP (negative positive). If the detection is not done until the end of the test data stream, it is considered a FN (false negative). Over multiple test data streams, TP, FP, and FN are accumulated and Delay is averaged. From the accumulated TP, FP, and FN, the F1 value is calculated using Equation (3) [
19].
4.1. When Model Construction Is Based on the Normal Energy Consumption Data of Consumers Unrelated to Testing
The energy consumption records of normal consumers can be easily obtained, compared with the records of malicious users. In this test, the outlier detection model is constructed using the data of normal users whose energy usage pattern might be different from a particular consumer being monitored. The outlier detection model is applied for energy theft detection on a smart meter data stream of the consumers whose previous usage data is not used for model construction.
A total of 300 customers were randomly chosen, and their daily power consumption data during the first one year up to the date index 560 were used to build an outlier detection model. To simulate the occurrence of energy theft in a smart meter data stream, a test data stream was constructed as follows. We randomly selected 300 customers who were not previously chosen for model construction. By concatenating the normal data sequence starting from the date index 561 of one customer and a sequence of attack data transformed from the normal data sequence of the same customer, a total of 300 test data streams were constructed per each attack type. The transition point between the two sequences is considered the occurrence point of the energy theft.
Figure 1a illustrates the experimental setting.
For the construction of the outlier detection model, the number of models by k-means clustering, M, was set as 3, and the number of clusters, C, was set as 3000. The sizes of a reference window and a detection window were set as 50. The energy theft detection was employed to test data streams. Over 300 test data streams, TP, FP, and FN were accumulated, and F1 value and average Delay were computed. This test process of constructing the outlier detection model and applying the model for test data streams was repeated 10 times.
Table 1 shows the energy theft detection performance for six types of attacks. We report the average F1 and Delay after 10 repetitions. Standard deviations are also indicated in parentheses. Processing by standard or min–max normalization gave better performance than no normalization. This shows that a normalization process is necessary due to the diversity in energy consumption patterns. However, for the type 1 attack, the normalization process tends to make it difficult to distinguish between normal data and attack data. This is because the type 1 attack is generated by multiplying randomly chosen values. While low F1 values were obtained for types 1~3, highly competent performance was obtained for types 4~6. When standard normalization was used, for the types 4~6, an average F1 value of 0.93 was obtained and the average Delay ranged from 12 to 28 days. However, we note that overall, the standard deviation of the Delay value is high, unlike the standard deviation of the F1 value. In order to stably detect within a short time after the attack has occurred, further investigation is necessary.
The test in
Table 1 was performed by concatenating the normal data sequence of one customer and an attack data sequence transformed from the normal data of the same consumer as shown in
Figure 1a. In the next test, the attack data were generated using the normal data of a different consumer that was randomly chosen.
Figure 1b shows that the attack data were marked as different from the normal data. The experimental results in
Table 2 show the improvement in F1 values for the attack types 1~3 compared with the results in
Table 1. When standard normalization was used, an average F1 value of the attack types 1~3 increased from 0.26 to 0.44. In case of min–max normalization, it was improved from 0.3 to 0.5. However, for the attack types 4~6, no big difference was noticeable.
4.2. When Model Construction Is Based on the Previous Energy Consumption Data of the Consumer Being Tested
In the next test, an outlier detection model was constructed using the past normal energy usage data of the customer who was being monitored for energy theft detection. By randomly choosing one customer, the outlier detection model was built using his/her daily power consumption data for the first year. A test data stream was constructed by concatenating the consumption data sequence of the same customer for the second year and the sequence of attack data transformed from it. The energy theft detection was performed on the test data stream. The experimental setting is displayed in
Figure 1c. This test was repeated 300 times.
Table 3 compares the F1 value and the average Delay when the number of models (M) and clusters (C) were variously set during the construction of the outlier detection model. Unlike the experiments in
Section 4.1, the F1 value is calculated from the TP, FP, and FN accumulated in the repeated tests of 300 times, so the standard deviation from the F1 value cannot be calculated. The standard normalization was used to preprocess the daily energy consumption vectors. Compared with the results in
Table 1 and
Table 2, a higher F1 value was obtained for the attack of type 2, but no big difference was noticeable for the other attack types. This shows that in the proposed method the historical consumption data of consumers being monitored for energy theft detection is not necessarily needed.
4.3. Parameter Sensitivity
We investigated the impacts of various parameters on the performance of the proposed method. The parameter values to be determined are the number of ensemble members and clusters in the construction of the outlier detection model by k-means clustering, and the size of reference and detection windows in APD-HT algorithm.
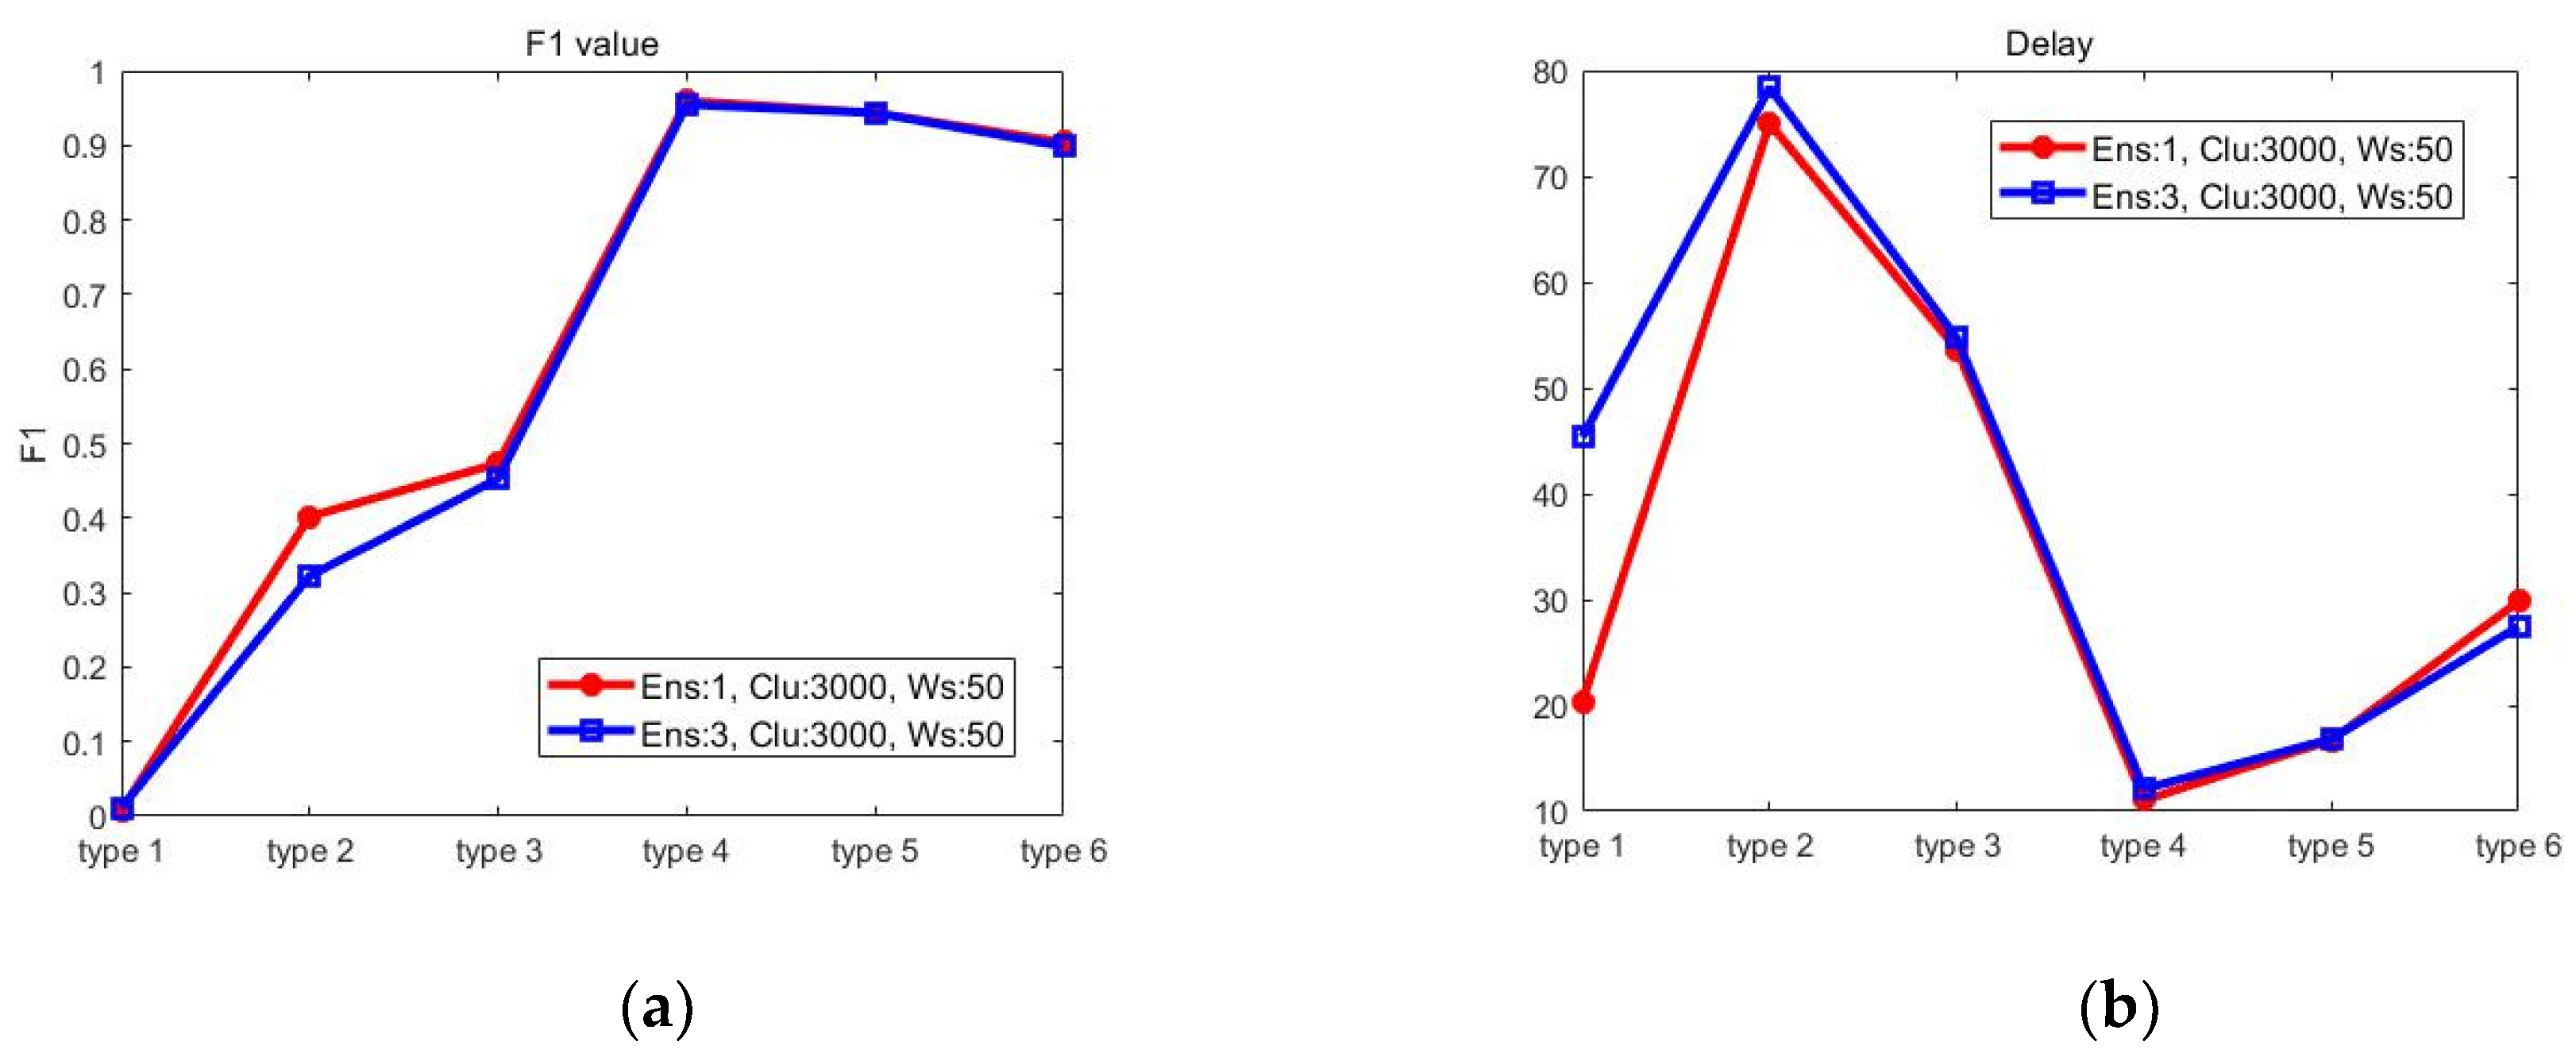
Figure 2 compares the average F1 value and Delay when the number of ensemble members is 1 or 3. The number of clusters and the window size were fixed to 3000 and 50, respectively. For the attack types 1 and 2, the performance is slightly better when the number of ensemble members is 1. However, there was no big difference in other cases.
Figure 3 compares the performance when the window size is set to 40, 50 or 60. When the window size is 60, the F1 value is higher but the Delay is also longer. The difference is not big except in the attack type 1.
Figure 4 shows the performance when the number of clusters is set to 2000, 3000, 4000. As in
Figure 2 and
Figure 3, for the attack types 4~6, the difference in the F1 value and Delay is not noticeable.
5. Discussion
While the proposed method is an unsupervised method where it only needs normal data to build a model, most energy theft detection methods are supervised learning where a classification model is built using both normal and attack data. In [
16], in order to reduce the disparity in the amount between normal users and theft users, synthetic theft data were generated. A classifier model utilizing CNN-LSTM-based deep learning techniques was trained using power consumption data for one year of both normal and theft users. The trained model was used to classify theft users. In [
17], artificial attack data of six types was generated as in [
6] and a classification model was trained using both normal and attack data of daily power consumption and was used to predict abnormal energy consumption days. In [
18], using power consumption data for 1035 days of thieves and normal users, a classification model was built and used to predict energy thieves.
Another major characteristic of the proposed method is that it works in a streaming data of daily power consumption generated from smart meters. The goal of the proposed method is to detect a time point in a streaming data as accurately and fast as possible when malicious attack occurs. On the other hand, the methods in [
16,
17,
18] perform the classification for data samples which represent energy consumption days or energy usage records for a certain period.
Energy theft detection performance of the proposed method was tested in the simulated data streams using artificial attack data. By preprocessing daily consumption vectors using standard normalization, training an outlier detection model on normal usage data of randomly chosen customers, and applying anomaly pattern detection on the test data streams, attacks of types 4, 5, 6 were detected with an average F1 value of 0.93 and average Delay of 19 days. On the other hand, detection performance for type 1, 2, 3 attacks low. It is conjectured that the normalization process is not effective for those attacks, since the three attack types include multiplication by a randomly chosen value. As a future work, we plan to conduct performance tests for the proposed method using real energy theft data.
6. Conclusions
In this paper, a method for detecting energy theft in a smart meter streaming data is presented, based on anomaly pattern detection. Beyond predicting abnormal energy consumption days, it focuses on detecting a time point in the data stream where the occurrence of the energy theft begins. Importantly, the proposed method does not require the past usage records of individual customers in order to monitor their illegal usage. Here, the usage records of other legal customers were used to construct the model. Since the size of training data is one of the important factors to effectively use the machine learning method, the difficulty of collecting sufficient amount of illegal power consumption data can be a big problem in applying the machine learning method to the detection of energy theft. Taking into account that it is easy to obtain normal data compared to malicious data and the proposed method only needs normal data to build a model, the proposed method has strong potential in its application to various industrial problems as well as energy theft detection in AMI.


