Article

Pull-Out Capacity and Failure Mechanisms of Strip Anchors in Clay

Department of Ground Engineering and Materials Science, University of Cantabria, Avda. de los Castros s/n, 39005 Santander, Spain
*
Author to whom correspondence should be addressed.
Energies 2020, 13(15), 3853; https://doi.org/10.3390/en13153853
Submission received: 4 June 2020 / Revised: 16 July 2020 / Accepted: 23 July 2020 / Published: 28 July 2020
(This article belongs to the Special Issue Foundation Systems for Offshore Wind Turbines)

Abstract

:
Plate anchors are a well-established solution for supporting the efforts of floating platforms for wind and marine renewable energies. The behavior of ultrathin rigid plate anchors buried in purely cohesive soils under undrained and plane-strain conditions is analyzed. As already known, a dimensional analysis shows that the pull-out capacity of the anchor may be expressed using a weightless break-out factor (Nc0) that only depends on the ratio between the depth and the anchor width (H/B). Using finite element analyses, tabulated values of the weightless break-out factor are provided in this paper and three different failure mechanisms are identified, namely very shallow (quasi-vertical), shallow or intermediate (semi-vertical), and deep (rotational). For very shallow failure mechanisms, the studied problem is completely equivalent to the trapdoor problem because immediate breakaway at the bottom part of the anchor is considered (vented conditions). The existing analytical solutions for the very shallow (Nc0 = 1.956 H/B) and deep cases (Nc = 3π + 2) using the slip-line method are reviewed and an analytical limit is proposed for the first time for the very shallow mechanism (H/B = 1.314). For shallow (intermediate) cases, the failure mechanism is identified and the angle of the main slip lines is numerically evaluated.

Graphical Abstract

1. Introduction

The increasing demand for renewable energy has resulted in the use of the oceans as an important source of wind and marine renewable energies, posing new challenges for offshore geotechnics. Floating platforms, e.g., floating wind turbines, are the most widely used option in deep and moderate water depths, and anchoring systems are needed to moor these platforms in position and sometimes to provide extra stability. Offshore anchors are foundation elements connected to the floating platform through mooring lines, either catenary or taut types (e.g., [1]). The two main types of anchors are gravity anchors, which derive their holding capacity mainly from their weight, and embedded anchors, which derive their holding capacity mainly from the surrounding soil strength and weight.
Plate anchors are a well-established solution for the foundation of offshore floating platforms (e.g., [1]) and are essentially steel plates embedded in the seabed, i.e., they are embedded anchors. They were traditionally installed by means of dragging, but the development of new keying processes, such as suction-embedded plate anchors (SEPLAs) or dynamically embedded plate anchors (DEPLAs), has led to an increase in their use in the support of offshore floating platforms. SEPLAs and DEPLAs are vertically introduced into the ground with the aid of a suction pile or a torpedo, respectively; next, they are rotated to the (quasi-)horizontal position. For practical purposes, circular, rhomboid, and rectangular anchors (e.g., [2]) must be considered, while strip anchors are a limited, idealized case that allows plane-strain conditions (two dimensions) to be considered. Strip plate anchors may be an acceptable approximation for long rectangular plates and, for other cases, a benchmark point. Here, only the case of a quasi-static vertical load acting on a horizontally placed strip anchor is considered.
Plate anchors are usually made of steel, with high bending stiffness relative to the surrounding soil stiffness; hence, anchors will be supposed to be infinitely rigid in this paper. Besides, their thickness is also small; hence, for simplicity, the plates are idealized in this study to be ultrathin. For the contact between the anchor and the soil beneath, two limiting assumptions are usually considered: (1) Immediate breakaway at the bottom part of the anchor (vented conditions), i.e., suction during the pullout process is not considered, and (2) no breakaway, where suction is allowed beneath the anchor. The former is on the safe side for design (e.g., [3]) and is the one adopted in this paper. Thus, for very shallow failure mechanisms (quasi-vertical), the studied problem, i.e., an ultrathin rigid strip anchor under vented conditions, is completely equivalent to the trapdoor problem, which was originally introduced and investigated by Terzaghi [4].
The first studies on strip anchors were carried out by Vesic [5], who proposed analytical solutions for strip and circular anchors by using the cavity expansion approach. However, Vesic’s solution [5] overpredicts the capacity of strip anchors. Das [6], based on his own small-scale laboratory tests [7], suggested procedures to estimate the pull-out capacity of shallow and deep anchors embedded in clay. Here, the literature review is limited to anchors in clay, which is the scope of the paper. Gunn [8] presented solutions for the trapdoor problem using the upper and lower bounds theorems of plasticity. His solutions started to bound the exact solution. For the upper bound, Gunn [8] used a simple three-block mechanism. Rowe and Davis [9] used finite element analyses and studied the influence of anchor roughness, anchor thickness, and anchor inclination. Sloan et al. [10] improved Gunn’s lower and upper bounds [8] by using finite element limit analyses (FELA). Further improvements using the same technique were presented by Merifield et al. [11]. Yu et al. [12] presented detailed finite element analyses (FEA) and approximate fitting equations. Currently, there is still a lot of research on plate anchors in clay with a focus, for example, on cyclic loads (e.g., [13]), the influence of plate thickness (e.g., [14]), seepage and tension beneath the anchor (e.g., [15]), keying process (e.g., [16]), or non-uniform strength of the clay (e.g., [17,18]).
Despite the existing research on plate anchors in clay, detailed and tabulated values of the break-out factors are not available in the literature. For example, Yu et al. [12] only presented their FEA results graphically and provided approximate fitting equations. Besides, they failed to properly identify the exact analytical deep failure solution as in other recent works (e.g., [15,18,19]). On the other hand, the very shallow failure mechanism and its analytical solution [20] are not usually considered (e.g., [12,15,18,19]). Martin [20] proposed an analytical solution for the very shallow failure mechanism, but the limit of this solution in terms of the embedment depth was only numerically estimated.
This paper aims to be a benchmark or reference case for more advanced studies on plate anchors. To do this, the paper uses detailed FEA to provide highly accurate and tabulated values of break-out factors. Additionally, failure mechanisms are identified: Very shallow (quasi-vertical), shallow or intermediate (semi-vertical), and deep (rotational). The existing analytical solutions for the shallow and deep failure mechanisms and their theoretical bases using the slip line theory are reviewed for completeness. Besides, some analytical demonstrations are presented here in detail. The main novelties provided by this paper are: (1) A limit between the very shallow and shallow (intermediate) failure mechanisms is analytically demonstrated for the first time; (2) for shallow (intermediate) cases, the failure mechanism is identified and the angle of the main slip lines is numerically evaluated; (3) the strip anchor problem in clay is presented in a comprehensive way, including tabulated values of the break-out factors and analytical values.

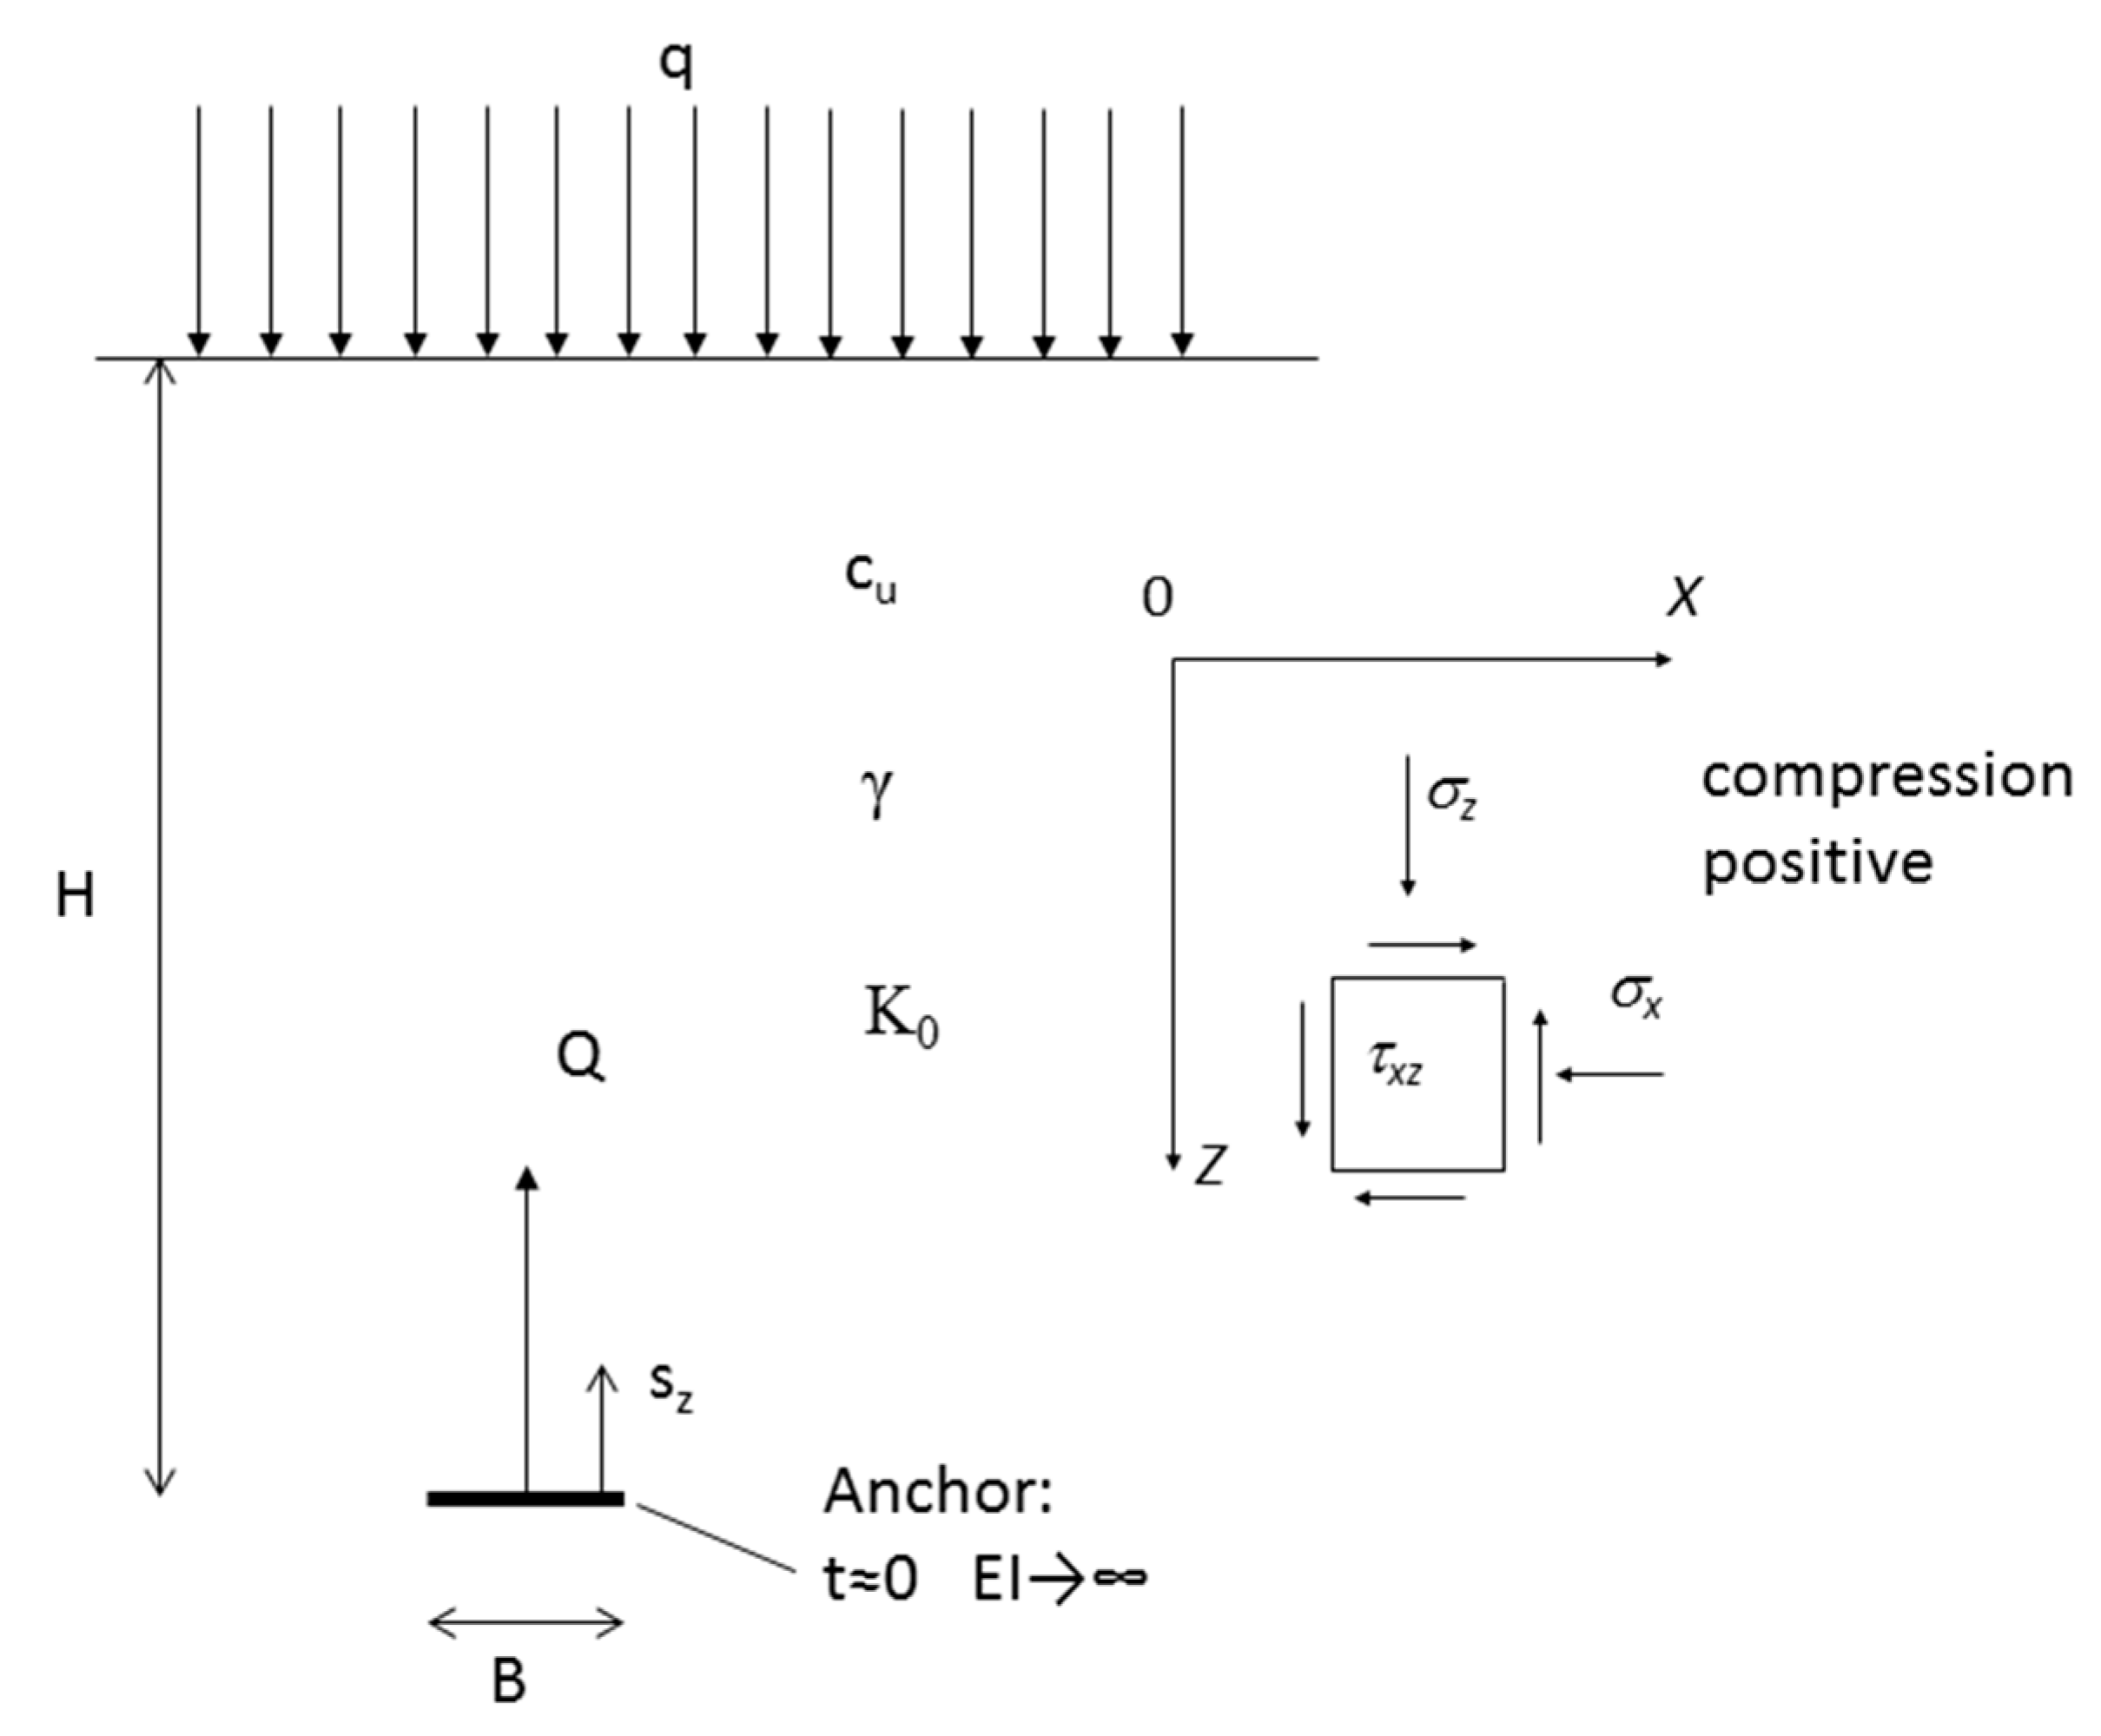
2. Dimensional Analysis

The variables of the problem (Figure 1) are identified and a dimensional analysis is performed to express them in a dimensionless form. Please, note that the problem is studied using total stresses as commonly done in this type of problem (clay under undrained conditions). Although the result of this dimensional analysis is already covered in the literature (e.g., [11]), it is presented here as an introduction to the problem and for the sake of clarity. The variables of the problem may be classified as follows:
(a)
Geometrical variables: Anchor width, B; Anchor embedment, H; anchor thickness, t, assumed as null here (t ≈ 0).
(b)
Initial stress state: Unit weight of the soil (γ), coefficient of lateral earth pressure at rest K0.
(c)
Surface surcharge at the seabed: q.
(d)
Soil properties: Stiffness and strength (e.g., undrained shear strength, cu).
(e)
Anchor properties: Assumed as infinitely stiff and as infinitely rough or smooth.
(f)
Results, e.g., pull-out capacity (Q) and anchor vertical displacement, sz.
The paper focuses on pull-out capacity; consequently, soil stiffness and anchor vertical displacement will not be considered. In fact, soil is assumed as a rigid-plastic Tresca material. Thus, for the pull-out capacity and the problem variables, there must be a relationship between them:
f ( Q , c u , B , H , γ , q , K 0 ) = 0 .
K0 is already a dimensionless parameter (i.e., the ratio between the horizontal and vertical effective stresses) but, for this type of limit strength problem (pull-out capacity), it does not have any influence. Thus, disregarding K0, the six variables in Equation (1) may be expressed in terms of two independent physical quantities, such as force and length. Using Buckingham’s theorem, Equation (1) may be simplified to a function of four independent dimensionless variables, for example:
f ( Q B c u , H B , γ H c u , q c u ) = 0 .
Equation (2) is analogous to the polynomial expression for the bearing capacity of footings, as both problems are similar.
Q B = q N q + c u N c + γ H N γ
where Nq, Nc, and Nγ are bearing capacity factors for the surface surcharge (q), the cohesion (c) or the undrained shear strength (cu), and the soil unit weight (γ), respectively.
For anchors in clay, Equation (3) is usually expressed in terms of dimensionless factors dividing by cu
Q B c u = q c u N q + N c + γ H c u N γ ,
where
N c = f ( H B )
and
N q = N γ = 1 .
Equation (5) means that in this case, Nc depends only on the depth embedment or cover ratio, H/B. Equation (6) is valid because the surcharge (q) and the self-weight stresses (γz) only imply a shift in the absolute stress values, without changing the deviatoric values. As the Tresca criterion is used and there are only horizontal boundaries, i.e., horizontal ground surface and horizontal plate anchor, the Mohr’s circle is just shifted, keeping its radius (deviatoric stress) and the position of the pole. Consequently, q and γz may be considered simply as vertical stresses that are added to the vertical capacity of the anchor due to the soil strength. Some authors have numerically shown this (e.g., [11]), and in those cases where minor deviations appear, it is due to numerical inaccuracies. As will be shown later, the pull-out capacity is limited to a maximum value caused by deep failure, and, obviously, in those cases, q and γz may cause deep failure.
According to several authors [3,17], the use of the buoyant unit weight is appropriate for offshore anchors, when the soil is fully submerged and free water reaches beneath the anchor, so that hydrostatic pressures appear beneath the anchor. The surcharge at the seabed (q) is not usually considered, because it does not normally exist, and Nc is usually called Nc0 to distinguish it from N, which includes the effect of the soil weight:
Q B c u = N c γ = N c 0 + γ H c u .
Nc0 is usually called the break-out factor for weightless soil and depends only on the depth embedment or cover ratio, H/B.

3. Review of Analytical Exact Solutions for Limit Cases

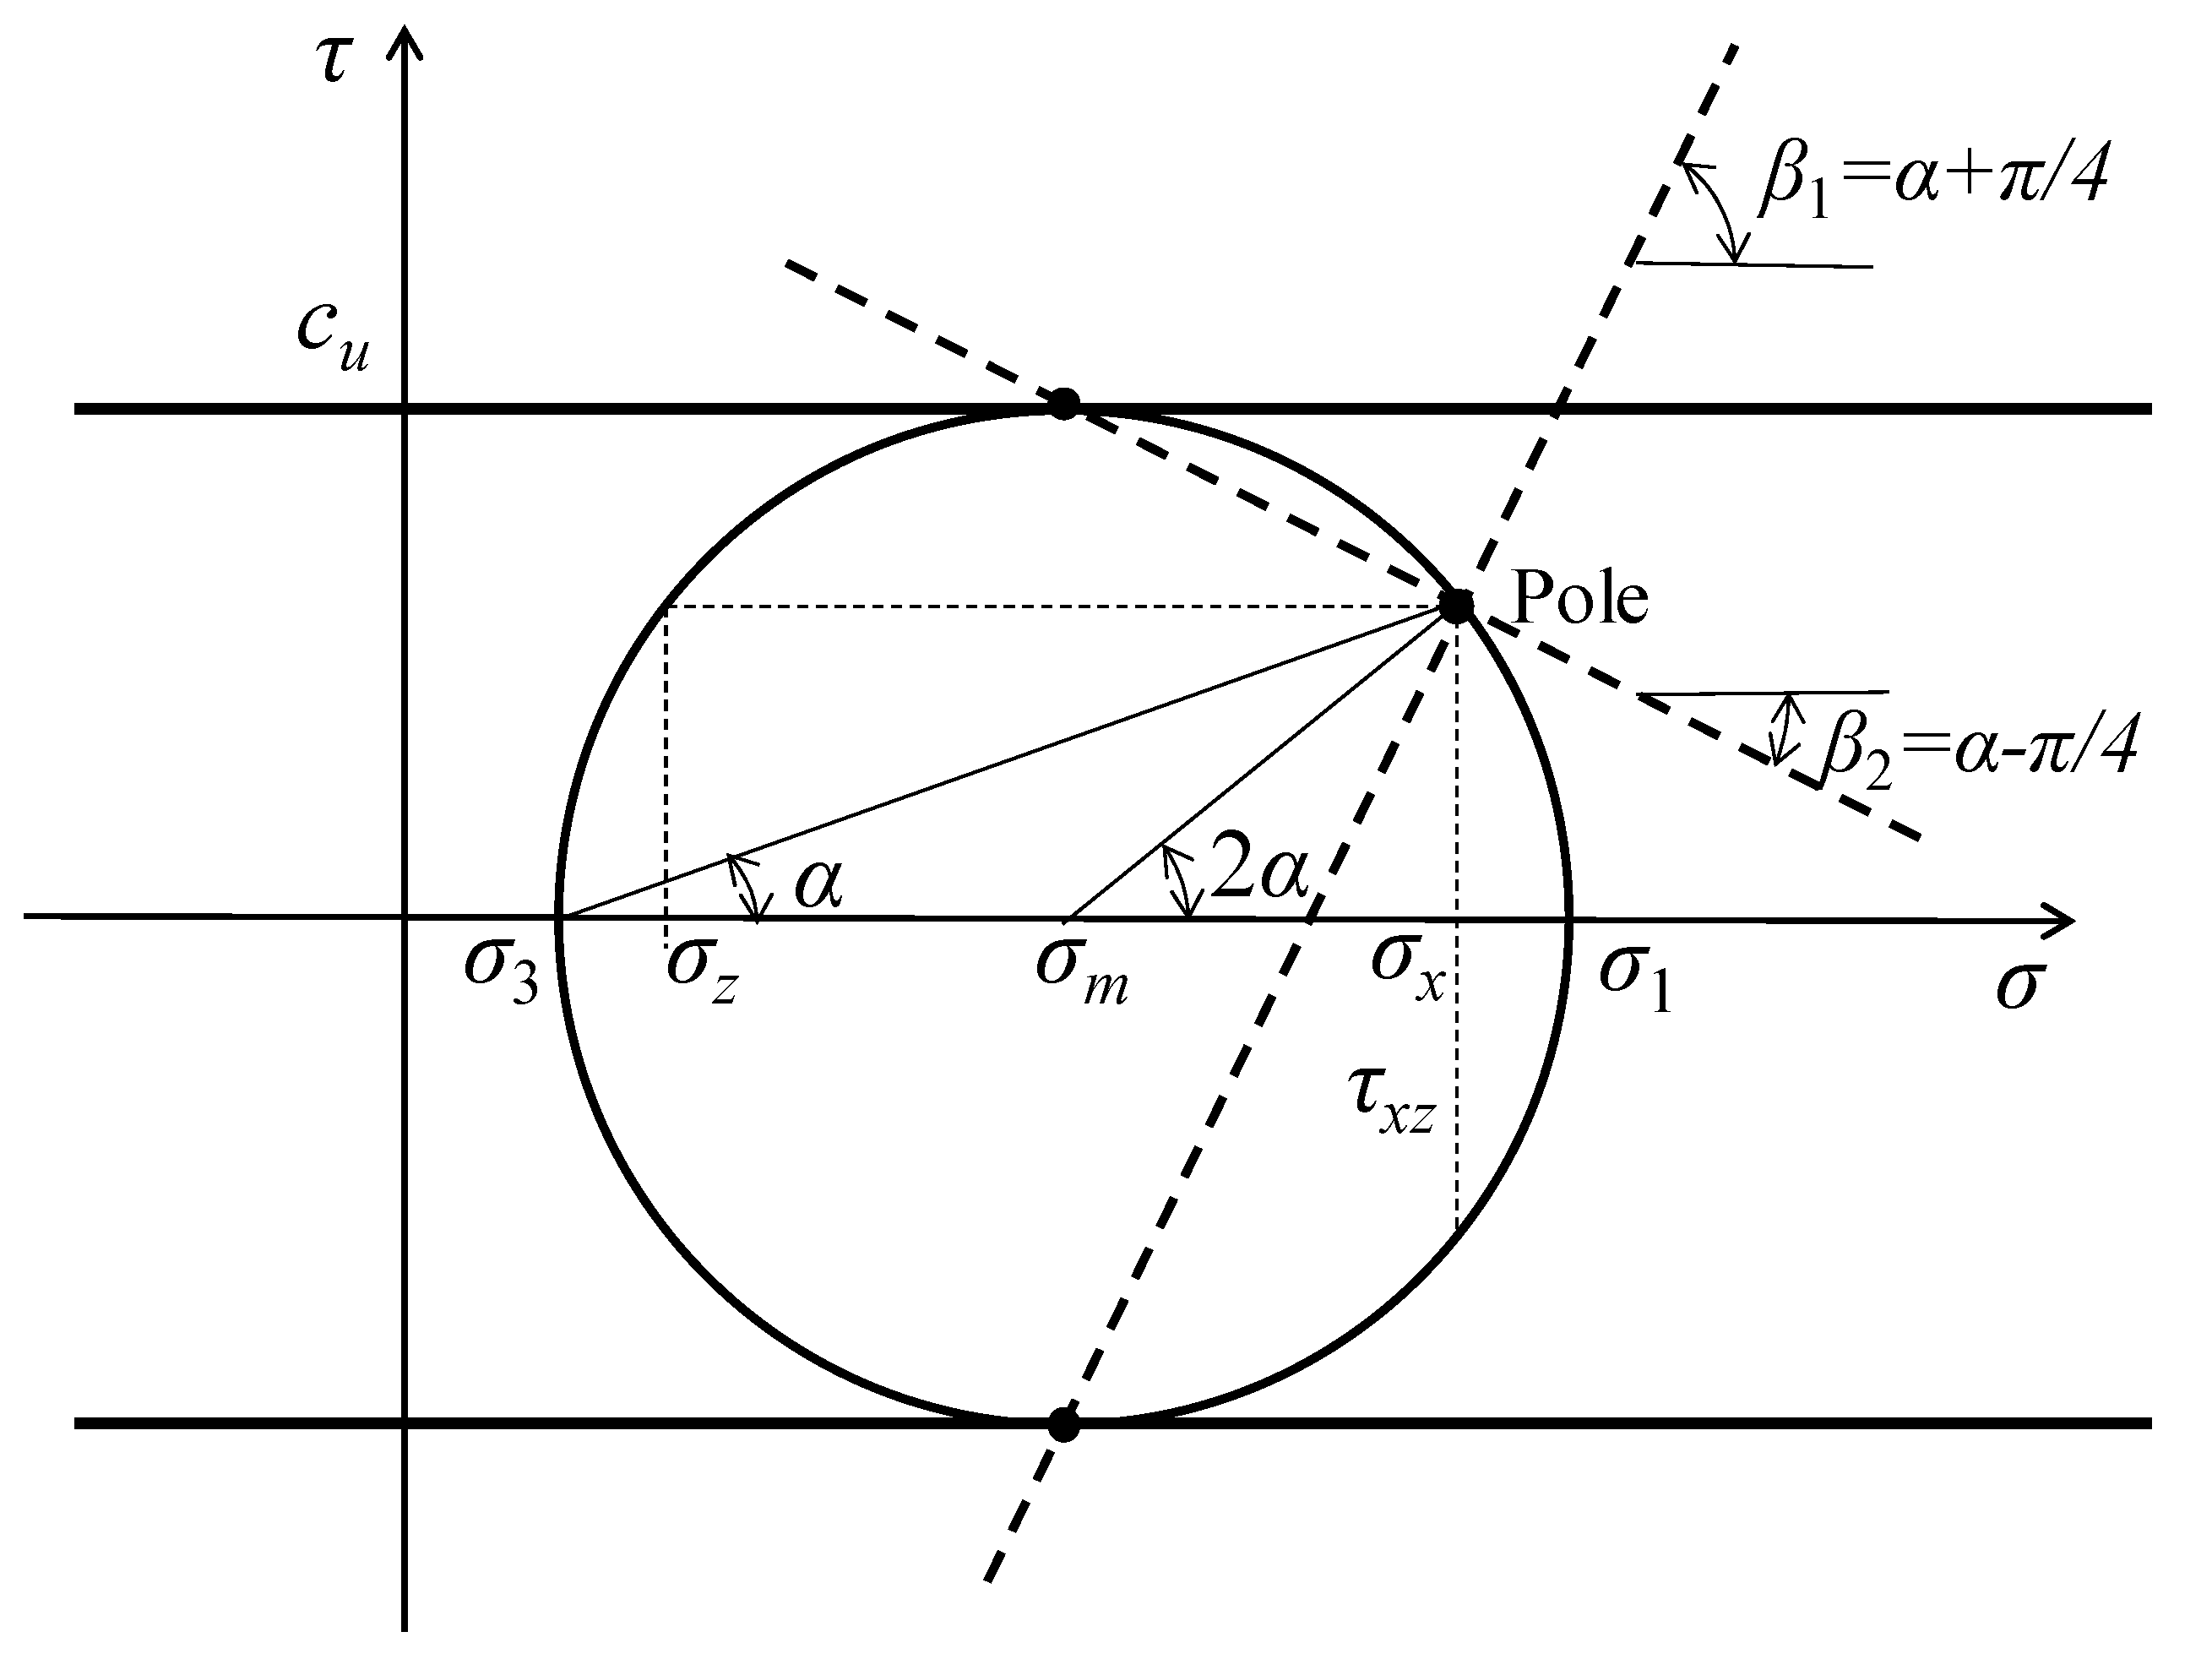
3.1. Methods of Characteristics in a Rigid-Plastic Tresca Material

The method of characteristics or the slip line method for frictional materials (Mohr–Coulomb criterion) is widely described in the literature, for instance, in [21] (pp. 279–280). For purely cohesive materials (Tresca criterion), the method is succinctly presented, for example, in [22] (pp. 132–136). Although the method is simpler for purely cohesive materials, a detailed development of the method of characteristics is not easily found in the literature. Therefore, the basic equations are presented in Appendix A for completeness.

3.2. Deep Failure

For deep failure, the exact analytical solution for an ultra-thin rigid anchor (Nc = 3π + 2) is independent of the anchor roughness and has been known for a long time [23]. Martin and Randolph [24] already noted that this exact solution does not appear to have been formally established by some authors (e.g., [25,26]), who acknowledge it as an upper bound solution because a rigorously extended lower bound stress field (as opposed to Meyerhof’s partial stress field [23]) is necessary in order for it to be a strictly valid exact analytical solution. Martin and Randolph [24] presented two ways of performing this requisite extension. Extensions of the stress field were also obtained here using FEA.
Currently, some authors (e.g., [17,27]) properly refer to that exact solution, while some others simply refer to it as an upper bound (e.g., [28,29]), and others (e.g., [12,30]) refer to other lower and upper bound solutions, such as those bound solutions proposed by [11,31].
The exact analytical solution may be easily developed using the characteristic (or slip-line) method described in Section 3.1 and Appendix A. Starting from the upper surface of the strip anchor, two scenarios might arise: Either the points are not in a plastic state (shallow failure thus takes place, as presented in the next section) or they are in a plastic state. In the latter case and assuming smooth conditions, an active wedge appears and the characteristic line inclinations are constant and equal to π/4 and 3π/4 (Figure 2). Consequently, the stress state is also constant (σm = pcu; α = π/2) (Figure 3a), where p is the vertical stress on the strip anchor, σm is the center of the Mohr’s circle, and α is the angle indicating the position of its pole (please, refer to Figure A1 and Equation (A3)). From that active wedge, the characteristic lines may reach the ground surface (intermediate failure mechanism), or if the anchor is deep enough, a three-quarter circular fan appears (Figure 2 and Figure 3b). Beneath the strip anchor, the vertical and shear stresses are null because immediate breakaway is considered. Thus, a passive wedge appears and the characteristic line inclinations are constant and equal to 3π/4 and π/4. The constant stress state in the passive wedge is σm = cu and α = π (Figure 3c).
The exact analytical solution may be found by imposing the constant value of ( Γ + α ) along a slip-line (please, see Appendix A for details) or applying equilibrium as in Figure 2 [23,24]:
p = ( 3 π + 2 ) c u ; N c 0 = 3 π + 2 .
This is also the exact analytical solution independent of the contact roughness for a rigid-plastic material as there are no relative displacements at the active and passive wedges. If the material is not perfectly rigid, small differences appear, as reported, for example, by [3,9].
The above demonstration is based on a weightless soil, but it is also applicable to soils with self-weight (γz) and/or surface surcharge (q) because these only imply a shift in the absolute stress values, without changing the deviatoric values. It may also be checked that the same characteristic lines would be found for this case using Equation (A9). For example, if two points of the active wedge are studied, both right-hand sides of Equation (A9) are the same and equal to γ / ( 2 2 c u ) , which means that α must be constant in the active wedge and Γ changes according to γz.
Based on the slip-lines in Figure 2, a kinematically admissible velocity field may be established to obtain an upper bound for the problem. The velocity field is the upward movement of the active and passive wedges and the rotational displacement of an infinite number of soil wedges (constant radius and infinitesimal central angle) to form the three-quarter fan (see, for example, [21] for further details). This velocity field gives an upper bound value that coincides with the exact solution.

3.3. Very Shallow Failure

The most widely used approximate fitting expressions for obtaining the break-out factor (e.g., [11,12]) do not consider shallow depths (H/B < 1.5). The well-known and most obvious vertical slip mechanism provides a quite accurate expression Nc0 = 2 H/B. However, it is simply an upper bound in itself (kinematic admissible velocity field) and it cannot be the exact solution as the horizontal ground surface is a free stress boundary, where the slip lines should reach a π/4 angle, as is well explained by [20]. This author presents an analytical solution based on the characteristic (or slip-line) method, using some assumptions on the shape of the slip lines as observed in FELA. The solution is Nc0 = 1.956 H/B and matches extremely well his FELA results. From these results, it seems that it is likely the exact solution for embedment ratios up to approximately 1.3. Beyond this value, the assumptions on the geometry of the slip lines are no longer exact and the results slightly deviate for embedment ratios up to 2. Martin’s solution [20] is for a shallow plane-strain trapdoor, whose passive case coincides with the present problem for shallow depths.

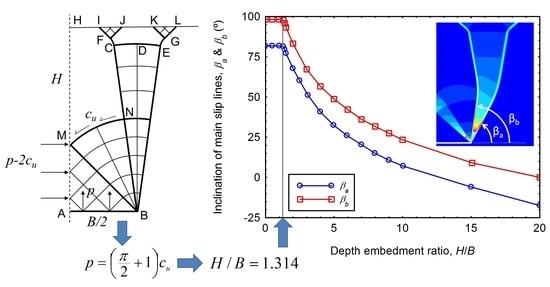
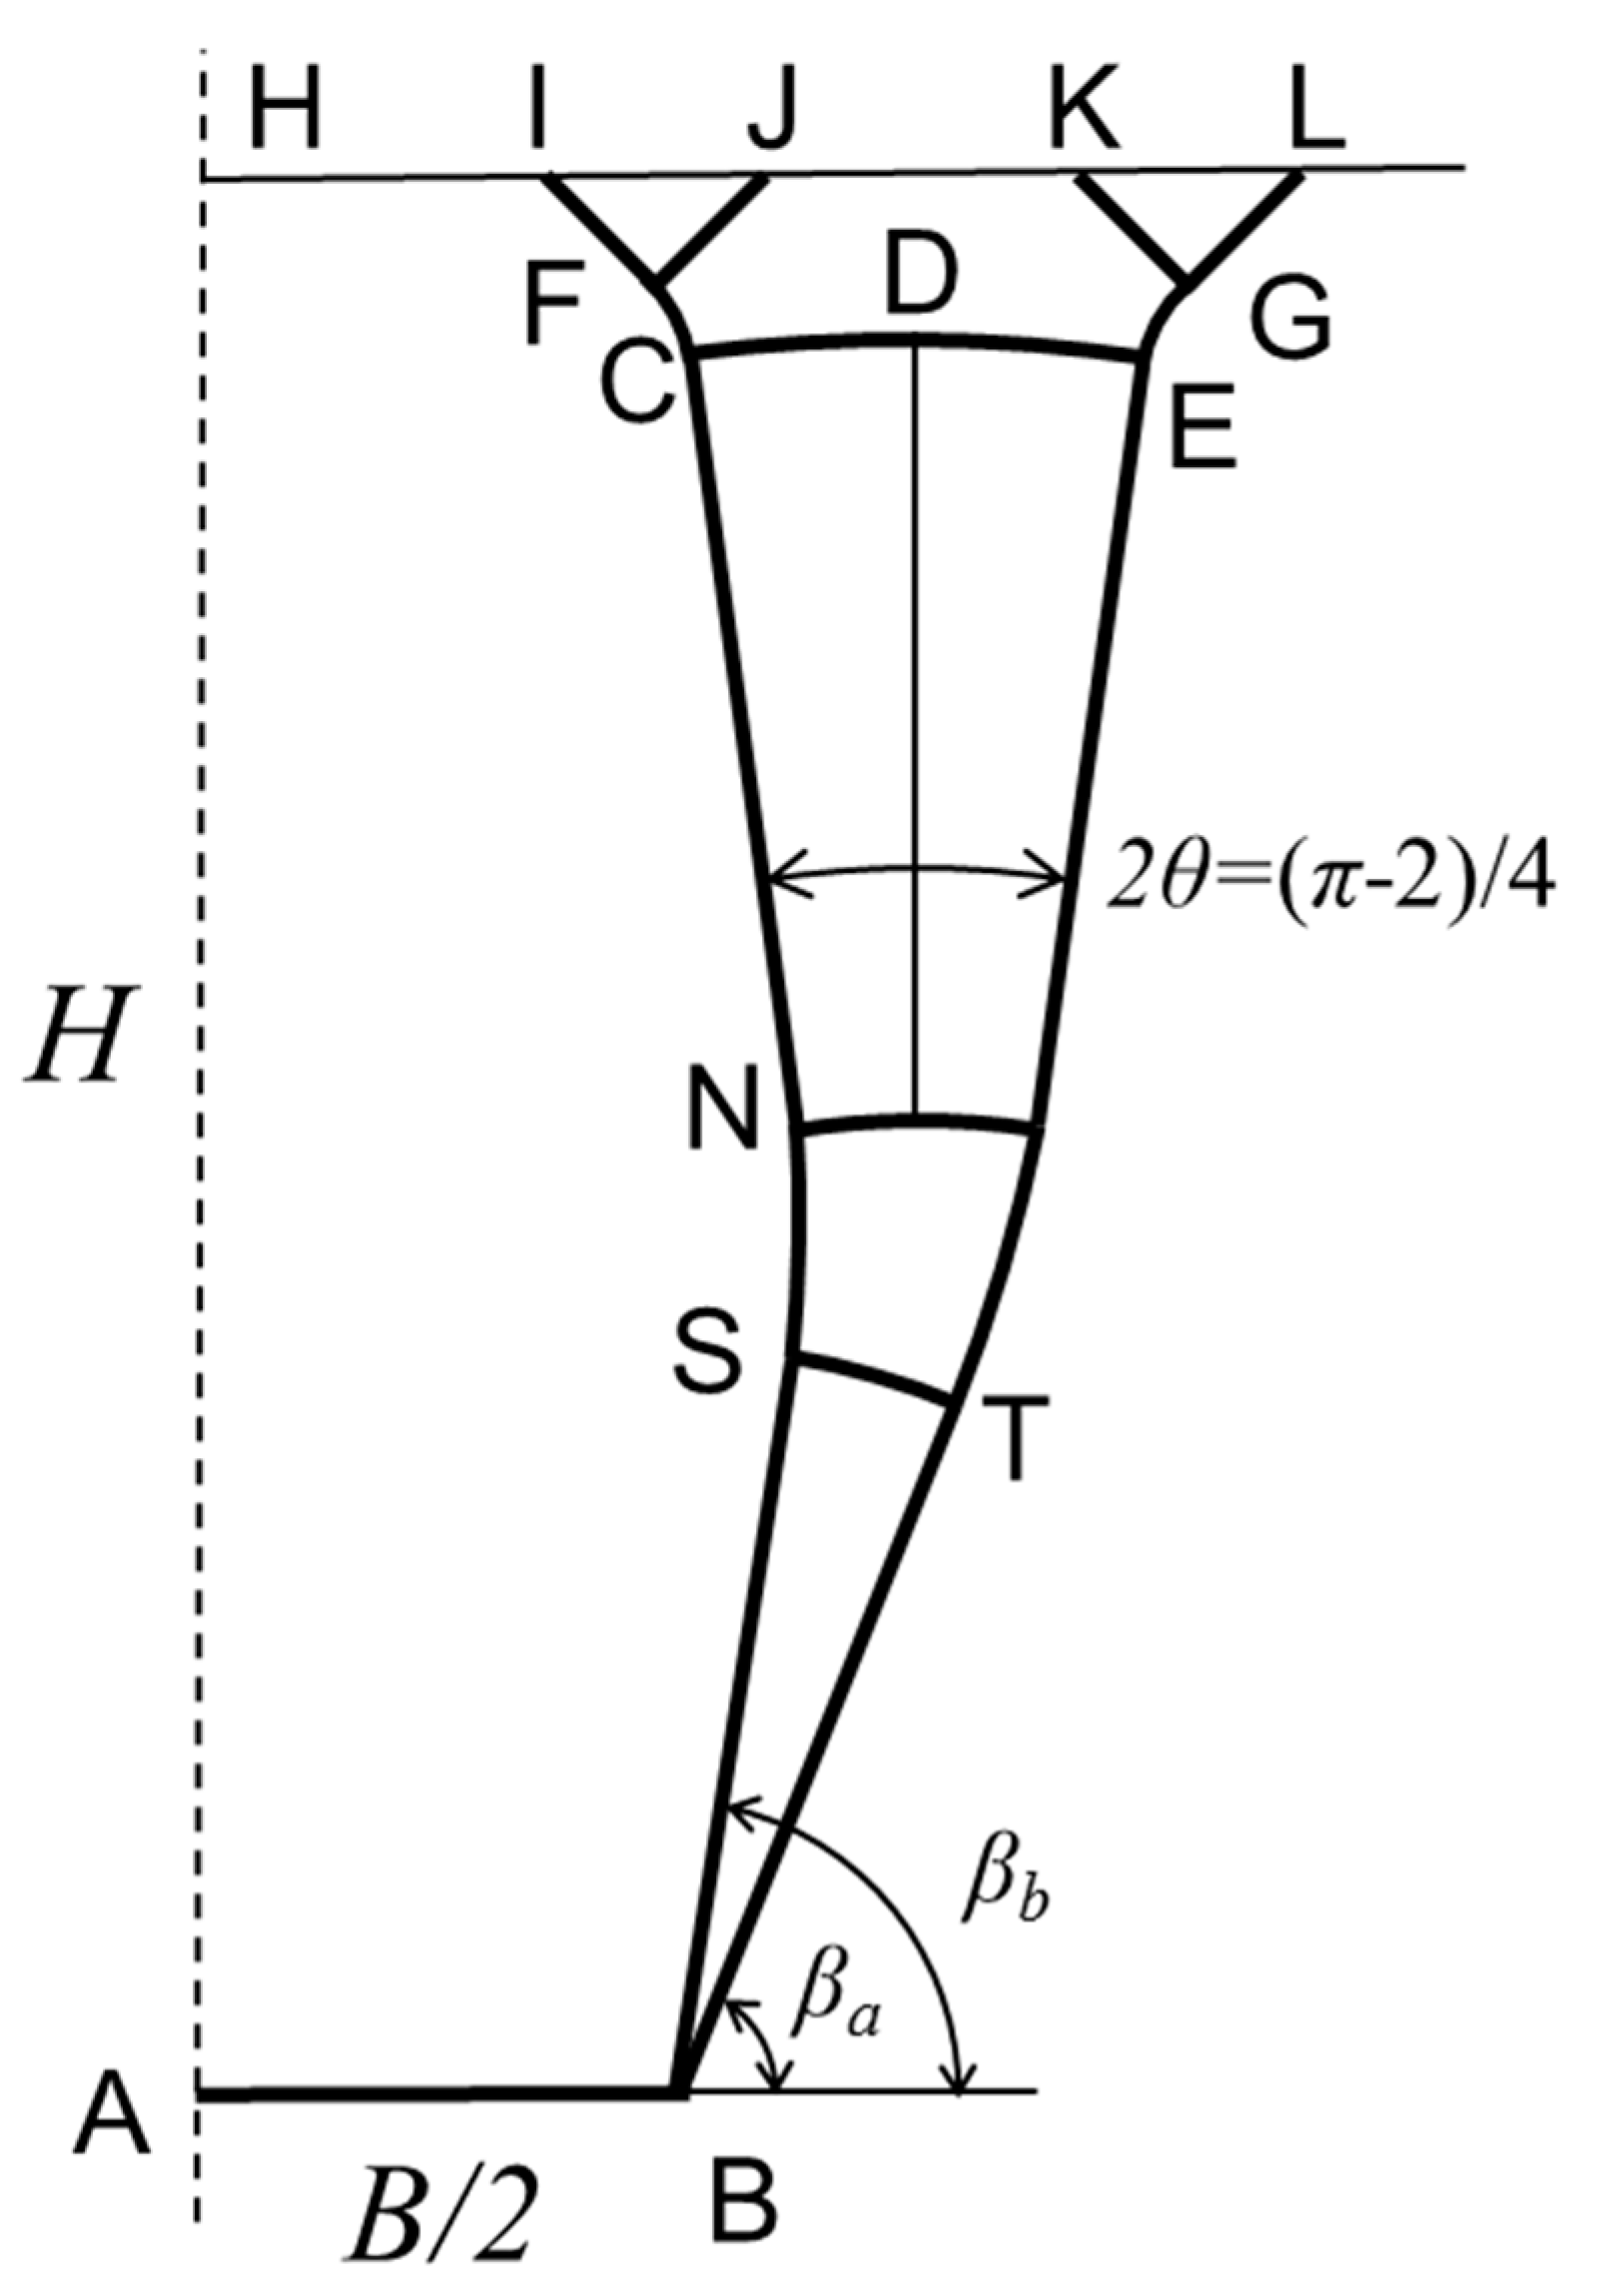
4. Proposed Analytical Limit for Very Shallow Failure

Martin [20] uses his FELA analyses to conclude that his solution is likely exact for embedment ratios up to approximately 1.3. Here, a specific analytical limit is proposed, this being the main analytical contribution of the present paper.
For shallow depths, the failure mechanism is quasi-vertical and consequently, the failure load is independent of the anchor width (B), i.e., the weightless break-out factor is linearly dependent on the embedment depth ratio (Nc0 = 1.956 H/B). Hence, the vertical stress on the anchor plate increases with depth. From Martin’s FELA analyses [20] and the finite element analyses shown in the next section, the limit for the very shallow failure mechanism appears when a triangular plastic rigid region forms near the anchor, because the horizontal stress is not enough to avoid yielding under that vertical stress (Figure 4a). The stresses in the ABM active rigid wedge correspond to the active case (Figure 4a), similarly to the deep case but for a different anchor load, i.e., p value. At the very shallow limit, Martin’s stress and velocity fields are still valid, and the proposed stress field is simply one particular case. Consequently, the inclination and stresses on the BNC slip line are the same as those given by Martin [20].
At the limit stress state for the very shallow mechanism (Figure 4a), equilibrium of moments may be imposed around the singular point B of the circular sector BMN (Figure 4b)
( π 4 θ ) c u D 2 + 2 c u θ D 2 2 = ( p c u ) D 2 2 ,
where D is the distance between points B and M, i.e., the radius of the circular fan, and θ is the angle defined in Figure 4b between a vertical line and one of the main slip lines. Simplifying and rearranging Equation (9), the limit value of the vertical stress of the anchor may be obtained,
p = ( π 2 + 1 ) c u .
Stresses whose lines of action go through point B, i.e., normal stresses on MN arc and cu shear stresses on BM and BN, are not plotted in Figure 4b.
Comparing the limit stress (Equation (10)) with the shallow weightless break-out factor (Nc0 = 1.956 H/B), the limit value of the embedment ratio for the very shallow mechanism in a weightless soil is obtained by:
H / B = 1.314 .
The analytical value of 1.314 agrees with the numerical observations provided by [20] of around 1.3.

5. Finite Element Analyses

5.1. Numerical Models

Numerical analyses were performed to provide accurate tabulated values of the weightless break-out factor (Nc0) varying with the depth embedment ratio (H/B) and to study the failure mechanisms for intermediate depths. The numerical analyses were performed using the finite element code Plaxis 2D 2015 [32]. The aim of the FEA was not to provide a very detailed simulation of a real case, but to provide validation and calibration of the analytical solutions (Figure 1).
The following basic properties were assumed: B = 1.5 m for the anchor width and cu = 50 kPa, γ = 0, E = 5 × 10⁸ kPa, ν = 0.499 to simulate a weightless rigid-plastic Tresca material. The anchor is assumed to be loaded in undrained conditions. In order to numerically simulate this process, the soil was assumed to be drained with a very high Poisson’s ratio (ν = 0.499). Slightly lower values of Poisson’s ratio provided exactly the same values for the pull-out capacity. Besides, a very high value of Young’s modulus (E) was also assumed to reproduce a rigid-plastic behavior of the soil. The constitutive model used within the numerical code was the one named “Mohr–Coulomb” [32] for drained conditions, but the parameters were chosen to reproduce a rigid-plastic Tresca behavior in undrained conditions, i.e., the friction and dilatation angles were set equal to 0, the cohesion as cu, and E and ν were chosen as explained above. The Tresca criterion is the common one to reproduce the undrained shear strength of clays, but more complex soil constitutive laws that could more realistically reproduce, for example, soil displacements (e.g., [30]), and linearly increasing strength with depth (e.g., [11,17,18]) or clay strength anisotropy, are beyond the scope of the paper.
Due to symmetry, only half of the problem was modeled, and the position of the bottom and external boundaries were varied to check their influence. The bottom boundary was fixed and roller vertical conditions were assumed for the lateral boundaries. A far enough external boundary was chosen for each depth embedment ratio. In order to encompass very shallow, shallow (intermediate) and deep failure, several embedment depths have been studied, which means relative embedment depths varying mainly between 0.5 and 10, but also including extreme cases up to 100 for completeness.
The soil was modeled as continuum elements using 15-node triangular elements. The anchor plate was modeled as a prescribed upward constant displacement because it is assumed to be infinitely rigid. Interface finite elements—defined by five pairs of nodes—were used at the bottom of the prescribed displacement, to ensure the immediate breakaway at the bottom part of the anchor. Focusing on this point, it was necessary to slightly prolong the interface length beyond the anchor (prescribed displacement) in order to avoid numerical issues. A sensitivity analysis was carried out to ensure accurate calculations. The analysis was performed in terms of I/B (%) vs Nc0 for a depth embedment ratio of 0.5 (Table 1), where I is the additional length of the interface element, so the length of the prescribed displacement is B/2 due to symmetry and the length of the interface is B/2 + I. A value of I/B = 0.333% allowed an accurate estimation of Nc0.
All the numerical simulations were performed using a small strain formulation, and a staged construction process was modeled. The natural soil was modeled with a horizontal ground surface and a constant depth. The geostatic initial stresses were null for the common cases (weightless soil, γ = 0), and only in the special cases were γ ≠ 0, and the geostatic initial stresses were generated using γ and K0. Later, the prescribed displacement (sz) was imposed. The anchor was modeled as “wished-in-place,” ignoring the changes in the natural soil due to the keying process (e.g., [16]).
Due to the fact that different embedment depths result in different failure mechanisms, two different mesh sensitivity analyses (for H/B = 0.5 and for H/B = 10, see Table 2) were performed to validate the coarseness of the finite element mesh. Local mesh refinements around the plate were applied in both cases (Figure 5).
Parametric analyses were performed on B, H, cu, and γ. It was confirmed that Equation (7) holds, and, consequently, only the influence of H/B is considered in the following (B was kept equal to 1.5 m and H was varied).

5.2. Numerical Results

Two main aspects were analyzed in this numerical study. On the one hand, the ultimate pull-out resistance values for several embedment depths were obtained. On the other hand, a study of the different failure mechanisms was derived from the variation in those embedment depths. Regarding the capacity of the anchor, the results of the different simulations performed are shown in Table 3 in terms of the break-out factor vs. depth embedment ratio. Two and three decimals were considered for H/B > 10 and H/B ≤ 10, respectively, as that is assumed to be the precision of the finite element simulations. Although cases where H/B > 10 are not useful from a practical point of view, because the deep failure mechanism will be reached if the soil weight is included, they are provided here as benchmark values for validation. The results are compared to those obtained by [11,12] in Figure 6. Merifield et al. [11] proposed an analytical expression to fit their upper and lower bounds obtained with FELA. Those equations give a narrow range of appropriate values for embedment depth ratios higher than 1.5. Yu et al. [12] gave an analytical expression to fit their finite element analyses. Graphically, their expressions agree with the finite element analyses performed here for embedment depth ratios higher than 1.5. For lower values, these fitting expressions should not be used, and the solution by Martin [20] (Nc0 = 1.956 H/B) is the appropriate expression. For these very shallow failure mechanisms, Table 4 shows that the presented finite element analyses agree well with Martin [20].
The finite element analyses were also used to study the different types of failure mechanisms at different embedment ratios. The incremental shear strains were used to identify these failure mechanisms. The absolute value of these incremental shear strains is not relevant, because, in a failure situation, the strains and displacements are not defined, and the calculation procedure was stopped when the mechanism was clearly shown (Figure 7). Total displacement graphs and other results were also analyzed, showing the same failure mechanisms. For very shallow failure mechanisms, the slip line is not a vertical line, as is well explained by Martin [20]. Some authors (e.g., [12]) fail to properly identify this failure mechanism. Exactly the same slip-lines as found by Martin [20] were found here. Smith and Gilbert [33] also found the same mechanism using limit equilibrium analyses. It is worth noting that rotational displacements should be considered, and, if only translational displacements are taken into account, the misleading vertical slip line is found. As proved by Martin [20], the failure mechanism is a vertical fan with a central angle of 16.4°, limited by two main slip lines that start from the anchor edge. Near the ground surface, these two main slip lines bend toward the theoretical angle at the ground surface (π/4), where two small passive wedges appear (Figure 7). The two main slip lines of the fan form angles of βa and βb with the horizontal (Figure 8).
For very shallow cases (H/B ≤ 1.3), both lines are symmetrical with respect to the vertical. For a depth of H/B = 1.4 (exactly 1.31 as analytically shown above), these two main slip-lines start to have a slight bend at approximately half of the depth H/2 and an active wedge appears above the strip anchor. This also happens for higher depths and there is a decrease in βa and βb angles. Remarkably, the difference between βa and βb seems to remain constant and equal to about 16° for the different embedment ratios (Figure 8). For high embedment depth ratios, namely 15 and 20, the accuracy in βa and βb was poorer than 1°. An analytical justification of the conservation of this angle equal to 16.4° is provided in Appendix B.
When the anchor is located deep enough, the failure mechanism changes and it no longer reaches the ground surface, as can be seen in Figure 9, which perfectly agrees with the exact analytical solution (Figure 2). The specific depth for which the deep failure appears for the weightless case was difficult to measure accurately, but it was reached for H/B = 50 (Table 3). For the plotted case in Figure 9, non-weightless soil was considered to improve the visualization of the failure mechanism.
The soil unit weight, a surface surcharge, or the undrained shear strength influences the limit depth for which the intermediate or the deep failure mechanisms are reached, but for a specific mechanism, the shape only depends on the embedment ratio.

6. Conclusions

The pull-out capacity and the failure mechanisms of strip plate anchors embedded in purely cohesive soil under undrained conditions were studied. Tabulated values of the weightless break-out factor were provided using finite element analyses, and three different failure mechanisms were identified, namely very shallow (quasi-vertical), shallow or intermediate (semi-vertical), and deep (rotational).
For deep anchors, the exact analytical solution (Nc = 3π + 2) [23,24] is independent of the anchor plate roughness for a rigid soil and is sometimes not properly referred in the literature. Its derivation was presented for completeness and clarity.
For very shallow depths, Martin’s analytical solution [20] (Nc0 = 1.956 H/B) is likely to be the exact solution, and an analytical limit of H/B = 1.314 for weightless soil without surface surcharge was derived here. For cases with soil weight or surface surcharge, the vertical stress on the anchor of p = (π/2 + 1)cu gives the limit between the very shallow and the shallow (intermediate) failure mechanisms.
For intermediate cases, the failure mechanism presents a rigid active wedge over the anchor plate, and two main slip lines start from the anchor edge and reach the ground surface. The angle between those two slip lines is constant and equal to 16.2°, and its bisection is initially vertical for shallow failure and progressively decreases with depth. This finding may be useful for a future derivation of the analytical solution of shallow (intermediate) cases, which is one that is still missing.
The present study does not consider installations effects (e.g., [16,34,35]) or more complex soil constitutive laws that could more realistically reproduce, for example, soil displacements (e.g., [30]) and linearly increasing strength with depth (e.g., [11,17,18]) or clay strength anisotropy.

Author Contributions

J.C. (Jorge Castro) developed the analytical formulations, particularly the limit for very shallow failure, and supervised the finite element analyses, F.C. performed the finite element analyses and J.C. (Jorge Cañizal) and C.S. provided senior advice and supervision. Conceptualization, J.C. (Jorge Castro); investigation, F.C. and J.C. (Jorge Castro); methodology, F.C. and J.C. (Jorge Castro); resources, J.C. (Jorge Cañizal) and C.S.; supervision, J.C. (Jorge Cañizal) and C.S.; visualization, F.C. and J.C. (Jorge Castro); writing—original draft preparation, F.C. and J.C. (Jorge Castro); writing—review and editing, J.C. (Jorge Castro) and J.C. (Jorge Cañizal). All authors have read and agreed to the published version of the manuscript.

Funding

This research received no external funding.

Conflicts of Interest

The authors declare no conflict of interest.

Appendix A. Methods of Characteristics in a Rigid-Plastic Tresca Material

This appendix details the application of the methods of characteristics in a rigid-plastic Tresca material, i.e., a material that is rigid in the elastic regime until reaching the Tresca yield criterion. In plane-strain conditions and Cartesian coordinates, the equations of internal equilibrium are:
σ x x + τ x z z = γ x , τ x z x + σ z z = γ z ,
where γx and γz are body unit forces in the OX and OZ directions, respectively. Usually, γx = 0 and γz = γ (unit weight of the soil). The sign convention is indicated in Figure 1 (compressions are assumed as positive).
In the plastic zone, the yield criterion (Tresca) must also be obeyed:
( σ x σ z 2 ) 2 + τ x z 2 c u = 0 .
The advantage of plane-strain conditions is that Equation (A1) is a linear system of two partial differential equations (PDE) with three variables (σx, σz, τxz), which are linked by Equation (A2). The only problem is that Equation (A2) is not linear. Therefore, it is convenient to substitute (σx, σz, τxz) by the center of the Mohr’s circle (average stress, σm) and the position of its pole (α) (Figure A1)
σ m = σ x + σ z 2 , α = 1 2 arctg 2 τ x z σ z σ x = 1 2 arctg τ x z c u ,
or inversely
σ x = σ m + c u cos 2 α , σ z = σ m c u cos 2 α , τ x z = c u sin 2 α ,
to obtain a linear system of two PDE with just two variables (σm, α). It is also convenient to replace σm by
Γ = σ m 2 c u .
Figure A1. Variables for the method of characteristics.
Energies 13 03853 g0a1
Hence, Equation (A1) is now
Γ x sin 2 α α x + cos 2 α α z = 0 , cos 2 α α x + Γ z + sin 2 α α z = γ 2 c u .
Combining (adding) the two equations in Equation (A6), after multiplying the second equation by tan ( α + π 4 ) or tan ( α π 4 ) , the following equations are obtained:
( Γ + α ) x + tan ( α + π 4 ) ( Γ + α ) z = γ tan ( α + π 4 ) 2 c u , ( Γ α ) x + tan ( α π 4 ) ( Γ α ) z = γ tan ( α π 4 ) 2 c u .
Multiplying Equation (A7) by cos ( α + π 4 ) and cos ( α π 4 ) , respectively, the Kötter equations for this case are obtained:
cos ( α + π 4 ) ( Γ + α ) x + sin ( α + π 4 ) ( Γ + α ) z = γ sin ( α + π 4 ) 2 c u , cos ( α π 4 ) ( Γ α ) x + sin ( α π 4 ) ( Γ α ) z = γ sin ( α π 4 ) 2 c u .
Thus, the characteristic lines form angles of β 1 = ( α + π 4 ) and β 2 = ( α π 4 ) with the OX axis, and the first terms of Equation (A8) are the partial derivatives of the functions ( Γ + α ) and ( Γ α ) in the directions S1 and S2, respectively, which are the directions of the characteristic lines (or slip-lines).
Using the characteristic directions, Equation (A8) may be simplified to:
( Γ + α ) S 1 = γ sin ( α + π 4 ) 2 c u , ( Γ α ) S 2 = γ sin ( α π 4 ) 2 c u .
If γ = 0, Equation (A9) means that ( Γ + α ) and ( Γ α ) are constant in the directions S1 and S2, respectively, and they are known as the Henky equations (e.g., [22] pp. 135–136). This allows for an analytical integration in some cases, such as for deep strip anchors. For the sake of clarity and to avoid mathematical complexity, the equilibrium equations have been directly expressed here in their characteristic form using a simple substitution of stress variables, but alternate ways of presenting the characteristic method to solve hyperbolic equations exist, such as using the Riemann invariants or the plane-strain version of that used by Martin and Randolph [24] for polar coordinates. Further information on the characteristic method may be found, for example, in Hill [22] and Davis [36].

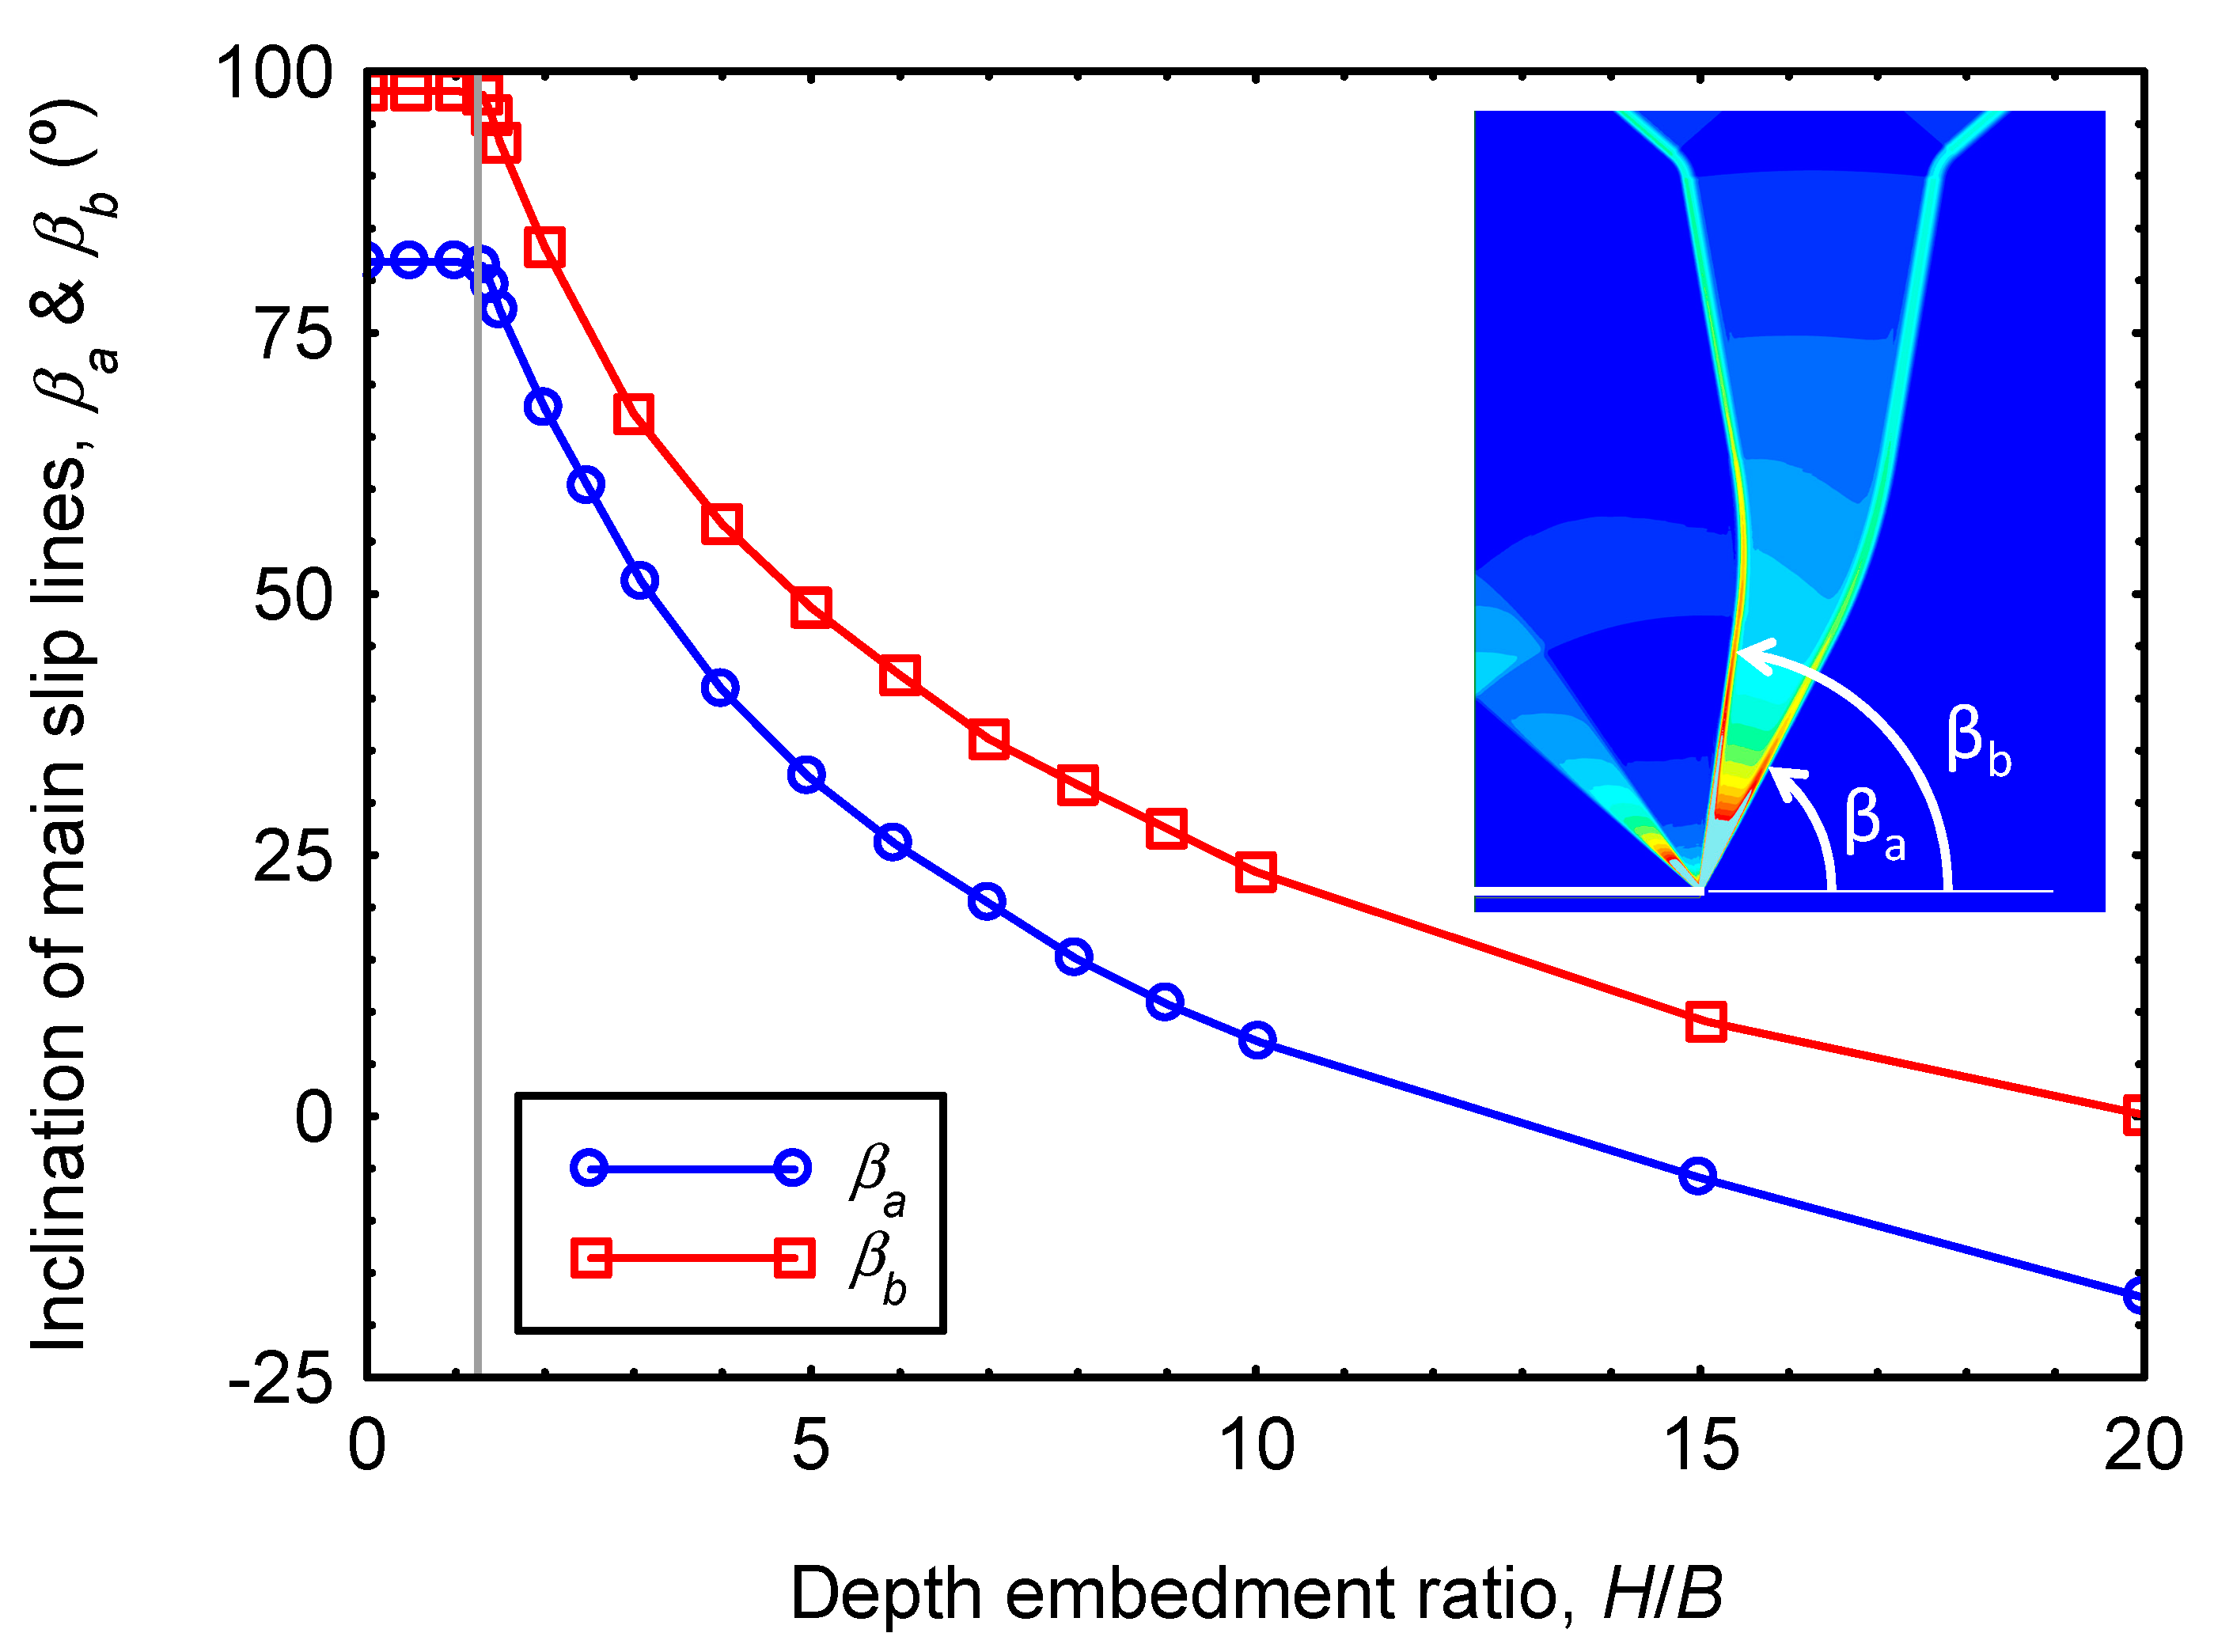
Appendix B. Conservation of the Angle between Main Slip Lines for Shallow Failure Mechanisms

The shallow (intermediate) failure mechanism preserves the two main slip lines that start at the anchor edge and reach the ground surface (Figure 8 and Figure A2). The part close to the ground surface is identical, but for its relative position and size, to that of the very shallow failure mechanism. Hence, similarly to the very shallow failure mechanism, imposing the equilibrium of the rigid region CDEGKJF, it may be demonstrated that the stress state is antisymmetric along the vertical line through D and that the angle between the two main slip lines (2θ) is equal to 16.4°.
Because of continuity of the stress state along the two main semi-vertical slip lines that emerge from the anchor edge and reach the ground surface, the normal stress on the BS straight line is
p B S = 2 c u ( π / 2 + 2 θ β b )
and on the BT straight line, it is
p B T = 2 c u ( π / 2 2 θ β a ) .
Finally, the shear stress along the ST arch, whose center is B, is cu. Hence, imposing an equilibrium of moments around the singular point B of the circular sector BST (Figure A2), the angle between those slip lines at the anchor edge (βbβa) may be obtained:
2 c u ( π / 2 + 2 θ β b ) D 2 2 2 c u ( π / 2 2 θ β a ) D 2 2 = c u ( β b β a ) D 2 ,
β b β a = 2 θ = π 2 4 = 16.4 ° .
Figure A2. Slip lines that reach the ground surface for shallow (intermediate) failure mechanisms.
Energies 13 03853 g0a2

References

  1. Randolph, M.; Gourvenec, S. Offshore Geotechnical Engineering; Spon Press: New York, NY, USA, 2011. [Google Scholar]
  2. Giampa, J.R.; Bradshaw, A.S.; Gerkus, H.; Gilbert, R.B.; Gavin, K.G.; Sivakumar, V. The effect of shape on the pull-out capacity of shallow plate anchors in sand. Géotechnique 2019, 69, 355–363. [Google Scholar] [CrossRef] [Green Version]
  3. Wang, D.; Hu, Y.; Randolph, M.F. Three-dimensional large deformation finite-element analysis of plate anchors in uniform clay. J. Geotech. Geoenviron. Eng. 2010, 136, 355–365. [Google Scholar] [CrossRef]
  4. Terzaghi, K. Stress distribution in dry and in saturated sand above a yielding trap-door. In Proceedings of the International Conference on Soil Mechanics and Foundation Engineering, Harvard, MA, USA, 22–26 June 1936; Volume 1, pp. 307–311. [Google Scholar]
  5. Vesic, A.S. Breakout resistance of objects embedded in ocean bottom. J. Soil Mech. Found. Div. 1971, 97, 1183–1205. [Google Scholar]
  6. Das, B.M. A procedure for estimation of ultimate capacity of foundations in clay. Soil Found. 1980, 20, 77–82. [Google Scholar] [CrossRef] [Green Version]
  7. Das, B.M. Model tests for uplift capacity of foundations in clay. Soil Found. 1978, 18, 17–24. [Google Scholar] [CrossRef] [Green Version]
  8. Gunn, M.J. Limit analysis of undrained stability problems using a very small computer. In Symposium on Computer Applications to Geotechnical Problems in Highway Engineering; Engineering Department, Cambridge University: Cambridge, UK, 1980; p. 530. [Google Scholar]
  9. Rowe, R.K.; Davis, E.H. The behaviour of anchor plates in clay. Géotechnique 1982, 32, 9–23. [Google Scholar] [CrossRef] [Green Version]
  10. Sloan, S.W.; Assadi, A.; Purushothaman, N. Undrained stability of a trapdoor. Géotechnique 1990, 40, 45–62. [Google Scholar] [CrossRef]
  11. Merifield, R.S.; Sloan, S.W.; Yu, H.S. Stability of plate anchors in undrained clay. Géotechnique 2001, 51, 141–153. [Google Scholar] [CrossRef]
  12. Yu, L.; Liu, J.; Kong, X.-J.; Hu, Y. Numerical study on plate anchor stability in clay. Géotechnique 2011, 61, 235–246. [Google Scholar] [CrossRef]
  13. Yu, L.; Zhou, Q.; Liu, J. Experimental study on the stability of plate anchors in clay under cyclic loading. Theor. App. Mech. Lett. 2015, 5, 93–96. [Google Scholar] [CrossRef] [Green Version]
  14. Elkhatib, S.; Randolph, M.F. The effect of interface friction on the performance of drag-in plate anchors. In Proceedings of the 5th International Symposium on Frontiers in Offshore Geotechnics, Perth, Australia, 19–21 September 2005; pp. 171–177. [Google Scholar]
  15. Maitra, S.; White, D.; Chatterjee, S.; Choudhury, D. Numerical modelling of seepage and tension beneath plate anchors. Comput. Geotech. 2019, 108, 131–142. [Google Scholar] [CrossRef]
  16. Cassidy, M.; Gaudin, C.; Randolph, M.; Wong, P.C.; Wang, D.; Tian, Y. A plasticity model to assess the keying of plate anchors. Géotechnique 2012, 62, 825–836. [Google Scholar] [CrossRef]
  17. Song, Z.; Hu, Y.; Randolph, M.F. Numerical simulation of vertical pullout of plate anchors in clay. J. Geotech. Geoenviron. Eng. 2008, 134, 866–875. [Google Scholar] [CrossRef]
  18. Liu, J.; Tan, M.; Hu, Y. New analytical formulas to estimate the pullout capacity factor for rectangular plate anchors in NC clay. Appl. Ocean Res. 2018, 75, 234–247. [Google Scholar] [CrossRef]
  19. Singh, V.; Maitra, S.; Chatterjee, S. Generalized design approach for inclined strip anchors in clay. Int. J. Geomech. 2017, 17, 04016148. [Google Scholar] [CrossRef]
  20. Martin, C.M. Undrained collapse of a shallow plane-strain trapdoor. Géotechnique 2009, 59, 855–863. [Google Scholar] [CrossRef]
  21. Chen, W.F. Limit Analysis and Soil Plasticity; Developments in Geotechnical Engineering; Elsevier: New York, NY, USA, 1975; Volume 7. [Google Scholar]
  22. Hill, R. The Mathematical Theory of Plasticity; Oxford University Press: Oxford, UK, 1950. [Google Scholar]
  23. Meyerhof, G.G. The ultimate bearing capacity of foundations. Géotechnique 1951, 2, 301–332. [Google Scholar] [CrossRef]
  24. Martin, C.M.; Randolph, M.F. Applications of the lower and upper bound theorems of plasticity to collapse of circular foundations. In Proceedings of the 10th International Conferecne on Computer Methods and Advances in Geomechanics, Tucson, AZ, USA, 7–12 January 2001; International Association of Computer Methods and Advances in Geomechnics: Tucson, AZ, USA, 2001; Volume 2, pp. 1417–1428. [Google Scholar]
  25. Rowe, R.K. Soil Structure Interaction Analysis and Its Application to the Prediction of Anchor Behavior. Ph.D. Thesis, University of Sidney, Sidney, Australia, 1978. [Google Scholar]
  26. Merifield, R.S.; Sloan, S.W.; Yu, H.S. Rigorous plasticity solutions for the bearing capacity of two-layered clays. Géotechnique 1999, 49, 471–490. [Google Scholar] [CrossRef] [Green Version]
  27. Yu, S.B.; Hambleton, J.P.; Sloan, S.W. Undrained uplift capacity of deeply embedded strip anchors in non-uniform soil. Comput. Geotech. 2015, 70, 41–49. [Google Scholar] [CrossRef]
  28. Merifield, R.S.; Smith, C.C. The ultimate uplift capacity of multi-plate strip anchors in undrained clay. Comput. Geotech. 2010, 37, 504–514. [Google Scholar] [CrossRef]
  29. Charlton, T.S.; Rouainia, M.; Gens, A. Numerical analysis of suction embedded plate anchors in structured clay. Appl. Ocean Res. 2016, 61, 156–166. [Google Scholar] [CrossRef]
  30. Ardebili, Z.A.; Gabr, M.A.; Rahman, M.S. Uplift capacity of plate anchors in saturated clays: Analyses with different constitutive models. Int. J. Geomech. 2015, 04015053. [Google Scholar] [CrossRef]
  31. Merifield, R.S.; Lyamin, A.V.; Sloan, S.W.; Yu, H.S. Three-dimensional lower bound solutions for stability of plate anchors in clay. J. Geotech. Geoenviron. Eng. 2003, 129, 243–253. [Google Scholar] [CrossRef] [Green Version]
  32. Brinkgreve, R.B.J.; Kumarswamy, S.; Swolfs, W.M. Plaxis 2015; Plaxis bv: Delft, The Netherlands, 2015. [Google Scholar]
  33. Smith, C.C.; Gilbert, M. Identification of rotational failure mechanisms in cohesive media using discontinuity layout optimization. Géotechnique 2013, 63, 1194–1208. [Google Scholar] [CrossRef] [Green Version]
  34. Blake, A.P.; O’Loughlin, C.D.; Gaudin, C. Capacity of dynamically embedded plate anchors as assessed through field tests. Can. Geotech. J. 2015, 52, 87–95. [Google Scholar] [CrossRef]
  35. Gaudin, C.; O’Loughlin, C.D.; Randolph, M.F.; Lowmass, A.C. Influence of the installation process on the performance of suction embedded plate anchors. Géotechnique 2006, 56, 381–391. [Google Scholar] [CrossRef]
  36. Davis, E.H. Theories of plasticity and the failure of soil masses. In Soil Mechanics-Selected Topics; Lee, I.K., Ed.; Butterworths: London, UK, 1968; pp. 341–380. [Google Scholar]
Figure 1. Definition and variables of the problem.
Energies 13 03853 g001
Figure 2. Slip lines and equilibrium for deep failure mechanism.
Energies 13 03853 g002
Figure 3. Mohr’s circles at: (a) Active wedge; (b) horizontal slip-line; (c) passive wedge.
Energies 13 03853 g003
Figure 4. Failure mechanism at the very shallow failure limit: (a) Proposed mechanism; (b) equilibrium of moments around point B for BMN circle sector.
Energies 13 03853 g004
Figure 5. Finite element mesh (H/B = 0.5).
Energies 13 03853 g005
Figure 6. Break-out factor vs. depth embedment ratio.
Energies 13 03853 g006
Figure 7. Failure mechanisms (incremental shear strains, finite element analyses (FEA)). Very shallow and shallow (intermediate) failure mechanisms.
Energies 13 03853 g007
Figure 8. Inclination of main slip lines.
Energies 13 03853 g008
Figure 9. Slip lines and equilibrium for deep failure mechanism.
Energies 13 03853 g009
Table 1. Sensitivity analyses of the interface length (H/B = 0.5).
I/B(%)Nc0
0.330.9779
0.670.9768
1.000.9760
1.330.9749
Table 2. Mesh sensitivity analysis: (a) H/B = 0.5; (b) H/B = 10.
(a)
NOE 1Nc0
15,1770.97752
67920.97765
32640.97787
(b)
70,1237.7270
33,5537.7273
19,5477.7276
12,7357.7289
1 NOE: Number of finite elements.
Table 3. Break-out factor vs. depth embedment ratio.
H/BNc0
0.50.978
11.957
1.32.543
1.42.734
1.52.913
23.662
34.720
45.459
56.022
66.477
76.858
87.189
97.473
107.728
158.70
209.38
3010.30
5011.42
Table 4. Break-out factor (Nc0) for shallow depths. Comparison with [20].
H/BFEA This StudyLB (FELA) [20]UB (FELA) [20]Average [20]Analytical [20]
0.50.9780.9760.9800.9780.978
11.9571.9531.9601.9571.956
1.32.5432.5392.5482.5442.543
1.42.7342.7282.7392.7342.739
1.52.9132.9072.9182.9122.934
23.6623.6543.6683.6613.912
FEA: Finite element analyses. LB: Lower bound. UB: Upper bound. FELA: Finite element limit analyses.

