Abstract
Since 2003, Brazil has striven to provide energy access to all, in rural areas, in an effort to economically empower the communities. Unpacking fuel stacking behaviour can shed light onto the speed of transition toward the exclusive use of advanced fuel types. This paper presents findings from surveys that were carried out with 14 non-electrified communities in a rural area of Rio Negro, Amazonas State, Brazil. We identify the fuel choice determinants in these communities using a multinomial logistic regression model and more generally discuss the validity and robustness of such models in the context of statistical validation and evaluation metrics. Specifically for the Amazonas communities considered in this study, the research showed that the fuel choice determinants are the age of household, the number of people at meals each day, the number of meals daily, the community, education of the household head, and the income level of the household. Moreover, given the Brazilian policies related to energy and sustainability, this region is not likely to reach the Sustainable Development Goals proposed by United Nations for 2030.
1. Introduction
Brazil faces chronic energy shortages, particularly in remote riverside communities in the Amazonas State where a lack of infrastructure, expertise and financial input [1] reduces the abilities of communities to meet their energy needs. According to Trindade and Cordeiro [2], using 2018 data, around 5% of the Amazonas State population in Brazil, distributed in 2261 communities and 41,167 households, do not have electricity. The Federal government’s rural electrification programme, known as Luz Para Todos (Light for All) [3] created in 2003 by decree 4873 and extended to 2018 by decree 8387 aims to provide energy access to all through mini-grids and standalone systems. According to Cabre et al. [1], energy is to be supplied by renewable, diesel and/or hybrid systems for remote communities in which grid connection is not a viable option. Among other benefits, these interventions promise to economically empower disadvantaged and unelectrified communities.
The Amazonas State is a peculiar area of Brazil, representing 18% of the whole country’s geographical area, surrounded and flooded by the Amazon river basin, with few roads and with extensive use of the rivers as the means of transport to its rural area. The State has an area equivalent to that of five countries in Europe combined (Portugal, Spain, France, and Germany), however the population is just 1.8% of those countries. Three Amazonas State policies are of particular importance:
- In 2007, the Amazonas State implemented the Programa Bolsa Floresta (Forest Assistance Programme), which pays families from 16 conservation areas to protect the forest. The focus of the programme is on introducing alternative economic efforts and ensuring regular visits to the communities in order to avoid deforestation [4]. However, there is no provision within the programme to provide additional electrification or regular educational activities.
- The adoption of protected forest areas with little oversight to check if the forest has been kept standing. This policy is not linked either with the need for electrification or education. According to the Amazonas State Environment Secretary [5] 57.3% of protected forest is divided among indigenous areas, State protected areas, municipality protected areas, and Federal protected areas. Partially due to this policy, Amazonas State has 97% of the original forest coverage intact.
- The Luz para Todos programme [3] aims to provide electricity to all parts of the state but has had limited reach in Amazonas State due to the difficulties in extending the grid to remote regions of the Amazon Rainforest. Considerable financial investment will be required to provide electricity to these remote regions and to ensure that this infrastructure is maintained.
The 17 Sustainable Development Goals (SDGs) [6] are divided into economic, social, and environmental goals and form a coherent part of the United Nation’s global development agenda. Goal 7 calls for universal access to affordable, reliable, and sustainable energy. Goal 7 is also related to the 2015 Paris Agreement to reduce greenhouse gas (GHG) emissions. Schunder and Bagchi-Sen [7] have shown that in developing countries, household energy consumption contributes substantially to GHG emissions.
In this paper, we investigate which societal factors contribute to the cooking fuel choices in the surveyed communities. Based on our results we evaluate whether the existing government policies applicable to the Amazonas State address the SDGs. We aim to identify whether there is significant progress towards the SDGs for this region. Investigations into the household fuel choices can indicate which socio-economic factors could contribute to communities reaching their SDG goals: by improving education; by increasing the income of residents; or by promoting and favouring the use of electricity from renewable sources.
As the economic status of households in these communities is expected to improve, He et al. [8] have shown that aspects of their daily life, such as the choice of cooking fuels, are expected to improve. In particular, the energy ladder hypothesis formulated based on data from Zimbabwe [9], Botswana [10], and Ghana [11] stipulates that the households would switch from using traditional fuels, such as Firewood, towards more sophisticated fuels, such as Liquefied Petroleum Gas (LPG) or electricity. (For simplicity, the term Gas is used to denote LPG for the rest of the paper.) The meta-analysis in [12] argues that this switching is needed as it brings benefits in terms of health and environmental sustainability. As seen in [12,13] these fuels are often categorised under solid and non-solid fuel types, or as primitive, transition, and advanced fuel types. Along these lines, Firewood is considered as a solid and primitive fuel, while Gas is considered an advanced and non-solid fuel. Charcoal, on the other hand, is considered a transition fuel by [12]. For reasons of health and environmental conservation, the move towards the more sophisticated fuel types like electricity is largely thought to be desirable. However, the energy ladder hypothesis has been disproved in many surveys and alternate models, such as the approach by Alem et al. [14] have been proposed. Recent studies, such as that by Mekonnen and Köhlin [15] in Ethiopia, have shown that instead of fuel switching, households rather tend to stack different kinds of fuels together, such as Firewood and Charcoal, or Charcoal and Gas or Electricity, or Firewood, Charcoal and Gas or Electricity in what is known as fuel stacking. Fuel stacking therefore represents a slower transition toward the exclusive use of advanced fuel types.
Moreover, the current consensus is that the choice of which fuels are stacked does not solely depend on household income, and as noted by Heltberg [16], does not significantly depend on income at all. Heltberg [17] has also hinted at other factors—such as the household occupancy, civil status and education level of the household head, the availability and access to fuel, and whether the household is a permanent or temporary residence—as influential in the choice of cooking fuel in different geographical regions. Muller and Yan’s review [18] shows that an abundance of these factors and their variability in different geographical regions underscore the importance of identifying which particular factors, among all such factors collected in a given survey, most significantly affect the household fuel choice. Identifying these significant factors, as done for rural Kenya [19] or rural China [20], yields information that directly influences energy policy, especially in many developing countries where the use of traditional fuels is more common.
Since not all factors collected in a given survey impact the fuel choice behaviour significantly, several works [21,22,23] have focused on identifying the significant factors (referred to as determinants) of household fuel choice in different countries and geographical regions, such as Ethiopia [14,15], Ghana [23], China [22], and Guatemala [16]. Heltberg [17] observed that determinants as identified in these studies tend to vary significantly between geographical regions due to differences in factors, such as education level and availability and access to fuel. For example, for a community with easy access to Gas, the fuel switching or stacking behaviour may be impacted by some other factor, such as income, to a different degree from a community with no easy access to Gas. The existing variations in these determinants and the extent of their unique influence in different geographical regions motivate our main contribution in this paper: the identification of fuel choice determinants in riverside communities in the Amazonas State of Brazil, using a multinomial logistic regression model [24]. The model is given in Section 2.1. To the best of our knowledge, very few works have been conducted to investigate the determinants of household fuel choice in this region. The work by Heltberg [17], which considers other parts of rural Brazil, achieves a coefficient of determination () for the model of fuel choice behaviour that leaves room for improvement (much of the variation is unexplained).
Furthermore, to identify the fuel choice determinants in riverside communities in the Amazonas State, we address the issues of model validation and feature selection and how they can potentially lead to drawing inaccurate conclusions about the determinants of household fuel choice in Section 2.1 and Section 4.4. In our context, model validation consists of reserving an independent dataset to test the correctness or accuracy of the trained multinomial logistic regression model in terms of predicting the fuel choice, while feature selection refers to identifying the optimal set of fuel choice factors to be used to develop the model.
The rest of the paper is organised as follows: Section 2 reviews relevant literature in the area of household fuel choice behaviour, as well as the statistical method often employed in the identification of the determinants of household fuel choice. In Section 3, we describe the materials and methods used in the collection of the dataset on which the analysis in this paper is based. We provide a detailed discussion of our results in Section 6 and conclude with recommendations on energy policy in riverside communities in the Amazonas State of Brazil in Section 7.
2. Literature Review
While clean and energy-efficient methods of cooking provide benefits in terms of health, environment, and sustainable development, their adoption has not been widespread in many developing countries [18], with Santillan et al. [25] finding a correlation () between the Human Development Index (HDI) of a country and its Multidimensional Energy Poverty Index (MEPI). For example, Olang et al. [26] notes that, while there is a general desire towards the adoption of advanced fuel types in Kenya, they have been hindered to some extent by poverty and other factors, such as availability and access to fuel. This has led to intense research for various regions, such as Afghanistan [27], Bhutan [28], Kenya [29], Turkey [30], and India [31], on which factors determine the transition from a primitive cooking fuel, such as Firewood to that of an advanced fuel, such as Gas or Electricity. Reviews, such as Kowsari and Zerriffi’s three dimensional energy profile proposition [32] and Heltberg’s multi-country study [33], show that the increasing body of evidence is enabling a better understanding of the phenomenon and factors surrounding energy use. Beyond the adoption of an advanced fuel type, the work by Tigabu [34] has also investigated what factors account for the sustained use of such advanced fuel types.
In early publications [9,10,11], the economic status of a household was originally thought to be the sole determinant of this transition, in what became known as the energy ladder hypothesis. However, several works have since disputed [9,11,16] this theory. For example, Malakar [35] showed that, in rural India, income had little influence on the choice of advanced cooking fuel. Additionally, increasing research has pointed to the phenomenon of fuel stacking [11,12,14,15], and have hinted at several other factors influencing this transition [9,11,16,36,37,38]. The review in Fredriks et al. [39] shows that there can be a wide range of socio-demographic factors that influence household energy behaviours and patterns. For example, Heltberg [16] identified the following factors as significantly influencing the energy choice behaviour in Brazil, Ghana, Vietnam, Guatemala, India, Nepal, Nicaragua, and South Africa: education level of the household, household size, percentage of females in the household, number of rooms in the household, household expenditure, access to electricity, and others. Rao and Reddy [31] identified further factors, such as the age of the household head and their religion as influencing the fuel choice behaviour in India, while Olang et al. [26] identified the cooking location as another key determinant of fuel choice in Kenya. On the whole, Saksena [40] classifies these fuel choice factors under household demand-side factors (such as household income) and community-wide supply-side factors (such as access to fuel), arguing from an economic perspective that supply-side factors may prevent a wealthy household from transitioning towards an advanced fuel type, even though there might be demand for the advanced fuel.
However, the factors identified in the above works do not apply to all geographical regions. For example, Pundo [41] found in rural Kenya no significant effect of age of the household or household size on the fuel choice in rural Kenya, while the study in [42] has found that in Pakistan, an increase in the age of the household resulted in an increase in energy consumption. Ouedraogo [43] found no significant influence of household ownership or gender on the fuel choice in Burkina Faso. Baral [44] has found that energy consumption and resource dependence varies over time with high-income households relying on more sophisticated fuels, such as Gas, while lower-income household continue to use traditional fuels such as fuel-wood. Mekonnen and Köhlin [15] found no influence on the percentage of females in a household on the fuel choice in Ethiopia.
The differences in the degree of influence of these factors across different geographical regions [17] have stirred up recent work [11,14,18,21] in understanding what the determinants of household fuel choice are in the different regions. Some existing work [14,15,16,17,21] regarding the determinants of household fuel choice behaviours in terms of fuel stacking have often been accompanied by rigorous statistical modelling of survey data, the most common technique being multinomial logistic regression.
Multinomial logistic regression is often employed to relate the various fuel choice factors, such as age or income of household head, to whether or not the household is likely to stack one or more fuel types. Because multinomial logistic regression is fundamentally a statistical classification technique, employing logistic analysis to identify the determinants of household fuel choice is essentially a statistical classification problem. In the general sense of the concept, statistical classification involves classifying objects into one of several distinct groups or categories, based on the features of the objects. In the context of household fuel choice, classification refers to the task of identifying which category of cooking fuels a household employs—such as Firewood and Charcoal, Charcoal and Gas, or Firewood, Charcoal and Gas—based on factors, such as those mentioned above, including income, household occupancy, occupation and civil status of the household head. The subset of the factors which contribute most significantly to identifying the cooking fuels a household employs is then identified as the set of determinants of household fuel choice.
This paper follows the same methodology to identify the determinants of fuel choice behaviour in riverside communities in the Amazonas State of Brazil. Furthermore, we validate the multinomial logit model and investigate the influence of feature selection on its performance.
2.1. Multinomial Logistic Regression
Multinomial logistic regression, more commonly referred to as multinomial logit, is a multi-class classification technique that is used in multiclass scenarios, i.e., in scenarios where the dependent variable to be predicted has more than two categories. Multinomial logit is a multi-class extension of logistic regression and, in the following, we provide a brief background for the method.
Suppose that the choice of cooking fuel (denoted by y) in a household is suspected to depend on the following variables: : household income; : occupation of the household head; : civil status of household head; : number of household occupants; and, : availability and access to different fuel types. In general, there will be up to d different variables considered. Let represent the set of these d variables, as:
Because the dependent variable y denotes the choice of cooking fuel, it is a class label or a categorical variable. For the moment, we suppose there are only two categories for y, namely: Gas (G) and Charcoal (C); in other words, we assume that a household uses either Gas (G) only or Charcoal (C) only. We may assign numerical attributes to y, as follows: Gas (G) and Charcoal (C) .
Logistic regression finds a linear combination of , parameterised by and b, and passes the results through a logistic function that is bounded between 0 and 1 to obtain a probabilistic score for the dependent variable y. More specifically, logistic regression seeks to find parameters and b that relate the independent variables to the dependent variable y, as follows [45]:
where
The parameters and b are normally found by maximising the log-likelihood of the dataset or by minimising the cross-entropy error [45]. The function that is given in (3) is the logistic function, which ensures that the output z remains within the range , which can be interpreted as the probability that a household uses gas or Charcoal.
The relationship in (3) can be rewritten as:
Because z is a probability value, (4) explicitly captures the influence of the independent variables on the log-likelihood of a household using a particular fuel type and not the other. In our particular scenario where we have only considered two categories for the dependent variable y, namely Gas (G) and Charcoal (C), an increase in z corresponds to an increase in the probability of Gas use according to (2). Thus, the relation in (4) is equivalent to:
Now, suppose that we have more than two class labels or categories for y, for example: (1) Gas (G); (2)Firewood (F); and, (3) Charcoal (C). In order to generalise logistic regression to these 3 categories, one of the categories is arbitrarily selected as the reference category, against which logistic regression models are trained for all other categories. For example, with category C (Charcoal) arbitrarily selected as the reference, the following logistic regression models are required:
Thus, from (6) and (7), the probability of each of the non-reference categories of y—can be obtained in terms of the probability of the reference category C, as follows:
Because the sum of the probabilities of all 3 categories must equal 1, the probability of the reference category can be solved for from the following:
from which the probability of any other category, i.e., Gas (G) and Charcoal (C) can be derived according to (10). In general, for a dependent variable y with k distinct categories, logistic regression equations are necessary and sufficient for multinomial logistic regression.
However, like many other statistical classification methods, the statistical analysis that has accompanied the identification of the determinants of household fuel choice while using multinomial logistic regression have several pitfalls that can lead to overestimating or underestimating the importance of some variables. In particular,
- The statistical models employed in the literature are not often validated [11,14,17,18,21]. Model validation involves testing the model of fuel choice behaviour on a test dataset (that was not used for training the model) in order to evaluate the correctness of the model. Given that multinomial logit is a classification technique, the validation that is required is in terms of how accurately the multinomial logit model predicts the cooking fuel categories for all households based on the factors or variables considered. This measure of accuracy is known as the classification accuracy. A satisfactory classification accuracy is necessary in order to draw robust conclusions regarding the statistically significant factors. Without model validation, any conclusions drawn regarding the determinants of household fuel choice, despite their being statistically significant, may be unreliable, since the logit models may have poor classification accuracy.
- Achieving poor classification accuracy from validation using the multinomial logit model may suggest one of two things: first, more sophisticated machine learning algorithms for classification, such as artificial neural networks [46], may be used in place of multinomial logit to achieve superior classification accuracy; with these machine learning approaches, different conclusions may be drawn regarding the determinants of household fuel choice. Secondly, the relationship between fuel choice behaviour and the variables considered may be inconsequential, despite some variables being statistically significant.
- Several surveys collect much information about a given household; some parameters tend to be irrelevant to the understanding of their fuel choice behaviour. For example, Pundo [41] collected information, such as the household labour activities and found that they have no significant influence on the energy choice behaviour. Understandably, such information is collected because it is safer to make no prior assumptions as to the factors that determine the fuel choice. However, these nuisance factors, when considered in the statistical model, often cause over-fitting and often lead to identifying the wrong factors as the predominant ones. Specifically, the inclusion of these nuisance factors in the statistical models tend to account for noisy samples, so that the model fails to correctly predict new samples. This problem makes feature selection an indispensable aspect of statistical modelling. Feature selection involves finding an optimal subset of the fuel choice factors to be used to develop the multinomial logit model in order to reduce the effect of overfitting that may result from including nuisance factors.
In our efforts to identify the determinants of fuel choice behaviour in riverside communities in the Amazonas, we simultaneously address the above issues of model validation and feature selection in order to obtain robust conclusions that can positively and consequentially influence energy policy.
3. Materials and Methods
In order to evaluate the determinants of household cooking fuel choice in Amazonas State riverside communities, a cross-sectional study was conducted in 14 riverside communities (593 households) located on the Rio Negro, Amazonas State, Brazil. These 14 communities are shown in Figure 1, Figure 2, Figure 3, Figure 4, Figure 5, Figure 6 and Figure 7. The GPS coordinates are provided in the datasets to allow for easier and clearer visualisation of these communities.
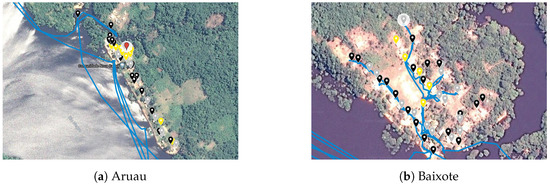
Figure 1.
Maps of communities surveyed: yellow indicates a community facility, grey indicates a household surveyed, black indicates a household not surveyed and the blue lines show the paths the surveyors took.
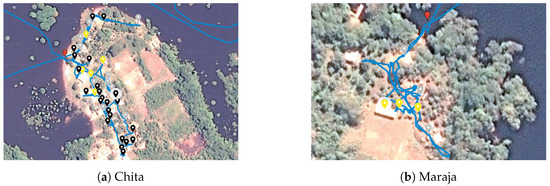
Figure 2.
Maps of communities surveyed: yellow indicates a community facility, grey indicates a household surveyed, black indicates a household not surveyed and the blue lines show the paths the surveyors took.
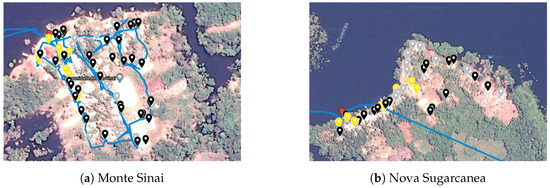
Figure 3.
Maps of communities surveyed: yellow indicates a community facility, grey indicates a household surveyed, black indicates a household not surveyed and the blue lines show the paths the surveyors took.
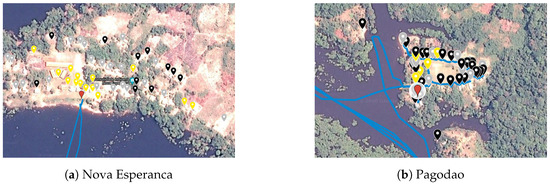
Figure 4.
Maps of communities surveyed: yellow indicates a community facility, grey indicates a household surveyed, black indicates a household not surveyed and the blue lines show the paths the surveyors took.
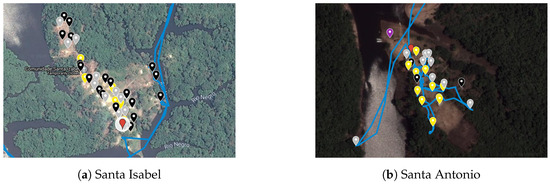
Figure 5.
Maps of communities surveyed: yellow indicates a community facility, grey indicates a household surveyed, black indicates a household not surveyed and the blue lines show the paths the surveyors took.
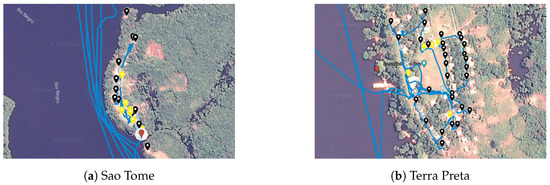
Figure 6.
Maps of communities surveyed: yellow indicates a community facility, grey indicates a household surveyed, black indicates a household not surveyed and the blue lines show the paths the surveyors took.
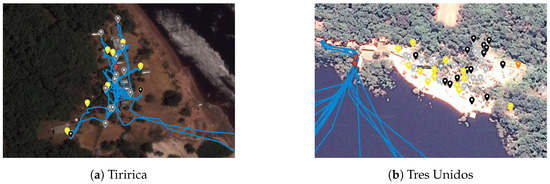
Figure 7.
Maps of communities surveyed: yellow indicates a community facility, grey indicates a household surveyed, black indicates a household not surveyed and the blue lines show the paths the surveyors took.
3.1. Data Collection
The study was conducted over a 9 week period between April and June 2017. Two surveys were deployed in each of the 14 communities. One survey targeted individual households, while the second focused on the community as a whole.
The household survey included open- and closed-ended questions that are based on the World Bank guidelines for questionnaire design for household energy use from living standards measurement studies [47]. One purpose of the households survey was to obtain data about their socio-demographic data, such as: income, education, house occupancy, house ownership, kitchen types, their choice of cooking fuels, their energy usage data, as well as their energy needs and aspirations. The repository in [48] contains the full dataset and complete listing of the response variables collected in this study. This paper only considers a relevant subset of these variables, as shown in Table 1.

Table 1.
Characteristics of the households.
For the households survey, participation was decided based on the following two criteria: (i) the respondent is an adult family member (over 18 years old) and (ii) the respondent is the primary cook or the primary decision maker regarding the choice of household cooking fuel.
The community survey was used to obtain data regarding the community as a whole, including the number of households, cost and availability of fuel, and the proximity of the communities to municipal areas. These data are necessary to understand in what respects the communities differ, such as the availability of cooking fuel. The community survey was answered in each of the 14 communities by the designated community leader, or their representative, where the community leader was not present. Table 2 summarises the locations of the communities and the availabilities and prices of Gas in these communities.
Table 2.
Community summary.
Before the administration of the surveys, several enumerators were trained on (i) the purpose of the study, (ii) obtaining informed consent, and (iii) how to administer and record the data. Ethical approval for the surveys was obtained at Coventry University. To collect the data, the trained enumerators surveyed each household by a face-to-face interview in Portuguese. The surveys were originally designed in English and then translated to Portuguese by a native speaker. The collected survey data were then translated to English. The English translation was checked by a native English speaker for understanding.
3.2. Responses
Assuming a normal distribution, the required number of samples n necessary to guarantee a margin of error of at a certain confidence level is given by [49]:
where z is the z-score corresponding to the required confidence level and q is the degree of variability in the population (which is often set to [49]). Thus, a sample size of 234 was initially established according to (11) as necessary in order to identify the determinants of the fuel choice behaviour in the 14 communities with a margin of error and a confidence level. From the fieldwork, however, we obtained a total of 179 responses, which was lower than the target number of 234. Table 3 shows the rate of response in each community. The response rate was lower than expected due to the following reasons:
Table 3.
Breakdown of respondents by community.
- houses were unoccupied during the visit: people were either not permanently living in the community, or were working outside of the community, for example, fishing or doing agricultural work;
- houses were far outside the main village, therefore were inaccessible; and,
- the sizes of the communities were larger than official records, therefore the human resource required to cover all households was not available prior to the survey administration.
Before statistical analysis proceeded, pre-processing of the data was undertaken to remove invalid responses. The data were then filtered to only include households that responded to all of the required information for the analysis. Furthermore, each nominal categorical response variable was converted to numeric variables of one category less.
Energy-based surveys in developing countries are increasingly evidencing household expenditures as well as or rather than household incomes.
Following the guidelines from [50], while household expenditures is a reliable indicator of daily expenses, household income as a variable indicates overall household wealth, including how more than one individual within a household contributes to the household income. These data, along with other determinants, such as gender, education, and food insecurity, can measure the level of economic inequality in a particular context, which can be used to identify the demographic groups with household income levels that make them more at risk of energy insecurity.
In total, there were 150 usable responses, which corresponded to of the areas population. Therefore, at the confidence level, we can expect a margin of error of about 8% from (11). This is the error due to sampling that can be expected in the results of our analysis.
4. Identification of Fuel Choice Determinants
4.1. Energy Ladder Hypothesis
In this section, we attempt to verify the energy ladder hypothesis by identifying any correlation between the evolution of household fuels from primitive to advanced fuel types, with increasing income levels. In this paper, we employ three fuel types: Firewood (F); Charcoal (C); and, Gas (G), representing primitive, transition, and advanced cooking fuel types, respectively. First, we provide the distribution of the communities by their household fuel choice in Table 4 and by their income brackets in Table 5.
Table 4.
Fuel combinations. Only the fuel mixes in bold were used in the analysis.
Table 5.
Distribution of respondents by income bracket. MW represents the minimum wage, which is 998 BRL per month as of June 2019, equivalent to £205 per month.
From Figure 8, we observe a general decline of Firewood usage as the income level increases. However, rather than observing a proportionate gradual increase in Gas and Charcoal usage to suggest that households switch from Firewood to advanced and transitional fuel types as their income level increases, we observe no such obvious trend; this goes against the energy ladder hypothesis.
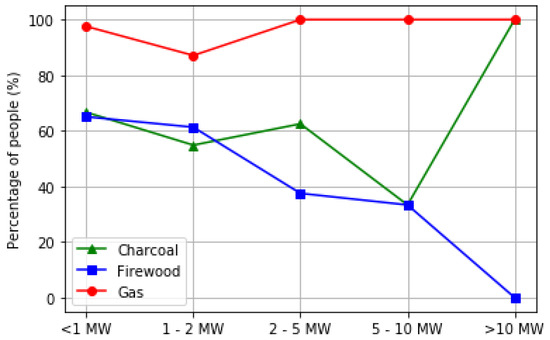
Figure 8.
Energy ladder hypothesis.
In opposition to the energy ladder hypothesis, as was mentioned earlier in Section 1, the work in [9,11,16] has shown that households generally tend to stack multiple fuel types for reasons not due to income alone. To identify the other determinants of household fuel choice, the problem is formulated as a classification task, where the classes are the fuel mix or combinations of the 3 fuel types considered, i.e., Firewood (F), Charcoal (C), and Gas (G). Table 4 shows these fuel mix or combinations.
4.2. Multinomial Logistic Regression
In the determination of household fuel choice by multinomial logit, the multiple classes are represented by the different fuel combinations used in the households (Table 4). However, in our survey, there are very little data belonging to the fuel mix categories: 2, 4, and 6 (Table 4). Consequently, these three categories are excluded, as their inclusion leads to numerical instability in the statistical computations, and thus we end up with 4 fuel mix categories for our multinomial logit analysis, i.e., , and 7.
Multinomial logit expresses the relative log-likelihood of any two of these categories as a linear model. To illustrate, let y, as before, represent the dependent variable, which is the indicator of the fuel combination, with 4 different discrete outcomes: , and 7, as given in Table 4. Additionally, let be a vector representing the set of all 14 independent variables as given in Table 1. Subsequently, a multinomial logit model can be expressed using the following equation:
where the vector and the bias are the parameters of the linear model that are fit to the data. Essentially, (12) provides the log-likelihood that a household would employ Gas only (Class 1) as a cooking fuel as opposed to stacking Charcoal and Gas (class 3) as cooking fuels; by analysing the properties of the vector , it is then possible to infer what the determining factors informing such a behaviour are. Similar equations can be derived for the remaining fuel mix categories, as follows:
and
It will be noted that all of the probabilities in (12)–(14) are expressed relative to . These equations therefore consider class 3, which represents the Gas and Charcoal fuel mix (see Table 4), as the reference category.
In principle, the formulation of multinomial logit allows for any of the 4 fuel categories we have considered to be arbitrarily used as the reference category. However, we have used category 3 as the reference category, so that the results from the logit analysis would be easily interpretable in terms of understanding both fuel switching and fuel stacking behaviours. Specifically,
- By comparing class 1 to class 3, we are able to identify the factors responsible for households stacking Charcoal and Gas (class 5) instead of using Gas only (class 1).
- By comparing class 5 with class 3, we are able to identify the determining factors for a household that uses Firewood and Gas (class 5) as cooking fuels, switching the Firewood component to Charcoal (class 3).
- By comparing class 7 to class 3, we are able to identify the factors that are responsible for a household stacking Firewood, Charcoal and Gas (class 7) instead of using Charcoal and Gas (class 3) only for cooking.
Table 6 shows the results of multinomial logit on our dataset.
Table 6.
Multinomial logistic regression—all response variables.
4.3. Interpretation of Results
The following conclusions are drawn from the results in Table 6:
4.3.1. Charcoal and Gas vs. Firewood, Charcoal and Gas
The determinants of this fuel stacking behaviour are as follows: age of household head, the number of people at meals daily, and the community type.
- Age: the odds that a household that uses Charcoal and Gas only as a cooking fuels would stack Firewood, Charcoal, and Gas decreases for older household heads than younger household heads.
- Number of people at meals daily: the odds that a household that uses Charcoal and Gas as cooking fuels would stack Firewood, Charcoal and Gas increases with the number of people at meals daily.
- Community: the odds that a household that uses Charcoal and Gas as cooking fuels would stack Firewood, Charcoal and Gas increases if the household is in Santo Antonio than if it were in Aruau. This is likely due to the fact that Santo Antonio has no Gas availability and, hence, the households prefer to stack Firewood rather than access the nearest municipality.
4.3.2. Firewood and Gas vs. Charcoal and Gas
The determinants of this fuel switching behaviour are as follows: education of household head, number of meals per day, and the number of people at meals each day.
- Education: the odds that a household that uses Charcoal and Gas as cooking fuels would switch the Charcoal component to Firewood decreases as the education level of the household head increases.
- Number of meals per day: the odds that a household that uses Charcoal and Gas as cooking fuels would switch the Charcoal component to Firewood increases with the number of meals per day.
- Number of people at meals daily: the odds that a household that uses Charcoal and Gas as cooking fuels would switch the Charcoal component to Firewood increases with the number of people at meals in a day.
4.3.3. Gas vs. Charcoal and Gas
The determinants of this fuel stacking behaviour are as follows: number of meals per day and the number of people at meals daily.
- Number of meals per day: the odds that a household that uses only Gas as a cooking fuel would stack Charcoal with it decreases with the number of meals per day.
- Number of males: the odds that a household that uses only Gas as a cooking fuel would stack Charcoal with it decreases with the number of people at meals daily.
These last couple of conclusions seem rather counter-intuitive, and we address this in Section 6, where we discuss the effects of not performing any feature selection prior to or as part of the model building.
4.4. Cross-Validation of the Multinomial Logit Model
The multinomial logit is one of the models of choice for identifying household fuel choice determinants, yet the model can lead to wrong conclusions being drawn about the predominant factors, without proper validation and feature selection. While the results of multinomial logit may point to the determinants of household fuel mix, it is impossible to tell how accurately the model is in terms of predicting the fuel mix categories that different households employ, without proper validation. Consequently, if a multinomial logit model has a low predictive accuracy, the determinants pointed out by the model are not reliable. For example, the model that is given in Table 6 has an average accuracy of only in terms of predicting the true fuels households use. Thus, for example, the conclusion that income may be a determining factor for a household that uses Firewood and Charcoal as cooking fuels, to switch the Charcoal component to Gas (as shown in Section 4.3.2), may be dubious, due to the relatively low accuracy of the model. We will demonstrate on our dataset, however, that after proper validation and feature selection, a different conclusion may be drawn regarding the predominant factors that influence the choice of fuel mix.
In statistics, cross-validation involves partitioning an available dataset into a number of folds: one fold, known as the test set, is used for testing or validating the multinomial logit model, while the remaining folds, known as the training set, is used to train the model in the first place. Approaches for performing cross-validation abound, including K-fold, Leave-one-out, and bootstrapping. In this paper, we have employed K-fold cross-validation (with [51]) which involves partitioning the dataset into 10 folds, such that the multinomial logit model is developed on each set of 9 folds, and tested on the tenth fold in terms of its classification accuracy. We have used K-Fold validation because it ensures that each data sample is used for both training the multinomial logit model and for testing it, as well as ensures that the model is tested only once on each data sample.
5. Effects of Feature Selection
Often, not all of the response variables gathered in a survey are relevant in determining the fuel choice behaviour of households; examples include the type of plantations or the number of pets in the household. Other response variables may be redundant in the presence of others; for example, in a community where there is a fairly equal number of household occupants, the number of males in the household may be redundant, if the number of females is already considered. The inclusion of these redundant and irrelevant response variables in the multinomial logit model can lead to overfitting of the model, and may highlight the wrong determinants.
Feature selection involves selecting the optimal subset out of a set of response variables (features), which does not contain redundant or irrelevant response variables, so that the trained model suffers a reduced effect of overfitting. For a dataset with n response variables, there are subsets that may be formed from the set of n features. The simplest way to choose the best performing subset is to perform cross-validation on each one of the subsets, i.e., for each one of the subsets, a multinomial logit model is trained and tested on a test fold. The subset that yields the best classification or predictive accuracy is chosen as the optimal subset. This approach to feature selection is known as a wrapper. Because wrappers involve exhaustively evaluating the cross-validation predictive accuracy for each of the subsets, they can be computationally expensive for large number of response variables n. Thus, other approaches, known as filters, in a bid to reduce the computation required, evaluate such metrics as the mutual information or correlation coefficient instead of the cross-validation predictive accuracy of the model. Alternatively, rather than an exhaustive searching through all possible subsets, other feature selection approaches employ local search procedures, such as variable neighbourhood search, so that they evaluate the performance for only a few probable subsets.
More practically, an L1-regularisation can be used to automatically select features during the training of the multinomial logit model. This does not present any computational burden, since there is no exhaustive search of the optimal features, but rather the regularisation penalty essentially forces the irrelevant features to zero.
In this paper, we employ the L1-penalty with the regularisation coefficient set at , which was optimised via cross-validation. This regularisation setting zeroed out four communities, which were thus excluded from the multinomial logit model.
Our results show that the set of all 14 response variables (that are expanded to 26, once nominal response variables are one-hot encoded) in Table 1 give a classification accuracy of , while the optimal subset of features (16 including one-hot encoded variables) obtained via the L1-regularisation, gives a classification accuracy of ; the difference between these two classification accuracies has a p-value of , and it is statistically significant at the confidence level.
Therefore, we proceed to train a multinomial logit model with only the optimal subset of features in order to identify the determinants of household fuel choice, after redundant and irrelevant features, such as the number of men and women in the household and the place of cooking, have been removed. We believe the number of men and women were found to be irrelevant features, because they likely contain no more information over the number of people at meals daily. Table 7 shows the results.
Table 7.
Multinomial logistic regression—optimal subset of response variables.
5.1. Interpretation of Results
The following conclusions are drawn from the results presented in Table 7:
5.1.1. Charcoal and Gas vs. Firewood, Charcoal and Gas
The determinant of this fuel stacking behaviour is the income level of the household. Specifically, as their income level increases, a household that uses Charcoal and Gas as their cooking fuels becomes less likely to add Firewood to their fuel mix.
5.1.2. Firewood and Gas vs. Charcoal and Gas
The determinant of this fuel switching behaviour is the number of people at meals each day. In particular, as the number of people at meals increases, a household that uses Charcoal and Gas as cooking fuels becomes more likely to switch the Charcoal component to Firewood.
5.1.3. Gas vs. Charcoal and Gas
For this fuel stacking behaviour, none of the determinants is significant, even at the confidence level. This contrasts with the counter-intuitive conclusions presented in Section 4.3.3, where the number of meals and the number of people at meals were identified as significant.
6. Discussion
The multinomial logit analysis of our dataset reveals the determinants of household fuel choice for both fuel switching and fuel stacking behaviours of the selected riverside communities in the Amazonas. Moreover, the effect of feature selection is observed in the determinants, which are highlighted by the statistical analysis.
6.1. Fuel Stacking: Charcoal and Gas vs. Firewood, Charcoal and Gas
From the multinomial logit model with and without feature selection, the decision of a household that uses Charcoal and Gas to stack Firewood, Charcoal and Gas is determined by the following: age of household, the number of people at meals each day, the community, and the income level of the household. The exact manner in which these factors affect the fuel choice are detailed in Section 4.3 and Section 5.1. For this fuel choice behaviour, performing feature selection makes a big difference in terms of which factors are the determinants. For example, without feature selection, the multinomial logit analysis shows that the age of household, the number of people at meals each day, and the community (Santo Antonio) are the most significant factors with unique effects of , , and , respectively; however, with feature selection, the most significant factor turns out to be the income level of the household only with unique effect of . Because the logit model with feature selection achieves a cross-validation classification accuracy that is statistically higher than that without model selection, it is more likely that the most significant factor is, in fact, the income level of the household. Thus, we note that energy policy that is based on the results of a multinomial logit model without feature selection may miss the importance of the income level of the household as a determinant of fuel choice.
6.2. Fuel Switching: Charcoal and Gas vs. Firewood and Gas
Comparing the multinomial logit results for with and without feature selection, the decision of a household that employs Firewood and Gas to switch the Firewood component to Charcoal is determined by the following: education of the household head, number of people at meals each day, and the number of meals per day. The exact manner in which these factors affect the fuel choice are detailed in Section 4.3 and Section 5.1. Without feature selection, all three factors happen to be significant determinants of this fuel choice behaviour; however, with feature selection, education of the household head, as well as the number of meals per day, is found not to be a significant factor. This disparity may significantly affect the direction energy policy takes. To resolve this disparity, the cross-validation accuracy of the statistical logit models with and without feature selection have to be considered. Because the cross-validation classification accuracy of the model with feature selection is significantly greater than that without any feature selection , it follows that the conclusions that are drawn from the model with feature selection are more statistically likely.
6.3. Fuel Stacking: Gas vs. Charcoal and Gas
With the multinomial logit model without feature selection, the decision of a household that uses Gas only to stack Charcoal and Gas is determined by the number of meals per day and the number of people at meals daily. In particular, the likelihood of a household only using Gas as a cooking fuel to stack Charcoal and Gas decreases as the number of meals or the number of people at meals per day increases. This conclusion is rather counter-intuitive, as one would expect that with more people and more meals in a day, the households would opt for a cheaper fuel source by stacking Charcoal to Gas instead of the reverse relationship. This may be attributable to the fact that the multinomial logit model was without feature selection, because with feature selection, none of the factors were found to be significant for this fuel choice behaviour, even at the confidence interval.
6.4. Qualitative Review of Results
From the experience of the team conducting the surveys their interpretation of the results is as follows:
- The residents from the communities are aware that knowledge is limited in the community. Knowledge can have a strong impact on what is done in the community, and these communities are aware of that. The difficulty is in changing this scenario. There are a several reasons that have lead to the current situation:
- The communities do not have enough schools as only two of the 14 surveyed communities had schools inside their boundaries, while the rest required a boat to attend classes.
- The schools are limited to teaching the fundamentals, as they lack resident teachers (a teacher that is available and would accept to move to the community). Teens that want to graduate from a higher education course need to move to the closest municipality near the community or to the Capital (Manaus).
- In most cases, people get married too early, usually before they turn 20. This also results in them stopping their education.
- There is a lack of comprehensive policies that are related to teaching for the Amazonas State.
- Gender is an issue in any place of the world, but it is even more complicated in the rural areas of underdeveloped countries. We identified a lot of women as community leaders (seven of 14), however those women have a double workload, as mothers (having at least three to four children) and managing the community. In gender, as a country, there has been a lot of improvement through self-governance but this is not the case in indigenous communities, where the cultural heritage and norms are strong.
7. Conclusions
The Sustainable Development Goals (SDGs) are a call for action by all countries to promote prosperity while protecting the planet. Goal 7 calls for universal access to affordable, reliable, and sustainable energy. It also encourages the adoption of renewable energy sources.
In this paper, we studied a total of 14 isolated riverside communities from the largest State of Brazil, in the heart of the Amazon Rainforest, none of them electrified until 2018. We were able to show, with statistical significance, that the fuel choice, fuel switching, and fuel stacking are dependent on several key factors, including: age of household, the number of people at meals each day, the number of meals daily, the community, education of the household head, and the income level of the household.
A key finding is that a model using feature selection produces a more statistically accurate model than one produced without this. Furthermore, this change alters which key factors are identified as significant.
It follows that an understanding of fuels use and stacking in communities can drive choice for energy empowerment that will form strong positive feedback loops towards several SDGs. Regarding the education determinant, we note that there are schools in 12 of the 14 communities, but those communities are mainly house elementary age pupils. If a dweller is to be educated further, they will migrate to the city. The funding for city education is not usually funded by government programs. However, some families receive a monthly stipend from the State governments income distribution program, Bolsa Flor This stipend is less than the minimum wage. Policies that lack an awareness of the local context may unintentionally reinforce inequalities. During the interviews, it became obvious that most resident community leaders are aware of the actual status quo of the three dimensions of sustainable development—economic, social, and environmental. Improvements can be made through an effective universal electrification program; by providing comprehensive opportunities for teachers of all levels, and through better income programs that are focused on regional potentials and local supply chains.
Furthermore, when considering that the 14 communities surveyed use diesel generators for electricity a few hours a day, we can conclude that, so far, the ‘Goal 7: Affordable and Clean Energy’ and ‘Goal 13: Climate Action’ are far from being reached in the Amazonas State. The communities in the Amazonas State in Brazil do not have highways or telecommunication infrastructure, only the rivers. The challenge is huge in terms of logistics and investment.
Extrapolating the results to the rest of the 2261 communities and 41,167 families that are without electricity in the Amazonas State, the SDGs will not be met until 2030. Moreover, the green house gas emissions will continue to rise.
Author Contributions
K.S.G., E.G., J.B. and A.B.T. were involved in conceiving the aims, objectives, scope and structure of the review. K.S.G. was responsible for the formal analysis. N.V. was responsible for editing, visualisation and data curation. All authors have been involved in reviewing and editing the manuscript drafts. All authors have read and agreed to the published version of the manuscript.
Funding
This research was funded through the 2016 Newton Fund Institutional Links call by the British Council, Amazonas Sustainable Foundation (FAS) and Schneider Electric.
Conflicts of Interest
The authors declare no conflict of interest.
References
- Cabre, M.M.; Kieffer, G.; Lopez-Pena, A.; Khalid, A.; Ferroukhi, R. Renewable Energy Policy Brief: Brazil; International Renewable Energy Agency (IRENA): Abu Dhabi, UAE, 2015. [Google Scholar]
- Trindade, A.; Cordeiro, L. Automated formal verification of stand-alone solar photovoltaic systems. Sol. Energy 2019, 193, 684–691. [Google Scholar] [CrossRef]
- Ministério de Minas e Energia. Programa LUZ Para Todo. 2003. Available online: http://www.mme.gov.br/web/guest/servicos/ouvidoria/perguntas-frequentes/programa-luz-para-todos (accessed on 13 July 2020).
- Amazonas Sustainability Foundation. Programa Bolsa Floresta. 2008. Available online: https://fas-amazonas.org/programas/pbf/ (accessed on 13 July 2020).
- Secretaria de Estado do Meio Ambiente—SEMA. Unidade De ConservaçãO. 2012. Available online: http://meioambiente.am.gov.br/unidade-de-conservacao/ (accessed on 13 July 2020).
- Nations, U. United Nations, Sustainable Development Goals. 2020. Available online: https://sdgs.un.org/goals (accessed on 15 June 2020).
- Schunder, T.; Bagchi-Sen, S. Understanding the household cooking fuel transition. Geogr. Compass 2019, 13, e12469. [Google Scholar] [CrossRef]
- He, M.; Liu, P.; Ma, L.; Chong, C.; Li, X.; Song, S.; Li, Z.; Ni, W. A systems analysis of the development status and trends of rural household energy in China. Energies 2018, 11, 1741. [Google Scholar] [CrossRef]
- Hosier, R.H.; Dowd, J. Household fuel choice in Zimbabwe: An empirical test of the energy ladder hypothesis. Resour. Energy 1987, 9, 347–361. [Google Scholar] [CrossRef]
- Hiemstra-Van der Horst, G.; Hovorka, A.J. Reassessing the “energy ladder”: Household energy use in Maun, Botswana. Energy Policy 2008, 36, 3333–3344. [Google Scholar] [CrossRef]
- Mensah, J.T.; Adu, G. An empirical analysis of household energy choice in Ghana. Renew. Sustain. Energy Rev. 2015, 51, 1402–1411. [Google Scholar] [CrossRef]
- Van der Kroon, B.; Brouwer, R.; Van Beukering, P.J. The energy ladder: Theoretical myth or empirical truth? Results from a meta-analysis. Renew. Sustain. Energy Rev. 2013, 20, 504–513. [Google Scholar] [CrossRef]
- Schlag, N.; Zuzarte, F. Market Barriers to Clean Cooking Fuels in Sub-Saharan Africa: A Review of Literature; Technical Report SEI-WP-8; U.S. Department of Energy Office of Scientific and Technical Information: Oak Ridge, TN, USA, 2008. Available online: https://mediamanager.sei.org/documents/Publications/Climate/market_barriers_clean_cooking_fuels_21april.pdf (accessed on 13 July 2020).
- Alem, Y.; Beyene, A.D.; Köhlin, G.; Mekonnen, A. Modeling household cooking fuel choice: A panel multinomial logit approach. Energy Econ. 2016, 59, 129–137. [Google Scholar] [CrossRef]
- Mekonnen, A.; Köhlin, G. Determinants of Household Fuel Choice in Major Cities in Ethiopia. Working Papers in Economics, No. 399. ISSN 1403-2465. 2009. Available online: https://gupea.ub.gu.se/handle/2077/21490 (accessed on 13 July 2020).
- Heltberg, R. Factors determining household fuel choice in Guatemala. Environ. Dev. Econ. 2005, 10, 337–361. [Google Scholar] [CrossRef]
- Heltberg, R. Fuel switching: Evidence from eight developing countries. Energy Econ. 2004, 26, 869–887. [Google Scholar] [CrossRef]
- Muller, C.; Yan, H. Household fuel use in developing countries: Review of theory and evidence. Energy Econ. 2018, 70, 429–439. [Google Scholar] [CrossRef]
- Gitau, K.; Mutune, J.; Sundberg, C.; Mendum, R.; Njenga, M. Factors influencing the adoption of biochar-producing gasifier cookstoves by households in rural Kenya. Energy Sustain. Dev. 2019, 52, 63–71. [Google Scholar] [CrossRef]
- Yao, C.; Chen, C.; Li, M. Analysis of rural residential energy consumption and corresponding carbon emissions in China. Energy Policy 2012, 41, 445–450. [Google Scholar] [CrossRef]
- Behera, B.; Ali, A.; Dil Bahadur, R. Patterns and determinants of household use of fuels for cooking: Empirical evidence from sub-Saharan Africa. Energy 2016, 117, 93–104. [Google Scholar]
- Hou, B.D.; Tang, X.; Ma, C.; Liu, L.; Wei, Y.M.; Liao, H. Cooking fuel choice in rural China: Results from microdata. J. Clean. Prod. 2017, 142, 538–547. [Google Scholar] [CrossRef]
- Karimu, A. Cooking fuel preferences among Ghanaian Households: An empirical analysis. Energy Sustain. Dev. 2015, 27, 10–17. [Google Scholar] [CrossRef]
- Hedeker, D. A mixed-effects multinomial logistic regression model. Stat. Med. 2003, 22, 1433–1446. [Google Scholar] [CrossRef]
- Santillán, O.S.; Cedano, K.G.; Martínez, M. Analysis of Energy Poverty in 7 Latin American Countries Using Multidimensional Energy Poverty Index. Energies 2020, 13, 1608. [Google Scholar] [CrossRef]
- Olang, T.A.; Esteban, M.; Gasparatos, A. Lighting and cooking fuel choices of households in Kisumu City, Kenya: A multidimensional energy poverty perspective. Energy Sustain. Dev. 2018, 42, 1–13. [Google Scholar] [CrossRef]
- Paudel, U.; Khatri, U.; Pant, K.P. Understanding the determinants of household cooking fuel choice in Afghanistan: A multinomial logit estimation. Energy 2018, 156, 55–62. [Google Scholar] [CrossRef]
- Das, S.; De Groote, H.; Behera, B. Determinants of household energy use in Bhutan. Energy 2014, 69, 661–672. [Google Scholar]
- Lay, J.; Ondraczek, J.; Stoever, J. Renewables in the energy transition: Evidence on solar home systems and lighting fuel choice in Kenya. Energy Econ. 2013, 40, 350–359. [Google Scholar] [CrossRef]
- Özcan, K.M.; Gülay, E.; Üçdoğruk, Ş. Economic and demographic determinants of household energy use in Turkey. Energy Policy 2013, 60, 550–557. [Google Scholar] [CrossRef]
- Rao, M.N.; Reddy, B.S. Variations in energy use by Indian households: An analysis of micro level data. Energy 2007, 32, 143–153. [Google Scholar]
- Kowsari, R.; Zerriffi, H. Three dimensional energy profile:: A conceptual framework for assessing household energy use. Energy Policy 2011, 39, 7505–7517. [Google Scholar] [CrossRef]
- Heltberg, R. Household Fuel and Energy use in Developing Countries: A Multi-Country Study; The World Bank: Washington, DC, USA, 2003; pp. 1–87. [Google Scholar]
- Tigabu, A. Factors associated with sustained use of improved solid fuel cookstoves: A case study from Kenya. Energy Sustain. Dev. 2017, 41, 81–87. [Google Scholar] [CrossRef]
- Malakar, Y. Studying household decision-making context and cooking fuel transition in rural India. Energy Sustain. Dev. 2018, 43, 68–74. [Google Scholar] [CrossRef]
- Masera, O.R.; Saatkamp, B.D.; Kammen, D.M. From linear fuel switching to multiple cooking strategies: A critique and alternative to the energy ladder model. World Dev. 2000, 28, 2083–2103. [Google Scholar] [CrossRef]
- Kebede, B.; Bekele, A.; Kedir, E. Can the urban poor afford modern energy? The case of Ethiopia. Energy Policy 2002, 30, 1029–1045. [Google Scholar] [CrossRef]
- Sharma, A.; Parikh, J.; Singh, C. Transition to LPG for cooking: A case study from two states of India. Energy Sustain. Dev. 2019, 51, 63–72. [Google Scholar] [CrossRef]
- Frederiks, E.R.; Stenner, K.; Hobman, E.V. The socio-demographic and psychological predictors of residential energy consumption: A comprehensive review. Energies 2015, 8, 573–609. [Google Scholar] [CrossRef]
- Saksena, S.; Tran, C.C.; Fox, J. Household cooking fuel use in rural and peri-urban Viet Nam: A multilevel longitudinal analysis of supply side factors. Energy Sustain. Dev. 2018, 44, 47–54. [Google Scholar] [CrossRef]
- Pundo, M.O.; Fraser, G.C. Multinomial logit analysis of household cooking fuel choice in rural Kenya: The case of Kisumu district. Agrekon 2006, 45, 24–37. [Google Scholar] [CrossRef]
- Aslam, M.; Ahmad, E. Impact of Ageing and Generational Effects on Household Energy Consumption Behavior: Evidence from Pakistan. Energies 2018, 11, 2003. [Google Scholar] [CrossRef]
- Ouedraogo, B. Household energy preferences for cooking in urban Ouagadougou, Burkina Faso. Energy Policy 2006, 34, 3787–3795. [Google Scholar] [CrossRef]
- Baral, S.; Basnyat, B.; Gauli, K.; Paudel, A.; Upadhyaya, R.; Timilsina, Y.P.; Vacik, H. Factors Affecting Fuelwood Consumption and CO2 Emissions: An Example from a Community-Managed Forest of Nepal. Energies 2019, 12, 4492. [Google Scholar] [CrossRef]
- Abu-Mostafa, Y.S.; Magdon-Ismail, M.; Lin, H.T. Learning from Data; AMLBook: New York, NY, USA, 2012; Volume 4. [Google Scholar]
- Haykin, S.S.; Haykin, S.S.; Haykin, S.S.; Elektroingenieur, K.; Haykin, S.S. Neural Networks and Learning Machines; Pearson Education: Upper Saddle River, NJ, USA, 2009; Volume 3. [Google Scholar]
- O’Sullivan, K.; Barnes, D.F. Energy Policies and Multitopic Household Surveys: Guidelines for Questionnaire Design in Living Standards Measurement Studies; The World Bank: Washington, DC, USA, 2006. [Google Scholar]
- Kojo Sarfo, G.; Gaura, E.; Brusey, J.; Trindade, A.; Verba, N. Brazil STAR Project Surveys. Zenodo. 6 July 2020. Available online: https://doi.org/10.5281/zenodo.3958956 (accessed on 24 July 2020).
- Israel, G.D. Determining sample size. In Program Evaluation and Organizational Development; IFAS: Gainesville, FL, USA, 1992. [Google Scholar]
- Glewwe, P.; Grosh, M.E. Designing Household Survey Questionnaires for Developing Countries: Lessons from 15 Years of the Living Standards Measurement Study; The World Bank: Washington, DC, USA, 2000. [Google Scholar]
- McLachlan, G.; Do, K.A.; Ambroise, C. Analyzing Microarray Gene Expression Data; John Wiley & Sons: Hoboken, NJ, USA, 2005; Volume 422. [Google Scholar]


© 2020 by the authors. Licensee MDPI, Basel, Switzerland. This article is an open access article distributed under the terms and conditions of the Creative Commons Attribution (CC BY) license (http://creativecommons.org/licenses/by/4.0/).