Article

Physicochemical Composition Variability and Hydraulic Conditions in a Geothermal Borehole—The Latest Study in Podhale Basin, Poland

by
Agnieszka Operacz
1,*,
Bogusław Bielec
2,
Barbara Tomaszewska
3 and
Michał Kaczmarczyk
3
1
Department of Sanitary Engineering and Water Management, Faculty of Environmental Engineering and Land Surveying, University of Agriculture in Krakow, Mickiweicza 21 Av., 31-120 Kraków, Poland
2
Mineral and Energy Economy Research Institute of the Polish Academy of Sciences, Wybickiego 7A str., 31-261 Kraków, Poland
3
Department of Fossil Fuels, Faculty of Geology, Geophysics and Environmental Protection, AGH University of Science and Technology, Mickiewicza 30 Av., 30-059 Kraków, Poland
*
Author to whom correspondence should be addressed.
Energies 2020, 13(15), 3882; https://doi.org/10.3390/en13153882
Submission received: 29 May 2020 / Revised: 22 July 2020 / Accepted: 24 July 2020 / Published: 30 July 2020
(This article belongs to the Special Issue Use of Geothermal Energy Sources)

Abstract

:
In deep geothermal boreholes, an effect of temperature (so-called thermal lift) is observed, which results in the volumetric expansion of the fluid extracted. This process results in increased wellhead pressure values being recorded; in the absence of an appropriate correction, hydraulic properties of the reservoir layer cannot be properly determined. As an example of this effect, the Chochołów PIG-1 (CH PIG-1) geothermal borehole situated in Podhale Basin in Poland was used. Hydrodynamic tests including two pumping phases were carried out in the well in order to establish the basic hydraulic properties related to the determination of its operational resources (maximum water extraction value–capacity) and permissible groundwater level. Particular attention was paid to the thermal lift effect in the borehole. The conductivity, which depends on the pumping level, could be two to three times higher with temperature correction than results without any correction. The goal was to analyse the variability of the observed physiochemical properties of the exploited geothermal waters and to determine the correlation between the properties analysed and the temperature of the geothermal water. For the relationship between temperature and the observed pressure at the wellhead, the value of the correlation coefficient was negative (a negative linear relationship was determined), which means that as the temperature increases, the wellhead pressure decreases. The hydrodynamic tests carried out in the CH PIG-1 borehole and the analysis of variability of selected ions and parameters in exploited water were necessary to assess the possibility of increasing the efficiency (Q) of the CH PIG-1 borehole and to determine the water quality and its natural variability. Such information is crucial for the functioning of the recreational complex based on the use of geothermal water. A study of the phenomena affecting the exploitation of hot water from deep boreholes enables their effective exploitation and the use of resources in accordance with the expectations of investors.

1. Introduction

The physical process of volumetric expansion of fluid is observed in a borehole’s column used to extract thermal waters from the depths, and this is known as thermal lift. Details of the process are described below. During the exploitation of geothermal boreholes, this effect may result in elevated wellhead pressure values being recorded. Only thorough knowledge of this phenomenon and appropriate corrections make it possible to properly determine the hydraulic properties of the reservoir layer. The impact of this phenomenon on the correct interpretation of hydrodynamic test results increases with borehole depth and formation temperature [1,2]. In shallow hydrogeological boreholes exploiting ordinary (not thermal) water, the pressure head in the borehole is practically independent of the temperature of the aquifer. The observed fluctuations of the water table in such boreholes are mainly a function of borehole efficiency and the filtration parameters of the aquifer. In deep geothermal boreholes, the effect of temperature on the observed water table level or measured wellhead pressure can be significant and increases with the deposit temperature depth of the borehole. The borehole is heated during exploitation. The temperature inside the casing pipes approaches the temperature at the bottom of the borehole with the duration of the exploitation, thus contributing to lower water heat loss during intake. During the heating of the borehole, a volumetric expansion of the water due to the reduction of its density can be observed. During the exploitation of the thermal borehole, this effect is manifested by an increased water table level or increased wellhead pressure compared to the cold borehole, although the bottom pressure is the same in both cases. This affects the design filtration parameters, mainly hydraulic conductivity. Since it is often impossible to measure the bottom pressure during a hydrodynamic test, the results obtained from measuring the water table or the wellhead pressure should be adjusted for the thermal effect by calculating the so-called reduced pressure [2,3], thus allowing the determination of absolute drawdown in the borehole, undisturbed by thermal conditions of the medium. By adjusting the results of hydrodynamic tests for the effect of borehole heating, more accurate values of filtration parameters of the aquifer, including hydraulic conductivity, are obtained [1,2]. The studies carried out so far in a borehole with a depth of approx. 2 km indicate that the conductivity calculated for reduced pressure (taking into account the thermal effect) is more than two times, and in the case of depression in the first phase of pumping even three times lower than the one calculated for the observed pressure [1]. Not taking thermal lift into account when interpreting hydrodynamic test results invariably leads to aquifer conductivity being overstated. The correct determination of aquifer filtration properties only becomes possible after the thermal lift effect has been adjusted for, i.e., the value of the recorded pressure in artesian/subartesian systems has been reduced to the value of pressure under thermal equilibrium with the surrounding formation in the borehole [4].
The key parameter for correcting the pressure readings at the wellhead is the average density of the water column in the borehole when it is in thermal equilibrium without exploitation. The quality of the data obtained is crucial here. The expected temperature of water in the reservoir and at the wellhead is usually the first criterion determining the direction of further conceptual work for selecting the perspective areas for thermal water production [5]. Aliyu and Chen [6] present an approach for predicting the long-term performance of a deep geothermal reservoir using multiple combinations of various reservoir parameters. The finite element method and factorial experimental design were applied to forecast which parameters had the greatest influence on long-term reservoir productivity. The solver employed was validated using a known analytical solution and experimental measurements with good agreement. After the validation, an investigation was then performed based on the Soultz lower geothermal reservoir. The results showed that the fluid injection temperature was the parameter that influenced the experiment the most during exploitation involving production temperature, whereas the injection pressure rate had a more significant impact on reservoir cooling [6]. The actual geothermal fluid temperature is a distinctive parameter determining the selection of the type of geothermal power plant, which is conditioned by thermodynamic and economic performance [7,8]. Temperature and pressure are also the most significant parameters to determine the feasibility of geothermal power generation using low-flow-rate downhole heat exchangers [7]. The utilisation of geothermal energy, which is a renewable and environmentally friendly source of energy, brings noticeable improvements in air quality as evidenced by the significant ecological effects achieved after commissioning geothermal district heating plants [9,10,11]. Utilization of geothermal energy depends to the largest degree on the main parameters (e.g., temperature, pressure, efficiency) so a correct assessment of them is necessary. Geothermal waters in southern Poland (especially in the Podhale Basin) at about a 3–3.5 km depth have temperatures reaching almost 90 °C and low mineralisation values below 3 g dm−3 [12]. These parameters make their technical exploitation economically viable, ensuring relatively good operating conditions [5,10,13].
This study presents the results and analysis of hydrogeological studies carried out in the CH PIG-1 borehole, which provide the most up-to-date information on the thermal water properties accessed through this borehole in the context of the thermal lift effect observed during its operation. The methodology presented may provide inputs for conducting standard hydrodynamic tests—so-called “good practice” for similar studies in geothermal boreholes. The variability of physico-chemical properties of water exploited by the CH PIG-1 in the 2016–2019 multiannual period in the context of system operation was also analysed. Water samples were taken every time from the test cock directly at the intake. Analyses were performed in the Hydrogeochemical Laboratory of the Hydrogeology and Engineering Geology Department at the AGH University of Science and Technology in Krakow. Laboratory was accredited by the Polish Centre for Accreditation on 14 June 2009 (Certificate No. AB 1050) and has implemented a quality management system in accordance with the requirements of the ISO 17025 standard [14]. The stationary observations available with respect to the water extracted made it possible to analyse correlations between the pH value and total dissolved solids (TDS), wellhead pressure, and extraction temperature, and to determine the possibility of relationships observed in the context of the measured wellhead pressure. This paper highlights a number of factors of key importance in the assessment and forecasting of operational resources of thermal water intake. Furthermore, the analysis of the correlation between hydrodynamic and physico-chemical parameters of exploited water is presented, which also plays an important role in assessing the possibility of safe water exploitation.

2. Description of the Studied Area

The CH PIG-1 well is located in Witów in southern Poland. It was constructed during the 1989–1990 period on the basis of a design which envisaged the drilling of nine deep boreholes in order to extract thermal water in the Podhale Basin in southern Poland [15] (Figure 1). Of these, six boreholes were ultimately completed, including the CH PIG-1 borehole [16]. In the following years, further boreholes were drilled to extract geothermal water. For many years, the Podhale Basin has been commonly known as one of the most promising structures in Poland from the point of view of recreation and balneotherapy [17,18,19,20,21,22,23,24]. The extraction of thermal waters in the area is also an important attraction boosting the development of tourism [25].
The Paleogene Podhale Basin, within which the CH PIG-1 borehole was drilled, is situated in the northern part of the Inner Carpathians, sandwiched between the Tatra Mountains in the south and the Pieniny Rock Belt in the north [27]. The area of the basin within Polish borders is approximately 490 km2 and it extends latitudinally for about 40 km from the west to the east. There are two main geological and structural units in the Tatra region: the Tatra Massif (lower-order unit) and the Podhale Basin (upper-order unit) [28].
The waters of the Quaternary aquifer are associated with the presence of alluvial formations which fill beds of streams or fluvioglacial formations.
The waters of the Tertiary (Paleogene) aquifer are associated with Podhale Flysch formations and carbonate sub-Flysch formations (Tatra Eocene). Podhale Flysch formations (shale and sandstone) are structures with a low water content. On a regional scale, as a whole, they can be considered isolating formations. They are fractured aquifers, and less often fractured-porous ones. The water table is most often confined [18].
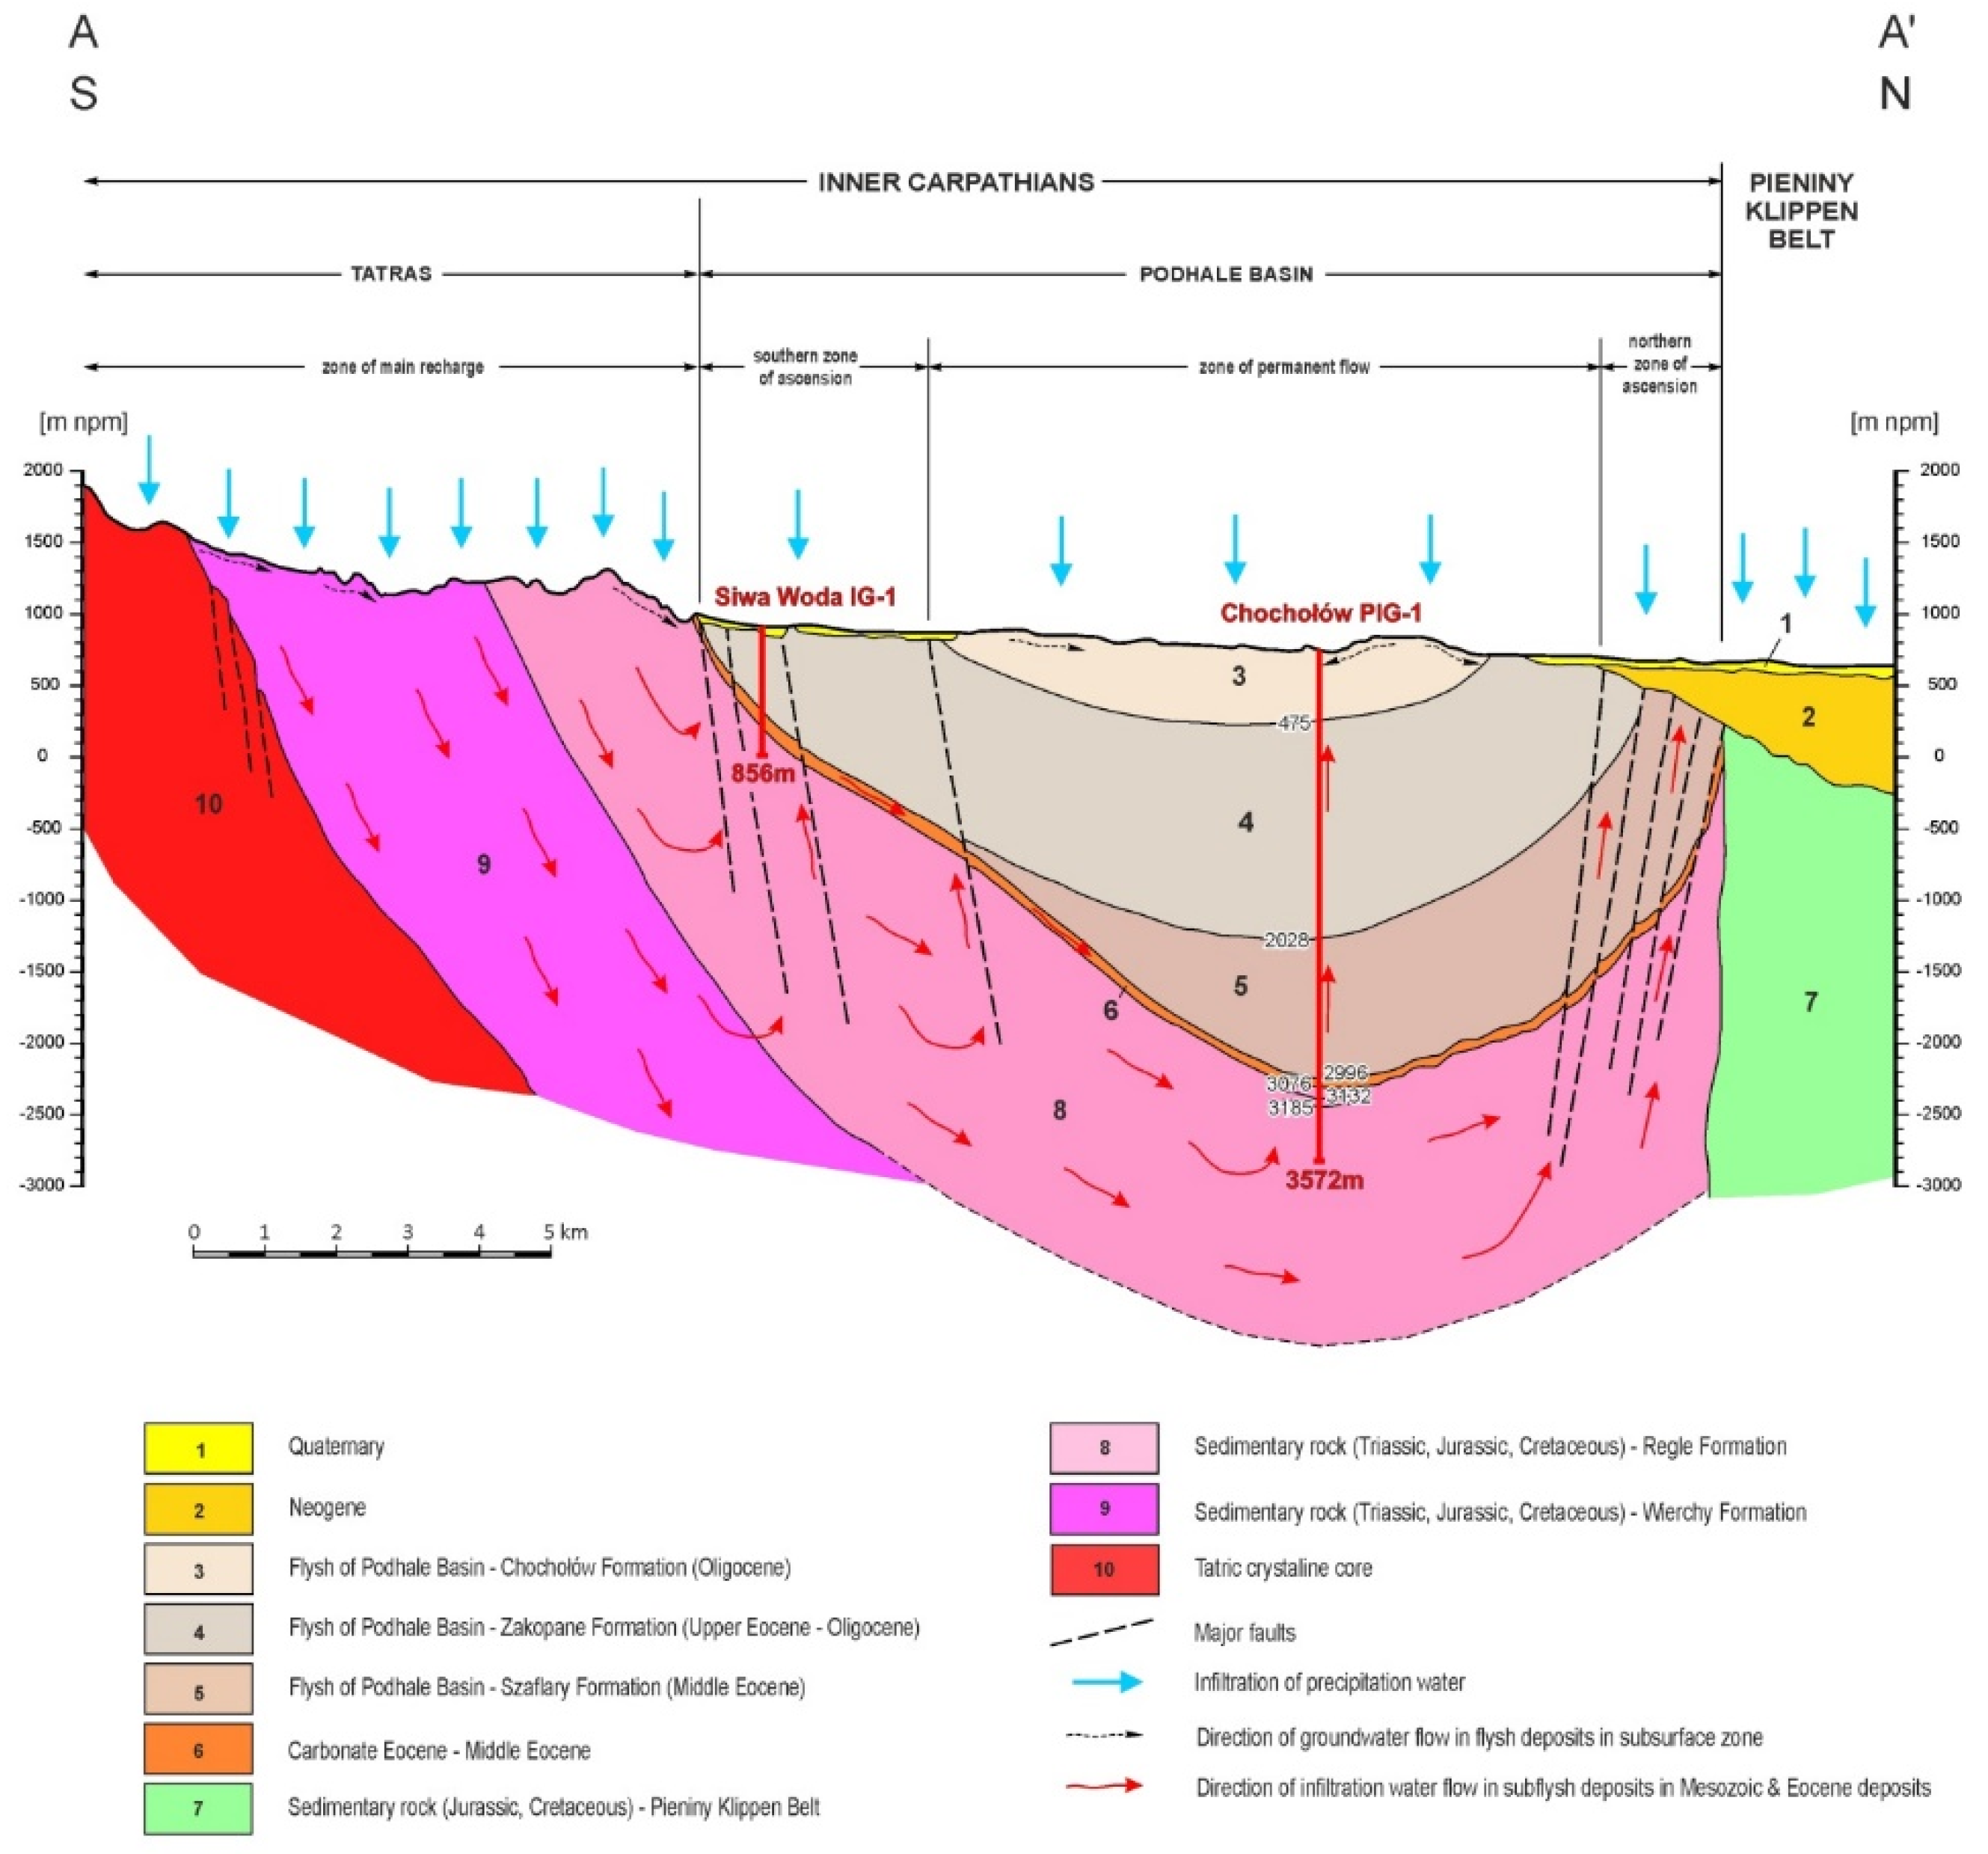
Mesozoic aquifers are mostly of the karstic-fissured and karstic types and are associated with carbonate series. The precipitation recharge area of sub-Flysch aquifers is situated in the Tatra Mountains. Rainwater infiltrating in this area moves through a system of fissures and karstic voids towards the north, i.e., in the direction in which the Tatra series subside (Figure 2). The circulation of some of this water is fairly short, since it appears on the surface in the form of springs or is drained through valleys. The remaining part penetrates deep into the ground, is heated up, and extracted through boreholes as thermal water. Early isotope studies indicated a relatively young age of the water within 100–2000 years, which indicates high intensity of water exchange in the Podhale Basin [29]. A detailed study [30] indicates that the waters in the eastern part of the Podhale Basin are in the zone of slower flows (e.g., due to the existence of sealing faults) and may be much older than the Holocene waters located closer to the outcrop.
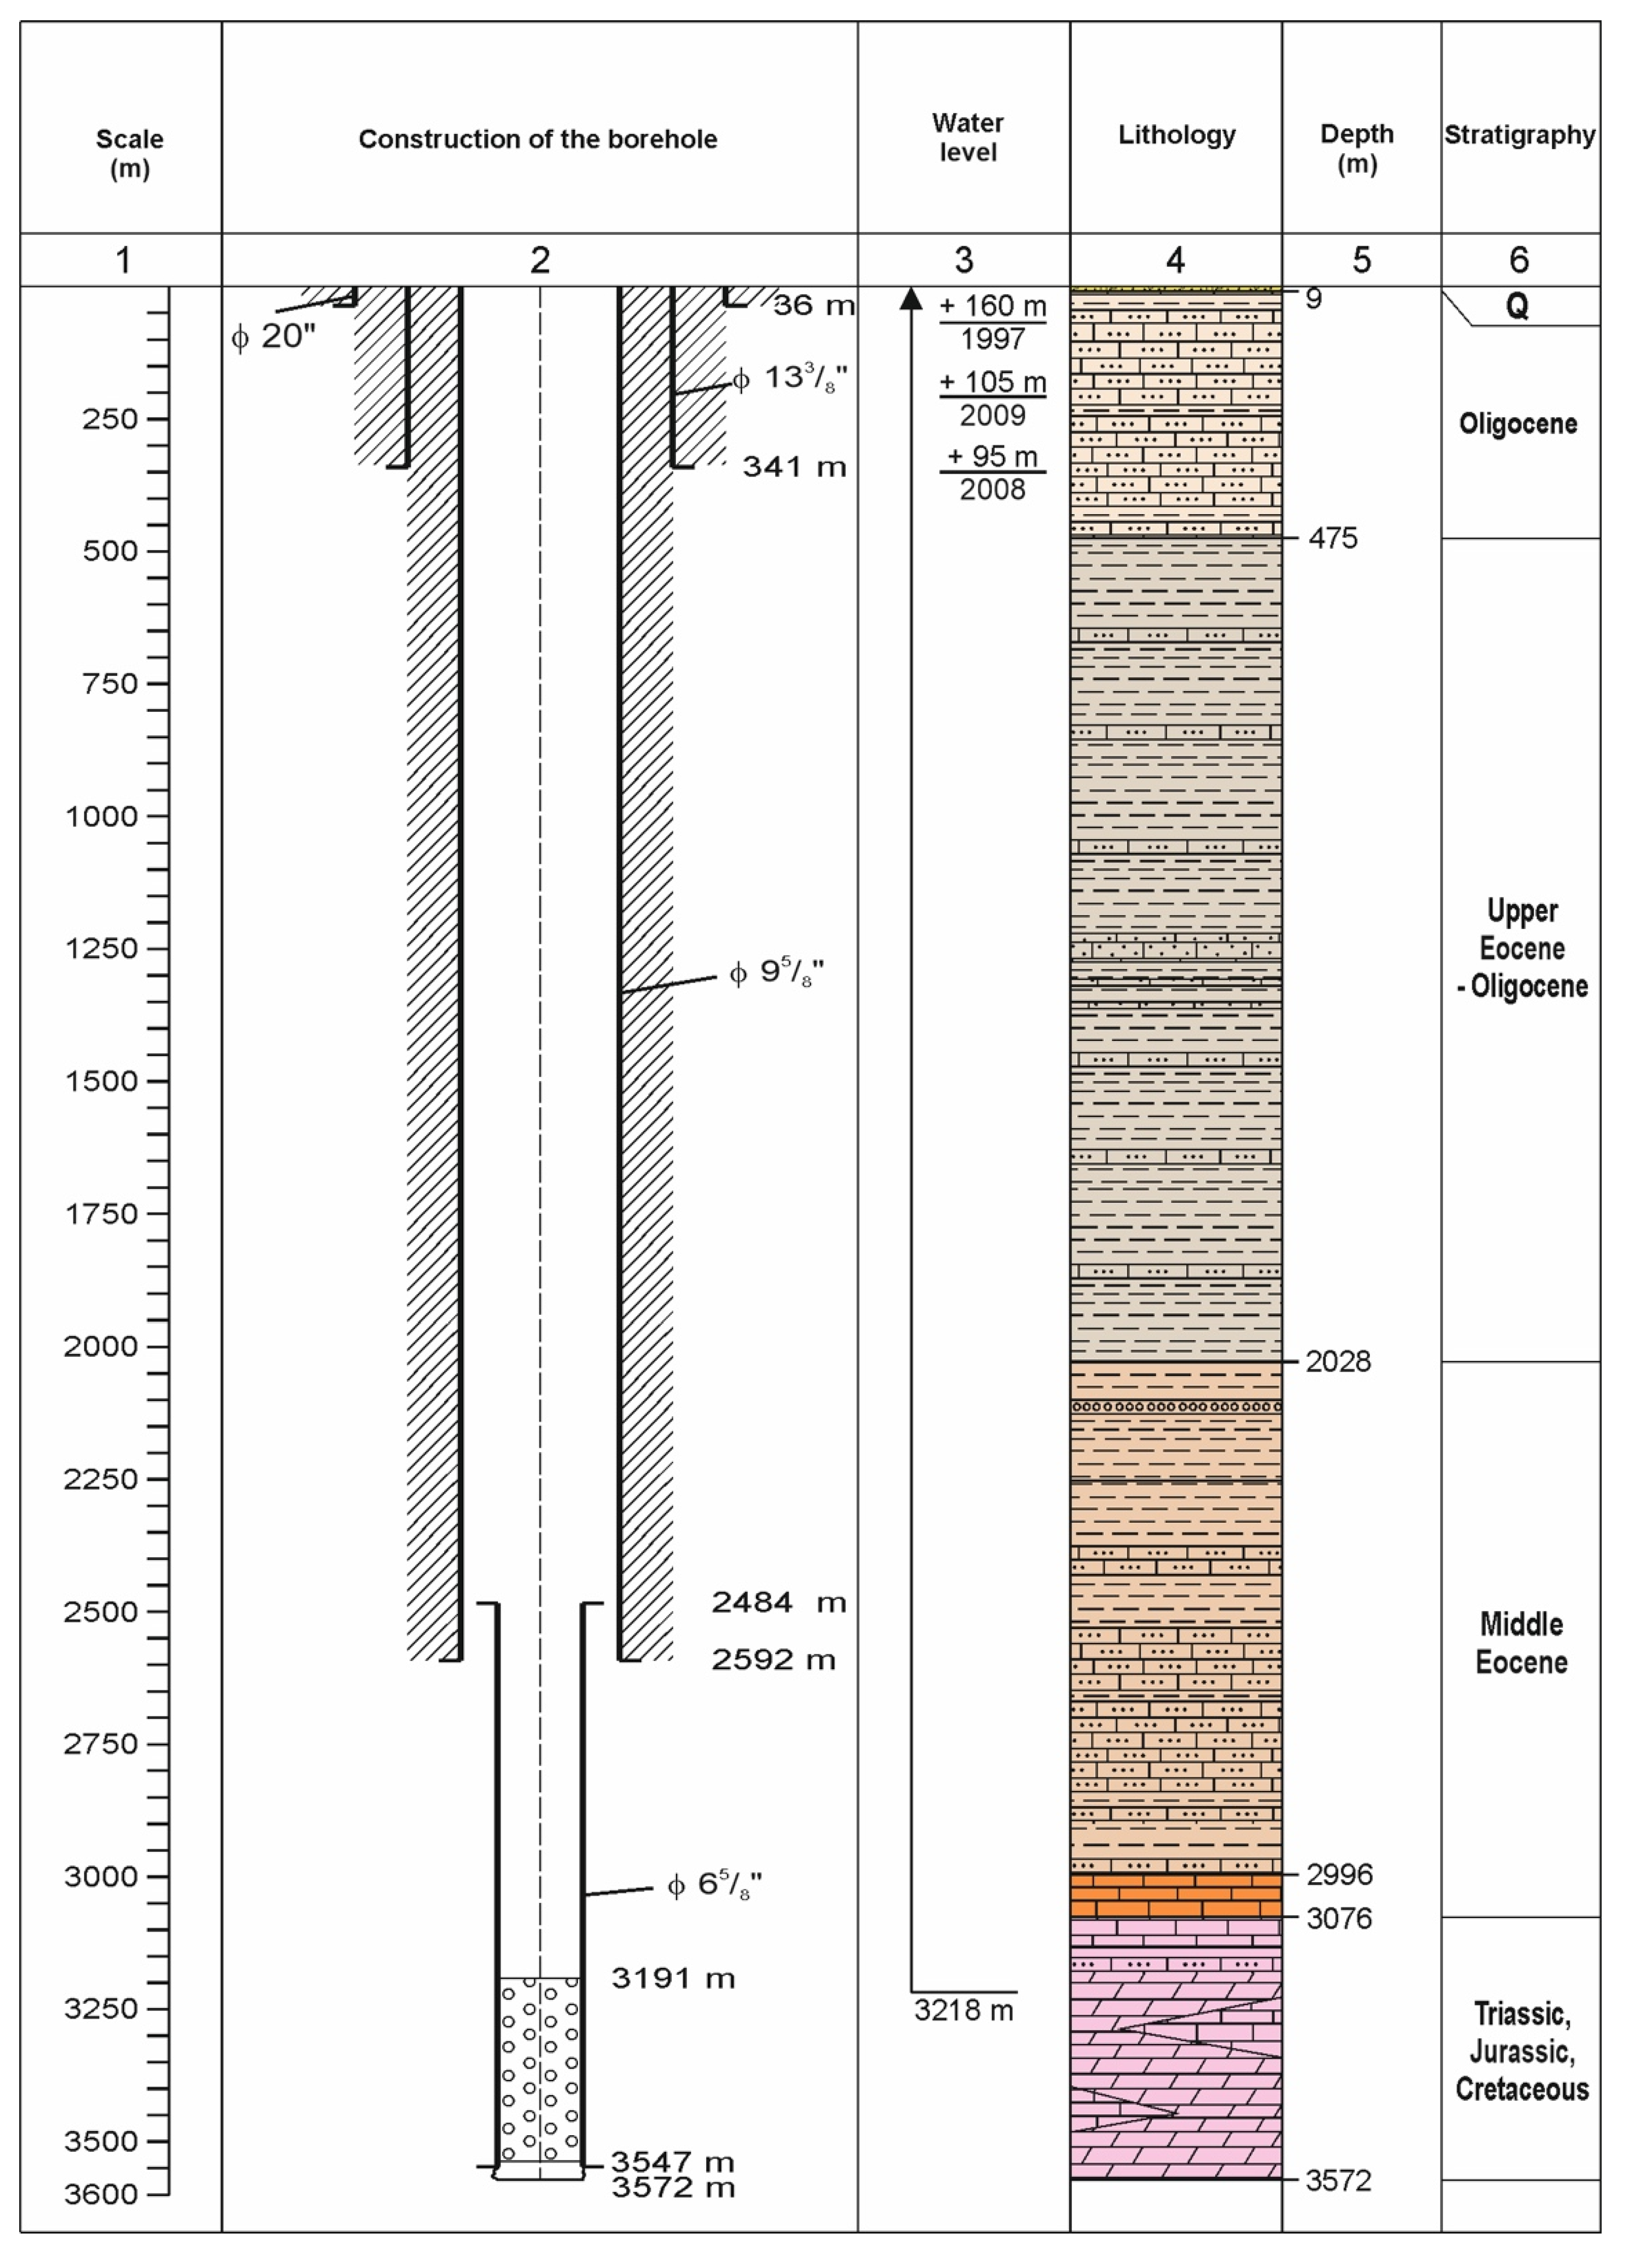
The CH PIG-1 borehole reached a final depth of 3572 m (Figure 2 and Figure 3). The composition of the extracted water is 0.11% SO4–Ca–Mg–Na. The extracted water mineral content at the outflow point ranges from 1050 to 1300 mg/dm3 and this is natural long-term variability. The water temperature at the wellhead is 89.8 °C at Q = 160 m3/h.
The CH PIG-1 geothermal borehole extracts water from a confined aquifer. Due to favorable hydrodynamic conditions, the well is operated without any mechanical devices as an artesian well. Construction of the CH PIG-1 thermal water well is presented in Figure 3.

3. Materials and Methods

3.1. Hydrodynamic Testing

The tests related to the assessment of operating parameters for the CH PIG-1 borehole in the context of the thermal lift effect were carried out in two phases on 27 and 28 November 2017. Details of the tests are presented in Table 1.
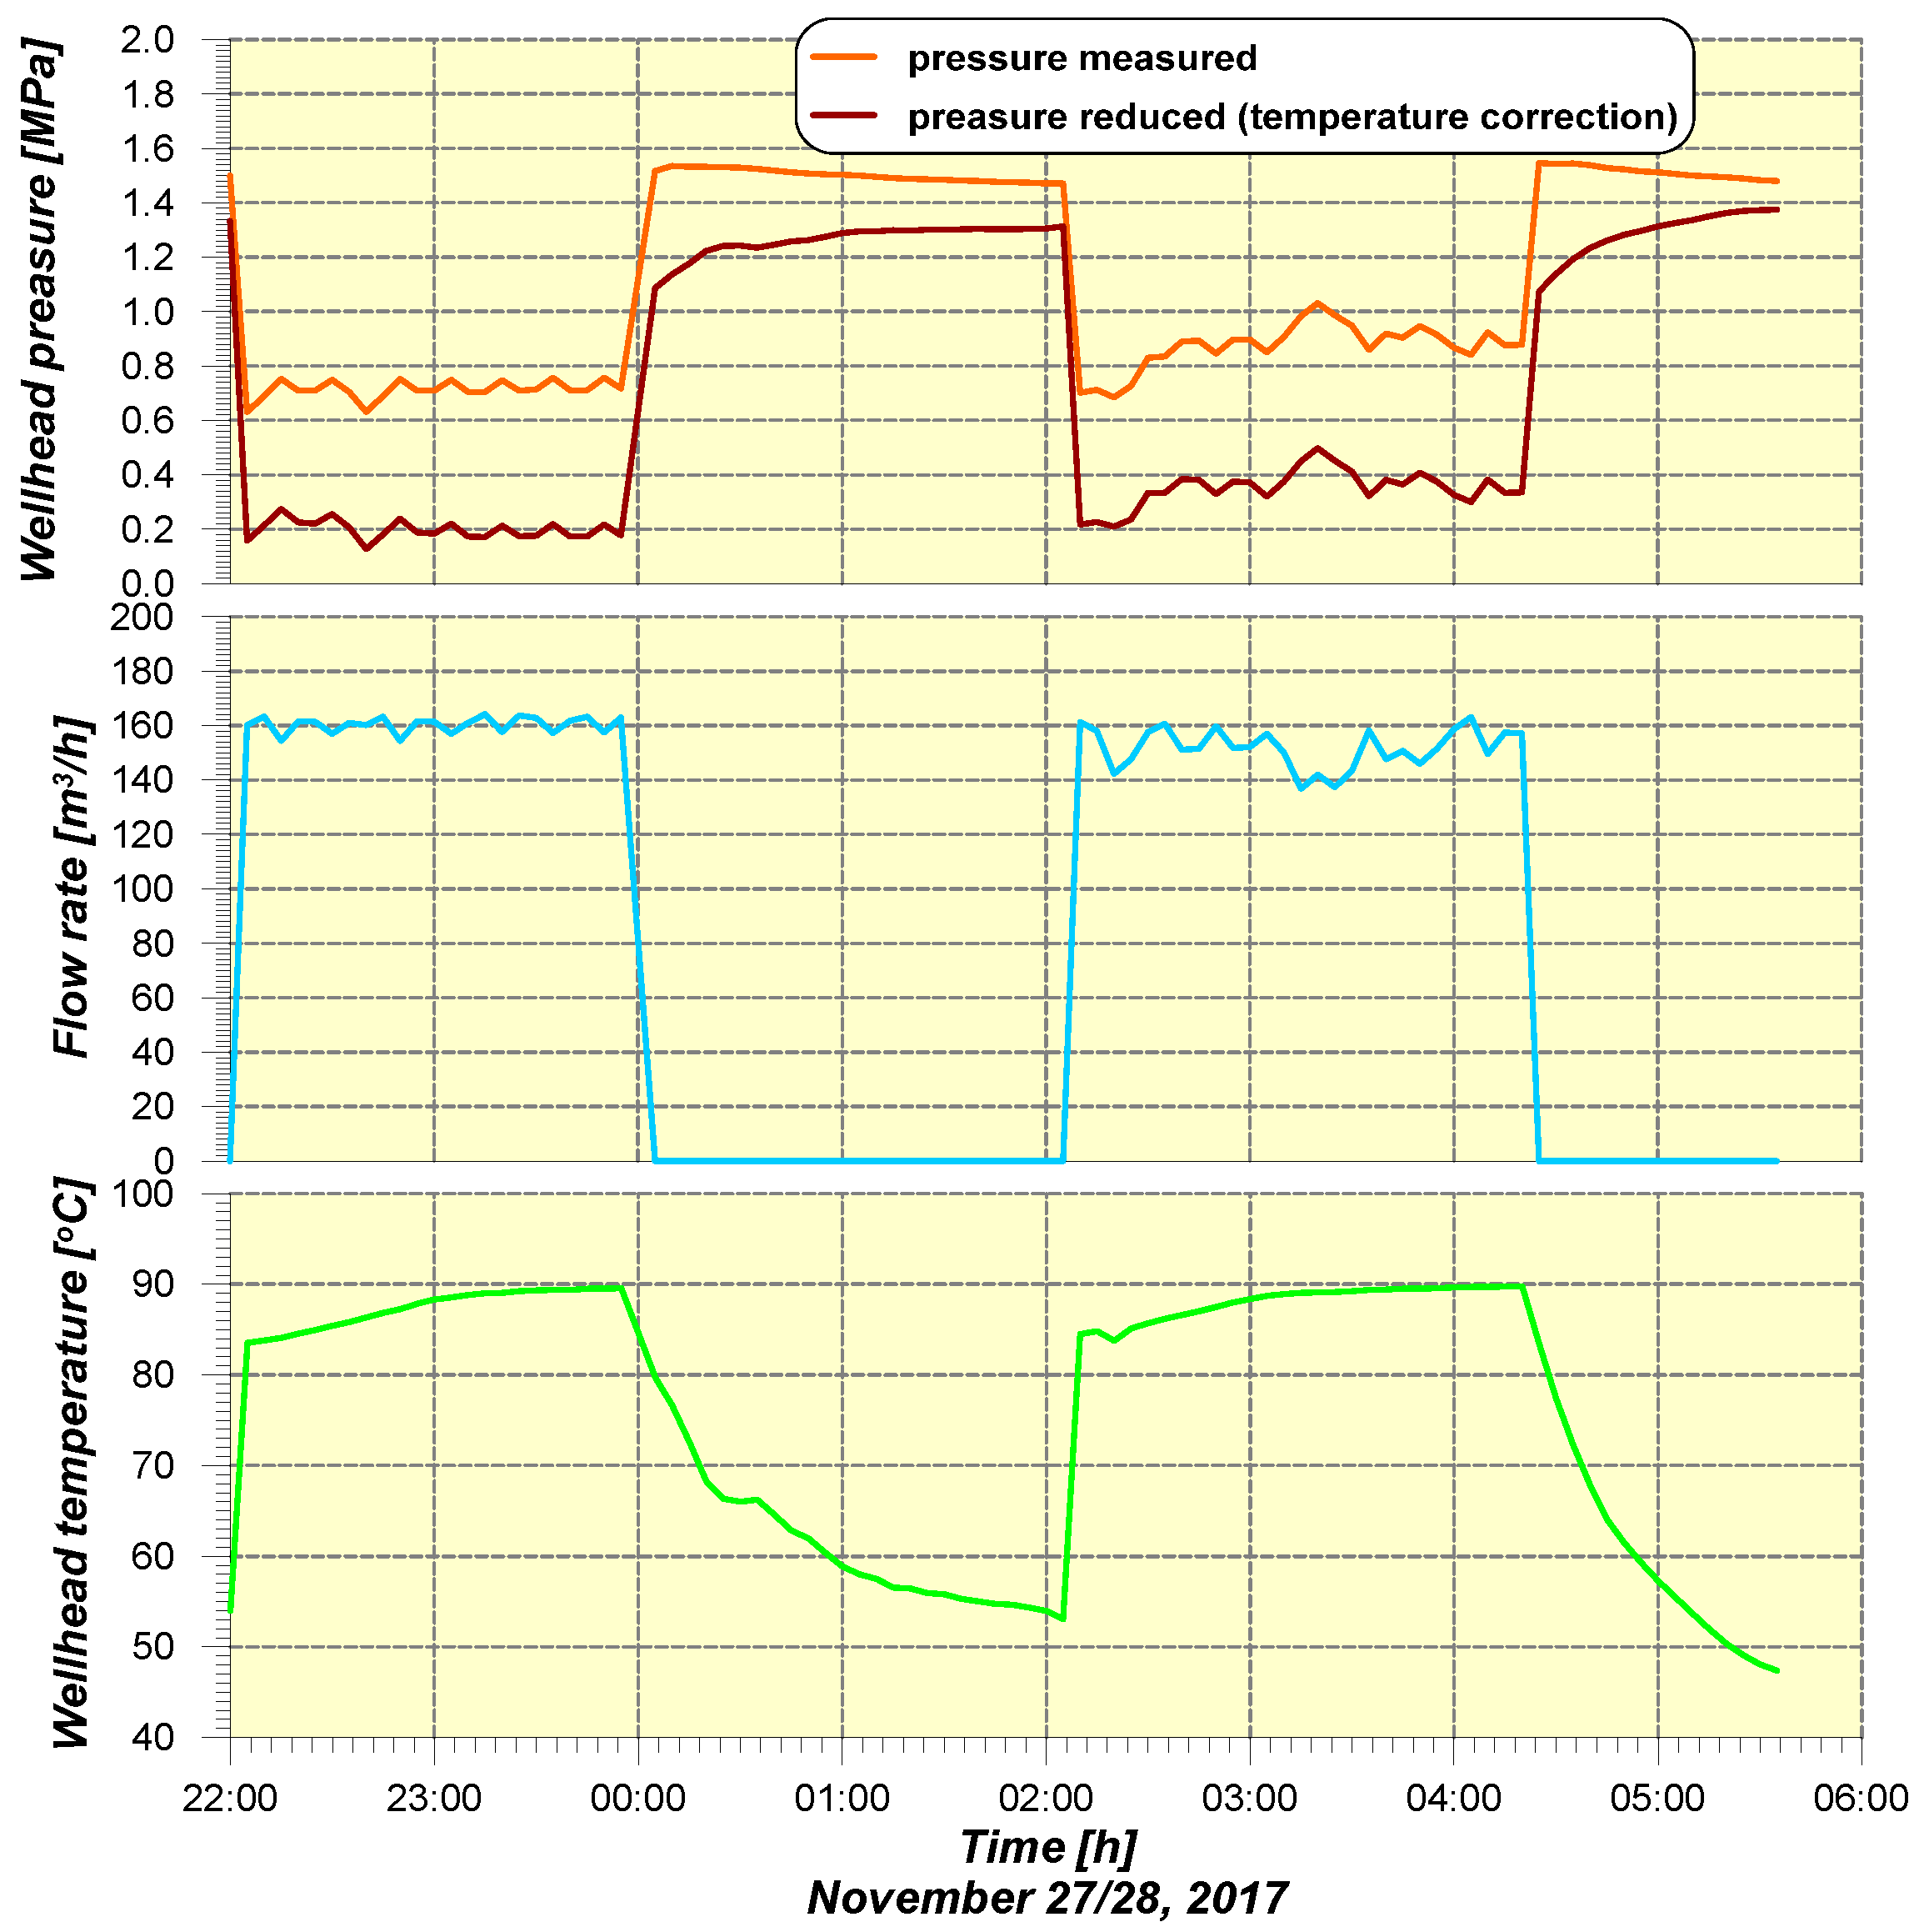
Phase I was conducted with an average pumping capacity of 160.4 m3/h and included 2 h of pumping and 2 h and 5 min of stabilisation. Phase II was conducted with an average pumping capacity of 151.9 m3/h, with a pumping time of 2 h 15 min and a stabilisation time of 1 h 15 min. The well in which the tests were carried out is continuously operated in connection with the needs of the recreational complex. The purpose of the designed works was to determine the current operating parameters and the possibility of increasing the borehole capacity to 160 m3/h, which is dictated by further investment plans, i.e., extension of the aqua park (construction of, among others, a hotel facility). Prior to conducting proper hydrodynamic tests on 27 November 2017, the well was shut down for 2 h. In the course of the tests, during artesian flow of water from the well, continuous automatic measurements of the temperature of the flowing geothermal water, pressure at the wellhead, and artesian flow rate were conducted. Individual elements of the measuring system were connected to a computer system which recorded the parameters tested on an ongoing basis. In order to determine reduced wellhead pressure, it was necessary to adjust for the thermal lift effect. Temperature measurements in the CH PIG-1 borehole were carried out under thermally stabilised conditions. The value of the reduced wellhead pressure was determined using Equation (1) [1,2]:
P s r e d . = P s [ 1 ρ ( T ś r . ) ρ ( T ś r . c ) ] · ρ ( T ś r . c ) · L · g
where
  • P s r e d . —reduced pressure value measured at the wellhead [Pa];
  • Ps—dynamic pressure value measured at the wellhead [Pa];
  • ρ(Tśr)—average density of the thermal water column in the well during its operation [kg/m3];
  • L—borehole TVD [m];
  • g—gravitational acceleration [m/s2].
The reduced wellhead pressure value was used during the interpretation of hydrodynamic tests. To interpret test results, the Theis method as modified by Agarwal [33,34] was used with respect to the borehole pressure recovery phase. The choice of this method was determined by the fact that the flow rate was constant at that time (Q = 0), which is the basic assumption underlying tests carried out under transient inflow conditions [3,35,36]. The time here is defined as tt′, where t is the total duration of the test at a given stage (pumping + pressure recovery), and t′ is the pressure recovery time (the time that elapses from the start of the pressure recovery phase).
Non-linear flow resistance, which is irrelevant when considering the pressure recovery period (Q = 0), was not taken into account in the calculations. The hydraulic conductivity values obtained were converted into filtration coefficient values (k). For calculation purposes, the thickness of the reservoir layer accessed was assumed to be 329 m [37].
The range of hydrodynamic changes (R—borehole depression cone) was theoretically determined using the Sichardt formula (2):
R = 3000 s k
where
  • R—depression cone [m];
  • s—depression [m];
  • k—filtration coefficient [m/s].

3.2. Hydrogeochemical Testing

Water samples from the borehole were taken at the outflow point in accordance with the Polish Standard PN-ISO 5667-11:2004 [38], the guidebook commonly used in Poland in similar analyses [39] and the practical guidelines described by Zdechlik et al. [40]. Once a month, an analysis of the main and other selected ions and chemical compounds was carried out at the accredited laboratory of the AGH University of Science and Technology in Krakow. The database includes results from the year 2016 (the beginning of the borehole operation) until the end of year 2019. In 2019, electrical conductivity (EC), pH, wellhead pressure, and temperature were measured continuously using gauges installed at the outflow. The reading of the pressure value was made on the basis of the indications of a pressure gauge installed on the wellhead. Individual elements of the measuring chain were connected to a computer system recording pumping parameters on an ongoing basis.
The basic analysis of the variation in concentrations of selected ions was carried out using the STATISTICA platform and was presented in the form of typical box charts. Additionally, correlations between the parameters observed were determined. The convention proposed by Guilford [41] was used to interpret the correlation coefficients of the sample.

4. Results and Discussion

The hydrodynamic tests carried out in the CH PIG 1 borehole and the analysis of variability of selected ions and parameters in exploited water were necessary to assess the possibility of increasing the efficiency of the CH PIG-1 borehole and to determine the water quality and its natural variability. Such information is crucial for the functioning of the recreational complex based on the use of geothermal water. A study of the phenomena affecting the exploitation of hot water from deep boreholes enables their effective exploitation and enables the use of resources in accordance with the expectations of investors.

4.1. Hydrodynamic Testing

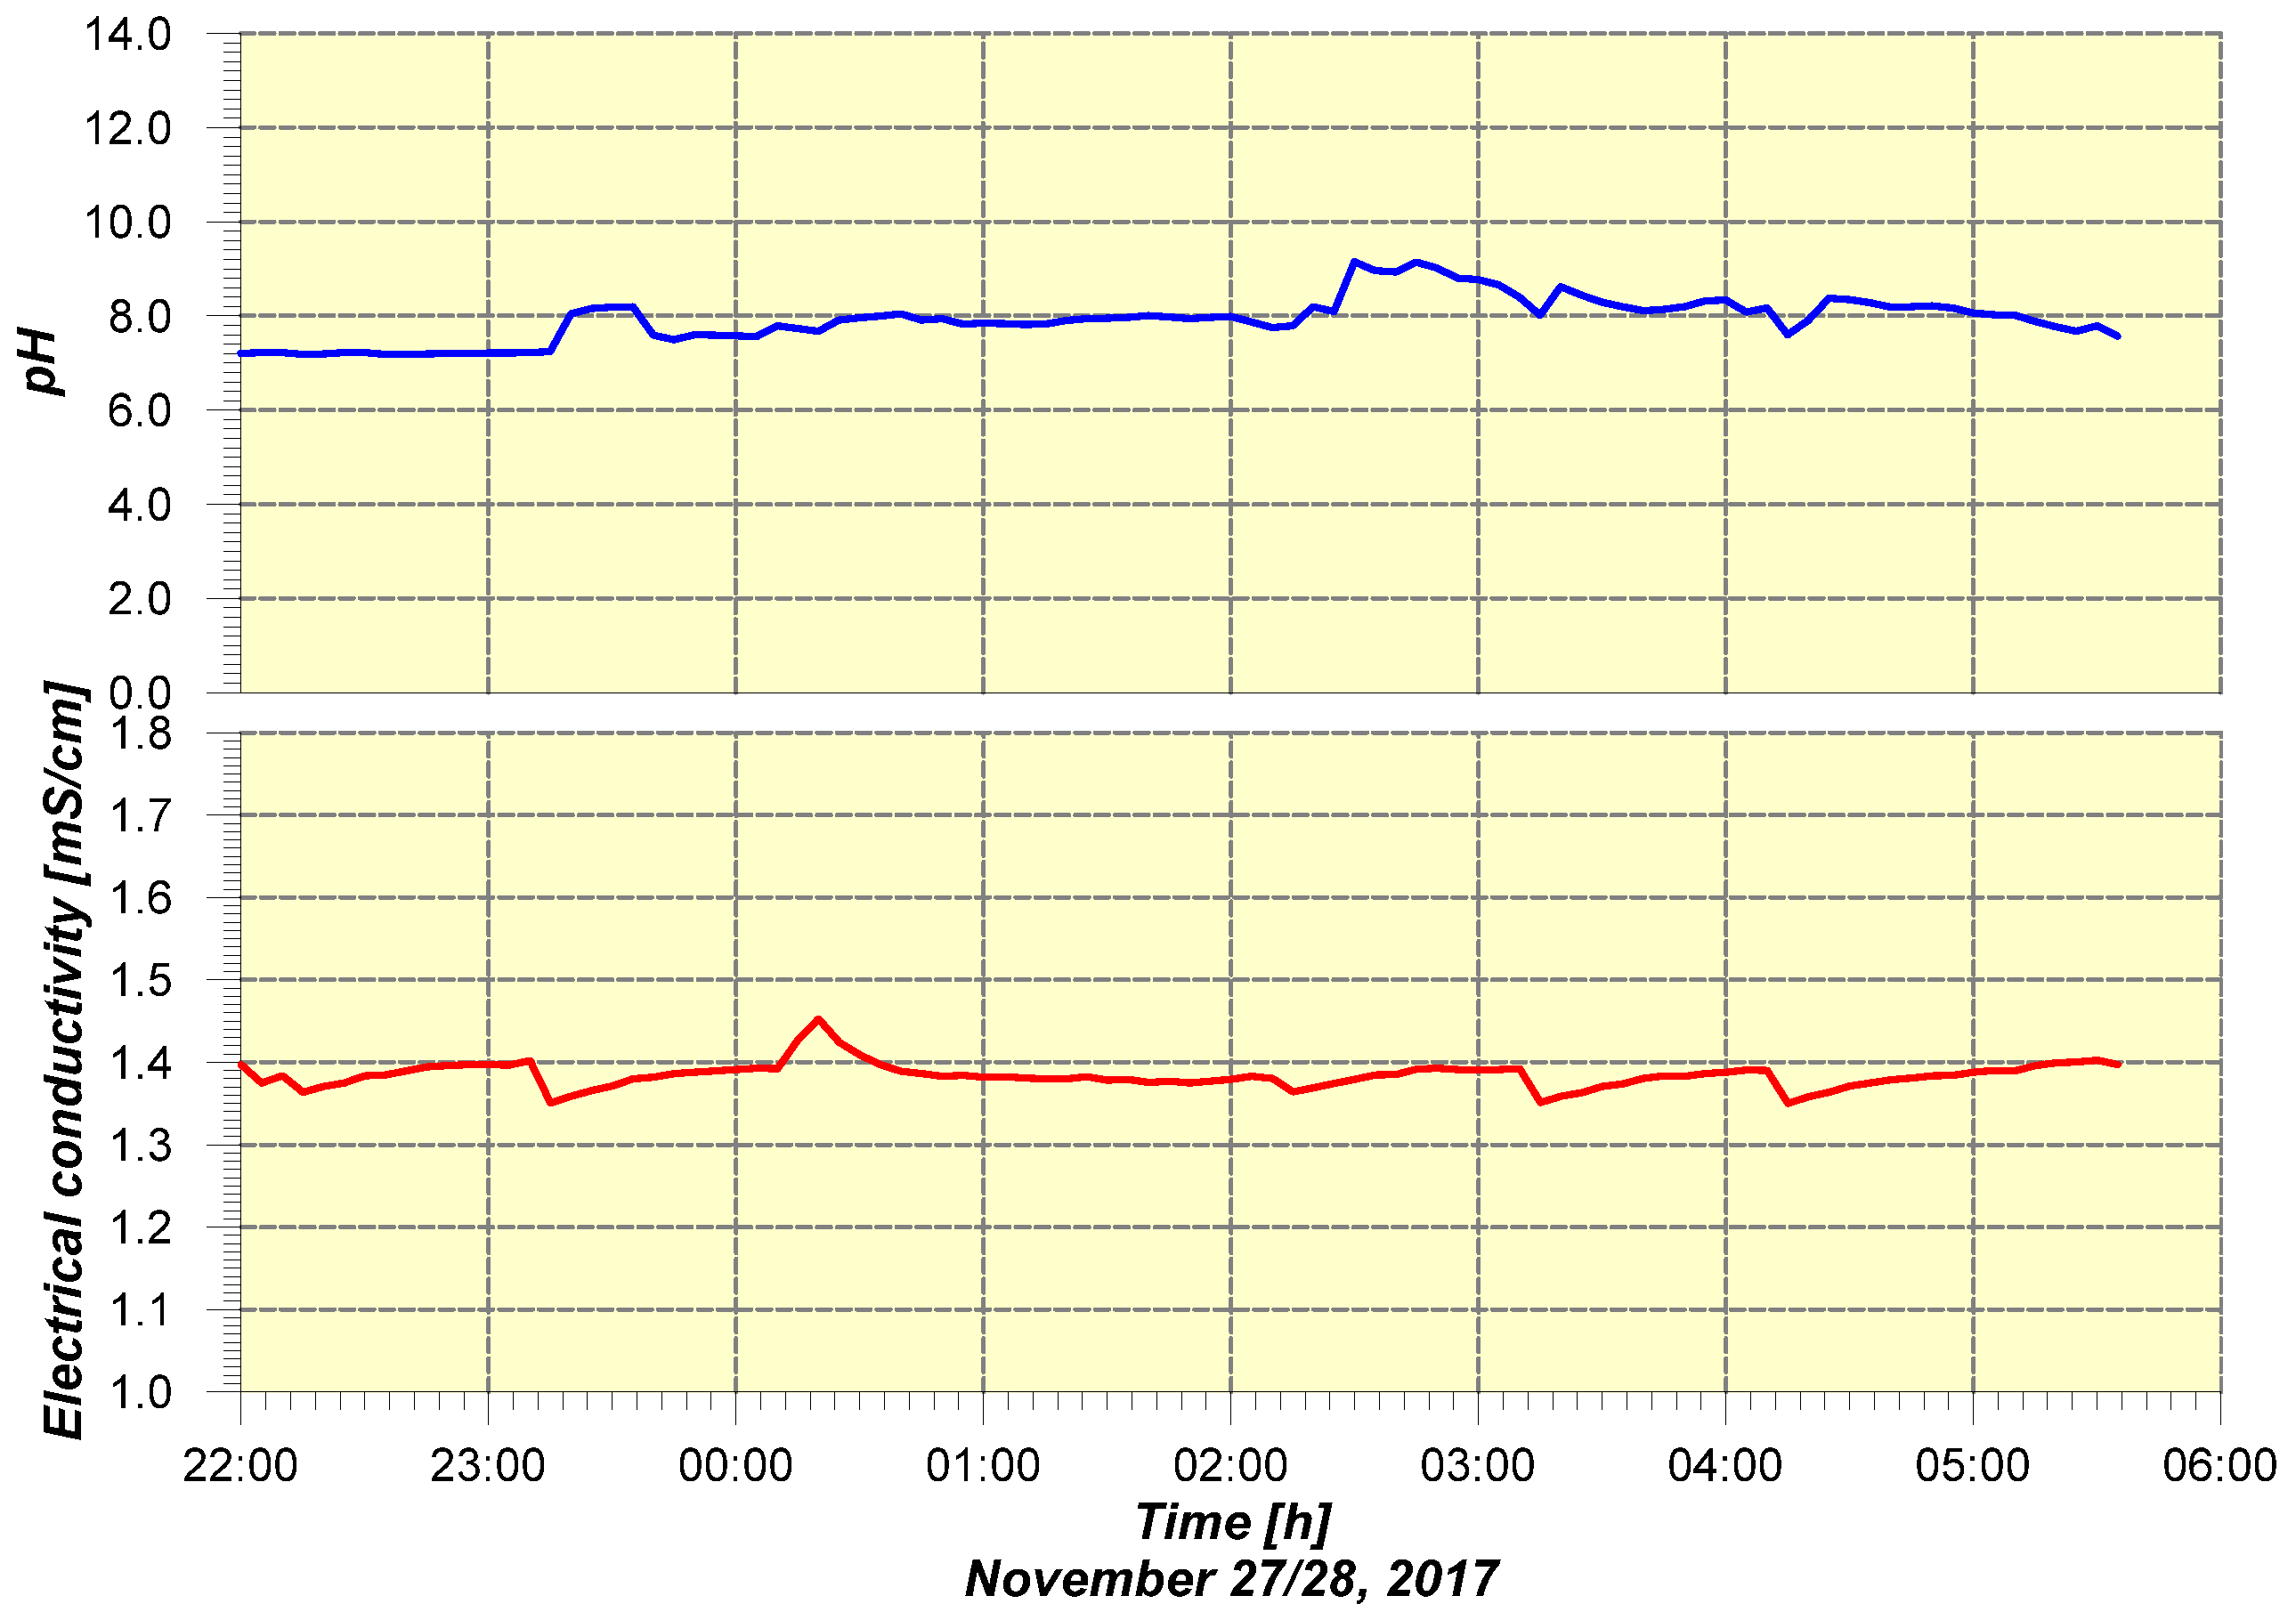
Changes in pressure, flow rate, and temperature during hydrodynamic testing in the CH PIG-1 well are shown in Figure 4 and Figure 5. In Figure 4, the brown line marks the wellhead pressure value which would have been recorded if there had been no volumetric expansion of water in the borehole due to the thermal lift effect. This assumption forms the basis for using existing analytical solutions to estimate the hydraulic parameters of the aquifer. The thermal lift phenomenon depends on the pressure condition and formation temperature—the higher the values of these properties, the more significant the thermal lift effect and the greater its impact on the correct interpretation of results. This distortion is clearly visible in Figure 4 (orange line—pressure measured), where despite pressure recovery being recorded in the borehole, the graph shape characteristic of this process could not be recorded. Figure 4 also demonstrates the fairly rapid stabilisation of pressure after each of the individual pumping stages in both hydrodynamic tests.
As a result of the hydrodynamic test carried out, the results shown in Table 2 were obtained. Semi-logarithmic graphs were used to interpret the results [3,42].
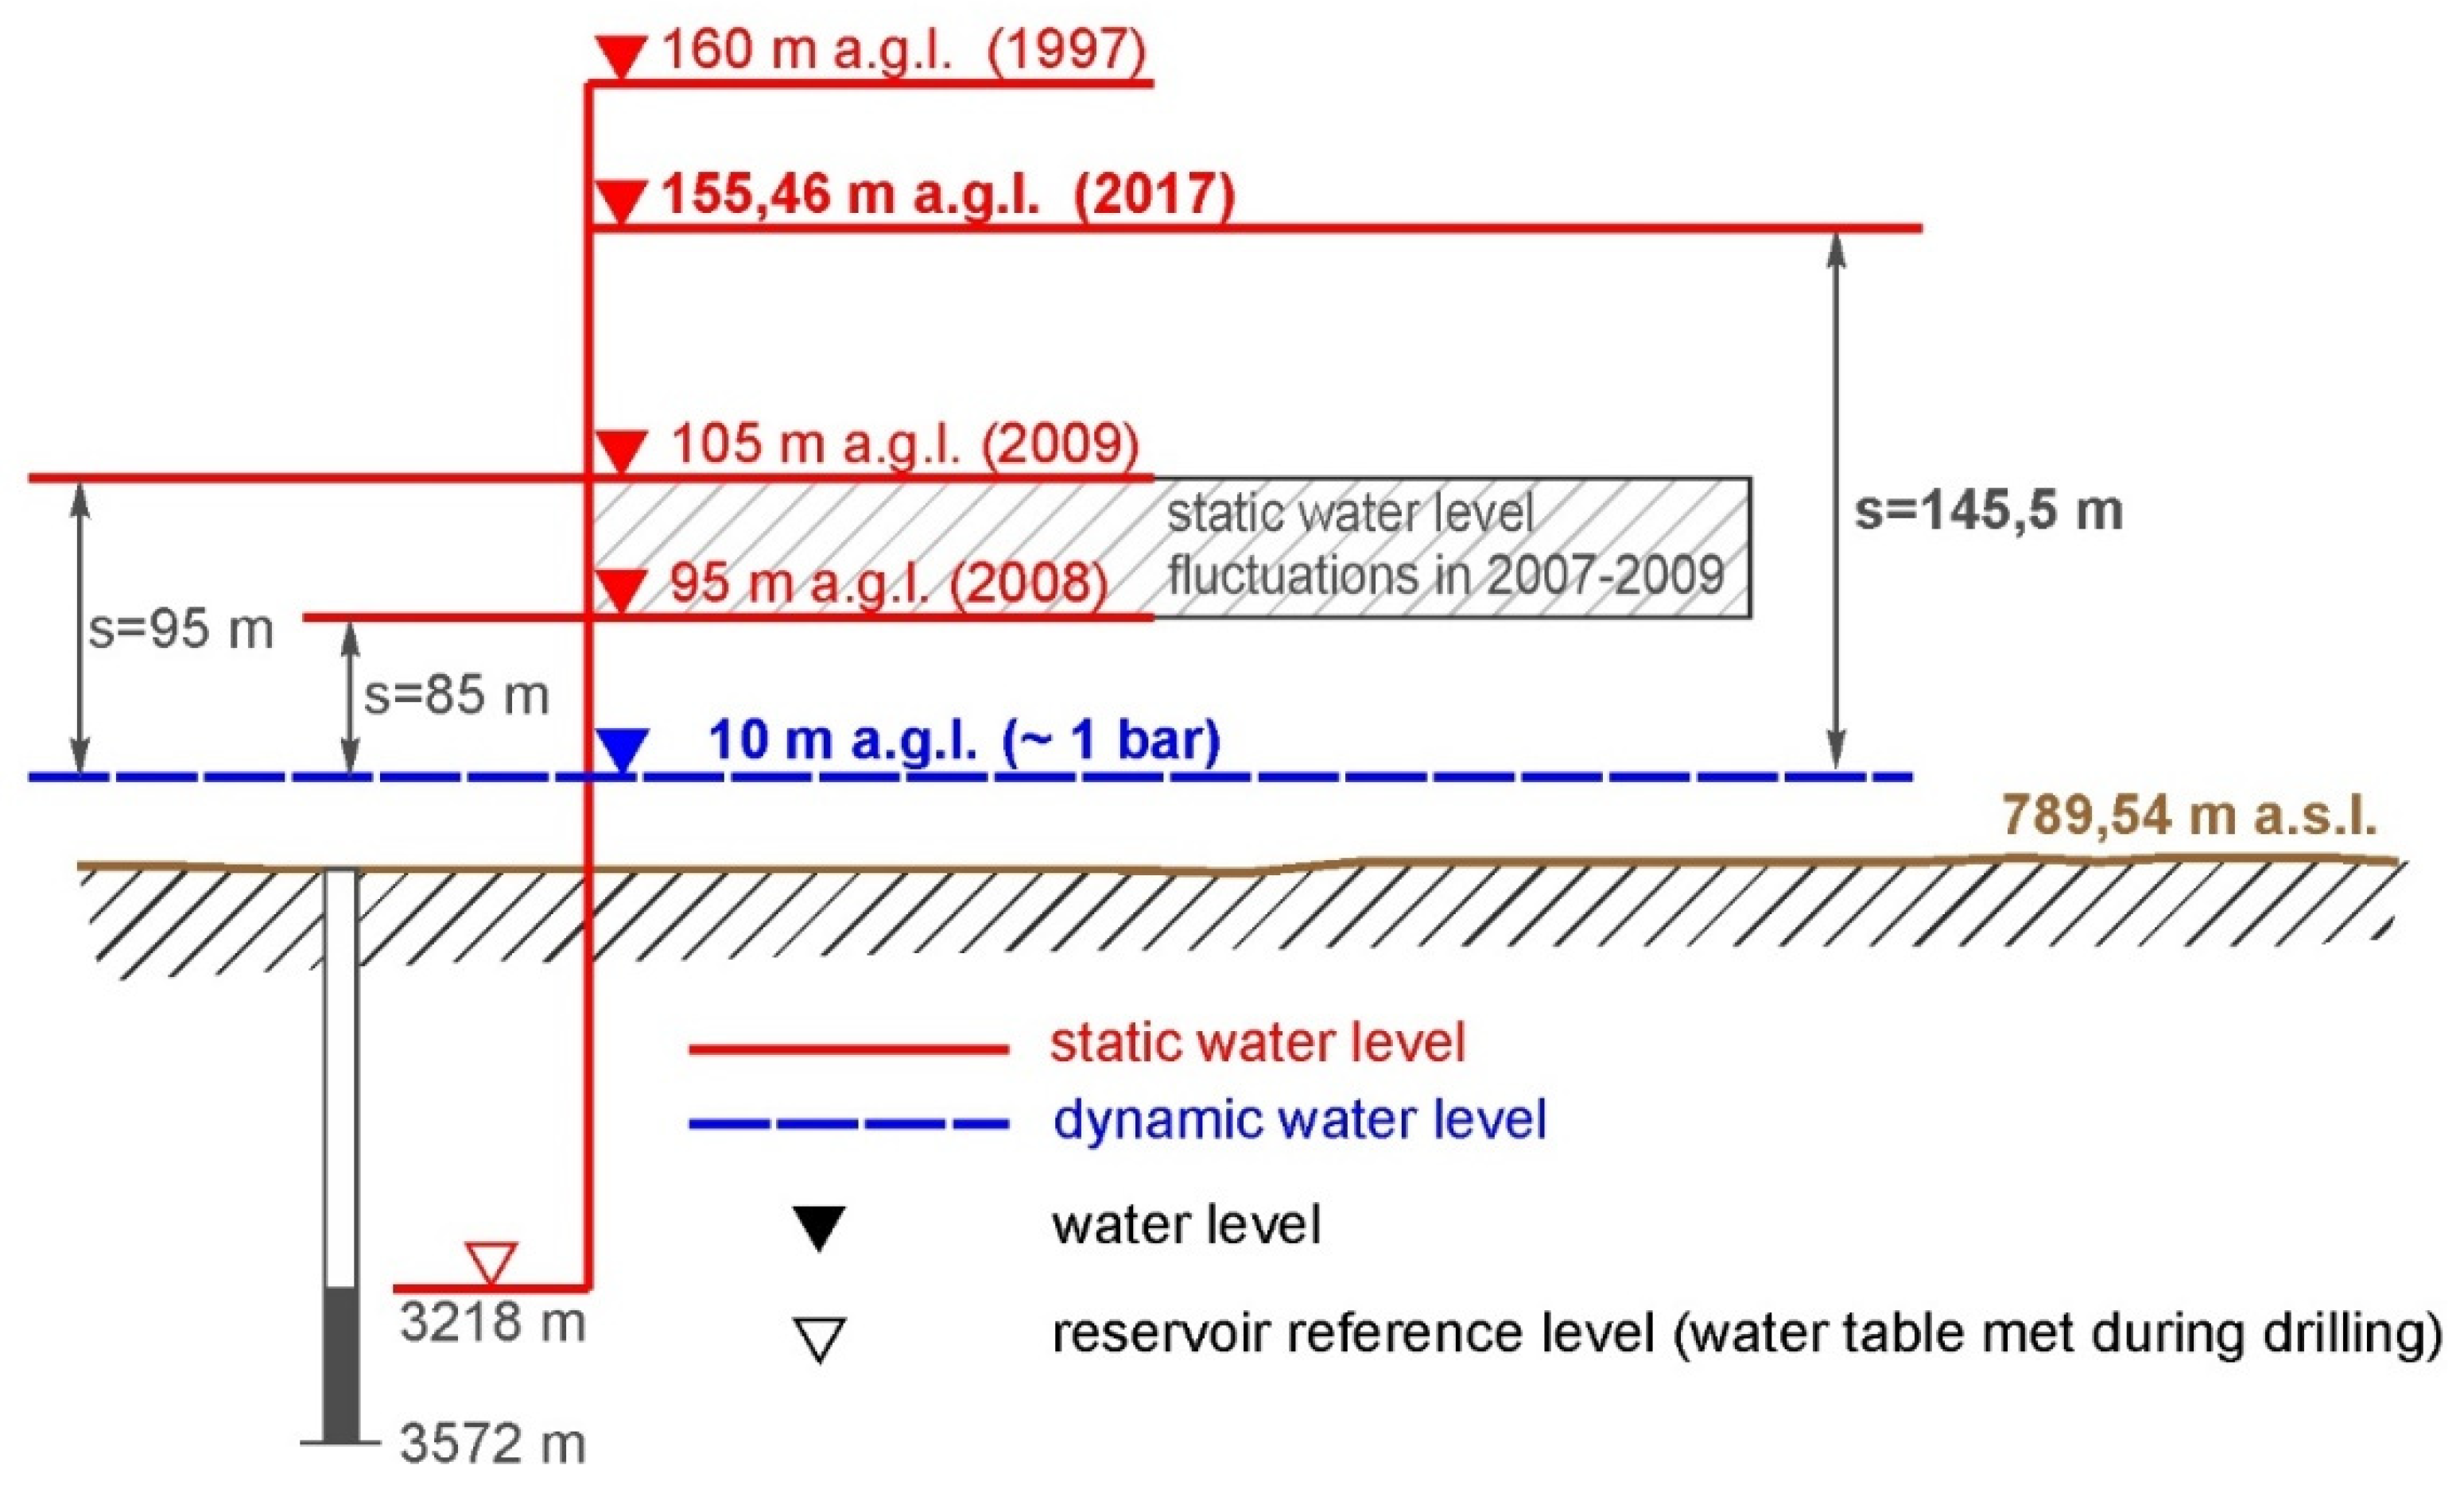
In the case of the calculation results of the hydrogeological properties, the maximum water extraction rate and the permissible lowering of the water table (head pressure) were determined on the basis of the results of hydrodynamic tests. The interpretations and calculations of exploitable water resources conducted with respect to the CH PIG-1 borehole made it possible to determine its operating flow rate: Qe = 160 m3/h = 3840 m3/d. The maximum decrease in the dynamic water table in the CH PIG-1 well was assumed to correspond to a water table lowered by 145.5 m in relation to the established water table, i.e., +155.46 m a.g.l. (above ground level). This means that depression had to be maintained above the 799.5 m a.s.l. (above sea level) (+10.0 m a.g.l.) as shown in Figure 6. Static water level fluctuations are caused by exploitation from many others boreholes in the Podhale Basin.
The hydraulic conductivity values obtained by using the Theis method [33] as modified by Agarwal [34] were converted into filtration coefficient values (k). For the CH PIG-1 well operated at 160 m3/h at a depression of s = 145.5 m, the range of the hydrodynamic changes (R—depression cone) theoretically determined using Formula (2) is 421 m. The average filtration coefficient is 9.32·10−7 m/s.
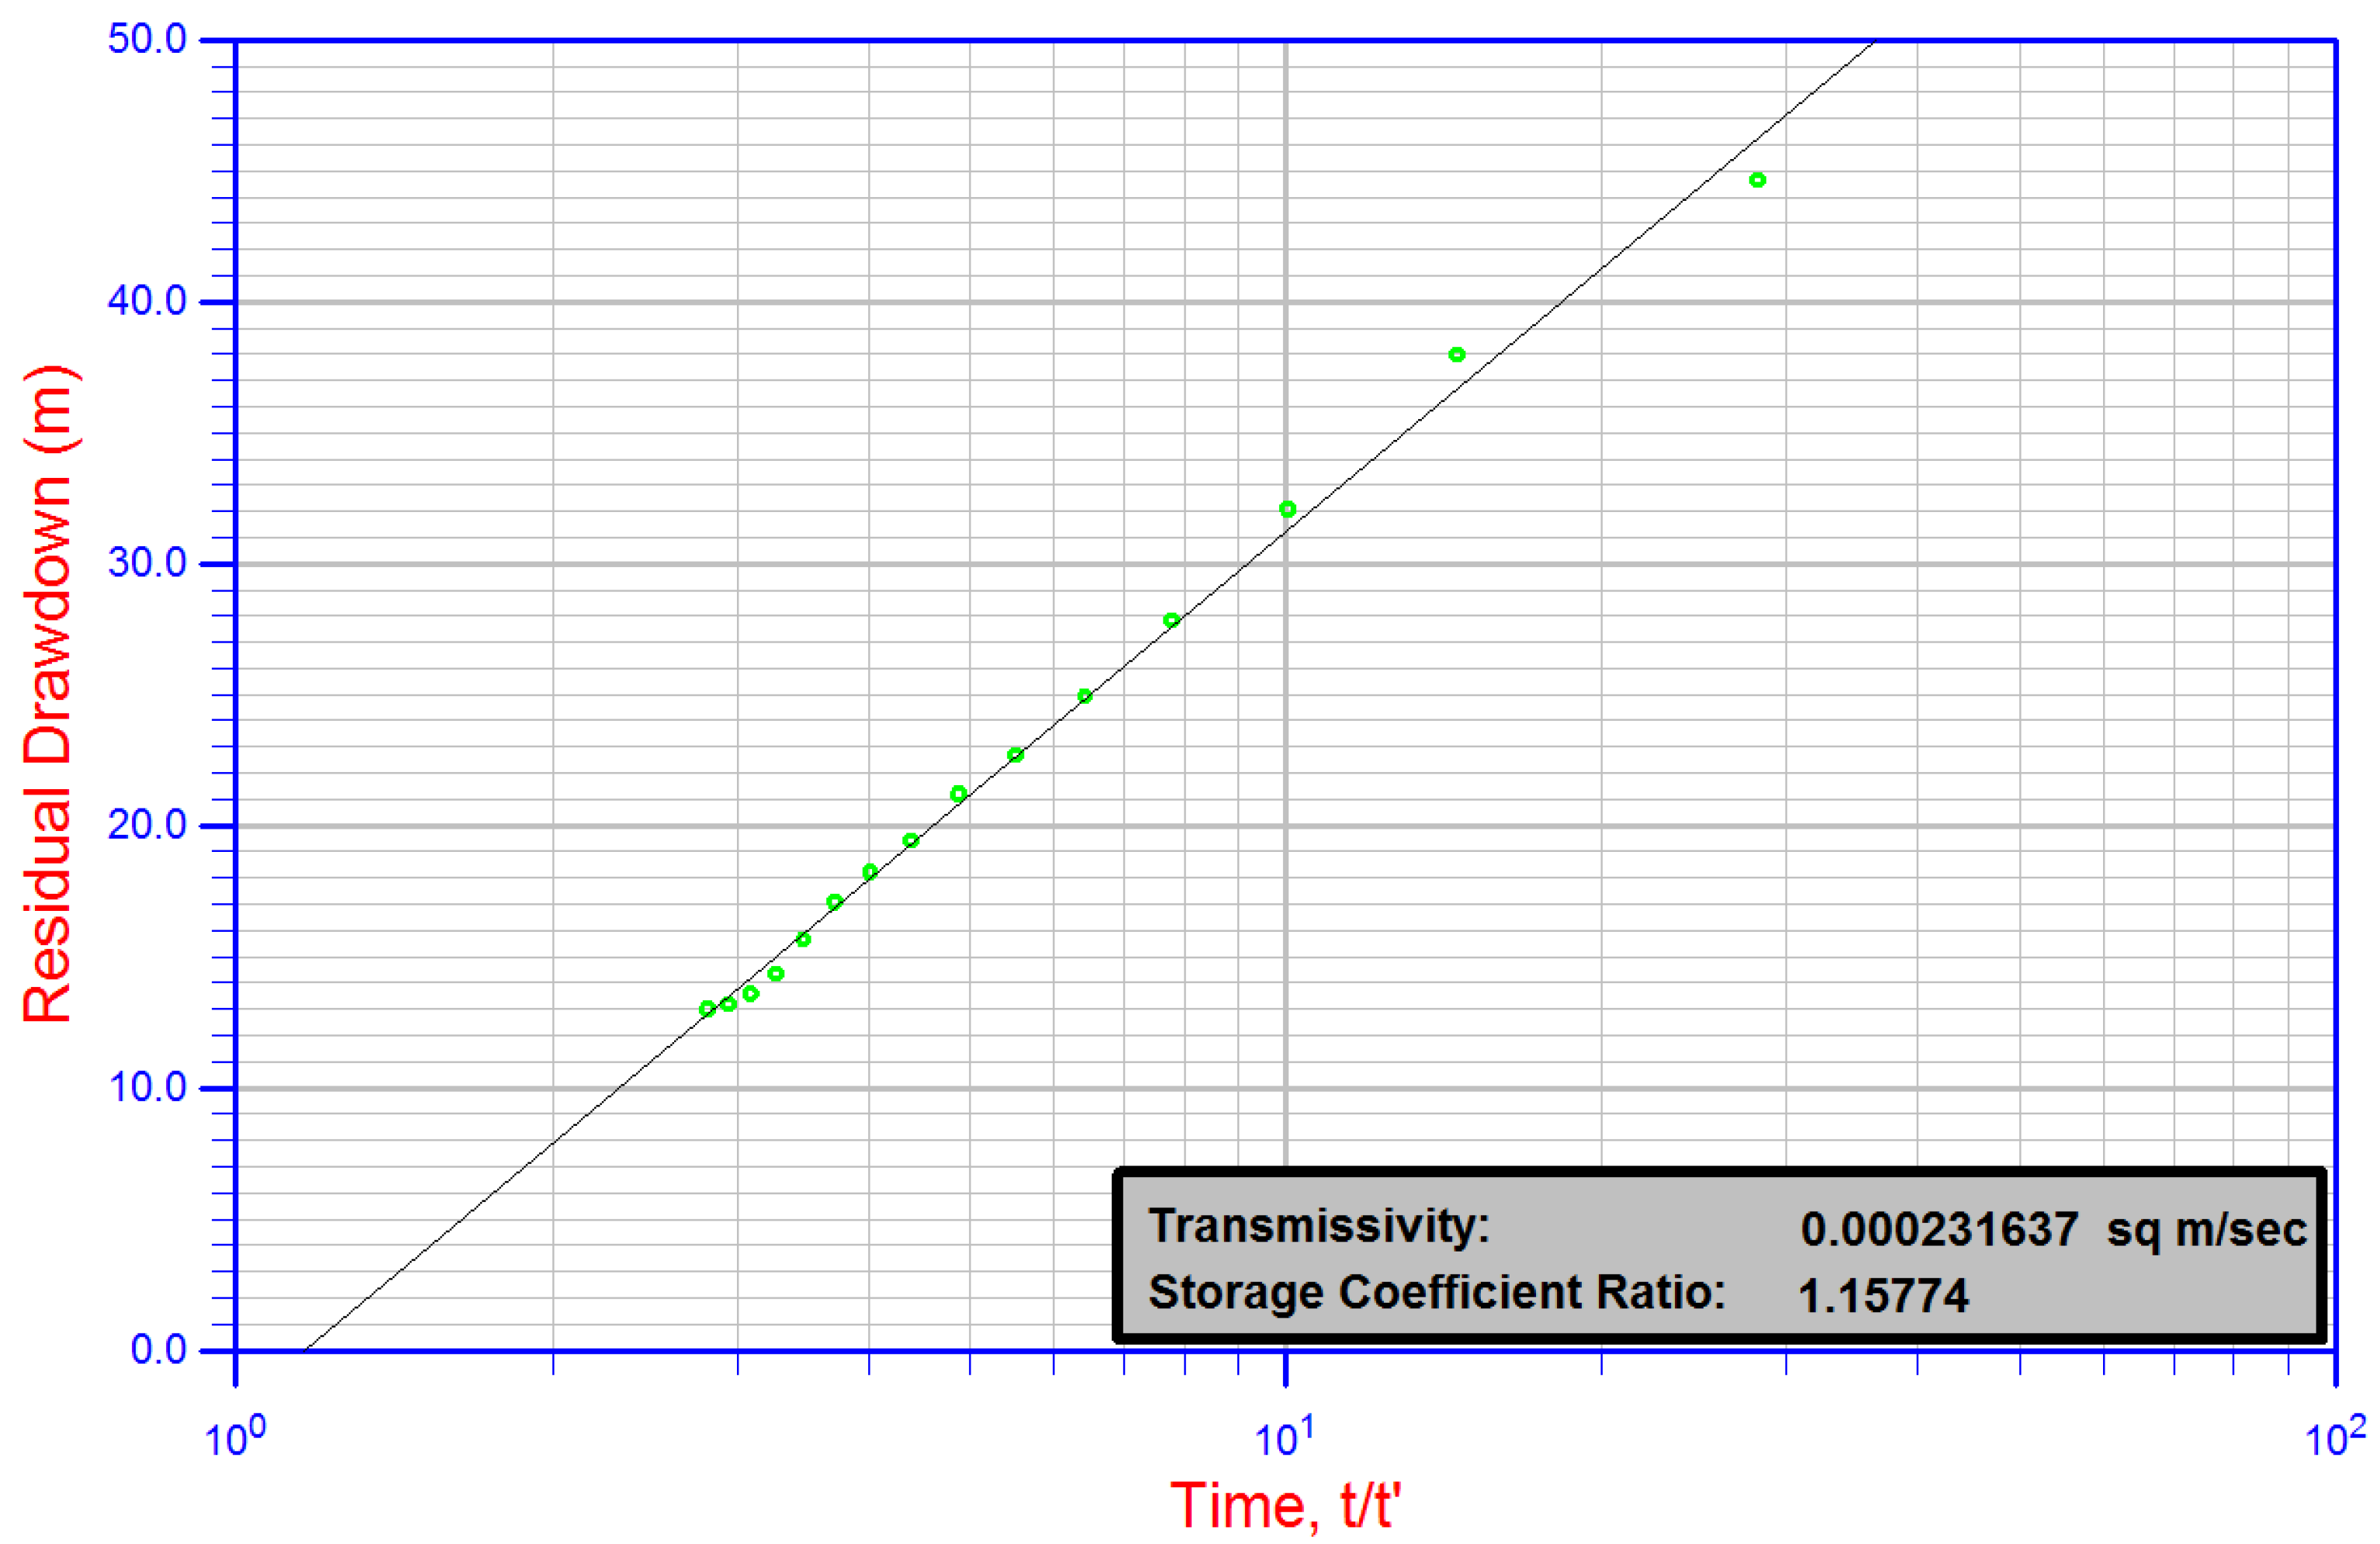
Results of the tests conducted to determine the basic hydraulic parameters of the aquifer accessed via the CH PIG-1 well using the Theis method [33] as modified by Agarwal [34] are presented in Table 3. Interpretation results are graphically presented in Figure 7 and Figure 8.
Hydrogeological surveys carried out in the CH PIG-1 borehole made it possible to verify its exploitable resources. This parameter was first determined in 1997 as 190 m3/h [36] and was subsequently corrected in 2009 to 120 m3/h (estimated based only on the analysis of pressure recorded since 2006 in the wellhead) [30]. In 1997, hydrodynamic tests were carried out as part of wider research in all boreholes within the Podhale Basin. At that time, the production resources for the CH-PIG 1 borehole were established at 190 m3/h. The decision was issued for 10 years, so it expired in 2007. In the new documentation, the resources were corrected to 120 m3/h only on the basis of a few pressure measurements from 2007–2009, as there was no exploitation and no other results. CH PIG-1 was not in operation until 2016. Normal exploitation only started in spring 2016, and it was then found that after over one year of borehole operation, the static pressure in the heated borehole was 5 bar above the level recorded in 2009 in the cooled down borehole. Therefore, the production resource figures were adjusted again. Earlier interpretations did not take the thermal lift effect into account and therefore were burdened with a significant error. At present, exploitable resources have been established at 160 m3/h at a depression of 145.5 m, which corresponds to an elevation of Hs = 799.5 m a.s.l. If the borehole is operated at the designated flow rate, the value of hydrodynamic changes determined is 421 m. The calculated value of the filtration coefficient for the aquifer accessed through the borehole is 9.32 × 10⁻⁷ m/s, which is within the range typical of the parameters of the Podhale Basin geothermal reservoir in question [18,21].

4.2. Hydrogeochemical Testing

Table 4 presents the physico-chemical characterisation of geothermal water samples from the CH PIG-1 well with the parameters analysed shown. Table 4 only shows those parameters for which the number of determinations enabled reliable statistical analysis in the next stage.
The available database for 2016–2018 included monthly measurements of the levels of main ions, TDS, SO4, and H2S performed in the accredited Hydrogeochemical Laboratory of the Hydrogeology and Engineering Geology Department at the AGH University of Science and Technology in Krakow. H2SiO3 and potassium contents were measured approximately once in two months; ferrumiron and manganese were measured quarterly in the same laboratory.
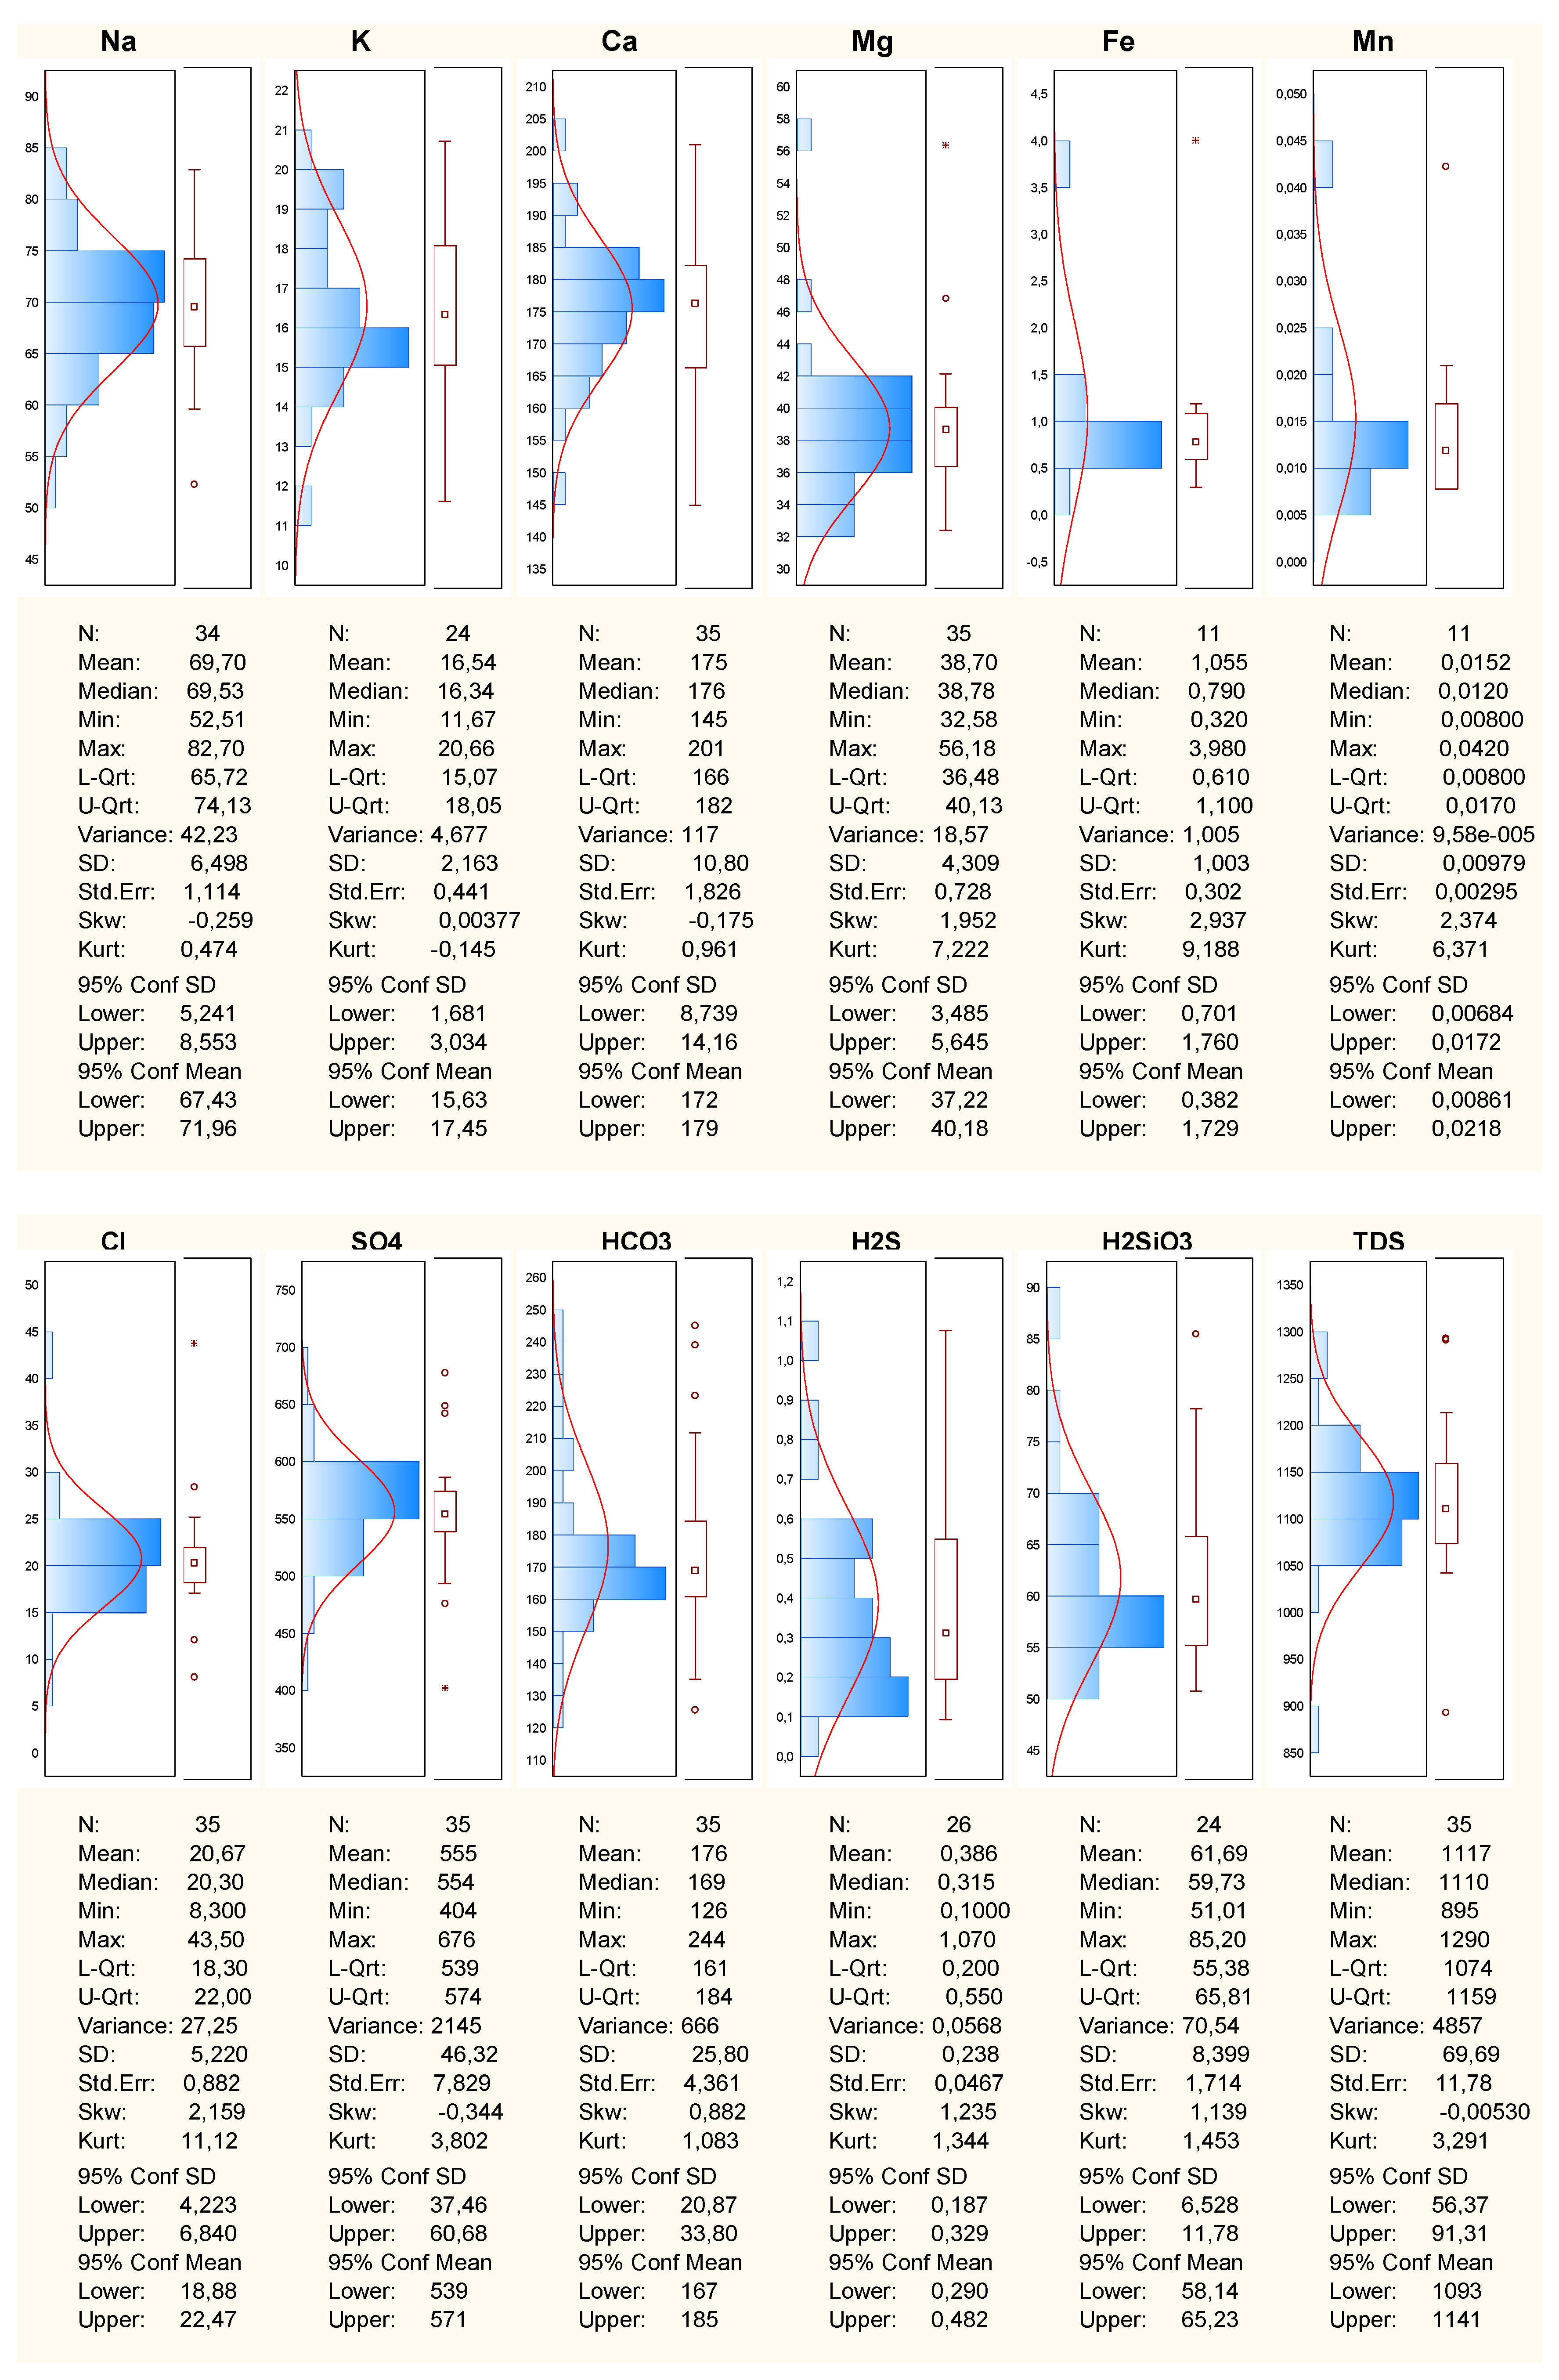
Using the STATISTICA software, basic statistical analysis was performed with respect to the variability of the observed main ions and parameters of the geothermal waters analysed, and distribution histograms were plotted to present the frequency distribution in a graphical manner (Figure 9).
The analysis of Figure 9 indicates that the variability of chemical indicators is characterised by different empirical distributions, which are presented graphically in the form of histograms. For most indicators, the distributions are unimodal, except for H2S where the sample may be assumed to be heterogeneous. The greatest variability was observed for cations (Na+, K+, Ca2+ ions) as well as for the hydrogen sulphide content. The results obtained may have been affected by the relatively small size of the data set shown in Table 4, since the indicators in question were determined once a month.
With respect to the data of observations of physical indicators, which were recorded in situ and for which a much larger sample of 267 results was available in 2019 (Table 4), a similar statistical variability analysis was performed using STATISTICA. The available database included the data from stationary studies from 2017–2019 carried out by employees of the “Chochołowskie Termy” Thermal Water Mining Plant:
-
determination of the wellhead pressure—the reading of the pressure value was made on the basis of the indications of a pressure gauge installed on the wellhead,
-
measurement of the water temperature at the outlet point by means of an automatic thermometer with a measurement accuracy of ±0.1 °C,
-
measurement of the conductivity (EC) of water at the outlet point using an automatic probe with a measurement accuracy of ±1 µS/cm at 20 °C.
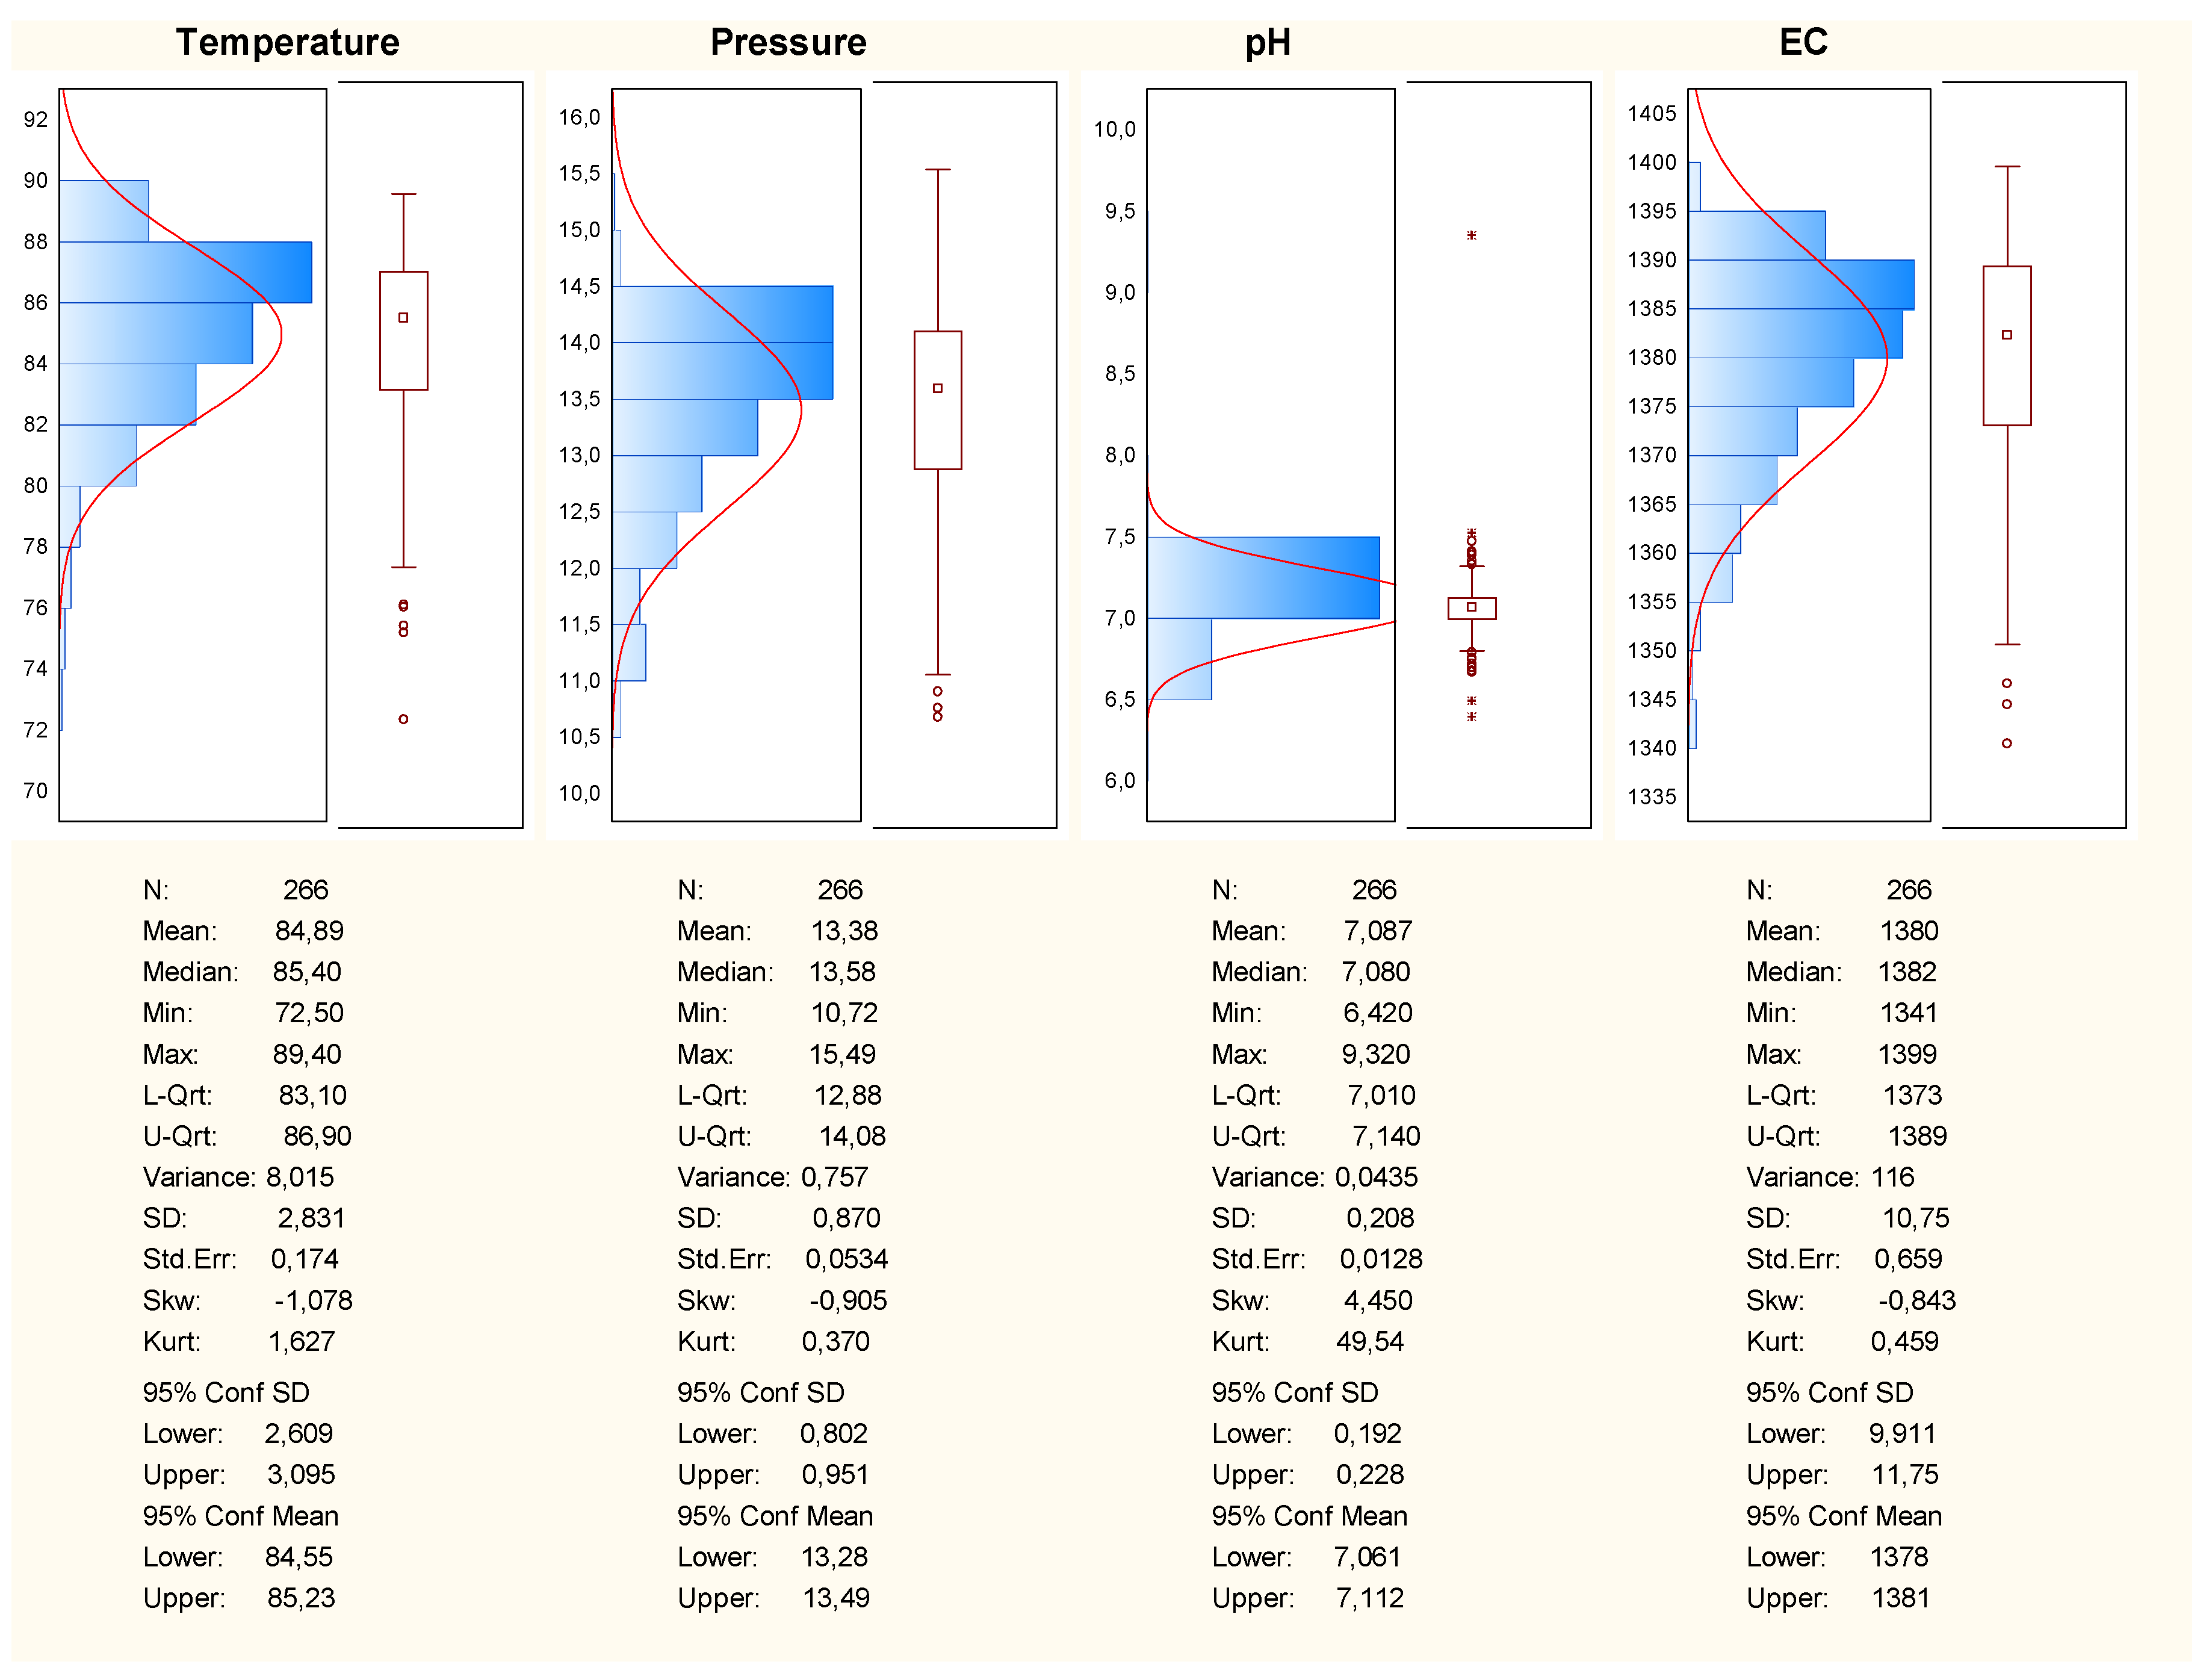
The data are presented in Figure 10.
The analysis of Figure 10 demonstrates that the parameters of stationary observations in 2019 exhibit unimodal left-skewed distributions. The lowest variation is observed with respect to the range of pH values recorded.
Analysing the results of the water tests performed in the CH PIG-1 well, it should be stated that the water extracted is expected to be characterised by a constant chemical composition and good bacteriological status. In the previous investigation, Operacz [43] showed that the appropriate operation of the CH PIG-1 borehole allows a proper temperature to be maintained, which underpins the functioning of the Chochołowskie Termy recreation and balneological complex.
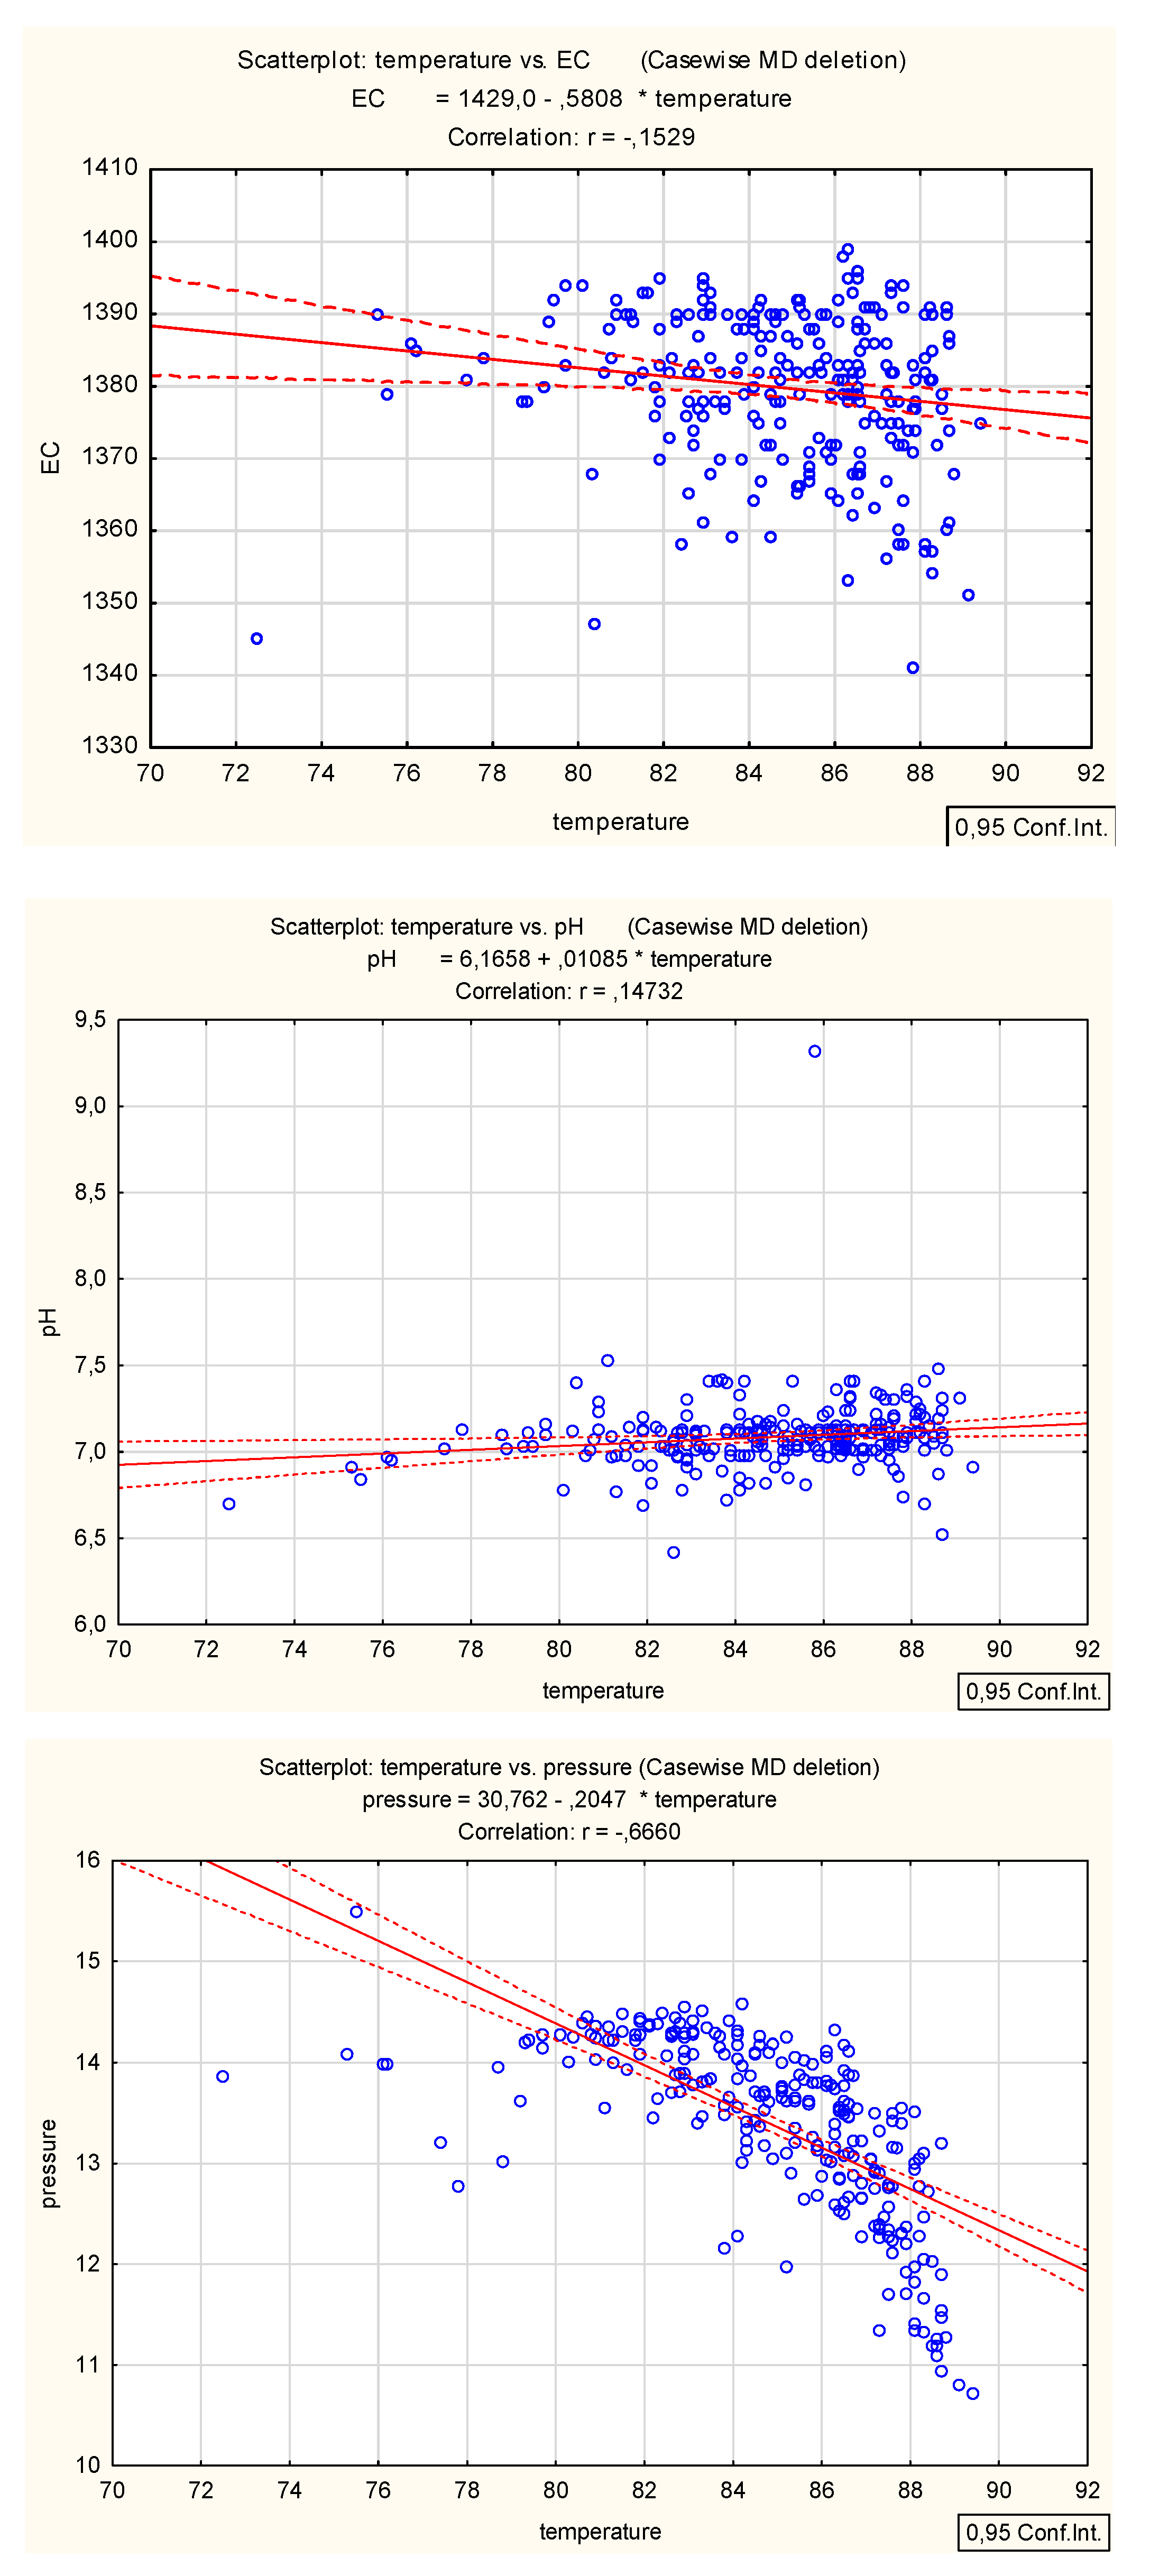
Since the temperature of exploited thermal waters is the essence of this article, it was decided to check whether the temperature in the studied borehole had an effect on other important parameters of the water from the intake. Relationships between the parameters of the geothermal waters extracted by the CH PIG-1 well determined during stationary observations in 2019 are presented under the assumption that temperature values are independent variables and the other parameters are dependent variables. The relationships were determined using Pearson’s linear correlation coefficient. The values of the correlation coefficient obtained in scatter graphs are shown in Figure 11.
Pearson’s correlation coefficient ranged from the lowest absolute value of −0.08 for total dissolved solids to the highest absolute value of −0.67 for the wellhead pressure. For the pH value, the correlation coefficient was 0.15.
As a result of the analysis, on the basis of the convention proposed by Guilford [41], a relationship was found only between the temperature measured at the outflow and the observed rare wellhead pressure. For this correlation, the coefficient was r = −0.67, which means moderate correlation. For TDS and pH, a practically insignificant relationship was observed.
For the relationship between temperature and the observed pressure at the wellhead, the value of the correlation coefficient was negative (a negative linear relationship was determined), which means that as the temperature increased, the wellhead pressure decreased This relationship can be presented using the following formula (Figure 11):
Pressure = 30.762 − 0.2047·temperature
The trend line formula presented in Figure 10 indicates that with each degree Celsius increase in temperature in the CH PIG-1 well, there is a pressure drop at the wellhead equal to approx. 0.2 bar. The intercept of the trend line equation does not affect the pressure variation because it is not statistically significant. The significance of the intercept was analysed by Student’s t-test.
The procedure presented in the article and the results obtained should constitute good practice in the evaluation of exploitable resources of geothermal water wells, of which evaluation should precede the subsequent stages of, inter alia, designing geothermal heat and power plants. In both cases, it is extremely important to analyse specific hydrogeothermal and geological conditions to assess the possibility of using geothermal resources and effective utilization [44,45]. Bujakowski et al. [18] argue that correct estimation of the operational parameters of the thermal water intake plays a key role in ensuring the possibility of long-term exploitation of thermal waters for heating purposes but also for recreational purposes. The importance of the stability of the chemical components of thermal water, used for recreational and balneological purposes, is emphasised by Kępińska i Ciągło [22]. The stability of chemical indicators in the water is important, not only because of the therapeutic qualities of thermal water (temperature, hydrogen sulphide, iodine, methacic acid contents), but also due to the issues related to the exploitation and disposal of water. According to Tomaszewska et al. [12], factors such as temperature, pH and the content of dissolved components in water, as well as operating parameters, including water pressure, have a decisive effect on the thermodynamic state of water and the tendency of precipitation of secondary (mineral) deposits from water (scaling). Scaling of the geothermal system, including the piping network, can cause immense problems with the operation of the system, as pointed out by Şimşek et al. [46].
Furthermore, the main parameters determining the power rating and the amount of energy available are the temperature of the geothermal water at the wellhead and the flow rate of geothermal water at the ground level [7,15,19,47,48]. As indicated by the authors of the aforementioned publications, the temperature of geothermal water is not the sole parameter determining the suitability of geothermal waters for energy purposes, although it is a crucial one. As already mentioned, the temperature of geothermal water feeding, e.g., a geothermal power plant, is important for the plant’s power rating and efficiency, as both parameters increase with the temperature of the geothermal water [49]. Regarding changes in the flow rate of geothermal water at the ground level, the amount of heat supplied to the technological system increases with this value. This directly increases the amount of energy that can be obtained, e.g., using heat exchangers in a geothermal heat plant or an evaporator in a geothermal power plant. For this reason, the presented issues together with the proper estimation of the geothermal intake parameters and the exploitation capacity of the intake are of great importance and constitute the key engineering issues in the field.
Both the plant’s power rating and the amount of heat or electricity that can be generated are parameters that have a direct bearing on the assessment of the economic viability of the potential investment project as well as on the environmental effect which can be achieved compared to methods based on conventional fuels [50,51]. This is particularly important if sustainable development is to be achieved in areas where no district heating networks are present and access to infrastructure such as gas mains is limited. Such absence of infrastructure results in increased environmental pollution (mainly air pollution) caused by the burning of conventional fuels. In such circumstances, geothermal energy may be the only prospect of improving this unfavourable state of affairs, since it offers a stable, environmentally friendly, and renewable energy source [52,53]. However, it is necessary to correctly estimate both the economic and environmental effects, and this is impossible without having precise information about the temperature and usable flow rate of geothermal water at the ground level. Furthermore, recreational water use and assessment of the stability of the physico-chemical and exploitation properties of the intake should always be correlated in order to ensure long-term and trouble-free operation.
One of the primary purposes of hydrodynamic tests is to determine the hydraulic parameters of the aquifer. The results of the tests are often flawed as a consequence of rejection of thermal heating of a well during pumping which leads to aberrant readings of the water level or wellhead pressure. A product of this is an erroneous higher hydraulic conductivity coefficient, which may lead to incorrect assessment of the admissible volume of extracted groundwater. The effect of thermal heating of a well, also called the thermal lift effect, is more important given a greater depth of a well and a greater temperature difference in the well’s profile. Bielec and Miecznik [1] presented equations that allow us to calculate the above affect, including the sample analysis of the data from a hydrodynamic test carried out in a 2000 m deep geothermal well. In this case, the maximum difference between the observed and reduced wellhead pressure was 0.172 MPa, i.e., approximately 17.3 m of the water column. The difference in the hydraulic conductivity coefficient calculated for both cases ranged from 216.7% (steps II and III of pumping) to 319.4% (step I of pumping). To summarize the analyses shown above, the conductivity of exploited geothermal water depends on the pumping level and could be two to three times higher with temperature correction compared to results without any correction.

5. Conclusions

In deep boreholes used to access geothermal waters, it is extremely important to take the thermal lift effect into account. Disregarding this effect invalidates analysis results and results in incorrect determinations of basic hydrogeological parameters. The article points out the most important aspects of the effect in question and provides an example of correct analysis for the CH PIG-1 well in southern Poland.
The thermal effect is very important in the practice of documenting the exploitation resources of thermal waters in Poland and is widely used and recommended by legislators. Thus, in applicable procedures and methodological guides, an obligation to properly define the thermal effect is imposed. This scientific article can be an excellent example of conduct where scientific considerations can and should be used in practical activities when documenting thermal water intakes. Hydrogeological properties of the thermal water reservoir, including primarily hydraulic conductivity, calculated on the basis of hydrodynamic tests without taking into account the thermal correction are overstated. This is also of practical importance when determining the extent of the mining impact (demarcation of the mining area). The final thermal lift effect does not directly affect production from the CH PIG-1 borehole but is essential for the proper determination of its deposit parameters. Thus, under the conditions prior to starting the exploitation of geothermal waters, i.e., at the stage of preparing hydrogeological documentation and obtaining a concession for the extraction of a mineral, deposit parameters were correctly established, inter alia, the resource area of the borehole and area of influence constituting the scope of the R. On this basis, the operator has correctly designated the mining area covered by the concession, where operator is the sole entity with the authorization to exploit geothermal waters.
In order to make the study more thorough, the basic statistical variability of ions, chemical compounds, and the parameters observed for the extracted geothermal waters was analysed. The results obtained showed a natural hydrogeochemical variability of the water intake. The value ranges obtained are typical of geothermal waters, especially of hot waters extracted in southern Poland (in the Podhale Basin).
Another extremely important matter is confirming the relationship between temperature and the observed borehole pressure (measured at the wellhead) on the basis of correlation analysis. This relationship was described by a regression equation. The relationship confirmed and supplements the existing information—as the temperature of water in the borehole increases, the pressure observed in the borehole decreases. The application of Pearson’s linear correlation method made it possible not just to confirm the phenomenon as such but also to determine a specific numerical relationship.
The procedure presented in this article, which was followed to correctly determine the basic parameters of the extracted geothermal waters, should be mandatory for all similar installations. Only the application of appropriate methodology and a thorough analysis of both hydrodynamic test results and water physico-chemical parameters allows for proper operation of such wells. Temperature, which is often regarded as the most important parameter of geothermal waters, determines their potential uses. Therefore, its precise determination and knowledge of the correlation between temperature and reservoir pressure are extremely important issues in geothermal studies.

Author Contributions

Conceptualization, A.O. and B.B.; Data curation, B.B.; Formal analysis, A.O., B.B. and B.T.; Methodology, A.O. and B.B.; Resources, A.O., B.B. and B.T.; Visualization, A.O., B.B. and M.K.; Writing—original draft, A.O., B.B. and B.T.; Writing—review & editing, A.O., B.T. and M.K. All authors have read and agreed to the published version of the manuscript.

Funding

This research received no external funding.

Acknowledgments

The authors would like to thank Chochołowskie Termy for the provision of data.

Conflicts of Interest

The authors declare no conflict of interest.

References

  1. Bielec, B.; Miecznik, M. Efekt termiczny w obliczeniach przewodności hydraulicznej w otworach ujmujących wodę termalną. Technika Poszukiwań Geologicznych Geotermi. Zrównoważony Rozw. 2012, 2, 45–54. [Google Scholar]
  2. Kawecki, M.W. Correction for temperature effect in the recovery of a pumped well. Ground Water 1995, 33, 917–926. [Google Scholar] [CrossRef]
  3. Kapuściński, J.; Nagy, S.; Dlugosz, P.; Biernat, H.; Bentkowski, A.; Zawisza, L.; Macuda, J.; Bujakowska, K. Zasady I Metodyka Dokumentowania Zasobów Wód Termalnych I Energii Geotermalnej Oraz Sposoby Odprowadzania Wód Zużytych; Poradnik Metodyczny: Warszawa, Poland, 1997. [Google Scholar]
  4. Ramey, H.J., Jr. Advanced in Practical Well Test Analysis. J. Pet. Technol. 1992, 44. Available online: https://www.onepetro.org/journal-paper/SPE-20592-PA (accessed on 24 July 2020). [CrossRef]
  5. Operacz, A.; Chowaniec, J. Perspective of geothermal water use in the Podhale Basin according to geothermal step distribution. Geol. Geophysics Environ. 2018, 44, 379–389. [Google Scholar] [CrossRef] [Green Version]
  6. Aliyu, M.D.; Chen, H.-P. Sensitivity analysis of deep geothermal reservoir: Effect of reservoir parameters on production temperature. Energy 2017, 129, 101–113. [Google Scholar] [CrossRef]
  7. Yildirim, N.; Parmanto, S.; Akkurt, G. Thermodynamic assessment of downhole heat exchangers for geothermal power generation. Renew. Energy 2019, 141, 1080–1091. [Google Scholar] [CrossRef]
  8. Kaczmarczyk, M.; Sowiżdżał, A.; Tomaszewska, B. Energetic and Environmental Aspects of Individual Heat Generation for Sustainable Development at a Local Scale—A Case Study from Poland. Energies 2020, 13, 454. [Google Scholar] [CrossRef] [Green Version]
  9. Górecki, W.; Sowiżdżał, A.; Hajto, M.; Wachowicz-Pyzik, A. Atlases of geothermal waters and energy resources in Poland. Environ. Earth Sci. 2015, 74, 7487–7495. [Google Scholar] [CrossRef] [Green Version]
  10. Sowiżdżał, A. Geothermal energy resources in Poland—Overview of the current state of knowledge. Renew. Sustain. Energy Rev. 2018, 82, 4020–4027. [Google Scholar] [CrossRef]
  11. Kaczmarczyk, M.; Tomaszewska, B.; Pająk, L. Geological and Thermodynamic Analysis of Low Enthalpy Geothermal Resources to Electricity Generation Using ORC and Kalina Cycle Technology. Energies 2020, 13, 1335. [Google Scholar] [CrossRef] [Green Version]
  12. Tomaszewska, B.; Szczepański, A. Possibilities for the efficient utilisation of spent geothermal waters. Environ. Sci. Pollut. Res. 2014, 21, 11409–11417. [Google Scholar] [CrossRef] [PubMed] [Green Version]
  13. Huculak, M.; Jarczewski, W.; Dej, M. Economic aspects of the use of deep geothermal heat in district heating in Poland. Renew. Sustain. Energy Rev. 2015, 49, 29–40. [Google Scholar] [CrossRef]
  14. Sokołowski, J.; Doktor, S.; Górecki, W.; Graniczny, M.; Myśko, A.; Jawor, E.; Karnkowski, P.; Ney, R.; Nowotarski Cz Poprawa, D.; Słuszkiewicz, T.; et al. Projekt Badań Geologicznych Określających Zasoby I Warunki Eksploatacji Surowców Energetycznych W Niecce Podhalańskiej; Arch. OK PIG-PIB: Kraków, Poland, 1978; unpublished. [Google Scholar]
  15. ISO. ISO/IEC 17025—General Requirements for the Competence of Testing and Calibration Laboratories; ISO: Geneva, Switzerland, 2017. [Google Scholar]
  16. Chowaniec, J.; Olszewska, B.; Poprawa, D.; Skulich, J.; Smagowicz, M. Dokumentacja Hydrogeologiczna Zasobów Wód Podziemnych—Wody Termalne. Otwór Chochołów PIG-1; Centralne Archiwum Geologiczne w Warszawie: Warszawa, Poland, 1992. [Google Scholar]
  17. Bujakowski, W.; Barbacki, A. Potential for geothermal development in Southern Poland. Geothermics 2004, 33, 383–395. [Google Scholar] [CrossRef]
  18. Bujakowski, W.; Tomaszewska, B.; Miecznik, M. The Podhale geothermal reservoir simulation for long-term sustainable production. Renew. Energy 2016, 99, 420–430. [Google Scholar] [CrossRef]
  19. Barbacki, A.P.; Bujakowski, W.; Pająk, L. Atlas Zbiorników Wód Geotermalnych Małopolski; Publishing House of the Mineral and Energy Economy Research Institute of the Polish Academy of Sciences: Kraków, Poland, 2006. [Google Scholar]
  20. Kępińska, B. Warunki Termiczne I Hydrotermalne Podhalańskiego Systemu Geotermalnego; Studia, Rozprawy, Monografie, Zeszyt 135; Publishing House of the Mineral and Energy Economy Research Institute of the Polish Academy of Sciences: Kraków, Poland, 2006. [Google Scholar]
  21. Kępińska, B. The role of the Podhale geothermal system’s research for geothermal water. Technika Poszukiwań Geologicznych Geotermia Zrównoważony Rozwój 2009, 244, 29–48. [Google Scholar]
  22. Kępińska, B.; Ciągło, J. Możliwości zagospodarowania wód geotermalnych Podhala do celów balneoterapeutycznych i rekreacyjnych. Geologia 2008, 34, 541–559. [Google Scholar]
  23. Kępińska, B. Geothermal energy country update report from Poland, 2010–2014. In Proceedings of the World Geothermal Congress 2015, Melbourne, Australia, 19–24 April 2015. [Google Scholar]
  24. Kaczmarczyk, M.; Tomaszewska, B.; Operacz, A. Sustainable utilization of low enthalpy geothermal resources to electricity generation through a cascade system. Energies 2020, 13, 2495. [Google Scholar] [CrossRef]
  25. Bugajski, P.; Nowobilska-Majewska, E.; Nowobilska-Luberda, A.; Bergel, T. The use of geothermal waters in Podhale in terms of tourism and industrial applications. J. Ecol. Eng. 2017, 18, 185–191. [Google Scholar] [CrossRef]
  26. Chowaniec, J.; Zuber, A.; Ciężkowski, W. Prowincja karpacka. In Hydrogeologia Regionalna Polski, T. II. Wody Mineralne, Lecznicze I Termalne Oraz Kopalniane; Paczyński, B., Sadurski, A., Eds.; Państwowy Instytut Geologiczny: Warszawa, Poland, 2007. [Google Scholar]
  27. Oszczypko, N. Charakterystyka tektoniczna i geologiczna polskich Karpat Zachodnich. In Atlas Zasobów Geotermalnych Polskich Karpat Zachodnich; Górecki, W., Ed.; Goldruk: Kraków, Poland, 2011. [Google Scholar]
  28. Cieszkowski, M.; Uchman, A.; Chowaniec, J. Litostratygrafia sukcesji osadowej niecki podhalańskiej. In Budowa Geologiczna Tatr I Podhala Ze Szczególnym Uwzględnieniem Zjawisk Geotermalnych Na Podhalu; Uchman, A., Chowaniec, J., Eds.; Państwowy Instytut Geologiczny: Bukowina Tatrzańska, Poland, 2009. [Google Scholar]
  29. Chowaniec, J. Podhale Basin—The Most Perspective Reservoirof Thermal Waters in the Polish Carpathian. Współczesne Problemy Hydrogeologii 2007, 13, 931–938. [Google Scholar]
  30. Chowaniec, J.; Duliński, M.; Mochalski, P.; Najman, J.; Śliwka, I.; Zuber, A. Environmental tracers in thermal waters of Podhale Basin. Przegląd Geologiczny 2009, 57, 685–693. [Google Scholar]
  31. Józefko, I.; Bielec, B. Dokumentacja Hydrogeologiczna Ustalająca Zasoby Eksploatacyjne Ujęcia Wód Termalnych “Chochołów PIG-1”; Centralne Archiwum Geologiczne w Warszawie: Warszawa, Poland, 2009; unpublished. [Google Scholar]
  32. Bielec, B.; Operacz, A. Dodatek Do Dokumentacji Hydrogeologicznej Ustalającej Zasoby Eksploatacyjne Ujęcia Wód Termalnych “Chochołów PIG-1”; VENA: Kraków, Poland, 2018; unpublished. [Google Scholar]
  33. Theis, C.V. The relation between the lowering of the piezometric surface and the rate and duration of discharge of a well using groundwater storage. Trans. Amer. Geophys. Union 1935, 16, 519–524. [Google Scholar] [CrossRef]
  34. Agarwal, R.G. A new method to account for producing time effects when drawdown type curves are used to analyze pressure buildup and other test data. In Proceedings of the 55th Annual Fall Technical Conference and Exhibition of the Society of Petroleum Engineers, Paper SPE 9289, Dallas, TX, USA, 21–24 September 1980. [Google Scholar]
  35. Dąbrowski, S.; Przybyłek, J. Metodyka Próbnych Pompowań W Dokumentowaniu Zasobów Wód Podziemnych. Poradnik Metodyczny; Bogucki Wydawnictwo Naukowe: Poznań, Poland, 2005. [Google Scholar]
  36. Bielec, B.; Hołojuch, G. Pompowanie testowe w dokumentowaniu wód termalnych. Technika Poszukiwań Geologicznych Geotermia Zrównoważony Rozwój 2011, 1–2, 319–328. [Google Scholar]
  37. Chowaniec, J.; Długosz, P.; Drozdowski, B.; Nagy, S.; Poprawa, D.; Witczak, S.; Witek, K. Dokumentacja Hydrogeologiczna Zasobów Wód Termalnych Niecki Podhalańskiej; Centralne Archiwum Geologiczne w Warszawie: Warszawa, Poland, 1997; unpublished. [Google Scholar]
  38. ISO. ISO/IEC 5667-11: Water Quality—Sampling—Part 11: Guidance on Sampling of Groundwaters; ISO: Geneva, Switzerland, 2004. [Google Scholar]
  39. Witczak, S.; Kania, J.; Kmiecik, E. Guidebook on Selected Physical and Chemical Indicators of Groundwater Contamination and Methods of Their Determination; Biblioteka Monitoringu Środowiska: Warszawa, Poland, 2013. [Google Scholar]
  40. Zdechlik, R.; Dwornik, M.; Wątor, K. Practical aspects of water sampling in groundwater monitoring. Biuletyn Państwowego Instytutu Geologicznego 2013, 456, 659–664. [Google Scholar]
  41. Guilford, J.P. Fundamental Statistics in Psychology and Education; McGraw-Hill: New York, NY, USA, 1965. [Google Scholar]
  42. Lee, J. Well Testing; SPE Textbook Series; SPE: Dallas, TX, USA, 1982; Volume 1. [Google Scholar]
  43. Operacz, A. Variability of basic geothermal water parameters in Chochołów PIG-1 borehole in the western part of the Podhale Basin. Infrastruct. Ecol. Rural Areas 2018, 4, 961–972. [Google Scholar]
  44. Jeleński, T.; Dendys, M.; Tomaszewska, B.; Pająk, L. The potential of RES in the reduction of air pollution: The SWOT analysis of smart energy management solutions for Krakow Functional Area (KrOF). Energies 2020, 13, 1754. [Google Scholar] [CrossRef] [Green Version]
  45. Pająk, L.; Tomaszewska, B.; Bujakowski, W.; Bielec, B.; Dendys, M. Review of the Low-Enthalpy Lower Cretaceous Geothermal Energy Resources in Poland as an Environmentally Friendly Source of Heat for Urban District Heating Systems. Energies 2020, 13, 1302. [Google Scholar] [CrossRef] [Green Version]
  46. Şimşek, S.; Yıldırım, N.; Gülgör, A. Developmental and environmental effects of the Kızıldere geothermal power project, Turkey. Geothermics 2005, 34, 239–256. [Google Scholar] [CrossRef]
  47. Kaczmarczyk, M. Impact of rock mass temperature on potential power and electricity generation in the ORC installation. E3S Web Conf. 2017, 24, 02007. [Google Scholar] [CrossRef] [Green Version]
  48. Fiaschi, D.; Manfrida, G.; Rogai, E.; Talluri, L. Exergoeconomic analysis and comparison between ORC and Kalina cycles to exploit low and medium-high temperature heat from two different geothermal sites. Energy Convers. Manag. 2017, 154, 503–516. [Google Scholar] [CrossRef]
  49. Bertani, R. Geothermal Power Generation in the World 2010–2014 Update Report. In Proceedings of the World Geothermal Congress 2015, Melbourne, Australia, 19–25 April 2015. [Google Scholar]
  50. Kaczmarczyk, M. Potential of existing and newly designed geothermal heating plants in limiting of low emissions in Poland. E3S Web Conf. 2018, 44, 62. [Google Scholar] [CrossRef] [Green Version]
  51. Benedek, J.; Tihamér-Tibor, S.; Bartók, B. Evaluation of renewable energy sources in peripheral areas and renewable energy-based rural development. Renew. Sustain. Energy Rev. 2018, 90, 516–535. [Google Scholar] [CrossRef]
  52. Frank, A.G.; Gerstlberger, W.; Paslauski, C.A.; Visintainer-Lerman, L.; Ayala, N.F. The contribution of innovation policy criteria to the development of local renewable energy systems. Energy Policy 2018, 115, 353–365. [Google Scholar] [CrossRef]
  53. Kaczmarczyk, M. Methodology and impact categories of environmental life cycle assessment in geothermal energy sector. E3S Web Conf. 2019, 100, 32. [Google Scholar] [CrossRef]
Figure 1. Geological map of Podhale (based on [26], modified).
Energies 13 03882 g001
Figure 2. Geological profile of the CH PIG-1 borehole (based on [31], modified).
Energies 13 03882 g002
Figure 3. Construction of the CH PIG-1 borehole (based on [32], modified).
Energies 13 03882 g003
Figure 4. Variability of the flow rate, wellhead pressure, and temperature during pumping in the CH PIG-1 borehole on 27–28 November 2017.
Energies 13 03882 g004
Figure 5. Variability of pH and EC during pumping in the CH PIG-1 borehole on 27–28 November 2017.
Energies 13 03882 g005
Figure 6. Static and dynamic water levels in the CH PIG-1 well.
Energies 13 03882 g006
Figure 7. Diagnostic chart—pressure recovery after the first phase of the hydrodynamic test in the CH PIG-1 borehole.
Energies 13 03882 g007
Figure 8. Diagnostic chart—pressure recovery after the second phase of the hydrodynamic test in the CH PIG-1 borehole.
Energies 13 03882 g008
Figure 9. Basic statistical parameters and histograms of the parameters and ions analysed in the 2016–2019 multiannual period.
Energies 13 03882 g009
Figure 10. Basic statistical parameters and histograms of stationary observations in 2019.
Energies 13 03882 g010
Figure 11. Graphs of variation of the parameters analysed as a function of temperature.
Energies 13 03882 g011
Table 1. Characteristics of the hydrodynamic test of the CH PIG-1 well [32].
Scope of WorkDetails of Work
preparation workshutdown of borehole exploitation for 2 h
single-stage, repeatable hydrodynamic testPhase I:
● pumping (2 h)
  - wellhead pressure before pumping:1.5 MPa
  - average efficiency during pumping:160.4 m3/h
  - wellhead pressure at the end of pumping:0.72 MPa
  - thermal water temperature at the end of pumping:89.6 °C
● stabilisation (2 h, 5 min)
Phase II:
● pumping (2 h, 15 min):
  - wellhead pressure before pumping1.47 MPa
  - average efficiency during pumping:151.9 m3/h
  - wellhead pressure at the end of pumping:0.88 MPa
  - thermal water temperature at the end of pumping89.8 °C
● stabilisation (1 h, 15 min)
Table 2. Basic results of hydrodynamic tests carried out in the CH PIG-1 well (based on [32]).
Dynamic LevelFlow Rate [m3/h]Depression/Pressure [m]/[MPa]Unit Flow Rate [m3/h/1 mS]Water Temperature at Wellhead [°C]Time [hh:mm]
Phase I160.479.5/0.782.0289.602:00
Stabilisation02:05
Phase II151.963.2/0.622.4089.802:15
Stabilisation01:15
Table 3. Parameter interpretation results based on hydrodynamic testing in the CH PIG-1 borehole [32].
Analysis TypeDynamic LevelConductivity [m2/s]Filtration Coefficient “k” [m/s]
Lift analysis (with temperature correction)Phase I3.82 × 10−41.16 × 10⁻⁶
Phase II2.32 × 10−47.04 × 10⁻⁷
Table 4. Physico-chemical characterisation of geothermal water samples.
ParameterUnitsAverageIntervalNumber of Analysed Samples
Temperature°C84.972.5–89.4267
Wellhead pressureBar13.3810.72–15.49267
EC (electrical conductivity)µS/cm at 20 °C13801341–1399267
pH7.096.42–9.32267
Total dissolved solids (TDS)mg·dm−31116.8895.2–1290.336
Calcium (Ca)mg·dm−3175.28145.3–200.636
Magnesium (Mg)mg·dm−338.7032.58–56.1836
Sodium (Na)mg·dm−369.752.51–82.736
Chlorides (Cl)mg·dm−320.678.3–43.536
Bicarbonates (HCO3)mg·dm−3176.3126.3–244.436
Potassium (K)mg·dm−316.5411.67–20.6625
Iron (Fe)mg·dm−31.060.32–3.9812
Manganese (Mn)mg·dm−30.0150.008–0.04212
Sulphur (SO4)mg·dm−3555.3403.5–676.136
Hydrogen sulfide (H2S)mg·dm−30.390.1–1.0736
Metasilic acid (H2SiO3)mg·dm−361.6951.01–85.225