Article

Influence of Loading Rate on the Energy Evolution Characteristics of Rocks under Cyclic Loading and Unloading

1
School of Resources and Safety Engineering, Central South University, Changsha 410083, China
2
Key Laboratory of Rock Mechanics and Geohazards of Zhejiang Province, Shaoxing 312000, China
3
College of Civil Engineering, Tongji University, Shanghai 200092, China
*
Authors to whom correspondence should be addressed.
Energies 2020, 13(15), 4003; https://doi.org/10.3390/en13154003
Submission received: 6 July 2020 / Revised: 23 July 2020 / Accepted: 29 July 2020 / Published: 3 August 2020

Abstract

:
To analyse the effect of loading rate on the energy evolution of rocks under cyclic loading and unloading, tests on saturated limestone were conducted at loading rates of 0.15, 0.2, and 0.3 mm/min, and the evolution characteristics of plastic, elastic, dissipation, and input energies were examined under different loading rates. The results indicated that the plastic strain in the entire test was directly proportional to the loading rate. In addition, strength, residual stress, plastic energy, and dissipation energy under residual resistance were inversely proportional to the loading rate. The plastic strain exhibited a decreasing–stabilising–increasing trend, and the smaller loading rate delayed the “increasing” trend. The increasing extent of each energy exhibited the following trend: input > elastic > plastic > dissipation energy. Furthermore, the first three types of energy exhibited a slow–fast–slow–fast increase trend. The dissipation energy exhibited a fast–steady–fast–slow–fast increase trend. Additionally, the elastic energy index exhibited a large increase–steady increase–decrease trend, which was proportional to the loading rate. The damping ratio exhibited a decrease–increase–decrease–increase–decrease trend which was proportional to the loading rate in the compaction stage and inversely proportional to the plastic stage.

1. Introduction

In the processes of driving, blasting, and mining in deep mining operations, the surrounding rock alternately exhibits the states of pressure increase and release. This is essentially a process of cyclic loading and unloading [1]. During the loading process, strain energy is released continuously in the form of an elastic wave in the surrounding rock. Once the local rock block is damaged, a large amount of elastic strain energy stored in the surrounding rock is released rapidly, which may lead to the overall instability of the surrounding rock, rock burst, and other dynamic disasters. In the underground mines affected by groundwater, the rock is typically saturated [2]. Therefore, it is important to study the energy evolution mechanism of saturated rock under cyclic loading and unloading to analyse the failure mechanism of a deep rock mass.
Typically, the energy in a rock is composed of plastic energy, elastic energy, input energy, and dissipation energy. The transformation and distribution of energy in a rock under cyclic loading and unloading follow certain rules [3]. Generally, as the loading stress increases, all types of energy gradually increase. The rate of increase is the highest in the case of input energy, followed by elastic energy and plastic energy [4]; the rate of increase is the lowest in the case of dissipation energy [5,6]. During loading and unloading, the storage rate of elastic energy first decreases, then increases, and finally decreases again. The second “decrease” occurs after entering the plastic stage [7], and the energy release index of elastic energy increases constantly [8]. Before reaching the peak strength, the input energy follows the law of stable development and then accelerated growth, and its value is proportional to the area of the hysteresis loop [9]. Furthermore, the input energy is released continuously after reaching the peak strength [10]. The dissipation energy undergoes the following development process: increase–decrease–increase, and the cumulative dissipation energy increases in the form of an exponential function [11,12]. The ratio of dissipation energy to input energy follows the law of nonlinear reduction in the early stage, an increase in the plastic stage, and a sudden increase after failure [13,14]. The aforementioned laws of energy evolution are relatively independent and exhibit relatively weak correlation. The mechanism of energy transformation is highly complex. Therefore, it is necessary to examine the energy transformation process and laws.
The loading rate affects the energy change in the rock. Cieslik et al. [15] conducted uniaxial compression tests on carbonate rocks, and they revealed a direct relationship between the dissipation energy and loading rate during the loading process. Kim et al. [16] studied the effect of loading rate on energy absorption via a uniaxial loading test, and the results indicated that as the loading rate increases, the energy absorbed by the rock decreases. Millon et al. [17] conducted dynamic loading tests on limestone and observed that as the loading rate increased, the absorption rate of input energy, number of free surfaces, and dissipation energy increased. Li Yangyang et al. calculated several types of energies using the stress–strain curve of cyclic loading and unloading. They observed that as the loading rate increases, the proportion of dissipation energy to total energy increases in the early stages of loading and unloading [18], and it decreases before reaching the peak strength. However, the proportion of elastic energy in the total energy follows the opposite trend to that of the proportion of dissipation energy in the total energy. Wang Xiaoran et al. concluded via a uniaxial loading test that the elastic performance at the peak strength is directly proportional to the loading rate [19]. Chen Ziquan showed that the elastic energy release rate is directly proportional to the unloading rate [20]. In deep well mining, the advancing speed of the working face affects the process of stress transfer of the surrounding rock [21], which leads to a change in the law of energy accumulation, release, and dissipation in the surrounding rock. Currently, the effect of the loading rate on the energy-transformation process and mechanism is not clear. Therefore, it is important to study the energy evolution processes of rocks under different loading rates.
In conclusion, the energy-evolution characteristics of saturated rocks under different loading rates are different. However, the sudden failure of deep rocks can be predicted more comprehensively by understanding the governing laws. To study the effect of the loading rate on the energy-conversion relationship in saturated rocks, saturated limestone was considered for examination in this study. Cyclic loading and unloading tests were conducted on saturated limestone samples at different loading rates. Furthermore, the evolution processes of plastic energy, elastic energy, input energy, and dissipation energy of the rock under different loading rates were analysed.

2. Test Materials and Methods

2.1. Rock Sample

The selected rock sample was an argillaceous grain limestone with a large amount of calcite on the surface and a massive structure. The sample was mined from the Gaofeng tin mine, Guangxi, China. Furthermore, X-ray fluorescence (XRF) and X-ray diffraction (XRD) results (see Table 1 and Table 2) indicated that the rock sample was filled with calcite. Additionally, the rock sample was cemented by small amounts of clay minerals, dolomite, pyrite, talc, and other minerals containing serpentine. Based on the ISRM method [22], the limestone was processed into a 100 mm × Φ 50 mm cylinder sample. After grouping and vacuum saturation treatment, the average initial porosity of the rock sample was 0.53%, as measured by NMR.

2.2. Test Flow

Based on the phenomenon that the influence range of the surrounding rock affected by mining increases gradually [23,24] in the mining process of the ore body, the equal increase amplitude loading and unloading method was adopted wherein the stress peak value was increased in steps of σ Δ = 5 MPa. The load path is shown in Figure 1.
Based on the principle of selecting a stable loading rate for the test, three different loading rates were selected: 0.15, 0.2, and 0.3 mm/min. The cyclic loading and unloading tests were conducted in the displacement control mode, and the unloading rate was set at 1 mm/min.
Based on the aforementioned scheme, the uniaxial loading and unloading on rock samples were carried out with the electro-hydraulic servo compression testing machine (YNS-Y Series, Changchun, China), as shown in Figure 2. The centre of the rock sample before testing was taken as the measuring reference point. Finally, the mechanical and deformation parameters of the entire loading and unloading process were obtained.

3. Mechanical Deformation Characteristics of Rock Under Cyclic Loading and Unloading

3.1. Effect of Loading Rate on Mechanical Characteristics

The stress–strain curves of typical rock samples at three loading rates are shown in Figure 3. In the early cycle, a loading curve still rises along the loading route of the previous cycle after its peak stress. However, at a later cycle, the rock exhibits a large deformation, which results in a loading curve that no longer rises along the route of the previous cycle, owing to the strong viscoplasticity of the saturated rock when it just enters the plastic stage. The elastic energy accumulated in the previous cycle is released permanently in this cycle, and this leads to a large strain during the loading process of the cycle. Hence, the curve no longer rises along the previous route. Before this cycle, the secant slope of each loading curve of the rock increases as the number of cycles increases.
It is also shown in Figure 3 that as the loading rate increases, there is an overall deeper concave trend on the curve, and the slope at the start of the zero-stress point gradually decreases. This leads to a gradual increase in the plastic strain εmax in the entire test during the loading and unloading process. This causes more damage to the rock. Thus, the rock strength σc and residual stress σr decrease.

3.2. Influence of Loading Rate on Deformation Characteristics

Typically, the saturated rock under loading and unloading does not directly fail when it reaches the peak strength; it continues to maintain stress and generate deformation in the subsequent softening stage [25]. The deformation in the softening stage is relatively stable, and the change is small. Therefore, the deformation characteristics before the peak strength and in the softening stage were analysed.

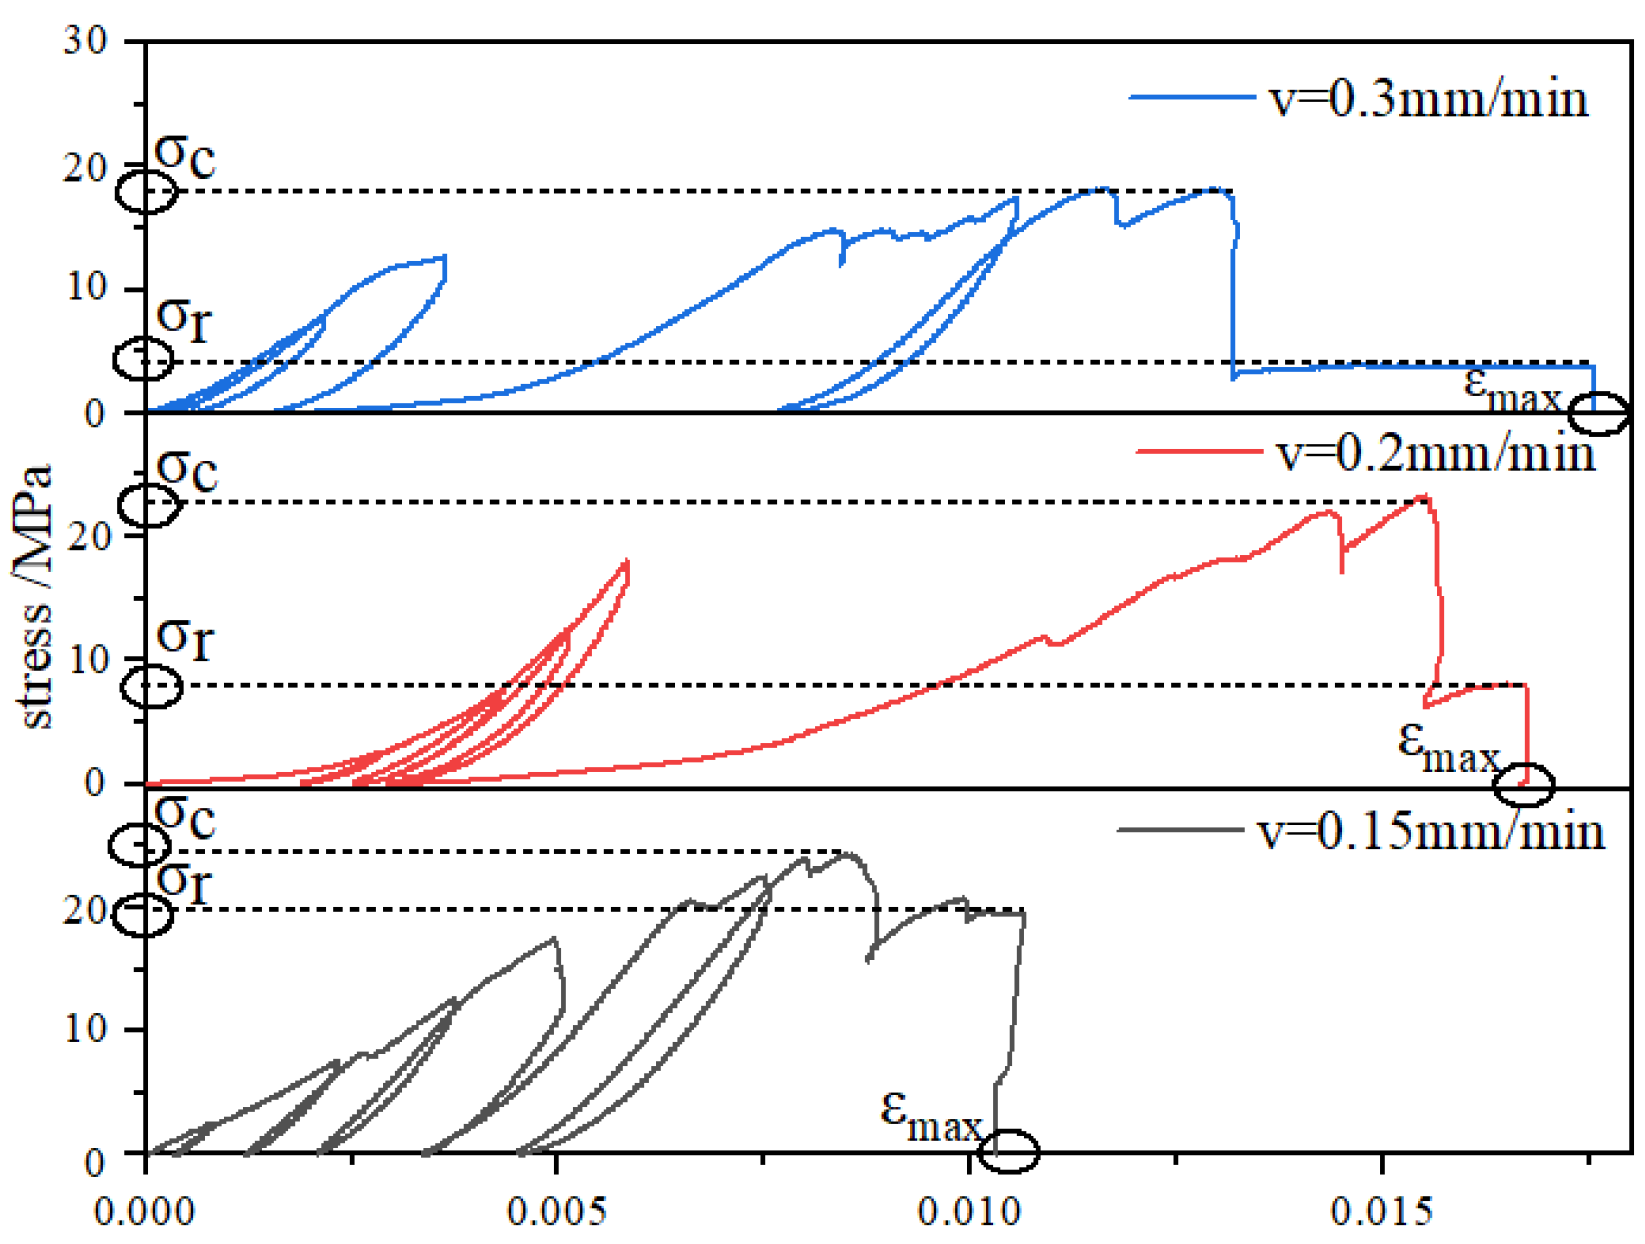
3.2.1. Deformation Characteristics before Peak Strength

Figure 4 shows the change in plastic strain as the stress level increases up to the peak strength. In the transverse direction, the process of plastic strain can be divided into three parts: a decrease zone, a stability zone, and a sudden increase zone. The dividing lines of the stress level correspond to σ = 7.5 and 12.5 MPa, and the variation range in the decrease zone is significantly smaller than that in the increase zone. It is considered via analysis that at the initial cycle of σ = 2.5 MPa, there are many primary pores in the rock, and the flow of moveable water between the pores significantly promotes the compressibility of the pores. Hence, it was difficult to recover in the unloading section; thus, plastic strain was produced. However, for σ = 2.5–7.5 MPa, a decrease in pore compaction behaviour resulted in a decrease in plastic strain. Thus, the rock was in the linear elastic stage. The main deformation of the rock corresponds to recoverable elastic deformation, which led to the appearance of a plastic strain stability zone. After entering the plastic stage at σ = 12.5 MPa, the primary and secondary pores of the rock expanded and connected with each other, and the deformation was produced mostly in the form of non-linear and viscoplasticity [26]. This led to the dominant position of plasticity, the rapid increase in plastic strain, and increasing damage to the rock due to pore coalescence behaviour.
From the point of view of the loading rate regarding the change of plastic strain, a higher loading rate causes the plastic strain in the increase zone to increase earlier; the plastic strain changed less in the decreasing and increasing zones when v = 0.15 and 0.3 mm/min. Furthermore, it was determined via analysis that the promoting effect of slow loading at 0.15 mm/min on pore compaction and expansion was small, which slowed the accumulation speed of rock damage. This resulted in a slight change in the plastic strain until the higher stress level. Hence, at higher stress levels, the plastic strain evidently increased. Furthermore, the fast loading at 0.3 mm/min caused the pores to expand earlier, leading to a sudden increase in the plastic strain very early; therefore, only instantaneous deformation was generated in the pores, causing the increase in plastic strain to be small. Therefore, when monitoring the time-varying deformation of an underground rock mass, the sudden increase in plastic change can be regarded as a leading indicator of rock mass failure, which provides a theoretical basis for maintaining the long-term stability of the rock mass.

3.2.2. Deformation Characteristics in the Softening Stage

To describe the relative value of the deformation in the softening stage, the plastic strain produced in the softening stage and in the entire test under different loading rates was calculated, as displayed in Table 3. The plastic strain in the softening stage increased as the loading rate increased, which was similar to that in the entire test. This indicates that the difference in the plastic strain under the influence of the loading rate is mainly concentrated in the softening stage. Hence, it is considered via analysis that the strong viscoplasticity of saturated rock causes the internal pores to exhibit certain bond characteristics, which causes the pores in each cycle before the peak strength not to expand to the expansion limit, whereas the large consumption of plastic strain energy in the softening stage leads to the weakening of the inhibition effect of bond characteristics. Hence, the effect of different loading rates on the strain at the crack tip becomes evident in the softening stage.

3.3. Influence of Loading Rate on Macroscopic Failure Structure

Figure 5 shows pictures of rock samples before and after the test under different loading rates, in which the pictures before the test show the rocks that are dry. It can be seen from Figure 5b,d,f that the failure modes under different loading rates were clearly different. The internal friction angle of the rock was φ = 90° – 2θ, where θ is the angle between the failure surface and the maximum principal stress [27]. Under the condition of v = 0.15mm/min, the upper end of the rock sample was compacted rapidly, resulting in a shear crack sprouting on the left side of the upper end. After the downward propagation of the crack, rib spalling occurred in the middle corner of the left side, resulting in spalling of the flaky rock block. In addition, due to Poisson effect, there was a clear longitudinal through main crack on the right side of the upper end, exhibiting clear tensile-failure characteristics. After the propagation of the crack, rock failure occurred; with a θ of approximately 6°, the rock structure was relatively complete and the fragmentation was large.
Under the condition of v = 0.2mm/min, two shear cracks developed from the upper and lower ends of the rock sample, and the cracks did not run through the rock sample. The two cracks continued to extend to both sides. In addition, the longitudinal crack was derived from the right side, but the gradually increasing transverse deformation limited the continuous development of the cracks, which finally propagated to the right side, resulting in parallel shear failure of the rock, with a θ value of approximately 10°. Moreover, the crack length during rock failure was large, and there were dense small cracks on the lower side of the rock, which were uneven and broken.
Under the condition of v = 0.3 mm/min, the main failure mode of the rock was an “X-type” shear failure, which is a more complex kind of shear failure. The fracture started from three end-effect points or structural-loose points at the top and formed three oblique shear planes downwards, and the two planes on the left formed “X-type” shear cracks. In addition, the crack extending to the lower left ran through the rock sample, whereas the other two did not run through. Under the progressive growth stress, the three cracks were connected with each other and caused rock failure, with a θ value of approximately 21°. In addition, the width of the crack on the left side of the rock sample was very large, and a large number of small rock blocks appeared in the middle of the rock sample.
It can be seen that with an increase in the loading rate, θ increases, the internal friction angle decreases, and the tensile failure gradually transits to the shear failure. Moreover, the degree of fragmentation of the rock sample is greater, the fragmentation size of the rock block becomes smaller, and the bonding effect between particles decreases. This may be because the compression force can increase at the shear failure mode [28]; it also shows that an increase in the loading rate causes the saturated limestone to exhibit stronger viscoplastic characteristics. During the loading and unloading, the plastic deformation becomes greater, the friction behaviour of particles increases, the sliding degree between rock blocks increases, and the crack development will be more sustained, which result in greater fragmentation during rock failure. In addition, owing to the release of more elastic energy during loading and unloading, the rock finally proceeds towards a shear failure.

4. Energy Evolution Characteristics of Rocks Under Cyclic Loading and Unloading

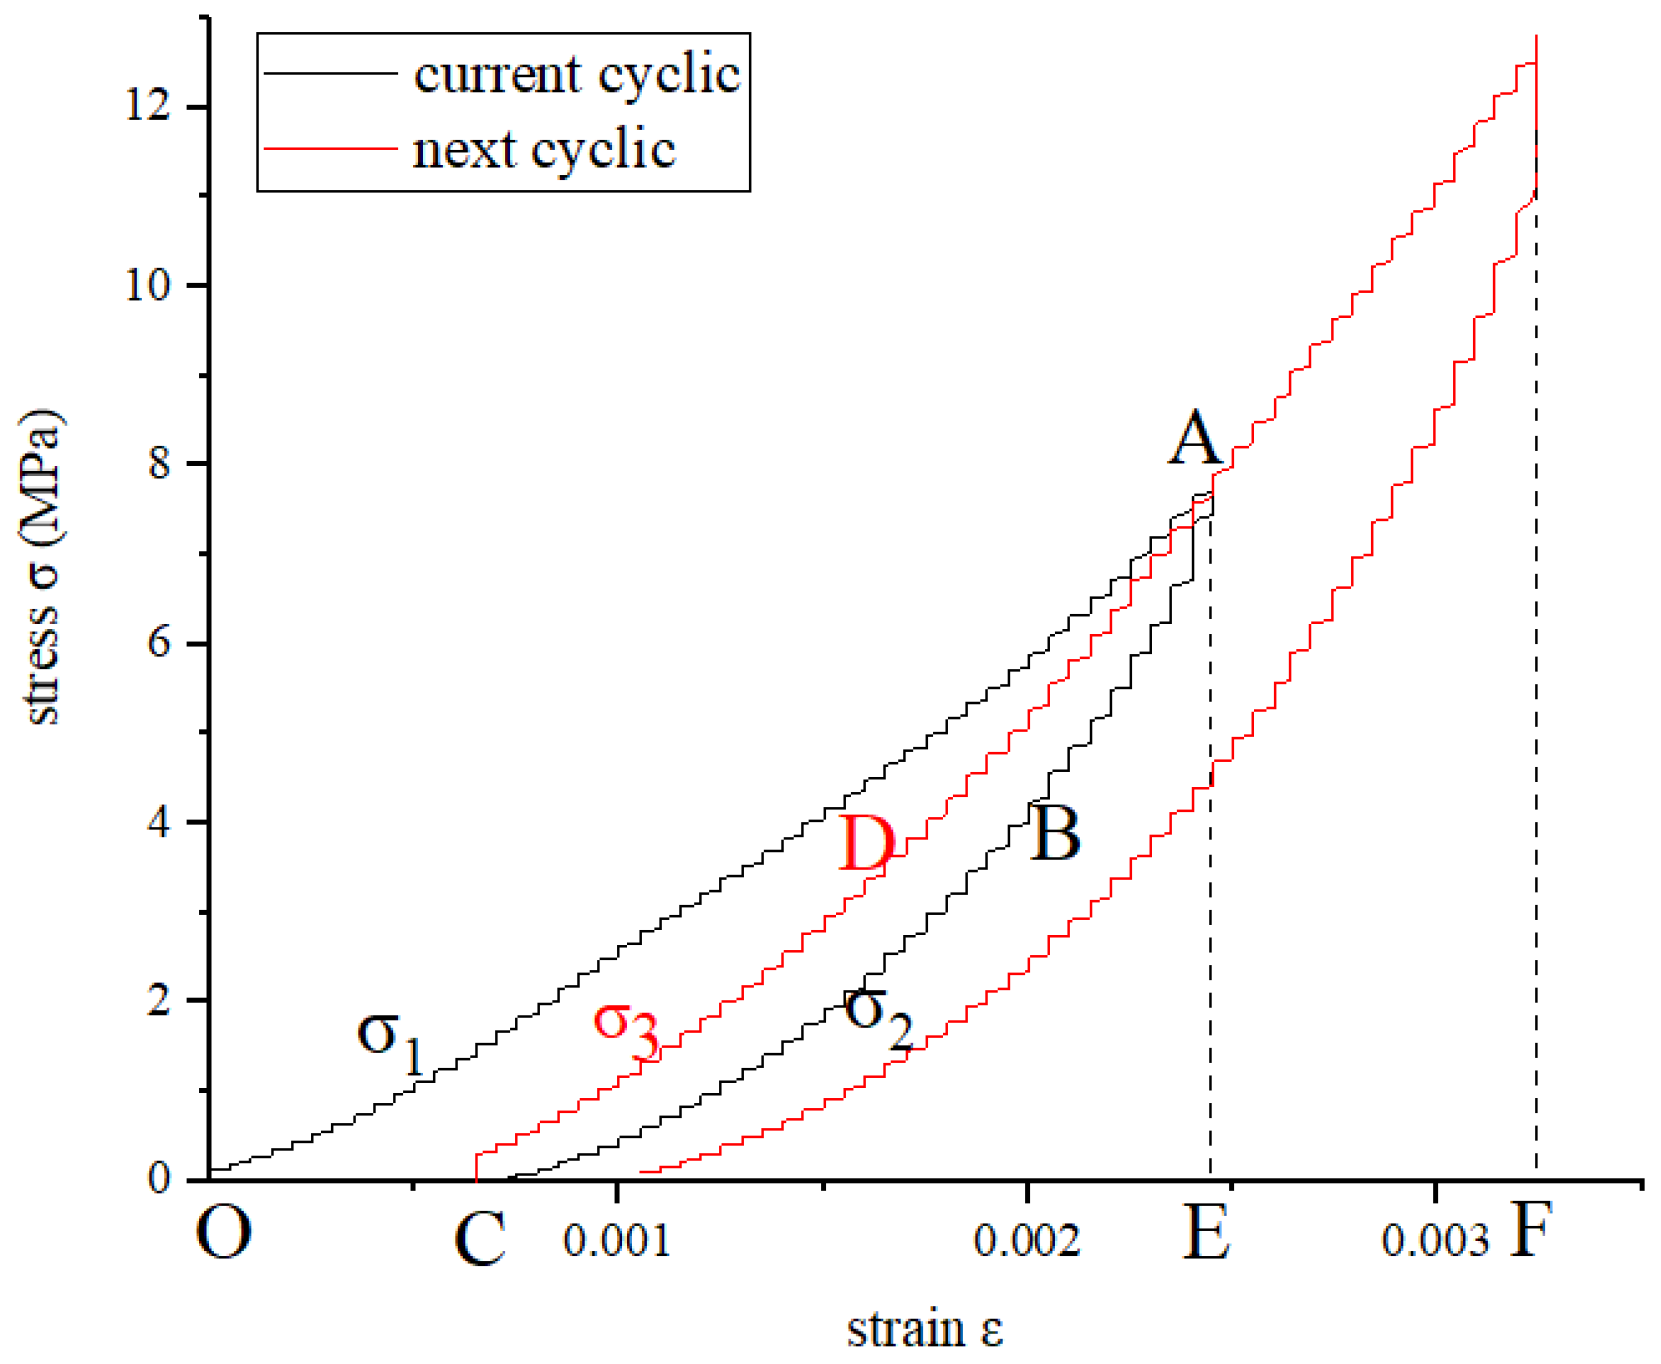
4.1. Calculation Method of the Energy Parameters

According to the existing literature studies, the energies of rocks include input energy, elastic energy, and dissipation energy [29]. Many researchers have investigated the composition of energy from different aspects. Yang et al. divided the input energy into strain energy, kinetic energy, plastic free energy, and plastic energy dissipation [30], of which the latter two belong to the plastic energy. Furthermore, Nikoli’c et al. derived this relationship in the integral form using the theorem of expended stress power and analytically solved the integral from the beginning of the simulation to the current time step; then, an analytically integrated expression for plastic energy was obtained [31]. Nikolić et al. presented a novel three-dimensional Timoshenko beam model that can simulate the localised failure or microcrack propagation of rocks in three modes [28].
By the earlier analysis, during uniaxial loading and unloading, the rock constantly absorbs new energy from the outside, i.e., input energy. During the loading section, the rock mainly stores elastic energy, and a small amount of elastic energy is converted into plastic energy [3], which includes dissipated plastic energy and plastic free energy. During the unloading section, the elastic energy stored in the rock is continuously released, and the plastic energy is consumed for the formation of plastic deformation and damage, in which some of the plastic free energy is recoverable in the later cycles. During the post peak of the softening stage, plastic energy of the rock continues to be consumed, and a large amount of elastic energy is released during rock failure. The forms of energy conversion form of rock during loading and unloading are shown in Figure 6.
The dissipation energy, input energy, plastic energy, and elastic energy corresponding to σn of the rock system can be represented by the stress–strain curve. As shown in Figure 7, σ1, σ2, and σ3 represent the stress of the loading curve of the current cycle, the unloading curve of the current cycle, and the loading curve of the next cycle. Considering the current cycle in Figure 7 as an object, the input energy absorbed by the rock from the outside is estimated as the area enclosed by the loading curve (Section OA) and the ε-axis, and the input energy is given by
E i = S O A E = O A σ 1 d ε
The plastic energy Ep is estimated as the area enclosed by the loading curve (Section OA) and the unloading curve (Section AC) [32], which is expressed as follows:
E p = S O A C = O A σ 1 d ε C A σ 2 d ε
where Ep is the plastic energy.
The elastic energy Ee accumulated in the rock is estimated as the area enclosed by the unloading curve (Section ABC) and the ε-axis [33], and the calculation equation is as follows:
E e = S A B C E = C A σ 2 d ε
where Ee is the elastic energy.
By the above analysis, under the assumption that there is no heat exchange between the rock system and the outside, the input energy Ei absorbed from outside in the rock system corresponding to σn will be self-organised by elastic energy Ee and plastic energy Ep [34,35]; i.e., the three types of energy satisfy the relationship shown in Equation (4), which conforms to the second law of thermodynamics in the rock system:
E i = E e + E p
The dissipation energy Ed is an independent calculation index used to analyse the energy loss in loading and unloading. It is estimated as the hysteresis loop area (area ABCDA) [34], and the calculation equation is as follows:
E d = S A B C D A = C A σ 3 d ε C A σ 2 d ε
where Ed is the dissipation energy.
The zero points of each unloading curve are taken as the characteristic stress points. Based on the earlier calculation method, the four types of energy between characteristic stress points can be obtained from the stress–strain curve.

4.2. Energy Evolution Process

Based on the statistics of the energy of each loading and unloading cycle, the change processes of various energies in the saturated limestone are obtained, as shown in Figure 8. The process is divided into six stages based on the change trend. Overall, in the process of loading and unloading, each energy type increases steadily as the stress level increases, and the relationship between its value and the growth rate between various energies is as follows: input energy > elastic energy > plastic energy > dissipation energy. This shows that the rock mainly stores elastic energy during loading and unloading. Based on the change rule of each energy type, the input energy increases as the stress level increases, and exhibits a trend of first accelerating increase, then slow increase, and finally great increase before failure, and the input energy absorbed externally in the entire test was 97.22 kJ/m3. The elastic energy also showed the same change characteristics, and the increase in accumulated elastic energy was 76.75 kJ/m3. The plastic energy showed an increasing trend of slow–fast–slow–large, and the increase in the released plastic energy was 20.47 kJ/m3. The dissipation energy was consistent with the law of rapid increase, smooth transition, accelerated increase, then slow increase, and finally a large increase before failure. The increase in the dissipation energy consumed was 16.32 kJ/m3.
The law of energy change in each loading and unloading stage is as follows:
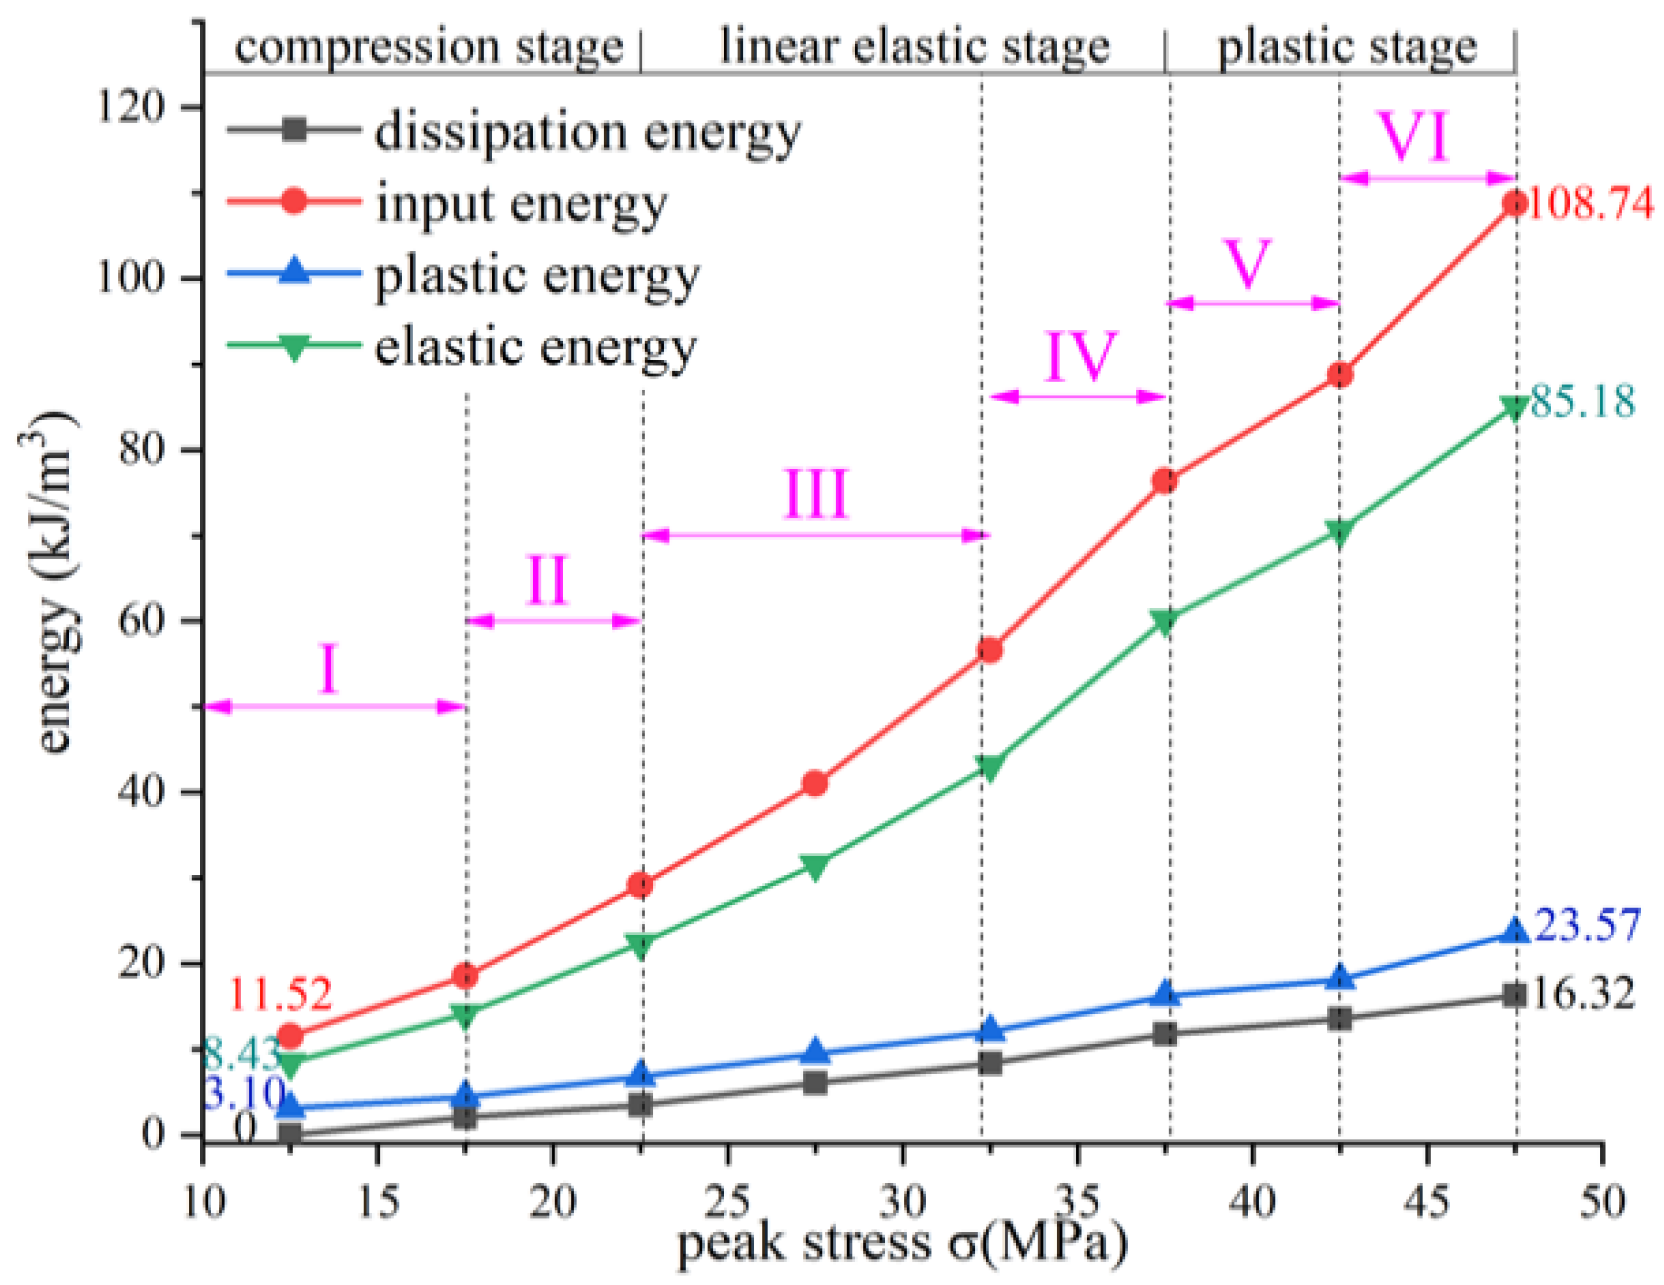
  • When σ = 12.5–17.5 MPa, the plastic energy, elastic energy, and input energy increase slowly with an increase in the stress level, whereas the dissipation energy increases rapidly compared with the other stages. This shows that the internal and external forces are very small, the elastic energy just begins to accumulate, and the plastic energy is only released in a short period of time, whereas the primary pores easily close when acted on by external forces; thus, the relative movement between particles suddenly occurs, which causes the dissipation energy to increase rapidly.
  • In the stage of 17.5–22.5 MPa, the growth rates of the plastic, elastic, and input energies are higher, whereas that of the dissipation energy remains constant. Furthermore, it is considered via analysis that the larger loading stress causes more particles to rebound after deformation, and this accelerates the increase of the overall elastic energy. Additionally, the friction and sliding behaviours of particles are more active under higher compression, and this results in a faster increase in the plastic energy. However, the rock is in the late compaction stage, and the pores are mostly compacted. This results in a slight consumption of dissipation energy.
  • At the stress level in the range of 22.5–32.5 MPa, the energy increases steadily and linearly, and the difference between the input energy and elastic energy increases gradually. This is because the stress concentration of the fracture leads to its continuous regeneration and expansion, which leads to an increase in the proportion of plastic energy in the input energy.
  • At the stress level in the range of 32.5–37.5 MPa, the elastic energy increases at the same speed as the input energy for the first time, and the plastic energy and dissipation energy increase at the same speed. This indicates that the rock is in the linear elastic stage at this stress level. Thus, it mainly produces recoverable elastic deformation. Therefore, a large amount of accumulated elastic energy leads to an increase in plastic energy, which is not enough to affect the growth consistency of elastic energy and input energy. Moreover, under a large stress, the rock initially exhibits damage. This in turn leads to an increase in the dissipation energy, which is basically consistent with the growth speed of plastic energy.
  • At the stress level in the range of 37.5–42.5 MPa, the growth rate of each type of energy slows down uniformly. This indicates that at this stress level, the rock is in the plastic stage, and the pores begin to coalesce. The pores that begin to coalesce but have not completed reduce the effective contact area between the rock skeleton and particles, inhibit friction and sliding behaviour, and lead to a decrease in the growth rates of the plastic energy and dissipation energy. The decrease in the contact area also reduces the continuity between particles, and results in the slow speed of storage elastic energy.
  • At the stress level in the range of 42.5–47.5 MPa, the energy increases suddenly and significantly. This indicates that at the late plastic stage, a large number of cracks on the rock are exhibited, and a large stress concentration is formed at the crack tip, which causes extensive expansion of macro cracks and continuous production of plastic strain. This leads to the consumption of large amounts of plastic energy and dissipation energy of the rock. Thus, a sudden increase in energy after the slow increase is the precursor of rock mass instability.

4.3. Characteristics of Energy Evolution under Different Loading Rates

Figure 9a shows the evolution of plastic energy at different loading rates. The plastic energy released by the rock exhibits the law of stable increase–rapid increase–slow increase–large increase. At the stress level in the σ range of 2.5–17.5 MPa, the value and change speed of plastic energy under the loading rate of v = 0.3 mm/min were higher than those under the low speed rate. Furthermore, at the stress level in the range of 17.5–22.5 MPa, the plastic energy growth rate under v = 0.2 mm/min was significantly higher than that under v = 0.15 mm/min. Hence, it was considered via analysis that before loading to 17.5 MPa, there were fewer cracks and larger spacing in the rock. Furthermore, the cohesive force of the particles was strong, and the loading rate required for relative sliding and plastic deformation was large. Hence, the plastic energy only increased significantly at v = 0.3 mm/min. After loading to 17.5 MPa, the cracks began to coalesce, which led to more dynamic friction between particles. The inner parts of the particles were also more easily damaged. Hence, a large irreversible deformation occurred only at v = 0.2 mm/min. This led to an abnormally large increase in plastic energy.
Figure 9b shows the evolution of elastic energy at different loading rates. The figure shows that the stored elastic energy of the rock exhibits a trend of stable increase–rapid increase–slow increase or decrease–sudden increase. The energy storage limit of the elastic energy at v = 0.3 mm/min was more significant than those at v = 0.15 mm/min and 0.2 mm/min, and the sound of fragment disintegration was also clear at the later stage of the test. This indicates that the risk of dynamic failure of the rock was higher at a faster loading rate. At the stress level in the σ range of 2.5–12.5 MPa, as the loading rate increased, the growth magnitude and rate of elastic energy gradually increased. At the stress level in the range of 12.5–17.5, v = 0.3 mm/min showed a faster growth rate of elastic energy than those at v = 0.15 and 0.2 mm/min because at this stage, the particles began to loosen, and the faster loading rat promoted the overall deformation of the skeleton. That was more conducive to energy storage. At the stress level in the range of 17.5–22.5 MPa, the growth rate of elastic energy was higher under v = 0.15 mm/min than that under v = 0.2 mm/min. Hence, it was considered via analysis that at this time the damage was about to occur, and there were many small particles. Furthermore, the faster loading rate promoted the slip between small particles, whereas the slower loading rate caused a slow inlay between particles. Thus, the energy storage limit of the formed complex was larger.
Figure 10 shows the evolution process of the dissipation energy and input energy under different loading rates. Figure 10a shows that the dissipation energy consumed by the rock exhibited a stable increasing trend, followed by an accelerated increase; finally, different degrees of increase were observed. At the stress level in the σ range of 2.5–17.5 MPa, the growth rate of the dissipation energy increased as the stress level increased. As the loading rate increased, the value and growth rate of the dissipation energy gradually increased. Hence, it was considered via analysis that at this time the rock did not enter the plastic stage, and the higher loading rate evidently increased the expansion limit of the pore space and reduced the energy and difficulty encountered in the compaction of non-compressible pores. Thus, an increase in the pore compaction behaviour led to an increase in the dissipation energy. At the stress level in the range of 17.5–22.5 MPa, the growth rate at v = 0.15 mm/min was significantly higher than that at v = 0.2 mm/min. It was considered via analysis that the internal pores of the rock were significantly compressed in the axial direction near the failure, and the external resistance of the pores mainly depended on the effective stress. However, the lower loading rate provided sufficient time for the formation of pore water pressure. Thus, the external resistance of the pores gradually transforms via the pore water pressure, which is the main force for promoting the expansion of pores, and thus, the dissipation energy increased more at v = 0.15 mm/min. Figure 10b shows that the input energy exhibited a trend of stable increase, which was followed by an approximate linear increase. Subsequently, a sudden increase near the failure was observed.
Comparing Figure 9a and Figure 10a, it can be seen that the plastic energy was several times larger than the dissipation energy between the characteristic stress points, and the difference was more clear in the plastic stage. It was considered via analysis that the plastic energy included not only the plastic energy dissipation, but also the plastic free energy, the emergence and change of which are caused by particle rearrangement in granular assembly under loading [30]. Furthermore, in the plastic stage, the rock produces more plastic deformation, and is more likely to produce plastically deformed macro-continuum elements, and part of the elastic energy will be converted into plastic free energy owing to locking in the elastic part of the element. Therefore, the plastic energy is significantly larger than the dissipation energy in the plastic stage.
It can also be seen from Figure 9a that in the linear elastic stage, the increase in plastic energy under v = 0.2 mm/min is smaller than that under v = 0.15 mm/min, whereas the former is larger than the latter in the plastic stage; however, dissipation energy is completely contrary to the above law in Figure 10a, owing to the fact that the rock may form shear bands in the plastic stage at a higher rate [31] (as shown in Figure 5f) when more plastic strain is produced, and more plastic energy is consumed in the rock, whereas the dissipation energy is not affected by the strain. In addition, Figure 9a and Figure 10a also show that before the plastic stage, the increase rate of the plastic energy is approximately constant, whereas the dissipation energy exhibits a characteristic of step increase.

4.4. Evolutionary Characteristics of the Elastic Energy Index under Different Loading Rates

The elastic energy index is a parameter that is used to evaluate the impact tendency of a rock. It can be directly calculated by the input energy and plastic energy [3], as expressed in Equation (6). Based on the equation, it is clear that the change characteristics of the elastic energy index can also directly represent the change in the ratio of elastic energy to plastic energy.
E E T = E e E p
where EET is the elastic energy index.
Based on Equation (6), the elastic energy index EET of each rock sample under different loading rates was calculated, as shown in Figure 11.
Overall, as the stress level increases, the elastic energy index exhibits a trend of decelerating increase. Furthermore, the long-term growth or the initiation of the decrease in elastic energy index can be regarded as the precursor to rock failure. As the loading rate increases, the elastic energy index gradually increases. The elastic energy index decreased in the linear elastic stage at loading rates of v = 0.15 and 0.2 mm/min. However, it did not decrease at a loading rate of v = 0.3 mm/min, which indicates that the lower loading rate promotes the formation of more through cracks in front of the plastic stage. This results in greater deformation of the crack tip, which leads to an evident decrease in the elastic energy index. Additionally, based on the method of determining the physical and mechanical properties of coal and rock in China [36], when EET < 2, the rock exhibited no impact tendency, and when EET < 5, the rock exhibited a medium impact tendency. Figure 11 shows that under three loading rates, the saturated limestone did not exhibit an impact tendency; thus, water saturation can significantly reduce the impact tendency of the rock.

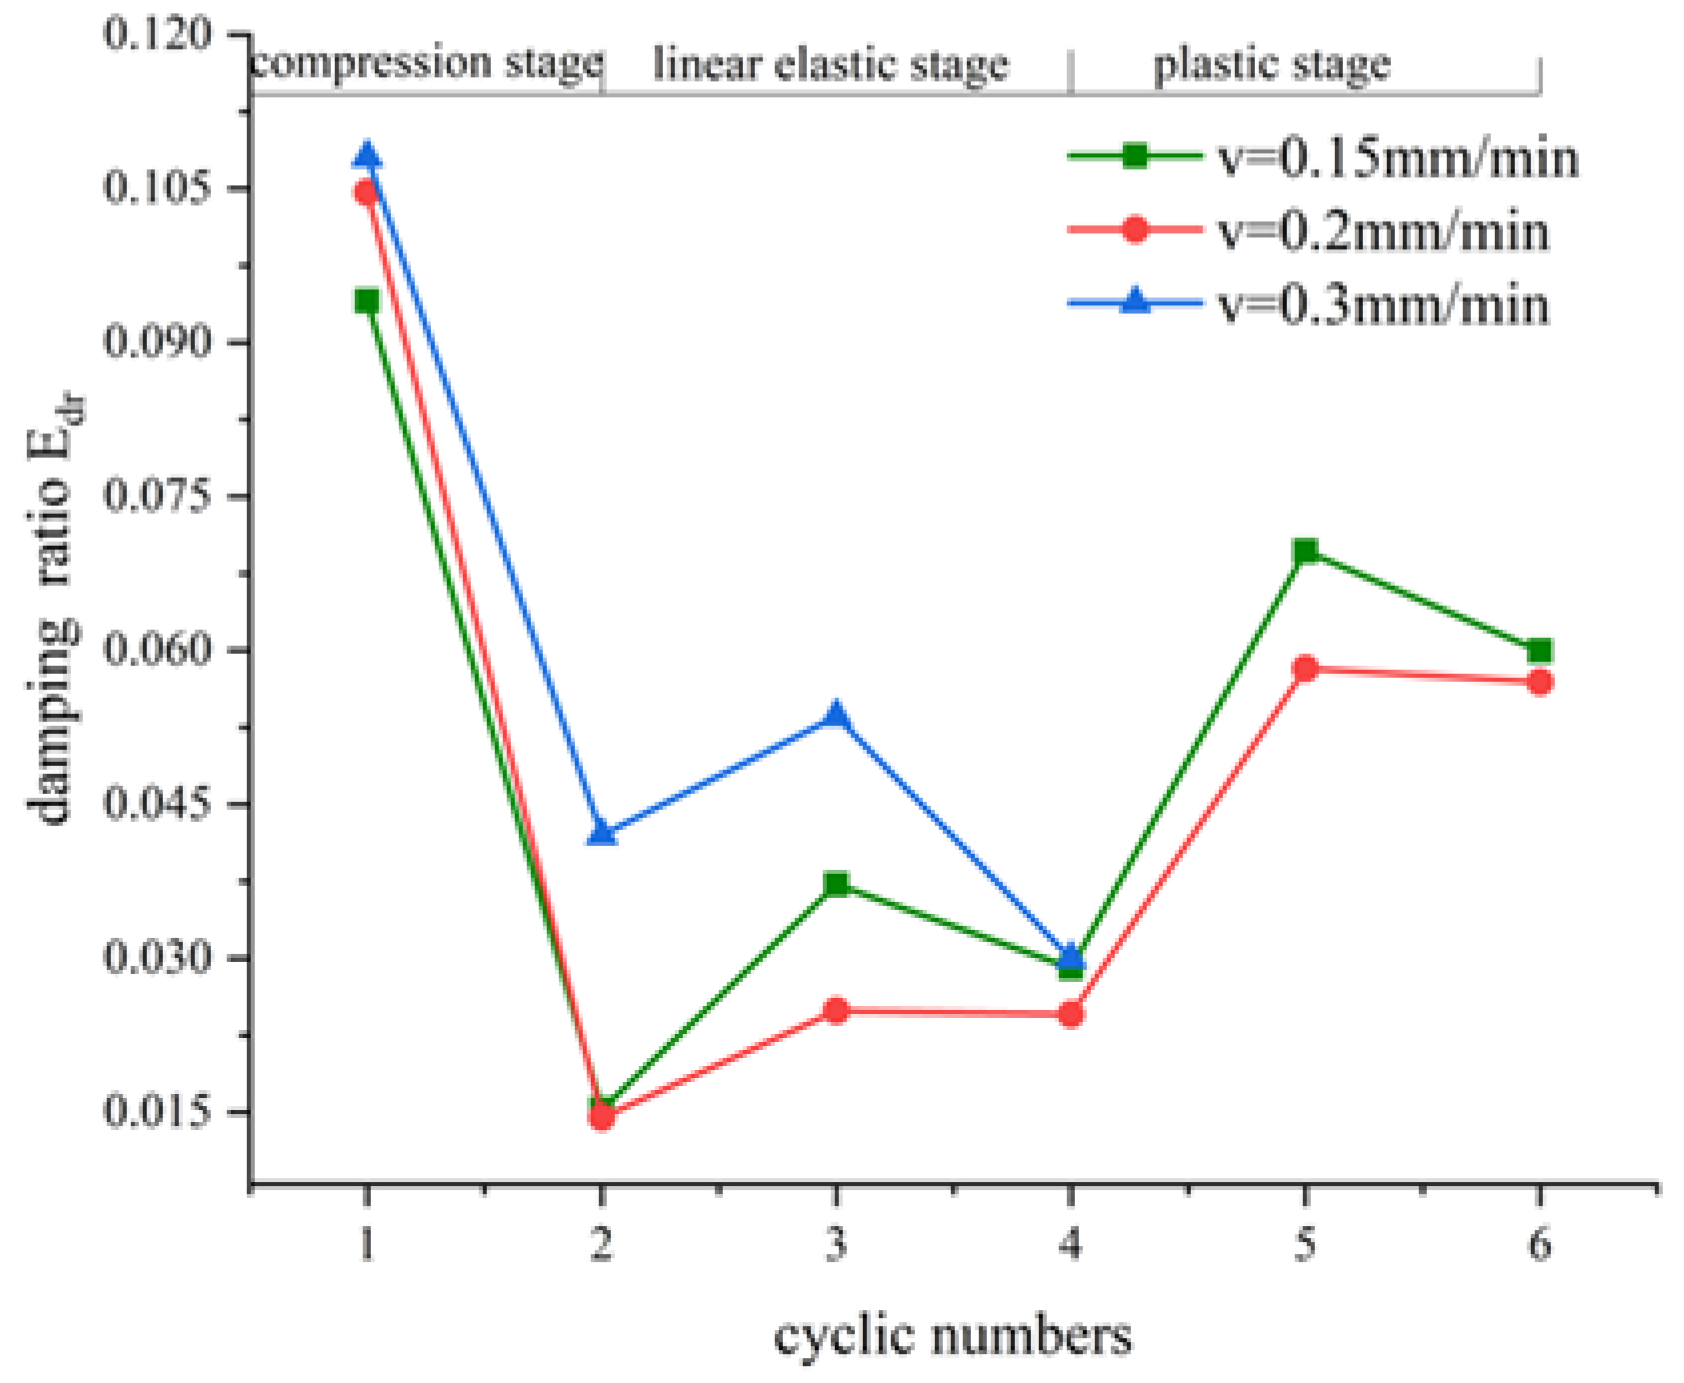
4.5. Evolutionary Characteristics of Damping Ratio under Different Loading Rates

The dissipation of rock energy during loading and unloading is termed rock damping in engineering, and the damping ratio is a parameter that describes damping. Furthermore, it can describe the processes of crack expansion, penetration, and damage formation, and it can reflect the stability of underground engineering rock mass. The calculation is shown in Equation (7) [3]. The equation indicates that the evolutionary process of the damping ratio also directly represents the change in the ratio of dissipation energy to the sum of dissipation energy and elastic energy.
E d r = E d 2 π ( E d + E e )
where Edr is the damping ratio.
For each rock sample, the damping ratio Edr is calculated based on Equation (7) (see Figure 12).
Overall, as the stress level increased, the damping ratio exhibited a decreasing–increasing–decreasing–increasing–decreasing trend, and the first decreasing change extent was abnormally high. This shows that the initial damage due to loading and unloading was very high. From the point of view of the change in energy with the loading rate, the energy increased as the loading rate increased in the compaction stage. This is similar to the change rule of the elastic energy index, wherein it decreases as the loading rate increases in the plastic stage. However, this is contrary to the change rule of the elastic energy index. This shows that a larger loading rate promotes the formation of microcracks in the early cycle and inhibits the crack penetration near-failure. This reduces the release of elastic energy and results in an increase in the elastic energy index. The aforementioned characteristics of the elastic energy index and damping ratio can provide a theoretical reference for the time prediction of the dynamic failure of a deep rock mass.

4.6. Effect of Loading Rate on Energy in the Softening Stage

Table 4 displays the plastic energy and dissipation energy of the softening stage under different loading rates. In engineering practice, it is important to represent the deformation and fracture behaviour of the deep surrounding rock under residual resistance. Table 4 shows that as the loading rate v changes, the plastic energy and dissipation energy exhibit the same change rule. This shows that the residual resistance process of the rock under loading and unloading is a simultaneous process of crack penetration and plastic deformation. Table 4 also shows that the decrease in the loading rate in the softening stage promotes the release of more plastic energy of the rock. This is contrary to the change rule of plastic strain in the entire test, and thus indicates that the plastic energy of rock under loading and unloading is mainly released before the peak strength.

5. Conclusions

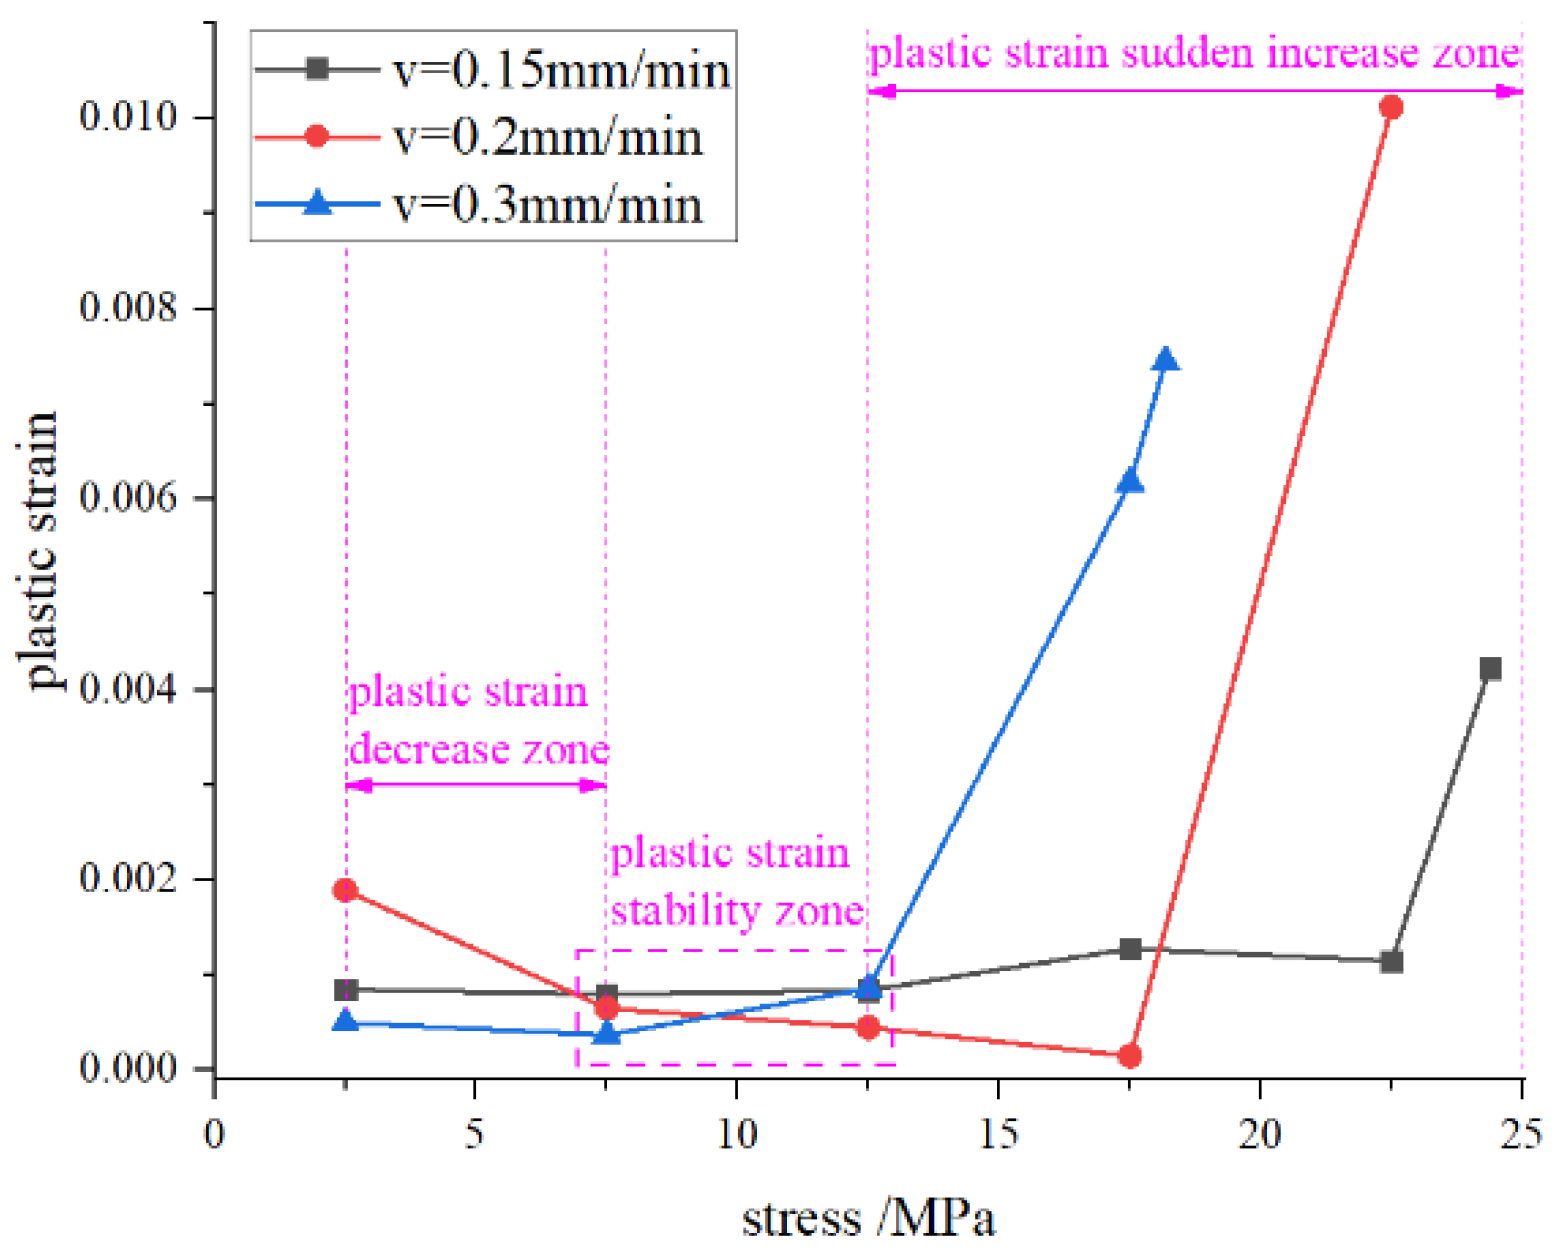
  • Under cyclic loading and unloading, the plastic strain in the entire test was directly proportional to the loading rate, and the residual stress and strength were inversely proportional to the loading rate. During loading and unloading, the plastic strain exhibited a decreasing–stabilising–increasing trend. The decreasing extent was less than the increasing extent. A smaller loading rate restrained the increase in plastic strain, and a higher loading rate caused the plastic strain in the increase zone to increase earlier.
  • The difference in plastic strain under different loading rates is mainly concentrated in the residual resistance process, which produces plastic deformation and coalesces the cracks simultaneously. The released plastic and dissipation energies are inversely proportional to the loading rate.
  • Under loading and unloading, the relationship between the energy value and increasing extent is as follows: input energy >; elastic energy >; plastic energy >; dissipation energy, and the first three types of energy exhibit a slow–fast–slow increase trend. However, dissipation energy exhibits a fast–steady–fast–slow–fast increase trend. Furthermore, the elastic energy index exhibits a large increase–steady increase–decrease trend. This is proportional to the loading rate, and there is no decrease section under a large loading rate. Additionally, the damping ratio exhibits a decrease–increase–decrease–increase–decrease trend. This is proportional to the loading rate in the compaction stage and inversely proportional to the plastic stage.
  • The phenomena of a sudden increase after the slow increase in various energies and the long-term increase or the initiation of a decrease in the elastic energy index can be regarded as the precursors to rock failure.

Author Contributions

Writing—review and editing, J.L.; writing—original draft preparation, L.H.; data curation, K.Z.; formal analysis, C.X.; validation, L.Z. All authors have read and agreed to the published version of the manuscript.

Funding

This research was supported in part by Key Laboratory of Rock Mechanics and Geohazards of Zhejiang Province under Grant ZJRMG-2018-Z03; in part by the National Natural Science Foundation of China under Grant 51774323; and in part by the Fundamental Research Funds for the Central Universities of Central South University under Grant 2019zzts671.

Conflicts of Interest

The authors declare no conflict of interest.

References

  1. Manoj, N.B.; Vladimir, P. Fatigue and dynamic energy behaviour of rock subjected to cyclical loading. Int. J. Rock Mech. Min. Sci. 2009, 46, 200–209. [Google Scholar]
  2. Wang, H.; Yang, T.H.; Liu, H.L.; Zhao, Y.C.; Deng, W.X.; Hou, X.G. Mechanical properties and energy evolution of dry and saturated sandstones under cyclic loading. Rock Soil Mech. 2017, 38, 1600–1608. [Google Scholar]
  3. Xiao, F.K.; Liu, G.; Shen, Z.L.; Zhang, F.R.; Wang, Y.F. Energy conversion and acoustic emission(AE) characteristics of coal samples under cyclic loading. Chin. J. Rock Mech. Eng. 2016, 35, 1954–1964. [Google Scholar]
  4. Zhao, Y.C.; Yang, T.H.; Xiao, F.K.; Wang, H.; Liu, G.; Zheng, X.; Zhou, J.R.; Shen, Z.L. The variation law of plastic strain energy of western weak cemented sandstone during cyclic loading experiment. J. Chin. Coal Soc. 2015, 40, 1813–1819. [Google Scholar]
  5. Zhang, Z.Z.; Gao, F. Energy Evolution Mechanism during Rock Deformation and Failure, 2nd ed.; China University of Mining and Technology: Xuzhou, China, 2014. [Google Scholar]
  6. Zhang, Z.Z.; Gao, F. Experimental Investigations on Energy Evolution Characteristics of Coal, Sandstone and Granite during Loading Process; China University of Mining and Technology: Xuzhou, China, 2015; Volume 44, pp. 416–422. [Google Scholar]
  7. Dong, J.J.; Chen, S.S.; Xu, J.; Liu, Q.S. Mechanical properties and energy characteristics of mudstone under different containing moisture states. J. Chin. Coal Soc. 2018, 43, 2217–2224. [Google Scholar]
  8. Yang, J. Evolution Characters of Stress and Energy and Laws of Fractures and Damage in Coal Sample under True Tri-axial Loading-Unloading Test. Master’s Thesis, China University of Mining and Technology, Xuzhou, China, 2017. [Google Scholar]
  9. Wang, W.C. Study on Mechanism of Fatigue Damage Evolution of Deep Salt Rock of Yewu. Master’s Thesis, Henan Polytechnic University, Jiaozuo, China, 2016. [Google Scholar]
  10. Zhang, G.K.; Li, H.B.; Xia, X.; Li, J.R.; Yu, C.; Liu, J.S. Research on energy and damage evolution of rock under uniaxial compression. Rock Soil Mech. 2015, 36, 94–100. [Google Scholar]
  11. Jiang, C.B.; Duan, M.K.; Yin, G.Z.; Wang, J.G. Experimental study on seepage properties, AE characteristics and energy dissipation of coal under tiered cyclic loading. Eng. Geol. 2017, 221, 114–123. [Google Scholar] [CrossRef]
  12. Duan, M.K.; Jiang, C.B.; Yu, H.; Lu, T.Y.; Niu, B.W.; Sun, D.L. Experimental research on energy dissipation and seepage properties of coal under loading-unloading conditions at different stress levels. Rock Soil Mech. 2018, 39, 1346–1354. [Google Scholar]
  13. Meng, Q.B.; Han, L.J.; Pu, H.; Wen, S.Y.; Li, H. Experimental on the effect of strain rate and size on the energy accumulation and dissipation of rock. J. Chin. Coal Soc. 2015, 40, 2386–2398. [Google Scholar]
  14. Wang, J.X. Mechanical Properties and Energy Evolution of Marble under Triaxial Unloading. Master’s Thesis, Kunming University of Science and Technology, Kunming, China, 2016. [Google Scholar]
  15. Cieslik, J. Damage and Plasticity Rate Dependence of Luna Limestone in Uniaxial Compression. Rock Mechanics for Resources, Energy and Environment. pp. 233–237. Available online: www.onepetro.org/conference-paper/ISRM-EUROCK-2013-032 (accessed on 16 January 2019).
  16. Kim, E.; Garcia, A.; Changani, H. Fragmentation and energy absorption characteristics of Red, Berea and Buff sandstones based on different loading rates and water contents. Geomech. Eng. 2018, 14, 151–159. [Google Scholar]
  17. Millon, O.; Ruiz-Ripoll, M.L.; Hoerth, T. Analysis of the Behavior of Sedimentary Rocks under Impact Loading. Rock Mech. Rock Eng. 2016, 49, 4257–4272. [Google Scholar] [CrossRef]
  18. Li, Y.Y.; Zhang, S.C.; Wen, S.J.; Zhao, R.L.; Cao, Z.G.; Lun, Q.Z.; Bai, J.Z. Energy conversion and fragment distribution characteristics of coal sample under uniaxial cyclic loading. J. Chin. Coal Soc. 2019, 44, 1411–1420. [Google Scholar]
  19. Wang, X.R.; Wang, E.Y.; Liu, X.F.; Wang, H.; Li, X.L.; Li, D.H. Experimental study on the static loading rate effects of sandstone specimen containing pre-existing echelon cracks. J. Chin. Coal Soc. 2017, 42, 2582–2591. [Google Scholar]
  20. Chen, Z.Q. Study on Failure Process and Energy Mechanism of Hard-brittle Rock under Hydro-mechanical Coupling Action. Master’s Thesis, Chengdu University of Technology, Chengdu, China, 2015. [Google Scholar]
  21. Xiao, X.C.; Ding, X.; Zhao, X.; Pan, Y.S.; Wang, A.W.; Wang, L. Experimental study on acoustic emission and charge signals during coal failure process at different loading rates. Rock Soil Mech. 2017, 38, 3419–3426. [Google Scholar]
  22. International Society for Rock Mechanics. Basic geotechnical description of rock masses. Int. J. Rock Mech. Min. Sci. Geomech. Abstr. 1981, 18, 85–110. [Google Scholar]
  23. Yang, D.H.; Zhao, Y.X.; Teng, T.; He, X.; Wang, W.; Han, P.H. Experimental study on the influence of cyclic loading on Kaiser effect. Chin. J. Rock Mech. Eng. 2018, 37, 2697–2708. [Google Scholar]
  24. Li, S.L.; Zhou, M.J.; Chen, D.X.; Zhang, J.L.; Hu, J.Y. Experimental study on acoustic emission characteristics before the peak strength of rocks under incrementally cyclic loading-unloading methods. Chin. J. Rock Mech. Eng. 2019, 38, 724–735. [Google Scholar]
  25. Lu, Y.L.; Wang, L.G.; Yang, F.; Li, Y.J.; Chen, H.M. Post-peak strain softening mechanical properties pf weak rock. Chin. J. Rock Mech. Eng. 2010, 29, 640–648. [Google Scholar]
  26. Dahhaoui, H.; Belayachi, N.; Zadjaoui, A. Modeling of creep behavior of an argillaceous rock by numerical homogenization method. Period. Polytech. Civ. Eng. 2018, 62, 462–469. [Google Scholar] [CrossRef] [Green Version]
  27. Su, Z.D.; Sun, J.Z.; Xia, J.; Wu, C.L. Research on Effects of Freeze-Thaw Cycles on Acoustic Emission Characteristics of Granite. Chin. J. Rock Mech. Eng. Available online: Kns.cnki.net/kcms/detail/42.1397.o3.20190114.1724.001.html (accessed on 16 January 2019).
  28. Nikolic, M.; Ibrahimbegovi, A. Rock mechanics model capable of representing initial heterogeneities and full set of 3D failure mechanisms. Comput. Methods Appl. Mech. Eng. 2015, 290, 209–227. [Google Scholar] [CrossRef]
  29. Xiao, F.K.; Wang, H.R.; Liu, G. Study on Multiparameter Precursory Information Identification of the Fracture of Yellow Sandstone. Adv. Civ. Eng. 2019, 2019, 7676801. [Google Scholar] [CrossRef]
  30. Yang, H.; Sinha, S.K.; Feng, Y.; McCallenb, D.B.; Jeremić, B. Energy dissipation analysis of elastic–plastic materials. Comput. Methods Appl. Mech. Eng. 2018, 331, 309–326. [Google Scholar] [CrossRef] [Green Version]
  31. Nikolić, M.; Do, X.N.; Ibrahimbegovic, A.; Nikolić, Ž. Crack propagation in dynamics by embedded strong discontinuity approach: Enhanced solid versus discrete lattice model. Comput. Methods Appl. Mech. Eng. 2018, 340, 480–499. [Google Scholar] [CrossRef] [Green Version]
  32. Kivi, I.R.; Ameri, M.; Molladavoodi, H. Shale brittleness evaluation based on energy balance analysis of stress-strain curves. J. Pet. Sci. Eng. 2018, 167, 1–19. [Google Scholar] [CrossRef]
  33. Gong, F.Q.; Yan, J.Y.; Luo, S.; Li, X.B. Investigation on the Linear Energy Storage and Dissipation Laws of Rock Materials under Uniaxial Compression. Rock Mech. Rock Eng. 2019, 52, 4237–4255. [Google Scholar] [CrossRef]
  34. Song, D.Z.; Wang, E.Y.; Liu, J. Relationship between EMR and dissipated energy of coal rock mass during cyclic loading process. Saf. Sci. 2012, 50, 751–760. [Google Scholar] [CrossRef]
  35. Xie, H.P.; Li, L.Y.; Peng, R.D.; Ju, Y. Energy analysis and criteria for structural failure of rocks. J. Rock Mech. Geotech. Eng. 2009, 1, 11–20. [Google Scholar] [CrossRef] [Green Version]
  36. Inspection and Quarantine of the People’s Republic of China; China National Standardization Management Committee. GB/T 23561 Determination of Physical and Mechanical Properties of Coal and Rock; Standards Press of China: Beijing, China, 2009.
Figure 1. Loading and unloading path diagram.
Energies 13 04003 g001
Figure 2. Electro-hydraulic servo compression testing machine.
Energies 13 04003 g002
Figure 3. Stress–strain curves for different loading rates.
Energies 13 04003 g003
Figure 4. Change process in plastic strain for different loading rates.
Energies 13 04003 g004
Figure 5. Macroscopic structure of rocks before and after tests under different loading rates: (a) before test under v = 0.15 mm/min; (b) after test under v = 0.15 mm/min; (c) before test under v = 0.2 mm/min; (d) after test under v = 0.2 mm/min; (e) before test under v = 0.3 mm/min; (f) after test under v = 0.3 mm/min.
Energies 13 04003 g005
Figure 6. Forms of energy conversion of rock under cyclic loading and unloading.
Energies 13 04003 g006
Figure 7. Calculation method of the energy parameters.
Energies 13 04003 g007
Figure 8. Change processes of various energies of L15 sample during loading and unloading. I: rapid increase of dissipation energy, II: constant dissipation energy, III: linear increase, IV: increase at the same speed, V: slow increase, VI: large increase before failure.
Energies 13 04003 g008
Figure 9. Change processes of plastic energy and elastic energy at different loading rates. (a) Plastic energy (I: stable increase, II: rapid increase, III: slow increase, IV: large increase); and (b) elastic energy (I: stable increase, II: rapid increase, III: slow increase or decrease, IV: sudden increase).
Energies 13 04003 g009
Figure 10. Change process of dissipation energy and input energy at different loading rates. (a) Dissipation energy (I: stable increase, II: accelerated increase, III: different degrees of increase); and (b) input energy (I: stable increase, II: approximate linear increase, III: large increase).
Energies 13 04003 g010
Figure 11. Change process of elastic energy index at different loading rates.
Energies 13 04003 g011
Figure 12. Change process of damping ratio for different loading rates.
Energies 13 04003 g012
Table 1. XRF mineral elements of limestone.
ElementCaSZnFeSiMg
Content, %60.1942.7040.2740.8180.2220.212
Table 2. Mineral composition of limestone.
MineralCalcite, DolomitecompoundsSerpentinePyriteTalcZinc SulphideQuartz
Content, %94.41.42.21.00.80.2
Table 3. Plastic strain produced in the softening stage and in the entire test under different loading rates.
Plastic StrainIn the Softening StageIn the Entire Test
Loading Rate v (mm/min)
0.150.001550.0103
0.20.003380.01674
0.30.003430.0168
Table 4. Plastic energy and dissipation energy of the softening stage under different loading rates.
Energy of the Softening StagePlastic Energy (kJ/m3)Dissipation Energy (kJ/m3)
Loading Rate v (mm/min)
0.1532.764284.332732
0.212.449260.851863
0.310.237070

