Abstract
Hydrothermal carbonization (HTC) represents one of the emerging and most promising technologies for upgrading biomass. Among the residual biomass waste, olive pomace and olive mill wastewater may be seen as valuable energy sources, especially for the Mediterranean countries, given the key role of the olive oil industry in those regions. This paper deals with the thermo-fluid dynamic performance of the HTC process of olive pomace. Computational Fluid Dynamics (CFD) modeling is employed in this study to numerically simulate such a process in batch reactor with the aim of understanding the complex fluid dynamics, heat transfer and reaction kinetics phenomena occurring under hydrothermal conditions. A parametric analysis is performed to evaluate the temperature fields inside the reactor and the output mass yields as a function of the power input required by the process. Velocity flow fields and the spatial distribution of the mixture during the process are also investigated to understand the change in feed conversion at different regions within the tubular reactor under different reaction times. The numerical results are validated and compared with experimental measurements conducted previously on a similar batch reactor. The model predictions are found to be in line with the experimental findings, thus laying the foundations for further modeling improvements towards the design optimization and scale-up of HTC reactors.
1. Introduction
The olive industry represents an important sector in the European Union (EU). The EU is indeed the largest producer of olive oil across the world, with a share of 69%. Specifically, Spain is the leading producer of olive oil in the EU, followed by Italy, Greece and Portugal, these four countries covering almost the totality of the overall production [1,2]. From the environmental sustainability perspective, the olive oil production has a great relevance, due to the significant amount of related waste, which consist in either solid and liquid residues, such as olive pomace and olive mill wastewater. However, treatment technologies for waste from olive oil production face a number of challenges to the point that, to date, no definitive solution has been found yet with respect to the environment protection. These are related to some specific issue concerning for instance the geographical location and distribution of the mills as well as the production seasonality, which lead to inherent difficulties in the adoption of environment-compatible strategies for a sustainable waste disposal. An inefficient disposal of such a waste yields the contamination of soil, aquifer and surface water, due to the high concentration of organic material, that is responsible of a high pollution potential. Moreover, the need of creating an environmental friendly waste treatment is accompanied by the need of valuating the by-products to let the olive oil industry to become energy independent [3].
The physicochemical properties of olive pomace make this by-product a potentially high valuable energy source [4]. However, typically, in order to be effectively used as a combustion fuel, olive pomace requires to be pre-treated by means of drying processes and oil extracting treatments [5]. Among the employed technologies, the hydrothermal carbonization (HTC) allows instead the conversion of the wet biomass feedstock into an upgraded carbonaceous biofuel, that is called hydrochar, without pre-treatment [6,7,8]. By means of the HTC process, the olive pomace is heated within a reactor at relatively high temperatures (typically ranging between 150 °C and 300 °C) and high pressure (in the order of 10–100 bar), for several hours [9]. High pressures within the reactor are required to avoid water vaporization, thus reducing the energy demand [10,11]. As a result from the hydrothermal conversion, three types of sub-products are obtained: (i) an insoluble solid phase, that is a lignite-like, easy to handle fuel with well-defined properties; (ii) a liquid phase, mainly consisting of the dissolved inorganic salts, sugars and organic acids; (iii) a gaseous release, made by CO2, CO, CH4, H2 [12,13,14].
In literature, there is a number of studies on the HTC process of olive oil industry by-product, which mainly focus on the influence of operating conditions (i.e. temperature, reaction time, biomass-to-water ratios) on the obtained solid mass yield and its quality [15,16,17]. However, the economic and environmental feasibility of HTC process mainly depend on its energy consumption [18]. The proper design of HTC reactors and the energy consumption optimization require the specific knowledge of the flow and heat transfer behavior, including the reaction kinetics, characterizing the process. Experimental measurements provide certainly valuable insights into the complex phenomena involved in HTC processes. Along with experiments, the flexibility and accessibility of flow field data of numerical simulations can be of fundamental importance to deepen the understanding of the main physical aspects concerning such a process. This can be instrumental to improve the technology and achieve an industrial-scale production.
Computational Fluid Dynamics (CFD) modeling may represent therefore a useful tool to provide accurate and detailed analysis of the key process parameters. However, HTC processes involve highly complex physical phenomena, which need to be taken into account in order to capture all pertinent features of the flow. For this reason, numerical modeling of such a kind of problem currently represents a challenging task and, despite major progress in this field, the available literature on predictive methods for HTC processes is quite limited [19]. Regarding the heat transfer modeling of HTC of biomass only few studies are available. As an example, Alvarez et al. [17] have performed CFD simulation by considering a single phase flow to study the heat transfer performance of a laboratory scale HTC reactor placed in air heated oven. They have used a generalized simple first-order reaction kinetic model of cellulose HTC taking into account not only the reaction temperature but also the heating up process. The reaction medium has been assumed to be water. As a result, the authors have reported that the heating up step has a significant influence on the final conversion and therefore should not be neglected. Moreover, they have used their model to describe changes in the chemical composition and energy densification of the resulting char.
Baratieri et al. [20] have developed a simplified thermal model of HTC reactor. In particular, to describe the process, they have used a lumped resistance-capacitance network taking into account the thermo-physical properties of the water mixture, of the reactor shell and considering the thermal losses to environment. However, similarly to Alvarez et al. [17], in their study the reaction medium has been considered to be single phase liquid water, and the effect of heating rate on the reactor performance was not addressed.
One of the major difficulties in heat and mass transfer modeling of HTC process is to determine the specific mechanisms inside the reactor during the process. Heat transfer models of HTC available in the literature do not consider the biomass properties in the reacting medium [18]. Moreover, none of these studies consider the presence of air and gas within the reactor.
In this framework, the goal of the present work is to develop an enhanced numerical model for the HTC process of olive pomace and to perform a multiphase CFD analysis to investigate on the heat transfer mechanisms and natural convection phenomena occurring within a batch reactor. In particular, we consider a mixture with realistic physical properties as the reacting medium and we take into account the presence of the air within the reactor. A parametric analysis is then conducted by varying the power input driving the process, that is the heat flow through the reactor, in order to study the effects due to two main operating parameters such as the reaction time and the target reactor temperature. Finally, we evaluate the products yield from the HTC of olive pomace by coupling the CFD model with a simplified kinetic scheme. The proposed model is validated by comparing the numerical results with the experimental measurements previously obtained within the framework of an Italian national project (PRIN 2015, Development of a New Hydrothermal Carbonization REActor with Renewable Energy Supply for Biomass Treatment, CREA—CUP B12I16000510005) to which the authors participated. Basing on this, we provide recommendations for future developments of CFD modeling of HTC process.
The remaining part of the paper is organized as follows. Section 2 describes the reference experimental setup and the thermo-fluid dynamic and kinetic modeling approaches proposed in this work. In Section 3 we present and discuss the results from this study. Finally, in Section 4 we provide the concluding remarks.
2. Materials and Methods
2.1. Experimental Setup
The reactor layout and the HTC process operating conditions considered in this study are retrieved from the experimental work of Micali et al. [21], and in this Section are briefly recalled.
The experimental campaign was conducted at laboratory scale for a discontinuous HTC process of dried olive pomace (DOP), performed in a batch reactor. The reactor, which was ad-hoc designed and constructed, was a cylindrical shape vessel with capacity of 5 L, it was made of AISI Type 304 Stainless Steel, and it allowed a maximum pressure of 100 bar and a maximum temperature of 310 °C. Two heating bands of maximum thermal power of 9.8 kW in total were used to heat up the reactor and keep the required reaction temperature during the reaction process. The cooling of the biomass at the end of the treatment was realized by means of a cooling loop system consisting of 23 coils with an outer diameter of 60 mm placed inside the reactor. The cooling time of the biomass content from 300 °C to temperatures below 100 °C was about 15 min, considering the thermal inertia of the steel (the weight of the steel pressure vessel was about 45 kg). The reactor was loaded with 500 g of DOP and filled by water to obtain the substrate: the biomass-to-water ratio was 1:6. The experimental data were collected for experimental trials performed at three different operating temperatures, i.e., 260, 280 and 305 °C and autogenic pressures.
Each test had a total duration of around 180 min. Such a reaction time was counted from the moment when the reactor reached the set temperature to the end of experiment. Table 1 reports the operating conditions for the experimental tests along with the measured Higher Heating Value (HHV) and the elemental analysis for either DOP and produced hydrochar, provided as weight percentage on dry basis. During the experiments, the temperature inside the reactor was monitored. Thus, hydrochar (solid) mass yield (SY), liquid mass yield (LY), gas mass yield (GY), as well as gas composition, were measured at the end of the HTC processes.

Table 1.
Experimental operation conditions and characteristics of initial DOP and hydrochar produced at different temperatures [21].
In Table 2 we report these values, as obtained from the experiments presented in [21] along with the Total Organic Carbon (TOC) analysis performed on the liquid residue, for each considered test case.

Table 2.
Mass yields, gas compositions and TOC obtained experimentally in [21].
The values of SY, LY and GY reported in Table 2 are computed as follows:
where indicates the mass (on a dry basis) of the solid hydrochar available after the thermal treatment, is the overall mass of the gas produced, and are the total mass of liquid residue recovered after the HTC treatment and the total mass of water charged into the reactor at the beginning of the process, respectively, while represents the mass (on a dry basis) of the raw sample (DOP) before the thermal treatment.
2.2. Kinetic Model
In this work we model the kinetic phenomena occurring inside the reactor by means of a first-order reaction rate model, which is based on the work of Knežević et al. [22] and which is widely adopted in literature [17,23] and employed by the authors in [21]. According to this model, the reaction mechanisms taking place during the HTC process are defined by the following simplified kinetic scheme:
where the reaction rates for DOP and hydrochar are, respectively:
with being the fraction of DOP that is converted to hydrochar, at the end of the HTC process, while is the reaction rate constant governing the biomass feedstock—hydrochar transformation. The value of depends on the target temperature of the process and, in this study, is taken equal to the experimental SY data as reported in Table 2. The reaction rate constant is described by the Arrhenius equation:
where is the temperature as a function of time, is the pre-exponential or frequency factor, is the activation energy and is the gas constant, which is equal to 8.314 Jmol−1K−1. In this study, we set the kinetic parameters and to the values obtained from the experiments in [21], that are 0.98 min−1 and 15750 Jkg−1, respectively. The transient temperature of the working medium is instead computed from the numerical simulations, thus is a time-dependent parameter, which function is determined upon fitting the obtained data. In particular, according to the literature, we set the reference temperature for the HTC to 170 °C [9], which represents the threshold below which no reaction occurs, that is ; in a second phase of the process, during which the temperature inside the reactor rises from 170 °C to the target operating temperature, the value of increases and its trend is determined; finally, in the last phase of the HTC process, the target operating temperature is kept constant, thus leading to a constant value for . The masses and during the HTC process are then evaluated a-posteriori by solving analytically the differential Equations (5) and (6).
2.3. CFD Modeling of HTC Process
On the basis of the experimental setup described in previous Section, a multiphase transient CFD model was developed by means of ANSYS FLUENT® software. The geometry of the batch reactor resembles the one used in the experiments and consists of a cylinder with radius of 0.05 m and height of 0.60 m. However, in order to reduce the computational cost of the simulations, only a portion of the cylinder is considered in the model and a two-dimensional axisymmetric problem is setup. In Figure 1, a sketch of the computational domain is presented, where it is also shown the heating band region, and the initialization of mass fields is provided.
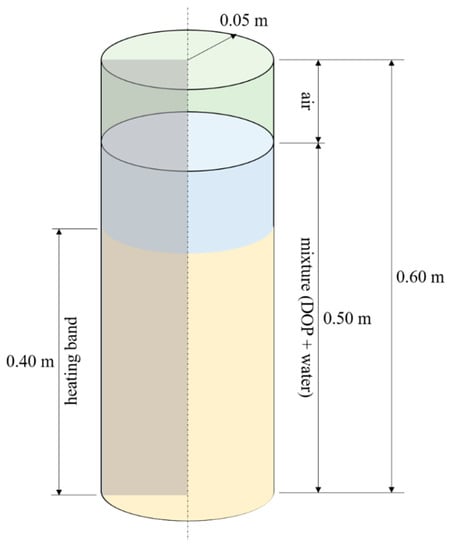
Figure 1.
Geometry of the modelled reactor. The two-dimensional computational domain consists of a generic axisymmetric section. The yellow region represents the heating band.
In the present multiphase model, three phases are considered, that are: air, water and DOP. Specifically, the so-called mixture model has been chosen to simulate the flow within the reactor. The mixture model is a simplified yet effective multiphase model, which is particularly suitable to handle slurry flows and, in general, flows with dispersed phases, where phases move at different velocities. In particular, the mixture model allows definition of granular phases and it is therefore applicable for liquid/gas-solid flows. As in the Eulerian model, the phases are treated as interpenetrating continua. However, the mixture model requires less computational effort since solves a smaller number of equations than the Eulerian model. For the present case, the computational cost is a crucial issue, since the problem deals with a complex flow under natural convection and the HTC process is a slow process, which requires a duration time of several hours. For this reason, also, the mixture model has been the preferred choice.
In this work, we assume the water to be compressible and to remain liquid during all the duration of the HTC process, according to experimental findings. Therefore, we do not consider any evaporation/condensation model, and we define the water density as a function of temperature by the following fourth-order polynomial equation:
where the temperature is meant to be expressed in Kelvin. Equation (8) approximates the liquid saturation curve of water in the temperature interval of concern (25–305 °C).
The DOP represents the dispersed phase into the liquid water and it is treated as a granular flow of constant density. Also, by using the concept of slip velocities, the water and olive pomace phases are allowed to move at different velocities, thus forming a non-homogeneous mixture during the process.
The air instead is considered as a compressible ideal gas. We emphasize that the presence of the air in the model is instrumental in order to allow density variations of the mixture phase and to properly capture the relevant flow and heat transfer phenomena due to natural convection. Table 3 reports all the main physical properties of the three phases adopted in the present study. The values for DOP are retrieved from [24,25].

Table 3.
Main physical properties of the multiphase flow inside the batch reactor.
According to the experiments, the HTC slurry composed of DOP and water is set to have a biomass to water ratio of 1:6 and to be homogeneous at the beginning of the process. Therefore, we set a uniform distribution of the dispersed phase as initial condition in the simulation. The air is placed on the top of the batch reactor (Figure 1). As far as the boundary conditions is concerned, we impose a constant heat flux, which value depends on the power input selected, in the heater band region, while adiabatic condition is set elsewhere along the lateral surface of the reactor. On the top and bottom of the reactor instead, we set a convection boundary condition, that is a heat transfer with the external environment, by assuming that this is constituted by stationary air at 27 °C and characterized by a heat transfer coefficient of 20 W/m2K. Such a boundary condition has been set to consider the heat losses from the reactor. Either the DOP/water mixture and the air are set at rest at the beginning of each simulation, with uniform temperature of 27 °C and atmospheric pressure.
The mixture model solves the continuity equation, the momentum equation and the energy equation for the mixture, while it solves the volume fraction equation for the secondary phases (water and olive pomace, in this case) only. Also, it computes the relative velocities to describe the dispersed phase (olive pomace, in this case) by means of algebraic expressions.
In particular, continuity, momentum and energy equations read as follows, respectively:
where is the volume fraction, is the pressure, is the velocity, indicates the number of involved phases, while the subscript m refers to mixture quantities, such as mass-averaged velocity, mixture density, dynamic viscosity of the mixture and mixture conductivity. These are given by the following relations, respectively:
In the momentum equation, is the drift velocity of the secondary k-th phase:
while the term in the energy equation is given by:
where is the sensible enthalpy for the k-th phase. Finally, a volume fraction equation is solved for each p-th secondary phase:
The estimated Rayleigh number (Ra) for the flow under consideration, based on the mass-weighted average properties of the mixture, is of the order of . Basing on the literature studies on natural convection in cylindrical enclosures, the motion inside the reactor can be then considered as laminar [26], hence we do not make use of any turbulence model. We emphasize that the flow regime and the phenomenological aspects of the thermally driven convection strongly depend on the rheology of the fluid and on the variability of its physical properties with the temperature. However, an accurate characterization of the physical properties of the considered mixture as well as a clear definition and an exhaustive description of the flow regimes under such peculiar conditions are not currently available. Therefore, despite the laminar approach being a reasonable choice for the purpose of this work, further investigations will be required in future to carry the modeling of the HTC process towards an even more realistic scenario.
The set of equation so far described is numerically solved by means of the SIMPLE algorithm and a second order upwind scheme is applied to all of the governing equations and to the transient formulation as well. The time-step is set to a fixed value equal to 1 s. However, in order to improve stability of the numerical solution, for each run the time-step is progressively increased from 0.1 s to 1 s during the first physical 30 s of simulation. For all simulations, a uniform structured mesh is adopted, which resolution has been chosen after performing a sensitivity analysis. This has been conducted by considering five uniform structured meshes configurations, with element size of 1.25 mm, 1.00 mm, 0.80 mm, 0.50 mm and 0.40 mm, corresponding to about 19,000, 30,000, 47,000, 120,000 and 188,000 elements, respectively. Thus, for each case, the first 10 min of the HTC process driven by a thermal power input of 5.0 kW are simulated and, to assess and quantify the quality of the mesh resolution, the root-mean-square error normalized to the mean value (NRMSE) is computed as follows:
where is the number of time-steps, and are the spatial-average temperature within the reactor, as a function of time, relative to the generic and the finest mesh cases, respectively, while is the time-average temperature of . As a result, we obtain that the NRMSE decreases asymptotically when the mesh is refined, with a deviation between the results of the two finest meshes of around 1.2%. This error can be considered acceptable, thus we chose the final mesh to be the one with 120,000 elements, corresponding to a resolution of 0.50 mm, in order to keep the computational cost as low as possible while retaining a satisfactory spatial accuracy. Such a mesh resolution was found to be sufficient to describe the flow evolution and to capture the relevant scales of motion.
3. Results and Discussion
The numerical study is carried out by varying the power input driving the process, that is the heat flow through the heater band, in order to analyze the evolution of the temperature field and mixture mass distribution during the transient initial state of the HTC process, and to evaluate the reaction time, given a specific target HTC temperature. All of the other variables, such as initial mixture composition, as well as the boundary conditions are kept as fixed parameters. In particular, the heater band is considered turned on and providing a constant power depending on the temperature within the slurry. To this aim twelve probes are inserted at different locations into the computational domain to monitor the temperature of the slurry and to provide a feedback control system to the heater band: when the average value of the temperatures at monitored location reaches the target HTC condition the heater band is turned off, thus no heat flux is transferred to the reactor medium from the external. Such a system is therefore capable of maintain the average temperature of the slurry around the target conditions for all the duration of the process, after the transient initial state.
In this study, four cases are analyzed, that are: 5.0 kW, 4.0 kW, 3.0 kW and 2.5 kW as thermal power input. In Figure 2, we show the temperature trends as obtained by the numerical simulations, for all the cases, during the initial transient state of the process, that is the heating stage, in comparison with the experimental measurements provide in [21].
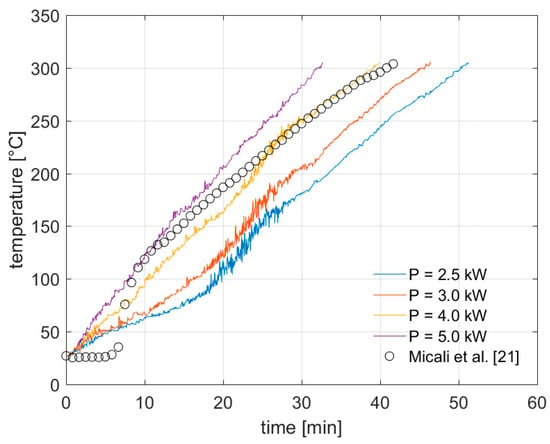
Figure 2.
Average temperature in HTC reactor during heating process. The numerical results are compared with experimental measurements in [21].
The results shown in Figure 2 are obtained by setting a target process temperature of 305 °C. However, we emphasize that they hold for any other case characterized by different process conditions since, for each thermal power input, the transient stage can be arrested at any desired target temperature below 305 °C. As far as the pressure is concerned, during the heating stage, this follows approximately the saturation curve of water, in all the cases.
Overall, we observe a good agreement between our numerical results and the experimental data obtained for an input power of 4.0 kW, with being of roughly 34 °C the maximum difference in the evaluated average temperature within the reactor during the first 10 min of the process and of roughly 23 °C during the remaining time-interval. Such a deviation is acceptable, since it can be ascribed to the slightly different layout configuration used in this study as well as to the DOP properties, for which an accurate characterization is currently not available. In particular, we note that the differences between our numerical results and data from experiments at the very beginning of the process may be related to the problem initialization. In fact, as initial condition, our numerical model assumes that the water and the DOP form a perfectly homogeneous mixture. This is not necessarily the case. It is actually expected that a certain level of non-homogeneity is retained in the physical experiments, which might be even not negligible. Such a difference in the initial flow properties distribution may affect the thermo-fluid dynamic evolution during the initial stage of the process, when the mixing due to natural convection is not intensive yet and the heat is transferred through the mixture mainly by conduction.
Also, we notice that by increasing the heating rate, when higher powers are applied, there is a significant reduction in the transient initial state, as expected. Specifically, by setting a target temperature equal to or above 260 °C, we estimate a reduction of the initial transient state of roughly 15 min between the case of power input equal to 2.5 kW and the one with power input equal to 5.0 kW.
To analyze in detail the heat transfer mechanism occurring within the reactor, the temperature field evolution during the HTC process is shown in Figure 3 and Figure 4, at different times of the initial heating-up phase.
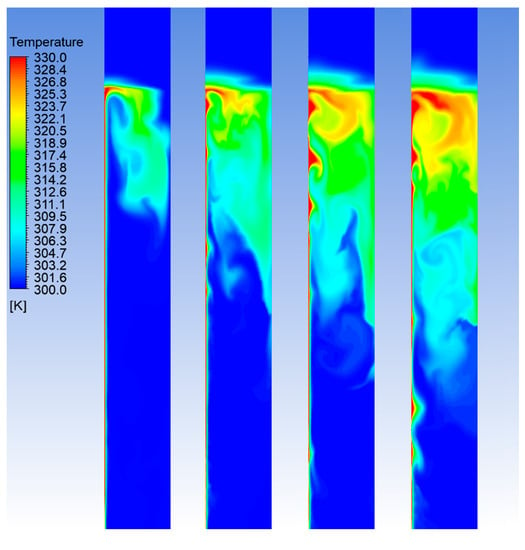
Figure 3.
Temperature field in the batch reactor, for the case of power input of 4.0 kW. From left to the right: 20, 40, 60 and 80 s after the start of the process.
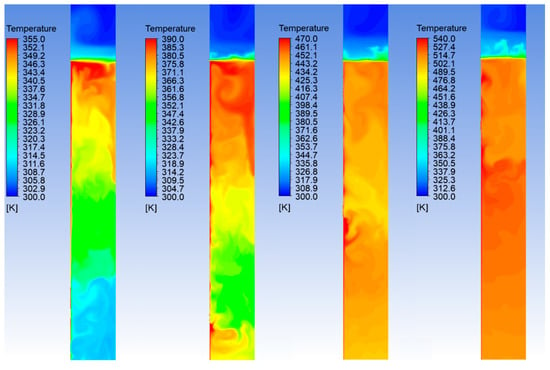
Figure 4.
Temperature field in the batch reactor, for the case of power input of 4.0 kW. From left to the right: 5, 10, 20 and 30 min after the start of the process.
In Figure 3 and Figure 4, where only the middle region of the reactor is shown, the heater band is located at the left edge of the domain, while the right edge corresponds to the axis of symmetry. The case of 4.0 kW of power input is considered as an example, however, similar trends are also obtained for the other cases. The mixture is initially at rest with uniform temperature of 27 °C. As it can be noticed, the heat flux from the heater and the related local increasing of the temperature give rise to intense temperature fluctuations. The temperature field remains fairly non-uniform until the mixing of the flow, due to the induced convection motions, becomes relevant. The numerical simulation shows that the slurry reaches a uniform temperature after approximately 10 min from the starting of the heating process. Even though the average temperature until this stage is still below the limit of 170 °C, this behavior indicates that the reaction mechanisms may be affected and, therefore, the HTC process during this initial phase may not be efficient.
Another interesting feature of the flow to analyze is the volume fraction of the DOP within the batch reactor during the process. The evolution of the DOP distribution is shown in Figure 5. Initially, as mentioned before, the water and the DOP are assumed to form a homogeneous mixture. However, our numerical results clearly show a tendency of the DOP to stratify on the top of the water region, under the free-surface with air. The DOP is indeed characterized by lower density with respect to the water. This behavior indicates that, despite a significant buoyant force, the convective momentum transport does not lead to an efficient mixing of the slurry. From the Figure 5 we also notice that the filling level of the slurry increases during the heating-up transient due to the decreasing density of the carrying phase, that is the water. In fact, under the physical conditions of the HTC process, the density of water varies significantly. Further improvement of the present model will have to consider also possible local evaporation/condensation phenomena, in order to better characterize the flow and understand its dynamics.

Figure 5.
Volume fraction distribution of DOP within the reactor at different times, for the case of power input of 4.0 kW. From left to the right: 2, 20 and 40 min after the start of the process.
Next, in Figure 6, the velocity fields within the reactor are reported for different times after the starting of the HTC process.
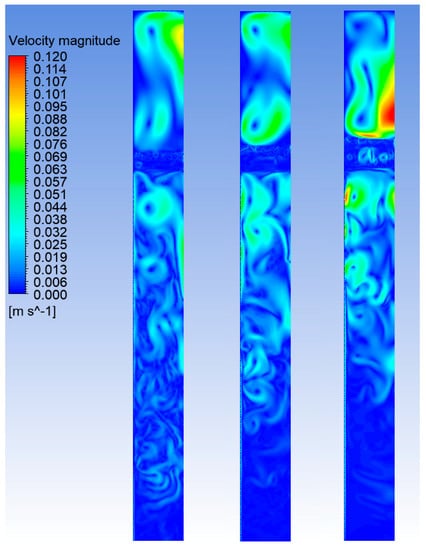
Figure 6.
Velocity fields within the reactor at different times, for the case of power input of 4.0 kW. From left to the right: 10, 20 and 30 min after the start of the process.
The velocity field analysis allows understanding if the relevant scales of motion are properly captured by the model and if any undesirable spurious effects at the free-surface arises during the simulation. The plots show that the vortex formation and evolution is consistent and the model seems to well predict the velocity distribution in the closest proximity of the free-surface, where no spurious currents are observable. This further indicates that the present model is robust and reliable. We emphasize, however, that the results reported in Figure 3, Figure 4, Figure 5 and Figure 6 require further validation by means of experimental measurements and observations. Due to the high complexity of the case under investigation, the present numerical analysis is indeed grounded on several assumptions, which inherently limit its generality. Thus, the presented results should be regarded as a reasonable prediction of the involved phenomena occurring during a HTC process, which may serve as a basis for further steps of the research.
Finally, we evaluate the products yield from the HTC of olive pomace by coupling the CFD model with the general kinetic scheme described in Section 2.2. To this aim, we compute the values of the reaction rate constant , by means of Equation (17), during the transient stage of the process when the average temperature of the flow goes from 170 °C up to 305 °C. Thus, we perform a fitting procedure to determine an easy-to-handle analytical function for the time evolution of . In particular, we chose a power function of the following kind:
where is the time while , and are the model constants which are determined via the fitting procedure. For all the considered cases, this model fits quite well the data, as indicated by the high values obtained for the coefficient of determination , which are 0.9977, 0.9937, 0.9758 and 0.9978 for the cases of 2.5 kW, 3.0 kW, 4.0 kW and 5.0 kW input power, respectively.
In Figure 7 we show the mass evolution of DOP and hydrochar, as computed by solving the differential Equations (5) and (6), for two different process conditions, that are related to target operating temperature of 260 °C, 280 and 305 °C, respectively.
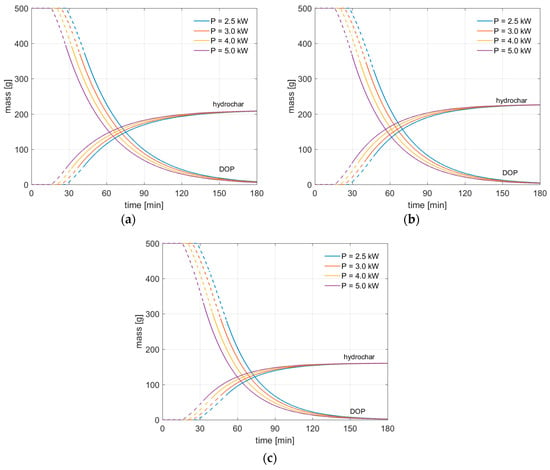
Figure 7.
Solid mass conversion during HTC of olive pomace. (a): ; (b): ; (c): . Dashed lines correspond to the transient stage of the process, during which the average temperature inside the rector increases until the target operating temperature is reached.
In Figure 7, dashed lines indicate the initial transient phase of the HTC process, which is characterized by an increasing of the temperature and, in turn, of the reaction rate; the continuous lines of Figure 7 represent instead the HTC process at constant operating temperature. The results show that in all cases the hydrochar mass increases considerably during the first hour of the process, to reach then its asymptotic value. The obtained trends are consistent: when the power input is increased, the reaction mechanisms occur earlier, thus the DOP mass is more rapidly converted to hydrochar. Also, we note that no discontinuities are observable in the mass evolution trends between transient and steady states of the process. This indicates that the provided kinetic model is suitable to describe the initial transient stage of the HTC process, which is crucial to accurately determine the overall required time. This is reported in Figure 8, for all of the considered cases.
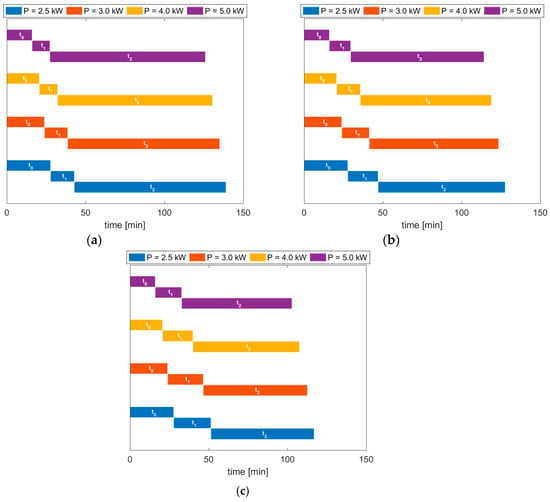
Figure 8.
Required time for the HTC process to produce the 95% of the target hydrochar mass (i.e. . (a): ; (b): ; (c): . For each power input case, the process time is subdivided into three stages: initial no-reaction phase , heating-up phase with increasing reaction rate , and reaction phase at constant operating temperature .
The results show that either the initial stage of the process, where no-reaction occurs within the medium due to low temperature values, and the subsequent transient stage, during which the flow is kept heated until its average temperature reaches the target operating conditions, are reduced when the power input is increased. In particular, the gain in overall process time is significant: for and a power input of 2.5 kW the overall required time is around 139 min, while when the power is doubled, this decreases to roughly 126 min. Similarly, for , the doubling of the power brings the overall process time from 117 min to around 103 min. Such differences correspond to a reduction in required time of about 9% and 12% for the two limit cases of and , respectively. The results show also that the required process times for the case of higher operating temperature are always lower than the corresponding ones related to the case of lower operating temperatures, as expected, thus further validating the suitability of the adopted model.
4. Conclusions
The scope of the present work was to develop a new, comprehensive and effective CFD model to predict the conversion of olive pomace into solid char, under hydrothermal conditions. Specifically, this study represents a first attempt to model the complex interplaying physical phenomena occurring within a batch reactor during the HTC process. To this aim, the proposed model takes into account either a non-homogeneous mixture with realistic physical properties as the reacting medium, and the presence of a gaseous phase on the top of the free-surface of the mixture, which is instrumental to capture the relevant flow physics. These aspects represent a major difference with respect to previous studies. The yields of products from the HTC of olive pomace are then evaluated by coupling the numerical model with a first-order reaction rate kinetic scheme. This considers the variability of the reaction rate constant with the temperature, thus leading to a possibly more accurate representation of the products evolution in time.
The proposed methodology complements the experimental work developed by some of the authors in a previous publication [21] and then is validated based on the available experimental data on the HTC process of olive pomace. The study is conducted by varying the power input driving the process and the effect of different operating conditions are also investigated.
As a result, the velocity flow fields and the spatial distribution of the mixture during the process are predicted. These may provide useful information regarding the change in feed conversion at different regions within the reactor. An overall good agreement with the available experimental measurements is found in terms of temperature of the working medium inside the reactor. Moreover, the proposed fitting procedure for the evaluation of the reaction rate constant is found to be suitable to accurately predict the evolution of the yields of product during the initial transient stage of the HTC process.
A truthful validation of the numerical model by means of experiments is in order. In addition, future developments of this work will have to take into consideration the direct coupling between the flow and heat transfer modeling and the kinetic routines into a single CFD model. In fact, due to the occurring of several interplaying physico-chemical phenomena, the numerical simulation of the HTC process represents a highly complex task, thus there is still need of modeling improvement for better prediction of the product yields and generalization of the results. Also, three-dimensional simulations are in order to improve the accuracy of the solution. Another crucial point regards the characterization of the physical properties of the reacting mixture: their accurate description into the numerical model is instrumental to provide better insights on the flow evolution and, therefore, on the reactions mechanisms.
Author Contributions
Conceptualization, L.L. and B.M.; methodology, G.D.I. and B.M.; investigation, L.L., G.D.I. and B.M.; writing—original draft preparation, G.D.I. and B.M.; writing—review and editing, L.L., G.D.I. and B.M.; supervision, L.L. All authors have read and agreed to the published version of the manuscript.
Funding
This research received no external funding.
Conflicts of Interest
The authors declare no conflict of interest.
References
- Vlyssides, A.; Loizides, M.; Karlis, P. Integrated strategic approach for reusing olive oil extraction by-products. J. Clean. Prod. 2004, 12, 603–611. [Google Scholar] [CrossRef]
- European Commission. Study on the Implementation of Conformity Checks in the Olive Oil Sector throughout the European Union, Contract AGRI-2018-0485; European Commission: Brussels, Belgium, 2020. [Google Scholar] [CrossRef]
- Miranda, M.T.; Cabanillas, A.; Rojas, S.; Montero, I.; Ruiz, A. Combined combustion of various phases of olive wastes in a conventional combustor. Fuel 2007, 86, 367–372. [Google Scholar] [CrossRef]
- Manzanares, P.; Ballesteros, I.; Negro, M.J.; González, A.; Oliva, J.M.; Ballesteros, M. Processing of extracted olive oil pomace residue by hydrothermal or dilute acid pretreatment and enzymatic hydrolysis in a biorefinery context. Renew. Energy 2020, 145, 1235–1245. [Google Scholar] [CrossRef]
- Intini, F.; Kühtz, S.; Rospi, G. Energy Recovery of the Solid Waste of the Olive Oil Industries–LCA Analysis and Carbon Footprint Assessment. J. Sustain. Energy Eng. 2011, 2, 157–166. [Google Scholar]
- Lynam, J.G.; Toufiq Reza, M.; Vasquez, V.R.; Coronella, C.J. Effect of salt addition on hydrothermal carbonization of lignocellulosic biomass. Fuel 2012, 99, 271–273. [Google Scholar] [CrossRef]
- Śliz, M.; Wilk, M. A comprehensive investigation of hydrothermal carbonization: Energy potential of hydrochar derived from Virginia mallow. Renew. Energy 2020, 156, 942–950. [Google Scholar] [CrossRef]
- Wilk, M.; Magdziarz, A.; Kalemba-Rec, I.; Szymańska-Chargot, M. Upgrading of green waste into carbon-rich solid biofuel by hydrothermal carbonization: The effect of process parameters on hydrochar derived from acacia. Energy 2020, 202, 117717. [Google Scholar] [CrossRef]
- Funke, A.; Ziegler, F. Hydrothermal carbonization of biomass: A summary and discussion of chemical mechanisms for process engineering. Biofuels Bioprod. Biorefining 2010, 4, 160–177. [Google Scholar] [CrossRef]
- Fiori, L.; Basso, D.; Castello, D.; Baratieri, M. Hydrothermal carbonization of biomass: Design of a batch reactor and preliminary experimental results. Chem. Eng. Trans. 2014, 37, 55–60. [Google Scholar] [CrossRef]
- Lucian, M.; Fiori, L. Hydrothermal carbonization of waste biomass: Process design, modeling, energy efficiency and cost analysis. Energies 2017, 10, 211. [Google Scholar] [CrossRef]
- Sevilla, M.; Fuertes, A.B. The production of carbon materials by hydrothermal carbonization of cellulose. Carbon 2009, 47, 2281–2289. [Google Scholar] [CrossRef]
- Titirici, M.; Fühner, C.; Bens, O.; Kern, J.; Emmerich, K.-H.; Libra, J.A.; Ro, K.S.; Kammann, C.; Funke, A.; Berge, N.D.; et al. Hydrothermal carbonization of biomass residuals: A comparative review of the chemistry, processes and applications of wet and dry pyrolysis. Biofuels 2011, 2, 71–106. [Google Scholar] [CrossRef]
- Kim, D.; Yoshikawa, K.; Park, K.Y. Characteristics of biochar obtained by hydrothermal carbonization of cellulose for renewable energy. Energies 2015, 8, 14040–14048. [Google Scholar] [CrossRef]
- Volpe, M.; Fiori, L. From olive waste to solid biofuel through hydrothermal carbonisation: The role of temperature and solid load on secondary char formation and hydrochar energy properties. J. Anal. Appl. Pyrolysis 2017, 124, 63–72. [Google Scholar] [CrossRef]
- Missaoui, A.; Bostyn, S.; Belandria, V.; Cagnon, B.; Sarh, B.; Gökalp, I. Hydrothermal carbonization of dried olive pomace: Energy potential and process performances. J. Anal. Appl. Pyrolysis 2017, 128, 281–290. [Google Scholar] [CrossRef]
- Álvarez-Murillo, A.; Sabio, E.; Ledesma, B.; Román, S.; González-García, C.M. Generation of biofuel from hydrothermal carbonization of cellulose. Kinetics modelling. Energy 2016, 94, 600–608. [Google Scholar] [CrossRef]
- Heidari, M.; Dutta, A.; Acharya, B.; Mahmud, S. A review of the current knowledge and challenges of hydrothermal carbonization for biomass conversion. J. Energy Inst. 2018. [Google Scholar] [CrossRef]
- Ledesma, B.; Bae, S.; Libra, J.; Álvarez, A.; Li, L.; Ro, K.; Román, S.; Sabio, E.; Berge, N. Hydrothermal Carbonization: Modeling, Final Properties Design and Applications: A Review. Energies 2018, 11, 216. [Google Scholar] [CrossRef]
- Baratieri, M.; Basso, D.; Patuzzi, F.; Castello, D.; Fiori, L. Kinetic and Thermal Modeling of Hydrothermal Carbonization Applied to Grape Marc. Chem. Eng. Trans. 2015, 43, 505–510. [Google Scholar] [CrossRef]
- Micali, F.; Mendecka, B.; Lombardi, L.; Milanese, M.; Ferrara, G.; De Risi, A. Experimental investigation on high-temperature hydrothermal carbonization of olive pomace in batch reactor. AIP Conf. Proc. 2019, 2191, 020112. [Google Scholar] [CrossRef]
- Knežević, D.; Van Swaaij, W.P.M.; Kersten, S.R.A. Hydrothermal conversion of biomass: I, glucose conversion in hot compressed water. Ind. Eng. Chem. Res. 2009, 48, 4731–4743. [Google Scholar] [CrossRef]
- Reza, M.T.; Yan, W.; Uddin, M.H.; Lynam, J.G.; Hoekman, S.K.; Coronella, C.J.; Vásquez, V.R. Reaction kinetics of hydrothermal carbonization of loblolly pine. Bioresour. Technol. 2013, 139, 161–169. [Google Scholar] [CrossRef] [PubMed]
- Al-Widyan, M.I.; Rababah, T.M.; Mayyas, A.; Al-Shbool, M.; Yang, W. Geometrical, thermal and mechanical properties of olive fruits. J. Food Process. Eng. 2010, 33, 257–271. [Google Scholar] [CrossRef]
- Bennini, M.A.; Koukouch, A.; Bakhattar, I.; Asbik, M.; Boushaki, T.; Sarh, B.; Elorf, A.; Cagnon, B.; Bonnamy, S. Characterization and combustion of olive pomace in a fixed bed boiler: Effects of particle sizes. Int. J. Heat Technol. 2019, 37, 229–238. [Google Scholar] [CrossRef]
- Papanicolaou, E.; Belessiotis, V. Transient natural convection in a cylindrical enclosure at high Rayleigh. Int. J. Heat Mass Transf. 2002, 45, 1425–1444. [Google Scholar] [CrossRef]
© 2020 by the authors. Licensee MDPI, Basel, Switzerland. This article is an open access article distributed under the terms and conditions of the Creative Commons Attribution (CC BY) license (http://creativecommons.org/licenses/by/4.0/).