Abstract
Unstable flow structures cause inevitable energy losses in all power energy systems, including turbomachines. In this study, a set of analyses was conducted with the use of spectral maps on the pressure signals obtained from an industrial centrifugal compressor. The spectral maps provide one a detailed visualization of the flow conditions present in the machine along the performance curve and to distinguish the flow phenomena present prior to the surge. The method accuracy is especially useful in detecting the inlet recirculation. The study was conducted at four impeller rotational speeds with varying loads imposed by a valve at the outlet. At each speed, the machine experienced different stages of unstable flow conditions prior to the surge. Five main frequency peaks that appeared in all cases were identified and discussed. The surge was observed at all impeller speeds. At lower ones, however, it appeared at higher valve closures. At higher speeds, the surge was much more intense. The study has also shown that the inlet recirculation appears also for the closed-type industrial impeller. The phenomenon was present in all conditions. The higher impeller speed, the faster onset of the inlet recirculation was. This structure has a strong potential for an early instability warning because it appears in various types of impellers, has a very particular spectral structure and its positioning is very predictable. This study gives another example of the inlet recirculation universality and potential for efficient anti-surge protection.
1. Introduction
Centrifugal compressors are widely used across many industries. Their applications include heavy industry, automotive, energy sector, home appliances, and many others [1]. In most cases, the compressor flow stability is crucial for the continuous operation of the compressing system, connected network, and numerous related machinery. The system working range is, however, limited. At high mass flow rates, the compressor is affected by the choking phenomenon resulting from the appearance of the shock wave [2]. At low mass flow rates, the flow becomes less stable resulting in various local flow instabilities including the rotating stall, inlet recirculation, outlet recirculation. In most dramatic cases the instability becomes global which is referred to as the surge phenomenon [3].
The surge phenomenon was first described by Emmons et al. [4]. Greitzer formulated a mathematical surge model [5,6] that continues to be developed until now with different improvements [3,7]. The surge cycle timescale is typically much longer than the impeller rotation by at least one order of magnitude [8]. The phenomenon depends on and influences the pipeline behind the compressor (usually known as the plenum) [9], but also depends on the inlet network [10,11]. Although there exist different suggestions of classifying different types of the surge, the most widely known distinction includes two types of the surge. “The deep surge” typically refers to a situation when pressure oscillation is strong enough to induce periodic backflow. Weaker fluctuations are usually referred to as “the mild surge” [12].
Local flow instabilities (such as stalls, swirls or recirculation) are often regarded as the surge predecessors [13,14]. The most common local instability is the rotating stall [15]. This instability might appear in the impeller, but also in a vaned or vaneless diffuser [16]. The stall does usually not cause immediate danger to the compressor operation. It causes, however, regular vibrations that can induce quick bearing failure or blade fatigue [17]. All types of the rotating stall can be easily detected by spectrum analysis, as the structure has a very periodic character [18]. In certain machines, inlet instability is also observed prior to the surge [19]. It was also reported that the non-uniform flow at the inlet can in certain conditions delay surge inception [20]. This is often associated with the inlet recirculation [21,22]. Unlike the rotating stall, the inlet recirculation usually does not produce any dominating frequency in the pressure signal. Its spectral signature is often associated with a broadband noise [16].
Local flow instabilities have been analyzed experimentally in various studies. Liu and Zheng implemented three different methods (acoustic, pressure, and temperature measurement) to evaluate the possible positioning of the surge inception points [23]. There are also numerous other studies devoted to this issue [24,25]. Many researchers have analyzed the spectral structure of the signals at the surge and prior to it. This kind of analysis was conducted, among others, by Oakes et al. [17,24], Brown et al. [26], Lawless and Fleeter [27], Kang and Kang [28], Horodko [29] or Liskiewicz et al. [14,30].
The instability inception mechanism also varies with the compressor rotational speed. He and Zheng presented Fourier spectra of pressure signals gathered at different stages of instability growth: impeller inlet instability, inducer stall, mild surge, deep surge [8]. Tests were conducted at different rotational speeds and have shown that in various rotational speeds inception mechanisms are changing. Sun et al. presented the time-evolution of the instability inception at various rotational speeds and gauge locations [31]. Galindo et al. investigated the influence of inlet pulsation on the compressor surge line at different rotational speeds [32]. Kang and Kang investigated different algorithms for stall warning based on the pressure spectrum change observed at different rotational speeds of the high-speed centrifugal compressor [28].
Spectral studies allow one to distinguish new pressure oscillation peaks and associate them with certain flow structures. Bianchini et al. uses the criterion based on the diffuser pressure power spectrum for the identification of the onset of vaneless diffuser rotating stall [33]. The inlet recirculation can be also identified based on its characteristic features. Schreiber conducted an extensive study of this phenomenon and concluded that it “is non-periodic in a time-averaged sense. Furthermore, it can extend into the passage radially up to 20% of the span” [22]. The numerical studies have shown that the non-periodic character of this structure comes from the varying thickness of the recirculation zone [34,35]. Therefore the spectral signature of this phenomenon is the weak but broadband noise [14]. The inlet recirculation zone is also characterized by higher temperature and static pressure [21,22]. All the abovementioned features make the inlet recirculation detection very easy, and hence this structure could play a good role in the surge early detection systems. It is not clear, however, how the inlet recirculation onset is related to other unstable flow structures. Semlitsch and Mihaescu connected the tip leakage recirculations with a distorted swirling flow at the inlet of the compressor, which results in reduced performance of the impeller [13]. If that is correct, the inlet recirculation appearance time should be dependent on the impeller rotational speed.
All abovementioned examples have proven the usability of the spectral analysis in detection of the local flow instabilities appearing prior to the surge, also including the inlet recirculation. Studies have also shown that the local flow instabilities are changing their behaviour together with the impeller rotational speed. This study aims to deliver an analysis covering a systematic study of instabilities appearing at different rotational speeds and different operating points in the low-speed industrial centrifugal compressor. The study includes pressure variation plots and spectral maps as a tools providing clear image of the machine operating condition.
2. Method
2.1. General Design Description
The test object was a single-stage mixed-type impeller (diagonal inlet, radial outlet) obtained from an industrial three-stage air-compressing unit (VRK-3, VEB Pumpen- und Geblasewerk Leipzig, Germany). The layout of the rig’s operation is illustrated in Figure 1. The shrouded impeller (3) is directly coupled (10) to a high-speed water-cooled electric motor with a maximal power output of 50 kW (11). The impeller’s shaft is supported by an assembly of two high-precision roller bearings (9). The suction duct includes the mass flow measurement cone (1) mounted on the PVC-based 200 mm diameter suction pipeline (2) designed in agreement with ISO 5167 standard. Downstream from the impeller, the vaneless diffuser (4), and the overhung scroll (5) are followed by the discharge pipeline (6) equipped with the differential throttle (7) and an anti-surge plug-valve (8). The crucial parameters of the rig are presented in Table 1.
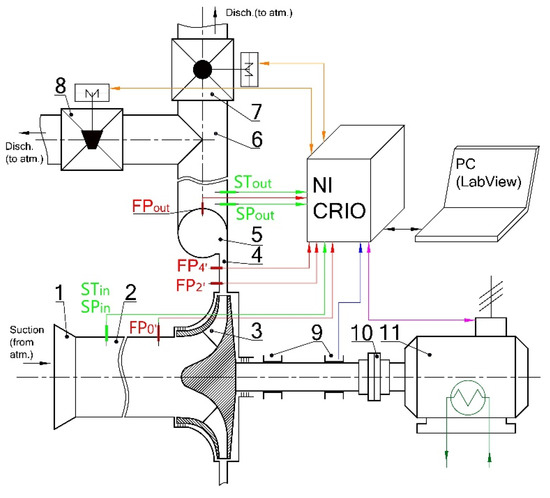
Figure 1.
Layout functional scheme of the experimental rig.

Table 1.
Operational and geometric parameters of the tested stage.
2.2. Instrumentation
The measurements of stationary performance characteristics were carried out based on the piezoelectric pressure and temperature probes mounted flush in the suction (SPin, STin) and the discharge pipelines (SPout, STout)–see Figure 1. The pressure transducers used for measuring the dynamic phenomena in the compressor were located at three characteristic points: inlet upstream of the impeller (in the recirculation zone), diffuser, and the plenum. The choice of points allowed to monitor three typical places of instability occurrence: in the interface upstream or downstream the impeller and in the plenum.
The measurement process was monitored and controlled via NI Compact RIO and LabView (National Instruments, Austin, TX, USA). The pressure was measured with subminiature XCQ-062-5D transducers (Kulite, Leonia, NJ, USA) with combined non-linearity, hysteresis, and repeatability errors not higher than 0.5% of the Full Scale Output. Their position is presented in Figure 2 as Kin (upstream of the impeller), Kout (volute outlet), K2 (diffuser outer wall). Measurement was conducted for valve positions separated by 1 degree to assure high precision of selecting the instability inception point. At each valve position, the measurement was conducted for at least 10 s to provide a sufficiently long time series assuring high accuracy and precision of the FFT results. The sampling frequency was equal to 51.2 kHz resulting in the Nyquist frequency 25.6 kHz—over 14 times higher than the blade passing frequency in the fastest impeller speed analyzed. Hence, the anti-aliasing filter was not necessary. A combination of long measurement length and high sampling rate allowed to decrease the influence of noise on measurement, hence the application of low-pass filters was also not needed. The FFT algorithms were applied directly to the raw data. Measurement series included all valve positions from 90 deg down to 10 deg. In cases when the pressure oscillations were growing to amplitudes exceeding 2.5 kPa, the experiment was stopped. Each series was repeated at four rotational velocities of the engine: 70 Hz, 95 Hz, 110 Hz, 120 Hz. All rotational velocities were below the nominal speed of this impeller estimated to NP = 0.83 kg/s, π = 1.29, at n = 250 Hz. Lower rotational frequencies were applied to ensure safe operation at low mass flow rates.
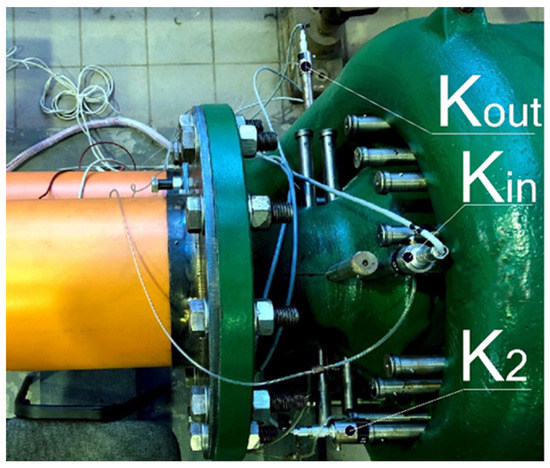
Figure 2.
Illustration showing the high-response Kulite pressure transducers’ locations.
3. Results and Discussion
3.1. Stationary Performance Measurements Results
The performance curves of the compressor for all analyzed cases are presented in Figure 3a. Each line represents the static-to-static flange-to-flange pressure characteristics. Blue lines connect the optimal working points of the highest measured efficiency. The orange line approximates the boundary of the machine stable range evaluated based on the overall size of the pressure fluctuations. The further analysis gives a deeper explanation of where the instability onset appears and how it evolves with the valve position and impeller rotational speed. Results are divided into 4 subsections containing different impeller rotational velocities. Figure 3b presents the valve curves measured at the same impeller rotational speeds. Table 2 presents the relations between the dimensional parameters used in this study to non-dimensional parameters traditionally used in turbomachinery [5].
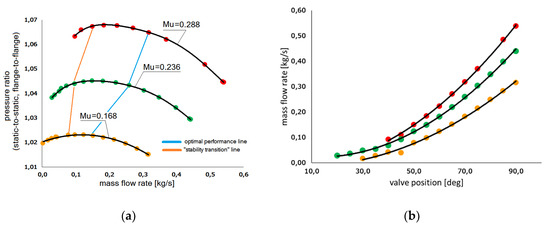
Figure 3.
Performance curves and valve characteristics measured at n = 70 Hz (Mu = 0.168), n = 95 Hz rpm (Mu = 0.236), n = 120 Hz (Mu = 0.288). (a) Compressor performance curves, (b) valve characteristics.
Table 2.
Comparison between dimensional and dimensionless parameters of the compressor.
3.2. Summary of Observed Pressure Oscillations
Observation of all discussed impeller speeds allowed us to distinguish 4 typical frequencies, where the pressure peaks were observed: first at 10 Hz–11 Hz, second around 25 Hz, third close to 50 Hz, and two close peaks in the region 82 Hz–86 Hz. Additionally, the broadband noise was observed in all cases at some valve positions. At each impeller speed, the exact frequency and amplitude of the peak was different, as well as the valve position at which it was observed. For the sake of further discussion, all those parameters are summarized in Table 3. The following subsections include a discussion of each case separately. Finally, the discussion of global conclusions coming from the comparison between all cases is presented.
Table 3.
Summary of main observations regarding the unstable flow structures appearing at different rotational speeds (MOA—The moment of appearance).
3.3. 0.28 Nominal Speed (70 Hz)
Figure 4 presents pressure variation measured in the diffuser at the impeller rotational velocity of 70 Hz in the function of the valve position given in degrees. 90 deg corresponds to the valve almost fully open, while 10 deg—almost fully closed. The red area in Figure 4a presents the pressure variation range, while the black line presents its average value. One could see that the pressure average value reproduced the shape of the compressor performance curve. Its maximum value was attained at about 50 deg and in this region at 30–60 deg. At lower valve positions a noticeable and gradual fall was observed. The range of pressure oscillation increased slightly around 50 deg and at lower valve positions continued to decrease with moderate intensity. Figure 4b presents a spectral map of the same set of signals. At high valve openings, the spectrum maintained similar shape (valve positions between 90 deg and 50 deg). The main pressure peaks observed were 70 Hz and its higher harmonics. At 50 deg and at lower valve positions the new amplifications started to appear. Peaks were observed at frequencies 11.2 Hz (22 Pa), 25.7 Hz (10 Pa), and 85.6 Hz (11 Pa). Around 33 deg the broadband noise was observed to rise across all frequencies, but especially at lower than abovementioned peaks.
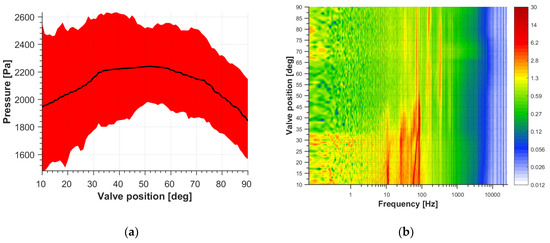
Figure 4.
Pressure variation depending on the valve position measured in the diffuser at impeller rotational speed 70 Hz. (a) The left plot represents the min-to-max plot (red) and the pressure average value (black). (b) The right plot represents the spectral map with the colormap in the logarithmic scale.
Figure 5 shows the pressure variation depending on the valve position measured at the outlet at an impeller rotational speed of 70 Hz. The left plot represents the min-to-max plot (red) and the pressure average value (black). The right plot represents the spectral map with the colormap in the logarithmic scale. presents the same set of plots registered at 70 Hz at the outlet pressure gauge. Figure 5a again reproduced the shape of the impeller performance curve in a much more pronounced way. The maximum pressure rise was observed between 60 deg and 50 deg. Then, at valve positions below 50 deg, the pressure continued to decrease gradually. The range of pressure fluctuation started increasing a bit later than in the diffuser (where it was noticeable at 50 deg). The slight increment was observed around 30 deg and then again around 20 deg. The spectral map is presented in Figure 5b. One could see that the spectral structure of the signal was indeed most flat in the region of maximum pressure rise between 60 deg and 50 deg. The new peaks started to appear at valve positions lower than 50 deg in this region with similar frequencies to the diffuser 11.2 (31 Pa) Hz, 25.7 Hz (8 Pa), and 49.7 Hz (3 Pa). Around 33 deg the broadband noise was observed to rise across all frequencies, but especially at lower than abovementioned peaks. The broadband noise was also noticeable at very high valve openings.

Figure 5.
Pressure variation depending on the valve position measured at the outlet at impeller rotational speed 70 Hz. (a) The left plot represents the min-to-max plot (red) and the pressure average value (black). (b) The right plot represents the spectral map with the colormap in the logarithmic scale.
Figure 6 shows the pressure variation depending on the valve position measured at the inlet at an impeller rotational speed of 70 Hz. The left plot represents the min-to-max plot (red) and the pressure average value (black). The right plot represents the spectral map with the colormap in the logarithmic scale. outlines the inlet pressure characteristics in the 70 Hz impeller speed. Figure 6a shows that the inlet suction zone was present at valve positions higher than 30 deg. The inlet pressure was, however, gradually increasing with the valve closure (for decreasing valve positions). At 50 deg the pressure oscillation range increased drastically, then slightly decreased around 30 deg and maintained relatively constant with further valve closure (for decreasing valve positions). The pressure spectral map presented in Figure 6b indicates that this sudden increment was connected mainly with the frequency of 11.2 Hz (23 Pa) and the broadband noise that appeared slightly earlier in the inlet than in the diffuser and the outlet. The moment of broadband noise appearance was concurrent with the jump of the average pressure observed in Figure 6a (37 deg).
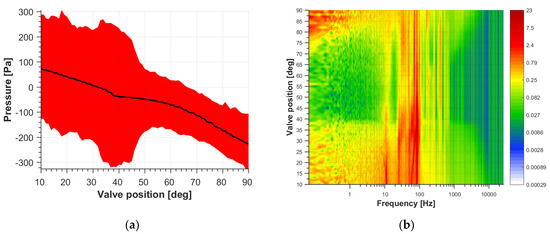
Figure 6.
Pressure variation depending on the valve position measured at the inlet at impeller rotational speed 70 Hz. (a) The left plot represents the min-to-max plot (red) and the pressure average value (black). (b) The right plot represents the spectral map with the colormap in the logarithmic scale.
3.4. 0.38 Nominal Speed (95 Hz)
Figure 7 presents the pressure variation measured in the diffuser at the impeller rotational velocity of 95 Hz in function of the valve position given in degrees. One can see that the pressure average value reproduced the shape of the compressor performance curve (Figure 7a). Its maximum value was attained at about 50 deg and stayed in its vicinity int the region 30–60 deg. At lower valve positions a noticeable and gradual fall was observed. The range of pressure oscillation increased slightly around 50 deg and then slowly continued to increase for lower valve positions. Figure 7b presents a spectral map of the same set of signals. At high valve openings, the spectrum maintained similar shape (valve positions between 90 deg and 50 deg). The main pressure peaks observed were 95 Hz and its higher harmonics. Around 50 deg and for lower valve positions the new amplifications started to appear. The dominating frequencies were 11.5 Hz (34 Pa), 25.1 Hz (8 Pa), and 82.7 Hz (19 Pa). Around 33 deg the broadband noise was observed to rise across all frequencies, but especially at lower than the abovementioned peaks.
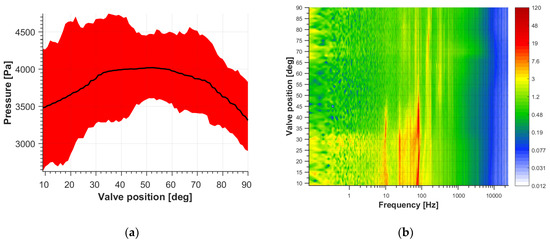
Figure 7.
Pressure variation depending on the valve position measured at the diffuser at impeller rotational speed 95 Hz. (a) The left plot represents the min-to-max plot (red) and the pressure average value (black). (b) The right plot represents the spectral map with the colormap in the logarithmic scale.
Figure 8 presents the same set of plots registered at 95 Hz at the outlet pressure gauge. Figure 8a again reproduces the shape of the impeller performance curve in a much more pronounced way. The maximum pressure rise was observed between 60 deg and 50 deg. Then, at lower valve positions the pressure continued to decrease. The range of pressure fluctuation was increasing a bit later than in the diffuser. The slight inclement was observed around 30–40 deg and then again around 20 deg. The spectral map is presented in Figure 8b. One could see that the spectral structure of the signal was indeed most flat in the region of maximum pressure rise between 65 deg and 50 deg. The new peaks started to appear at valve positions lower than 50 deg with similar frequencies to the diffuser 11.5 Hz (45 Pa), 25.1 Hz (13 Pa), and 47.7 Hz (5 Pa). Around 32 deg the broadband noise was observed across all frequencies, but especially at lower than abovementioned peaks. The broadband noise was also noticeable at very high valve openings.
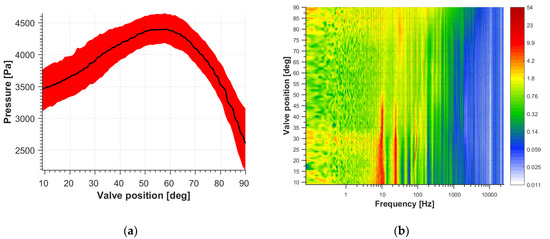
Figure 8.
Pressure variation depending on the valve position measured at the outlet at impeller rotational speed 95 Hz. (a) The left plot represents the min-to-max plot (red) and the pressure average value (black). (b) The right plot represents the spectral map with the colormap in the logarithmic scale.
Figure 9 gives the inlet pressure characteristics in the 95 Hz impeller speed. Figure 9a shows that the inlet suction zone was present at valve positions higher than 35 deg. The inlet pressure gradually increased with the valve closure (for decreasing valve positions). At 50 deg the pressure oscillation range increased drastically, then slightly decreased around 30 deg and maintained relatively constant with further valve closure (for decreasing valve positions). The pressure spectral map presented in Figure 9b indicates that this sudden increment was connected mainly with the frequency of 11.2 Hz (15 Pa) and the broadband noise. The noise appeared slightly earlier in the inlet than in the diffuser and the outlet. The moment of broadband noise appearance was also concurrent with the jump of the average pressure observed in Figure 9a (39 deg).
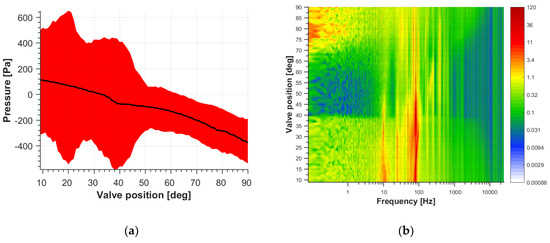
Figure 9.
Pressure variation depending on the valve position measured at the inlet at impeller rotational speed 95 Hz. (a) The left plot represents the min-to-max plot (red) and the pressure average value (black). (b) The right plot represents the spectral map with the colormap in the logarithmic scale.
3.5. 0.44 Nominal Speed (110 Hz)
Figure 10 presents pressure variation measured in the diffuser at the impeller rotational velocity of 110 Hz as a function of the valve position given in degrees. The influence of the compressor performance curve is also visible in this case in Figure 10a.
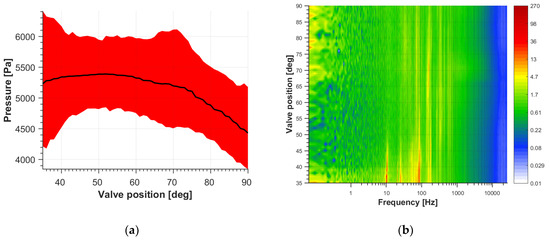
Figure 10.
Pressure variation depending on the valve position measured at the diffuser at impeller rotational speed 110 Hz. (a) The left plot represents the min-to-max plot (red) and the pressure average value (black). (b) The right plot represents the spectral map with the colormap in the logarithmic scale.
This time the experiment was stopped much earlier, at 35 deg due to large pressure oscillations and danger for further operation of the machine. The maximum pressure rise was attained around 50 deg. The range of pressure oscillation increased slightly around 65–75 deg and then returned to normal size. The second increment was observed around 43 deg. Plot 10.b presents a spectral map of the same set of signals. At high valve openings, the spectrum maintained a similar shape. The only exception was observed around 65–75 deg, where the broadband noise was noticeable. The appearance of this structure was concurrent with an increment of the pressure oscillation range discussed in Figure 10a. Around 50 deg and at lower valve positions the new amplifications started to appear. The main dominating frequency was 10.3 Hz (276 Pa). Weaker, but also noticeable peaks were observed at 25.5 Hz (21 Pa) and 85.8 Hz (28 Pa). It is not clear whether the broadband noise was present in this case, but small amplification was observed at all frequencies just before stopping the experiment.
Figure 11 presents the same set of plots registered at 110 Hz at the outlet pressure gauge. Figure 11a again reproduced the shape of the impeller performance curve in a very clear manner. The maximum pressure rise was observed between 60 deg and 50 deg. Then, at lower valve positions the pressure continued to decrease. The range of pressure fluctuation was increasing at a much bigger rate than in all previous cases. Instability started to rise around 45 deg and the experiment was stopped when it approached 2.5 kPa. The spectral map is presented in Figure 11b. The pressure peaks started to appear at valve positions smaller than 50 deg with similar frequencies to the diffuser. The main peak had a frequency of 10.3 Hz (535 Pa). Smaller peaks were also observed at frequencies 25.5 Hz (27 Pa) and 49.8 Hz (5 Pa).
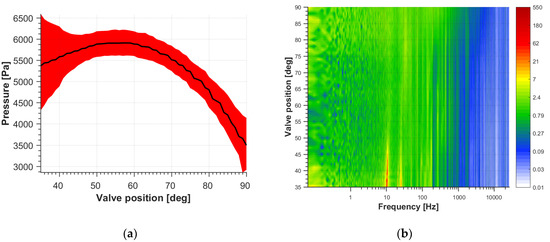
Figure 11.
Pressure variation depending on the valve position measured at the outlet at impeller rotational speed 110 Hz. (a) The left plot represents the min-to-max plot (red) and the pressure average value (black). (b) The right plot represents the spectral map with the colormap in the logarithmic scale.
Figure 12 gives the inlet pressure characteristics at the 110 Hz impeller speed. Figure 12a shows that the inlet suction zone was present at all analyzed valve positions. The inlet pressure gradually increased with the valve closure (for decreasing valve position). At 45 deg the pressure oscillation range increased. At 41 deg the average pressure started rising at a higher pace. The pressure spectral map presented in Figure 12b indicates that at low valve positions all frequencies mentioned before are visible with moderate amplitudes. The broadband noise had a noticeable onset at 41 deg. The moment of broadband noise appearance was concurrent with the jump of the average pressure observed in Figure 12a.
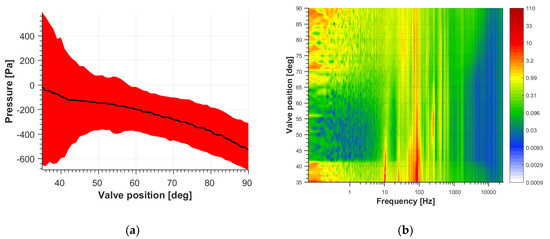
Figure 12.
Pressure variation depending on the valve position measured at the diffuser at inlet rotational speed 110 Hz. (a) The left plot represents the min-to-max plot (red) and the pressure average value (black). (b) The right plot represents the spectral map with the colormap in the logarithmic scale.
3.6. 0.48 Nominal Speed (120 Hz)
Figure 13 presents pressure variation measured in the diffuser at the impeller rotational velocity of 120 Hz in function of the valve position given in degrees. The influence of the compressor performance curve is present. This time the experiment was stopped at 40 deg due to large pressure oscillations and danger for further operation of the machine. The maximum pressure rise was attained around 50 deg. The range of pressure oscillation increased slightly around 65–75 deg and then returned to normal size. The second increment was observed around 49 deg. The plot 13.b presents a spectral map of the same set of signals. At high valve openings, the spectrum maintained a similar shape. The only exception was observed around 65–75 deg, where the broadband noise was noticeable. The appearance of this structure was concurrent with an increment of the pressure oscillation range discussed in Figure 13a. Around 50 deg and for smaller valve positions the new amplifications started to appear. The main dominating frequency was 10.4 Hz (347 Pa). Weaker, but also noticeable peaks were observed at 25.7 Hz (13 Pa) and 84.7 Hz (22 Pa).
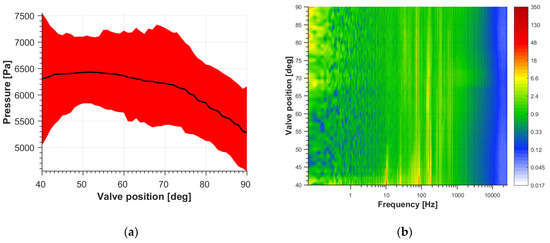
Figure 13.
Pressure variation depending on the valve position measured at the diffuser at diffuser rotational speed 120 Hz. (a) The left plot represents the min-to-max plot (red) and the pressure average value (black). (b) The right plot represents the spectral map with the colormap in the logarithmic scale.
Figure 14 presents the same set of plots registered at 120 Hz at the outlet pressure gauge. Figure 14a again reproduced the shape of the impeller performance curve in a very clear manner. The maximum pressure rise was observed around 55 deg. Then, at lower valve positions the pressure continued to decrease. The range of pressure fluctuation was increasing at a much bigger scale than in all previous cases. Instability started to rise around 45 deg and the experiment was stopped when it approached 2.5 kPa. The spectral map is presented in Figure 14b. The pressure peaks started to appear at valve positions lower than 50 deg with similar frequencies to the diffuser. The main peak had a frequency of 10.4 Hz (761 Pa). Smaller peaks were also observed at frequencies 25.7 Hz (16 Pa) and 52.0 Hz (6 Pa).
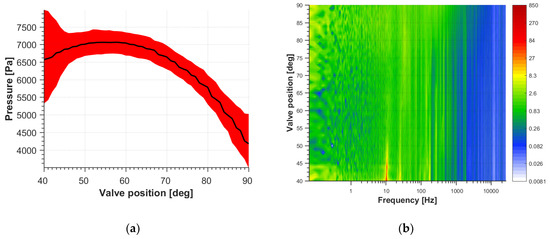
Figure 14.
Pressure variation depending on the valve position measured at the diffuser at outlet rotational speed 120 Hz. (a) The left plot represents the min-to-max plot (red) and the pressure average value (black). (b) The right plot represents the spectral map with the colormap in the logarithmic scale.
Figure 15 gives the inlet pressure characteristics in the 120 Hz impeller speed. Figure 15a shows that the inlet suction zone was present at all analyzed valve positions.
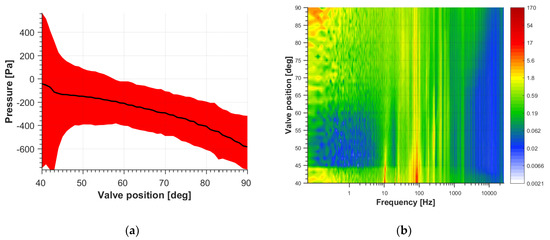
Figure 15.
Pressure variation depending on the valve position measured at the inlet at impeller rotational speed 120 Hz. (a) The left plot represents the min-to-max plot (red) and the pressure average value (black). (b) The right plot represents the spectral map with the colormap in the logarithmic scale.
The inlet pressure gradually increased with the valve closure (for decreasing valve positions). At 46 deg the pressure oscillation range increased. At 43 deg the average pressure started rising at a higher peace. The pressure spectral map presented in Figure 15b indicates that at low valve positions all frequencies mentioned before are visible with moderate amplitudes. The broadband noise has a noticeable onset at 44 deg. The moment of broadband noise appearance was concurrent with the jump of the average pressure observed in Figure 15a.
3.7. Discussion of Key Findings
In this subsection, the key findings regarding each identified structure are presented. The paragraphs are discussing the structures one by one following the division presented in Table 3. The first peak was appearing at frequencies between 10.3 Hz and 11.5 Hz. One could conclude that this was the surge phenomenon described by numerous researchers. This is confirmed by a global character of the instability, highest amplitude in the plenum (outlet), and low peak frequency [23,24]. The peak appeared in two different scenarios. At lower speeds (70 Hz and 95 Hz) the peak had a slightly higher frequency in the range 11.2–11.5 Hz. Its amplitude was quite small in the range 31–45 Pa. Then at higher impeller speeds the peak has shifted slightly towards lower frequency and stayed in the range 10.3–10.4 Hz. The amplitude was much higher and attained 535 Pa in 110 Hz and 761 Pa in 120 Hz. This value would be much higher at lower valve positions, but the experiments needed to be stopped for safety reasons. It was already observed that the surge might have a different character at different rotational speeds [31]. It is typically observed that the deep surge is preceded by a mild surge at high impeller rotational speeds which is not the case in lower ones [36]. The mild surge has, however, much different frequency than the deep surge. In this case, the difference in frequency is much smaller, about 10%. Hence it should be expected that this is the same type of surge. Hence, the frequency creeping with rotational speed was observed in this case, similarly to observations made in a different type of the compressor [37]. At lower rotational velocities the amount of energy generated in the impeller was not sufficient to feed the outer volume to start the surge oscillations. This explains why the amplitude was different and the experiment could be conducted down to the lowest valve position of 10 deg.
Second and the third peaks are characterized by a much higher frequency and cannot be directly associated with the surge phenomenon or its harmonic frequencies. The second peak frequency varied between 2.18 and 2.48 of the surge frequency. The third peak frequency varied between 4.15 and 5.0 of the surge frequency. In all cases its amplitude was very low, hence this phenomenon should not be considered as significant. The amplitude was even not amplified in the 120 Hz case, where the third peak was precisely the 5th harmonic of the surge frequency. Both peaks attained the highest amplitudes in the outlet. This suggests that those oscillations might be associated with the pipeline dynamics that were confirmed to be responsible for the addition of higher frequency terms to the main surge oscillations [7,38]. Frequencies are amplified if they are close to the resonant frequency of the sections of the piping system. This effect is also known to influence the position of the surge margin [39].
The fourth and fifth peaks are very close to each other, hence distinguishing them was sometimes not possible and they are treated as a single structure in this analysis. In certain positions, however, two peaks were distinguishable in very close positions. The first of them was around 82 Hz, second around 85 Hz. In each case, the highest peak amplitude was observed in the diffuser which suggests that this instability is originating in this region. The peak was also observed in the inlet and two cases in the outlet. In the outlet, its amplitude was much decreasing after the surge onset. The location and frequency of this instability are in line with the typical behaviour of the rotating stall [16]. Bianchini et al. observed that the surge was preceded by the vaneless diffuser rotating stall. As the flow rate was decreasing the rotating stall pattern was first replaced by a new and more intense rotating phenomenon, coupled with the onset of multiple frequencies typical of the surge conditions. Then the transverse diffuser instability became dominated by the surge [40].
If that is also the case in this machine, the changing relation of this frequency to the impeller speed should be discussed. The frequency of this structure is not changing much with the impeller rotational speed. Kang and Kang noted that the impeller frequency participates in the stalling process [28]. It is also possible for the number of stall cells to vary with change in rotational speed [16]. At two lower rotational speeds, one could observe an interesting behaviour of this peak (Figure 4 and Figure 7). First, it appears much before the surge peak (around 50 deg). At 35 deg the peak bifurcates and tends to move towards lower frequencies as the valve continues to close. This was especially observed in Figure 4. Such behavior might be associated with changes in the rotating stall cell size, speed, or even change in the number of cells [41]. This phenomenon was less pronounced at 95 Hz and could not be observed at higher frequencies as the experiment had to be stopped before entering the bifurcation region. It has to be outlined that the root of the abovementioned observations regarding the peak 82–85 Hz is not confirmed. This instability presents very interesting features and should be analyzed with different numerical experimental methods to provide a better understanding. The experiment should include at least two signals positioned at an angular spacing between 0° and 60°, or more pairs of points to assure correct stall recognition with larger number of lobes [42].
At all impeller rotational velocities, the broadband noise was also observed. A similar situation was present in a study conducted with spectral maps on different centrifugal compressors [14]. The inlet recirculation for the described impeller was also obtained in the numerical study [34]. The numerical analysis explained the pressure signature of the rotating stall. The average pressure increases due to recirculating flow coming from the impeller blades. The radial thickness of this structure is, however, varying in time in a not periodic manner [35]. Therefore, the spectral map reveals it as a broadband noise. Those two features were also observed in this study on the inlet recirculation onset (Figure 6, Figure 9, Figure 12 and Figure 15):
- Increased average static pressure and temperature recorded upstream of the impeller inlet [21,22];
- Broadband noise observed in the spectral structure of the static pressure recorded upstream of the impeller inlet [14,34,35];
The inlet recirculation was gaining increasing attention in recent years. Originally this phenomenon was believed to appear mainly in the pumps and low specific speed machines [43]. Recent studies also reveal that this structure is present in turbochargers [21,22]. The inlet zone is then a good point for early instability detection as it is likely for the global instability to be initiated in this region [12,13,19,24,31].
There are also many studies where the inlet recirculation device or casing treatment is introduced to extend the machine working range [44,45]. Such a construction provides the channel for recirculating flow reducing the disturbance to the core flow. This kind of solution shifts the surge margin by the cost of lower efficiency at optimum working conditions [46]. The certain cases the efficiency can be also higher due to better impeller-diffuser synergy [47]. The casing treatment reduces the impeller exit blockage and increases the incidence at the diffuser inlet, and thus leads to a more positive slope in the case of a vaned diffuser performance curve [20]. Casing treatment allows also to easily measure the amount of recirculating flow [48] or even to design the anti-surge system induced by the appearance of the inlet recirculation [49]. In geometries without casing treatment, direct measurement of the recirculating flow is not easy to be performed, and also not error-free. Therefore, the detection of broadband noise and increased static pressure in the recirculation zone is the most efficient approach.
This study shows that the inlet instability occurs also in the closed-type industrial impellers. Another finding of this study is that the inlet recirculation onset time depends on the impeller rotational speed. It appeared at the valve position of 44 deg in the case of 120 Hz impeller speed, while 41 deg in the case of 110 Hz, 39 deg in the case of 95 Hz, 37 in the case of 70 Hz. The phenomenon is therefore a good indicator of the incoming instability growth because: it appears at the early stages of the instability growth, is easy to distinguish, is being reported in an increasing number of impeller types.
4. Concluding Remarks
In this study, a set of measurements was conducted on the industrial impeller working at four different rotational speeds lower than the design speed (70, 95, 110 and 120 Hz). The study was conducted at three measurement points and a full set of valve positions from fully open to unstable working conditions where the machine operation was still safe. The results revealed changes in unstable flow structures across impeller rotational speeds.
- The surge peak was observed in all cases, while in the lowest rotational speeds it appeared much later (75 Hz and 90 Hz). In higher speeds, the amount of energy accumulated in the plenum was sufficient to start the surge oscillations much earlier (110 Hz, 120 Hz). The effect of frequency creeping with impeller rotational speed was observed and the surge frequency changed by about 10% from 120 Hz to 70 Hz.
- Higher frequency peaks appeared in all impeller rotational speeds with much smaller amplitudes than the surge peak. The second peak was observed in the outlet and diffuser between 25.1 Hz and 25.7 Hz with amplitude growing with the impeller rotational speed. The third peak was observed in the outlet between 47.7 Hz and 52.0 Hz. The frequency was growing with the impeller rotational speed, but the amplitude was very weak in all cases. The source of this instability was in the outlet region.
- The fourth and fifth peaks were observed around 82–86 Hz. Distinguishing them was sometimes not possible and they were treated as a single structure in this analysis. The source of this peak was located in the diffuser. This peak was appearing much before the surge and presented an interesting feature of bifurcating with the valve position. The structure presented features typical of the rotating stall, but there is no proof that it represents this structure.
- In all cases, inlet recirculation was observed. This phenomenon is gaining increasing attention recently for different kinds of centrifugal compressors and turbochargers. This study shows that it is possible to observe it in the closed-type impellers. The phenomenon was also shown to appear earlier in higher impeller rotational speeds. This phenomenon has important features that make it very useful for early instability detection systems: it always appears before the surge, it is relatively clear to distinguish from other flow phenomena, its presence has been noted in various impeller types.
This study allowed to analyse the behaviour of the surge and another unstable flow structures observed in centrifugal compressor with changing rotational speeds. Further research would be required to understand the physics behind observations included herein. Particularly, the behaviour of 82 Hz and 86 Hz peak needs further attention, as well as the inlet recirculation. This could be addressed by the numerical simulation or another experimental studies. Similar studies conducted on different impeller geometries would be also very valuable as a reference.
Author Contributions
Conceptualization, G.L. and W.K.; Data curation, K.K., A.J. and F.G.; Formal analysis, K.K., A.J., F.G., M.K., M.S. and W.K.; Funding acquisition, G.L.; Investigation, K.K., A.J., F.G., M.K. and M.S.; Methodology, K.K., A.J., F.G., M.K. and M.S.; Project administration, G.L.; Resources, G.L.; Software, G.L. and A.J.; Supervision, G.L. and W.K.; Validation, K.K., A.J., F.G., M.K., M.S. and W.K.; Writing – original draft, G.L.; Writing – review & editing, K.K., A.J., F.G., M.K., M.S. and W.K. All authors have read and agreed to the published version of the manuscript.
Funding
This research was funded by National Centre for Research and Development in Poland grant number LIDER/447/L6/NCBR/2015.
Conflicts of Interest
The authors declare no conflict of interest.
References
- Bloch, H. A Practical Guide to Compressor Technology; Wiley-Interscience: Hoboken, NJ, USA, 2006; p. 560. [Google Scholar]
- Leufvén, O.; Eriksson, L. A surge and choke capable compressor flow model—Validation and extrapolation capability. Control Eng. Pract 2013, 21, 1871–1883. [Google Scholar] [CrossRef][Green Version]
- Gravdah, J.T.l.; Egeland, O. Compressor Surge and Rotating Stall: Modeling and Control; Springer Publishing Company: New York, NY, USA, 2011. [Google Scholar]
- Emmons, H.W.; Pearson, C.E.; Grant, H.P. Compressor Surge and Stall Propagation. ASME Trans. 1955, 77, 455–469. [Google Scholar]
- Greitzer, E. Surge and rotating stall in axial flow compressors—Part I: Theoretical compression system model. J. Eng. Gas Turbines Power 1976, 98, 190–198. [Google Scholar] [CrossRef]
- Greitzer, E. Surge and rotating stall in axial flow compressors—Part II: experimental results and comparison with theory. J. Eng. Gas Turbines Power 1976, 98, 199–211. [Google Scholar] [CrossRef]
- Yoon, S.Y.; Lin, Z.; Goyne, C.; Allaire, P.E. An enhanced Greitzer compressor model with pipeline dynamics included. In Proceedings of the 2011 American Control Conference, San Francisco, CA, USA, 29 June–1 July 2011; pp. 4731–4736. [Google Scholar] [CrossRef]
- He, X.; Zheng, X. Flow instability evolution in high pressure ratio centrifugal compressor with vaned diffuser. Exp. Therm. Fluid Sci. 2018, 98, 719–730. [Google Scholar] [CrossRef]
- Guo, S.; Chen, H.; Zhu, X.; Du, Z. Numerical Simulation of Surge in Turbocharger Centrifugal Compressor: Influences of Downstream Plenum. In Proceedings of the ASME 2011 Turbo Expo: Turbine Technical Conference and Exposition, Vancouver, British Columbia, Canada, 6–10 June 2011; pp. 1897–1908. [Google Scholar] [CrossRef]
- Galindo, J.; Tiseira, A.; Navarro, R.; Tarí, D.; Meano, C.M. Effect of the inlet geometry on performance, surge margin and noise emission of an automotive turbocharger compressor. Appl. Therm. Eng. 2017, 110, 875–882. [Google Scholar] [CrossRef]
- Kabalyk, K.; Jasek, M.; Liskiewicz, G.; Horodko, L. Experimental analysis of the influence of outlet network volume and inlet guide vane positioning on surge behavior in a single-stage low-speed centrifugal compressor. Proc. Inst. Mech. Eng. Part J. Power Energy 2018, 232. [Google Scholar] [CrossRef]
- Zheng, X.; Sun, Z.; Kawakubo, T.; Tamaki, H. Experimental investigation of surge and stall in a turbocharger centrifugal compressor with a vaned diffuser. Exp. Therm. Fluid Sci. 2017, 82, 493–506. [Google Scholar] [CrossRef]
- Semlitsch, B.; Mihăescu, M. Flow phenomena leading to surge in a centrifugal compressor. Energy 2016, 103, 572–587. [Google Scholar] [CrossRef]
- Liśkiewicz, G.; Horodko, L.; Stickland, M.; Kryłłowicz, W. Identification of phenomena preceding blower surge by means of pressure spectral maps. Exp. Therm. Fluid Sci. 2014, 54, 267–278. [Google Scholar] [CrossRef]
- Day, I.J. Stall, Surge, and 75 Years of Research. J. Turbomach. 2015, 138, 011001. [Google Scholar] [CrossRef]
- Frigne, P.; van den Braembussche, R. Distinction Between Different Types of Impeller and Diffuser Rotating Stall in a Centrifugal Compressor With Vaneless Diffuser. J. Eng. Gas Turbines Power 1984, 106, 468–474. [Google Scholar] [CrossRef]
- Biliotti, D.; Bianchini, A.; Vannini, G.; Belardini, E.; Giachi, M.; Tapinassi, L.; Ferrari, L.; Ferrara, G. Analysis of the Rotordynamic Response of a Centrifugal Compressor Subject to Aerodynamic Loads due to Rotating Stall. In Proceedings of the ASME Turbo Expo 2014: Turbine Technical Conference and Exposition, Düsseldorf, Germany, 16–20 June 2014. [Google Scholar]
- Oakes, W.; Lawless, P.B. A Characterization of Rotating Stall Behaviors in High and Low Speed Centrifugal Compressors. Int. Compress. Eng. Conf. 1998, 773–778. [Google Scholar]
- Mizuki, S.; Oosawa, Y. Unsteady Flow Within Centrifugal Compressor Channels Under Rotating Stall and Surge. J. Turbomach. 1992, 114, 312–320. [Google Scholar] [CrossRef]
- Sun, Z.; Wang, B.; Zheng, X.; Kawakubo, T.; Tamaki, H.; Numakura, R. Effect of bent inlet pipe on the flow instability behavior of centrifugal compressors. Chin. J. Aeronaut. 2020. [Google Scholar] [CrossRef]
- Harley, P.; Spence, S.; Filsinger, D.; Dietrich, M.; Early, J. Meanline Modelling of Inlet Recirculation in Automotive. In Proceedings of the ASME Turbo Expo 2014: Turbine Technical Conference and Exposition, Düsseldorf, Germany, 16–20 June 2014. [Google Scholar]
- Schreiber, C. Inlet Recirculation in Radial Compressors; University of Cambridge: Cambridge, UK, 2018. [Google Scholar]
- Liu, A.X.; Zheng, X.Q. Methods of surge point judgment for compressor experiments. Exp. Therm. Fluid Sci. 2013, 51, 204–213. [Google Scholar] [CrossRef]
- Tamaki, H. Experimental Study on Surge Inception in a Centrifugal Compressor. Int. J. Fluid Mach. Syst. 2009, 2, 409–417. [Google Scholar] [CrossRef][Green Version]
- Hagino, N.; Uda, K.; Kashiwabara, Y. Prediction and Active Control of Surge Inception of a Centrifugal Compressor. In Proceedings of the International Gas Turbine Congress, Toky, Japan, 2–7 November 2003. [Google Scholar]
- Brown, C.A.; Sawyer, S.; Oakes, W. Wavelet Based Analysis of Rotating Stall and Surge in a High Speed Centrifugal Compressor. In Proceedings of the 38th AIAA/ASME/SAE/ASEE Joint Propulsion Conference & Exhibit, Indianapolis, Indiana, 7–10 July 2002. [Google Scholar]
- Lawless, P.B.; Fleeter, S. Rotating Stall Acoustic Signature in a Low-Speed Centrifugal Compressor: Part 1—Vaneless Diffuser. J. Turbomach. 1995, 117, 87–96. [Google Scholar] [CrossRef]
- Kang, J.S.; Kang, S.H. Stall Inception in a High-Speed Centrifugal Compressor. In Proceedings of the ASME Turbo Expo 2001: Turbine Technical Conference and Exposition, New Orleans, LA, USA, 4–7 June 2001. [Google Scholar]
- Horodko, L. Identification of rotating pressure waves in a centrifugal compressor diffuser by means of the wavelet cross-correlation. Int. J. Wavelets Multiresolution Inf. Process. 2006, 4, 373–382. [Google Scholar] [CrossRef]
- Liśkiewicz, G.; Horodko, L. Time-frequency analysis of the Surge Onset in the Centrifugal Blower. Open Eng. 2015, 5, 299–306. [Google Scholar] [CrossRef]
- Sun, Z.; Zheng, X.; Kawakubo, T. Experimental investigation of instability inducement and mechanism of centrifugal compressors with vaned diffuser. Appl. Therm. Eng. 2018, 133, 464–471. [Google Scholar] [CrossRef]
- Galindo, J.; Climent, H.; Guardiola, C.; Tiseira, A. On the effect of pulsating flow on surge margin of small centrifugal compressors for automotive engines. Exp. Therm. Fluid Sci. 2009, 33, 1163–1171. [Google Scholar] [CrossRef]
- Bianchini, A.; Andreini, G.; Ferrari, L.; Rubino, D.T.; Ferrara, G. Development of a criterion for a robust identification of diffuser rotating stall onset in industrial centrifugal compressors. J. Eng. Gas Turbines Power 2018. [Google Scholar] [CrossRef]
- Liśkiewicz, G.; Sobczak, K.; Stickland, M.; Liśkiewicz, G. Numerical Study of Off-Design Centrifugal Compressor Operation and Flow Phenomena Preceding Surge. In Proceedings of the ASME Turbo Expo 2018: Turbine Technical Conference and Exposition, Oslo, Norway, 11–15 June 2018. [Google Scholar]
- Chmielecki, J.; Liśkiewicz, G.; Kryłłowicz, W. Numerical study of surge predecessors in centrifugal blower—inlet recirculation. Trans. Inst. Fluid Flow Mach. 2016, 136, 29–44. [Google Scholar]
- Zheng, X.; Liu, A. Phenomenon and Mechanism of Two-Regime-Surge in a Centrifugal Compressor. J. Turbomach. 2015, 137, 81007. [Google Scholar] [CrossRef]
- Yamaguchi, N. A Study on the Fundamental Surge Frequencies in Multi-Stage Axial Flow Compressor Systems. Int. J. Fluid Mach. Syst. 2014, 7, 160–173. [Google Scholar] [CrossRef]
- van Helvoirt, J.; de Jager, B. Dynamic model including piping acoustics of a centrifugal compression system. J. Sound Vib. 2007, 302, 361–378. [Google Scholar] [CrossRef]
- Brun, K.; Nored, M.G.; Kurz, R. Impact of Piping Impedance and Acoustic Characteristics on Centrifugal Compressor Surge and Operating Range. J. Eng. Gas Turbines Power 2014, 137, 032603. [Google Scholar] [CrossRef]
- Bianchini, A.; Biliotti, D.; Tommaso Rubino, D.; Ferrari, L.; Ferrara, G. Experimental Analysis of the Pressure Field Inside a Vaneless Diffuser From Rotating Stall Inception to Surge. J. Turbomach. 2015, 137, 111007. [Google Scholar] [CrossRef]
- Grapow, F.; Liśkiewicz, G. Three-Dimensional Vaneless Diffuser Rotating Stall Numerical Study. In Proceedings of the ASME Turbo Expo 2018: Turbine Technical Conference and Exposition, Oslo, Norway, 11–15 June 2018. [Google Scholar]
- Bianchini, A.; Biliotti, D.; Giachi, M.; Belardini, E.; Tapinassi, L.; Ferrari, L.; Ferrara, G. Some Guidelines for the Experimental Characterization of Vaneless Diffuser Rotating Stall in Stages of Industrial Centrifugal Compressors. In Proceedings of the ASME Turbo Expo 2014: Turbine Technical Conference and Exposition, Düsseldorf, Germany, 16–20 June 2014. [Google Scholar]
- Sen, M.; Breugelmans, F.A.E. Prerotation And Fluid Recirculation In The Suction Pipe Of Centrifugal Pumps. Available online: https://oaktrust.library.tamu.edu/handle/1969.1/163693 (accessed on 11 August 2020).
- Semlitsch, B.V.J.; Mihaescu, M.; Fuchs, L.; Gutmark, E.; Gancedo, M. Numerical Flow Analysis of a Centrifugal Compressor with Ported and without Ported Shroud. SAE Tech. Paper Ser. 2014. [Google Scholar] [CrossRef]
- Sundström, E.; Semlitsch, B.; Mihăescu, M. Acoustic signature of flow instabilities in radial compressors. J. Sound Vib. 2018, 434, 221–236. [Google Scholar] [CrossRef]
- Tamaki, H.; Zheng, X.; Zhang, Y. Experimental Investigation of High Pressure Ratio Centrifugal Compressor With Axisymmetric and Nonaxisymmetric Recirculation Device. J. Turbomach. 2013, 135. [Google Scholar] [CrossRef]
- He, X.; Zheng, X. Roles and mechanisms of casing treatment on different scales of flow instability in high pressure ratio centrifugal compressors. Aerosp. Sci. Technol. 2018. [Google Scholar] [CrossRef]
- Gancedo, M.; Gutmark, E.; Guillou, E. PIV measurements of the flow at the inlet of a turbocharger centrifugal compressor with recirculation casing treatment near the inducer. Exp. Fluids 2016, 57. [Google Scholar] [CrossRef]
- Mckee, R.J.; Carl, E.E. Method and Apparatus for Detecting the Occurrence of Surge in a Centrifugal Compressor. U.S. Patent No. 6,981,838, 3 January 2006. [Google Scholar]


© 2020 by the authors. Licensee MDPI, Basel, Switzerland. This article is an open access article distributed under the terms and conditions of the Creative Commons Attribution (CC BY) license (http://creativecommons.org/licenses/by/4.0/).