Article

Key Technologies and Economic Analysis of Decentralized Wind Power Consumption: A Case Study in B City, China

1
School of Management, China University of Mining & Technology (Beijing), Beijing 100083, China
2
Science and Technology Innovation Research Center, Collaborative Innovation Research Office, Beijing 100012, China
*
Authors to whom correspondence should be addressed.
Energies 2020, 13(16), 4147; https://doi.org/10.3390/en13164147
Submission received: 22 June 2020 / Revised: 29 July 2020 / Accepted: 7 August 2020 / Published: 11 August 2020
(This article belongs to the Section C: Energy Economics and Policy)

Abstract

:
Wind power technology is developing rapidly in China. Especially in the north of China, decentralized wind power (DWP) has developed rapidly. However, wind curtailment exceeds 4% of the gross generation, which has become an important obstacle restricting the development of DWP in 2019. Technical schemes are effective solutions to promote decentralized wind power consumption (DWPC). Moreover, there are few economic analyses of DWP projects with key technologies. This paper summarizes the typical technical schemes and analyzes the economy of a DWP grid-connected project with typical technical schemes by combining methods of the net present value (NPV) and real options (RO). It appears that the DWP project can be profitable with an NPV of about CNY 4.3721 million and an option value of CNY 16.6022 million in the case of a feed-in tariff of 0.34 CNY/kWh. Feed-in tariff and equipment investment costs are the most relevant parameters for economic feasibility according to the sensitivity analysis. Furthermore, 30.73 million kWh connects to the Mengxi grid each year. The project has an annual maximum CO2 emission reduction of about 31 thousand tons and an SO2 of about 0.1 thousand tons. In addition, it also realizes fine social benefits, including the support of local residents and the improvement of local new urbanization levels. Finally, this paper puts forward policy suggestions for the development of DWP mainly from an economic point of view.

Graphical Abstract

1. Introduction

With the rapid development of the global economy, environmental problems caused by the depletion of fossil energy are increasingly serious. According to the climate conference in Paris in 2015, China committed to the following action goal: by 2030, CO2 emissions per unit of GDP will be reduced by 60–65% compared with 2005 [1]. This requires carbon emissions per unit of GDP to fall faster each year in China.
In addition, it is necessary to change energy from traditional fossil energy to renewable energy. To begin with, the impact of fossil energy on the global climate and environment and the demand for resource recycling make energy transformation inevitable [2]. Secondly, renewable energy is not only the product of structural social ecological relationship, but also plays a key role in promoting the fairness and justice of society in the future [3]. Of course, energy transformation can effectively reduce CO2 emissions, environmental pollution and make stakeholders considerable economic benefits [4]. Moreover, the government has a vital impact on the process of energy transformation. On the one hand, governments have the responsibility to promote energy transformation and achieve sustainable development. On the other hand, the state pays more attention to multiple policy tools so as to give full play to the role of policy tools in social fairness and justice [3], and the implementation effect of mixing different policy tools is better than that of a single one [5]. Finally, the green financial investment provided by public sectors for energy transformation can make up the funding gap of renewable energy enterprises [6], and provide a reliable financial guarantee for the successful completion of energy transformation.
To realize the emission reduction and energy transformation, China has made much effort in policy-making. In 2017, China National Energy Administration and China National Development and Reform Commission published the “Energy Production and Consumption Revolution Strategy (2016–2030)”, which required that the proportion of non-fossil energy power generation to total power generation to reach 50% by 2030 [7]. In 2020, China Electricity Council published the “Analysis and Forecast Report on the National Power Supply and Demand Situation in 2019–2020”, which reported that China’s non-fossil energy power generation is 2.39 trillion kWh, accounting for only 32.6% among national power generation in 2019. Among them, grid-connected wind power is 405.9 billion kWh, accounting for only 17% of non-fossil energy power generation. Therefore, the development of wind power has become an important and urgent task. Decentralized wind power (DWP) avoids the disadvantages of centralized power generation. It has the characteristics of flexibility and efficiency, which have become a significant way to promote the development of wind power.
China has successfully promulgated policies to the development of DWP in recent years. The “Twelfth Five-Year Plan” for renewable energy development was issued by China National Energy Administration. It first proposed that the development of renewable energy should adhere to the development mode of renewable energy that focuses on centralized development, decentralized development, and distributed utilization. Under such circumstances, the government actively promoted the utilization of decentralized wind energy resources and began to explore the development and utilization of DWP. Then, China National Energy Administration published official documents four times. The first two times, No. 226 [8] (2011) and No. 374 [9] (2011), clarified the definition, access voltage levels, project scale, etc. of decentralized wind power projects, and also made strict regulations regarding project construction management, grid connection management, operation management, etc. In the last two times, No. 31 [10] (2017) and No. 3 [11] (2017), provinces were required to formulate the “Thirteenth Five-Year” DWP development plan, clarify that the DWP project was not limited by the annual guidance scale and encourage the spontaneous use of electricity and local consumption within the microgrid (MG). Since then, a series of policies and plans have been continuously improved, providing an institutional guarantee for promoting the development of DWP in China. By the end of 2019, the total installed capacity of wind power was 2.1 billion kilowatts in China, of which the cumulative installed capacity of onshore and offshore wind power was 2.04 billion kilowatts and 5.93 million kilowatts. Among them, the “Three North” area accounts for 70%. The total wind power generation capacity is 405.7 billion kWh with a year-on-year growth of 10.9% and an average utilization hour of 2082 h. Local governments have responded positively to the government policy. Shanxi plans to build 20 new DWP projects with a total capacity of 501 megawatts in Datong during 2017–2020. Hebei plans to develop 4.3 million kilowatts of decentralized access wind power in 2018–2020. Henan plans to build 2.169 million kilowatts of distributed wind power in the “Thirteenth Five-Year” Plan period. Distributed wind power has developed rapidly in China.
However, the increasing development of DWP is facing a serious wind curtailment problem. The reasons for wind curtailment are the randomness of wind energy resources, the irrationality of power supply structure, restriction of transmission and distribution lines, imbalance of power supply and demand, and defectiveness of national policies [12,13,14,15]. For national policies, China National Energy Administration issued instruments [16,17,18] emphasizing wind power clean heating, energy storage technology and electricity price subsidies to make full use of the advantages of DWPC nearby and increase the amount of on-grid electricity in 2016. In 2017, China National Energy Administration released important documents in terms of complementary multi-energy and electricity price subsidies. In the same year, China attached importance to DWP grid-connected technology [11]. The ways of large-scale wind power grid connection and consumption are discussed separately, and it is proposed that cross-regional transportation is one of the key solutions to wind curtailment [19]. It can be seen that China actively seeks power consumption solutions to alleviate wind curtailment. In 2019, China’s wind curtailment capacity was 16.9 billion kWh, with an average wind curtailment rate of 4% and a year-on-year decrease of 3%. However, some areas, such as Xinjiang, Gansu and Inner Mongolia, still have serious wind curtailment, with wind curtailment rates exceeding 5%. The total wind curtailment reached 13.6 billion kWh, accounting for 81% of wind curtailment in the country. Wind curtailment causes clean energy waste, which is not conducive to the realization of the Paris Congress action goals and China’s development plan.
It is worth studying the economy of DWP projects that can allay the wind curtailment problem. Most of the research discusses the reasons for the wind curtailment problem in China, methods to settle the problem and calculations of project costs [15,20]. Some literature optimizes the economic operation of the integrated energy system for wind power consumption [21], studies the economic dispatching schemes [22], and evaluates the national economy of the schemes [23]. Few papers aim to provide an economic analysis of DWPC with key technologies. Moreover, the construction of a wind power project should also consider social factors, including whether it is supported by local residents and the impact on the local ecological environment and new urbanization level. In view of the above background information, this paper summarized the typical technical paths to alleviate the wind curtailment problem. This paper presents a study of the economy of a DWP grid-connected project which can not only increase the proportion of renewable energy and alleviate the wind curtailment, but also obtain the support of local residents and improve the new urbanization level. A sensitivity analysis of factors affecting the economy of the DWP project was carried out. Based on the economy and sensitivity analysis, this paper put forward policy suggestions in terms of cost and price subsidies to implement a rapid and healthy development of DWP in China.
The rest of the paper is organized as follows: Section 2 overviews the key technical solutions; Section 3 explains the methodology and data management; Section 4 introduces the case study and presents and discusses the main findings; and the final conclusions are given in Section 5.

2. Overview of Key Technical Solutions

By analyzing the above policy notices, it can be found that China mainly reduces the wind curtailment rates from the three aspects of “source-network-load”. This article summarizes the key technologies of DWPC from the aspects of energy storage dispatch, transmission and distribution lines and load response.

2.1. Energy Storage Scheduling

The wind energy storage system makes full use of energy storage technology. It improves the certainty and predictability by storing surplus wind power or changing its existing form. At present, energy storage technology has become an indispensable part of renewable energy power generation. According to the different storage forms of electric energy conversion, they are generally divided into physical energy storage and chemical energy storage [24]. The energy storage battery, hydrogen energy storage in chemical energy storage and the heat storage electric boiler, pumped storage, and compressed air energy storage, which are parts of the physical energy storage, have a remarkable effect on improving the efficiency of wind power.

2.1.1. Energy Storage Battery

Energy storage batteries have the characteristics of small size, rapid response and easy use, and they have been broadly developed in renewable energy systems. However, problems such as high cost and serious environmental pollution restrict their further development [25]. Energy storage batteries are the main form of energy storage technology. Among them, lithium-ion batteries, all-vanadium flow batteries and lead–carbon batteries have high technology maturity and a wide range of applications [26]. The power generation capacity of the wind turbine generator cannot meet the power demand during the day. In this situation, the energy management system (EMS) transmits instructions to the power conversion system (PCS) to improve the power of the PCS system and supply power as a temporary power source. The power load is low at night, but is relatively surplus. The EMS system instructs the PCS system to store extra power in the energy storage battery to prepare for peak power consumption. At this time, the energy storage battery is in the charged state. The schematic diagram of the wind power energy storage battery system is shown in Figure 1 [27]. Through the process of charging and discharging energy storage batteries, it temporarily stores the electricity to reduce the waste of power during trough periods and increase the amount of DWPC on the grid. The solution of cost and environmental pollution is bound to make the battery energy storage technology more mature [28,29].
Daqing Wind Energy Storage Intelligent Power Generation Project in Heilongjiang Province is the first project in China to configure the energy storage system on the wind turbine generator side. The project has the lead-carbon battery with the best comprehensive cost and is equipped with the energy management system based on big data. The system selects accurately the optimal battery charging and discharging strategy in time, according to the power generation data and battery charging and discharging status, to improve electric power quality.

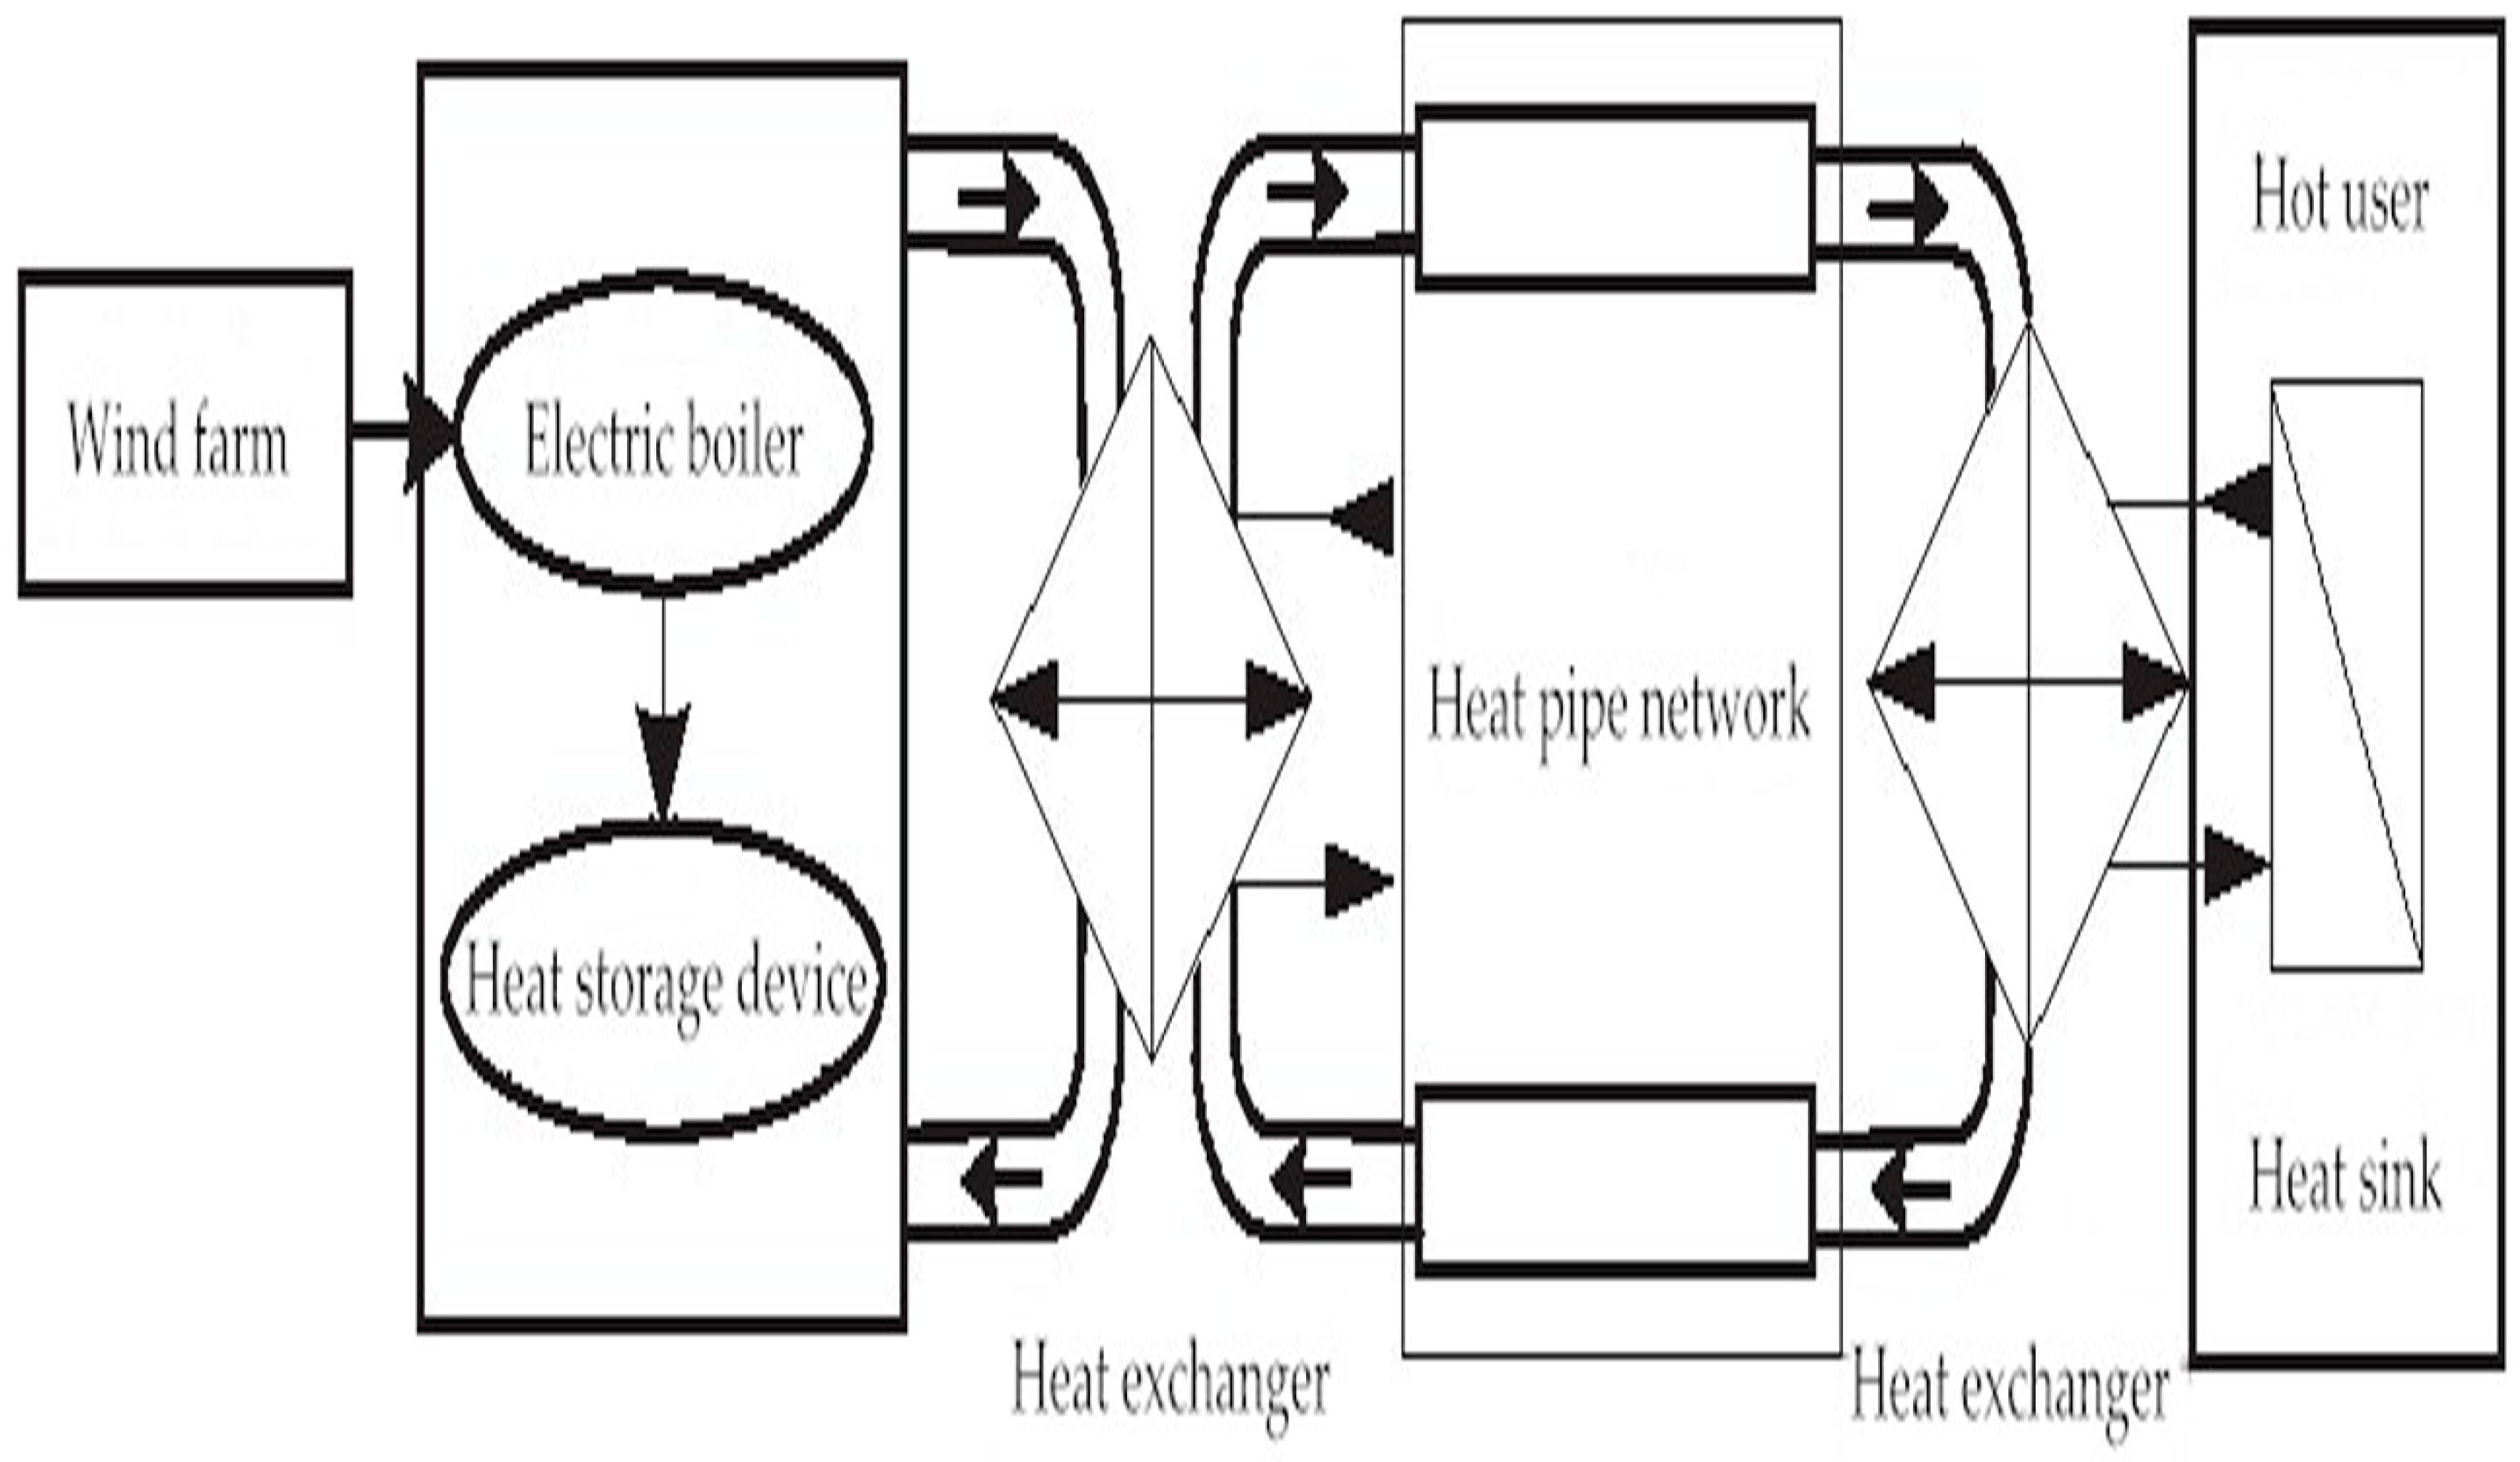
2.1.2. Electric Boiler Heat Storage

The solution of wind power combined with a regenerative electric boiler to solve the problem of DWPC has been widely examined by researchers. It includes the optimization of system operation scheduling [30,31], economic evaluation [32], and DWPC capacity evaluation [33,34]. This scheme has the advantages of the short construction period, mature technology, and a wide range of site selection. However, it has the disadvantages of low energy utilization efficiency and poor economy [35]. This scheme requires the installation of a large-scale heat storage device in a steam extraction thermal power plant and a heat storage tank generally using water as a heat storage medium [36,37]. After configuring the heat storage tank, the thermal power plant can replace part of the steam turbine with the heat storage tank to provide a part of the heat load during the nighttime when the wind power is severely superfluous, and then decreases the heating power of the steam turbine to provide space for the abandoned wind power. The heat stored in the heat storage tank can be obtained by increasing the heating power of the steam turbine during the non-abandoned wind period when the electricity load is large during the day.
Datang Taonan Wind Power Heating Project is a demonstration project of DWPC in China. The project was funded by Datang Xiangyang Wind Farm to build a thermal power station. A total of nine thermal storage electric boilers were built for heat storage. The designed heating area is 163,000 square meters, which provides 24 h heating for the residents of the community and serves more than 7000 people in Taonan City. Household heating plays a vital role in accelerating energy substitution and optimizing the energy structure, as shown in Figure 2 [38].

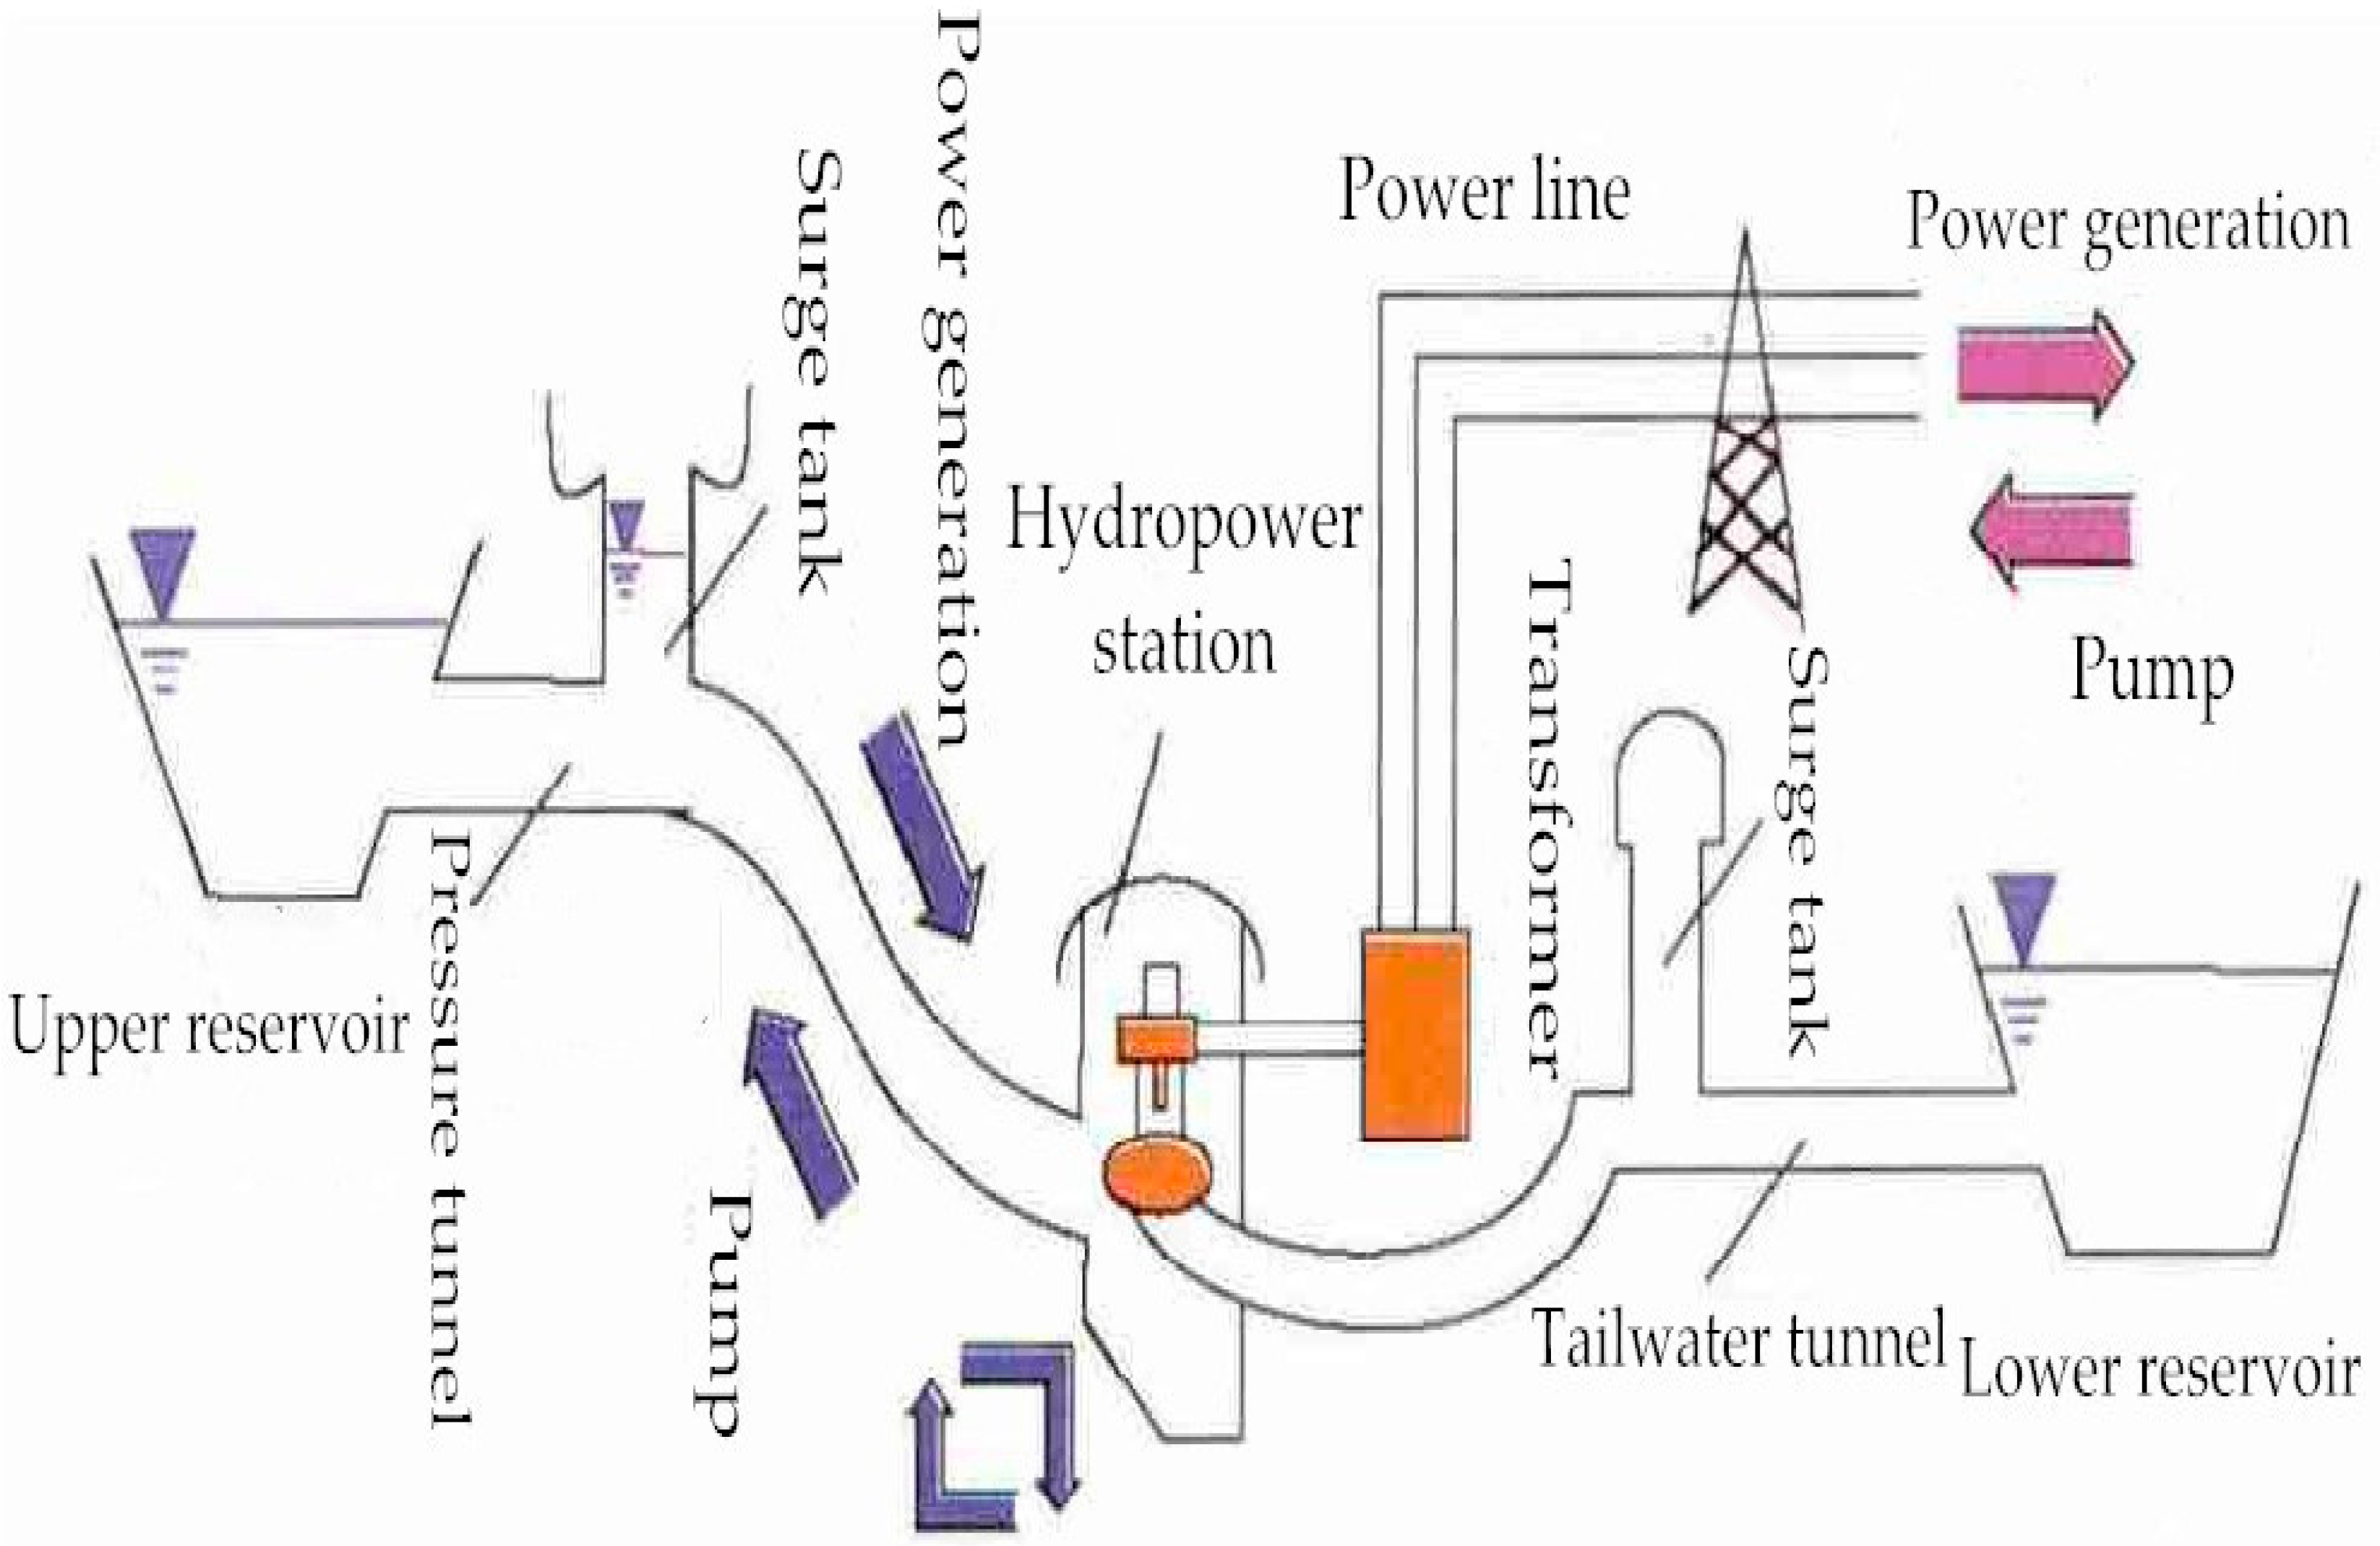
2.1.3. Pumped Storage

The pumped storage power station is composed of an upper reservoir, a lower reservoir, a water diversion system, a workshop, and a pumped storage unit [39]. The operation mechanism to absorb the abandoned wind is that the motor in the system uses the abandoned wind electricity to pump water, and the electricity is stored in the upper reservoir which exists in the form of water potential energy. When the power system is short of electricity, the turbine pulls the generator to convert the potential energy of the upper reservoir into usable electrical energy. It is fed into the neighboring power grid through the transformer by the load. It has the functions of peak adjustment, phase adjustment and accident standby for conventional hydro-power stations. It can also convert low and cheap electricity prices into peak electricity prices, ensuring stable, safe, and economic operation of the power system, as shown in Figure 3 [40]. Pumped storage technology has a better national economy in terms of peak shaving and wind power consumption [41]. In the past 10 years, there have also been relatively mature research results on the optimal scheduling of multi-energy complementary systems with pumped storage technology in China. However, considering factors such as high requirements for water resources and geographical topography [42], a long development cycle, large scale, and high cost, pumped storage technology has a limited chance of application in China.
Hunan Pingjiang Pumped Storage Power Station is equipped with four reversible pump-turbine generator sets, which can be connected to the Hunan Power Grid and jointly dispatched with wind and solar power in the western and northern regions. It can solve 1 billion kWh of wind curtailment annually with profitable economic and environmental benefits.

2.1.4. Compressed Air Energy Storage

Compressed air energy storage (CAES) is a technology that uses compressed air to achieve energy storage. It is a kind of energy storage technology with low investment risk and high maturity similar with pumped storage technology [26]. The system mainly includes compressors, expanders, heat exchangers, gas storage chambers, heat storages, heat medium supply sources, motors and generators. The structural diagram is shown in Figure 4 [43]. It has the advantages of a long service life, large capacity, low cost, and environmental protection [29]. However, there are also disadvantages, such as low energy storage efficiency and high dependence on geographical conditions. Among them, the non-heat source CAES is not sensitive to energy storage efficiency and is mainly used as a backup power source, which is suitable for application in the DWPC system. In the valley of electricity consumption, the air is compressed and stored in the air storage device so that the electrical energy is converted into the internal energy of the air. During the peak of electricity consumption, high-pressure air is released from the air storage device and then the turbine is driven to generate electricity. At present, China’s research on CAES mainly focuses on the theoretical stages, such as system optimization scheduling. Furthermore, there are few studies on DWPC. This technology remains in the stage of technical research and project demonstration. However, the energy storage advantage of CAES technology is significant with a growing amount of research on wind power consumption with increasing instability of new energy power generation. The “10 MW Advanced Compressed Air Energy Storage Technology Research and Development and Demonstration” project of the Institute of Thermo-physics of the Chinese Academy of Sciences and the Zhangjiakou “Comprehensive Energy Application Demonstration Project based on the 100 MW compressed air energy storage system” are currently in process.

2.2. Transmission and Distribution Lines

The inconsistency between the construction speed of transmission and distribution lines and the development speed of wind power is an important factor that hinders the absorption of wind power. China is mainly coordinating the development speed of medium and transmission lines and smart microgrids.

2.2.1. Cross-Regional Absorption
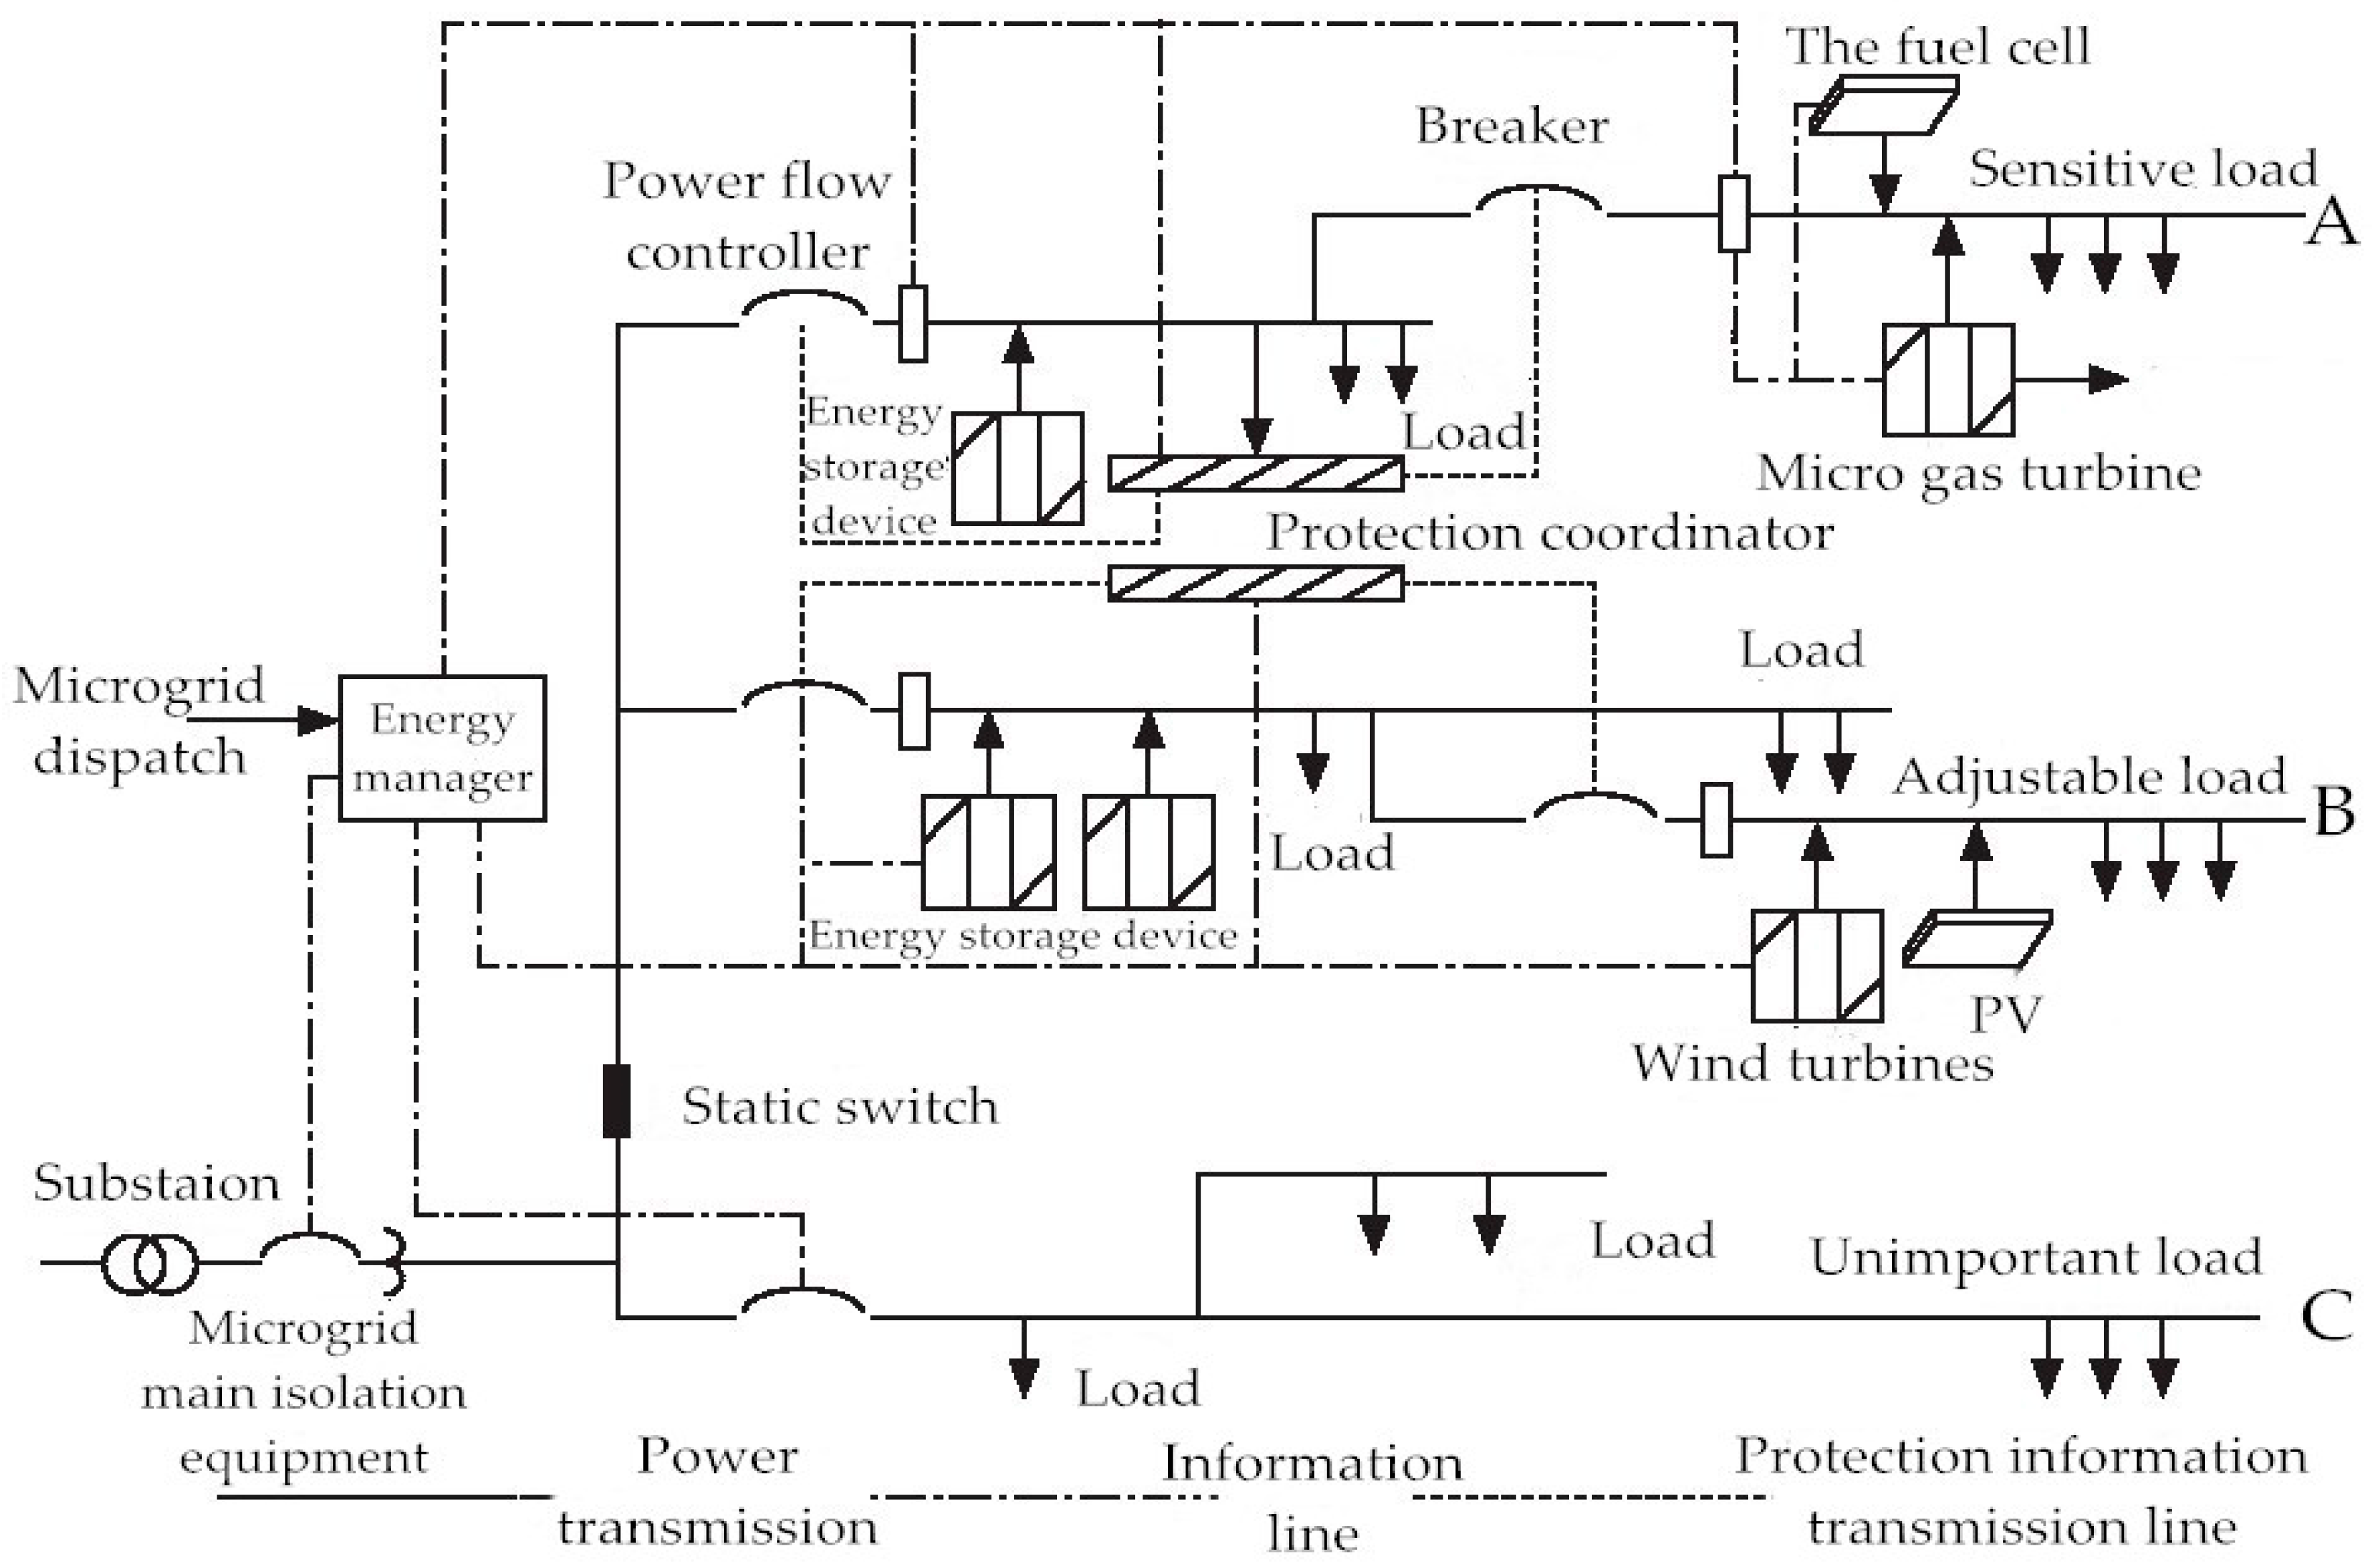
Improving the interconnection level of the power grid is one of the key measures to solve the new energy consumption [44]. Compared with intra-provincial consumption and inter-provincial consumption within the region, cross-regional elimination is the most economical and social benefit consumption method [45]. This is due to DWP being generally small in scale and the construction itself not in principle advocating new large-scale high-voltage transmission lines. Therefore, there are not many practical applications of cross-regional wind power allocation in China, and wind power consumption within the provinces and cities is the main focus. The sparsely populated provinces and autonomous regions in Xinjiang, Gansu, Inner Mongolia and other places mainly adopt the technical scheme of cross-regional power consumption. This solution mainly solves the problem of the uneven spatial distribution of power. The power in wind-rich areas is connected to the large power grid through transmission lines to meet the high load power demand in areas with scarce power resources. For example, the 20 MW distributed access wind power project in Yining County under construction in Xinjiang is connected to the Yining Industrial Park Substation, and the voltage level of the access substation is 110 kV. A 10 MW distributed wind power grid-connected project is located in Xinhure Sumu, Inner Mongolia. This project built 35 kV transmission lines, including an overhead line of about 5 km and a cable line of about 150 m. The wind power will be transmitted to Muren 110 kV substation and merged into the Mengxi Power Grid to solve the problem of power consumption in the Mengxi area.

2.2.2. Smart MG

Smart MG is a small-scale power generation and a distribution system composed of distributed power supply, an energy storage device, an energy conversion device, relevant compliances, a monitoring device, a protection device, feeder (A, B, C), and load, as shown in Figure 5 [46]. Any entity with an independent power infrastructure can operate the system, including two operation modes of grid connection and island operation with grid connection as the main mode. The operation principle of wind power consumption is that the MG will transfer the power generated by clean energy (mostly wind power and solar power [30]) to the large grid to increase the capacity of the large grid to accept power. When the power grid breaks down or the power quality cannot meet the requirements, the MG will cut off the power grid in time and enter the off-grid state quickly to ensure the stability of power consumption. This technical solution uses existing transmission lines to reduce investment in construction costs and is flexible, efficient, and environmentally friendly [47]. However, the current MG technology is still in the project demonstration stage with less commercial operation in China.
The Smart MG Project of the Lingang New Campus of Shanghai Electric Power University provides a total of 1.72 million kWh of clean electricity through intelligent control systems and rational use of wind and solar energy, and guarantees the daily hot water and electricity demand of teachers and students on campus. In addition, the smart MG pilot project of Daan Smart Energy Co., Ltd. in Dacheng City, Jilin Province and the smart microgrid project of Goldwind’s Beijing headquarters has played an active role in making the best of wind power, reducing power volatility and promoting sustainable economic and technological development.

2.3. Load Response

The main idea of load response is to increase the demand side power load and increase the power load actively, which is the main way to achieve wind power consumption. Typical schemes include electric vehicle charging stations and hydrogen storage.

2.3.1. Electric Vehicle Charging Station

With the electrification of the transportation industry and the development of the new energy vehicle industry, electric vehicles have been widely seen in residents’ daily lives. It is estimated that the number of electric vehicles will reach 1.2 billion by 2050 [48]. As the peak load regulation characteristics of wind power are consistent with the time shift in electric vehicles [49], a new electric vehicle charging station on the load side of electricity can be built, and a virtual power plant (VPP) with DWP can be formed [50]. Vehicle network (V2G) energy interaction technology is used to increase power demand and coordinate power supply and demand balance through intelligent system scheduling. When the electric vehicle is connected to the load side of the urban distribution network through the charging station, the electric vehicle charging station can quickly switch between the charging and discharging mode. The wind power is stored in the charging station through the load bus during periods of low power consumption at night. Electric vehicles will be charged for use during peak daytime electricity consumption. When the wind power is not enough to supplement the power grid, the electric vehicle charging station can reversely supplement the grid power to achieve a benign interaction between the vehicle and the grid. The time-sharing electricity price strategy is employed to charge and discharge electric vehicles [51], reduce the charging cost of users, improve the utilization rate of wind power and make the power supply system more stable and reliable, as shown in Figure 6 [50].
The Shouguang charging station project in Shandong Province constructs eight sets of 120 kw integrated direct current (DC) double gun charging piles to charge pure electric buses. The bus operation departure interval is 30 min. The maximum power of a single charging gun can complete the 60 kWh power supply, fully meeting the bus operation demand. The charging mode of “one pile and two charging guns” is adopted to realize the automatic distribution of the charging power of the two charging guns, improve the utilization rate of the equipment, and maximize the operation and charging demand of the pure electric bus.

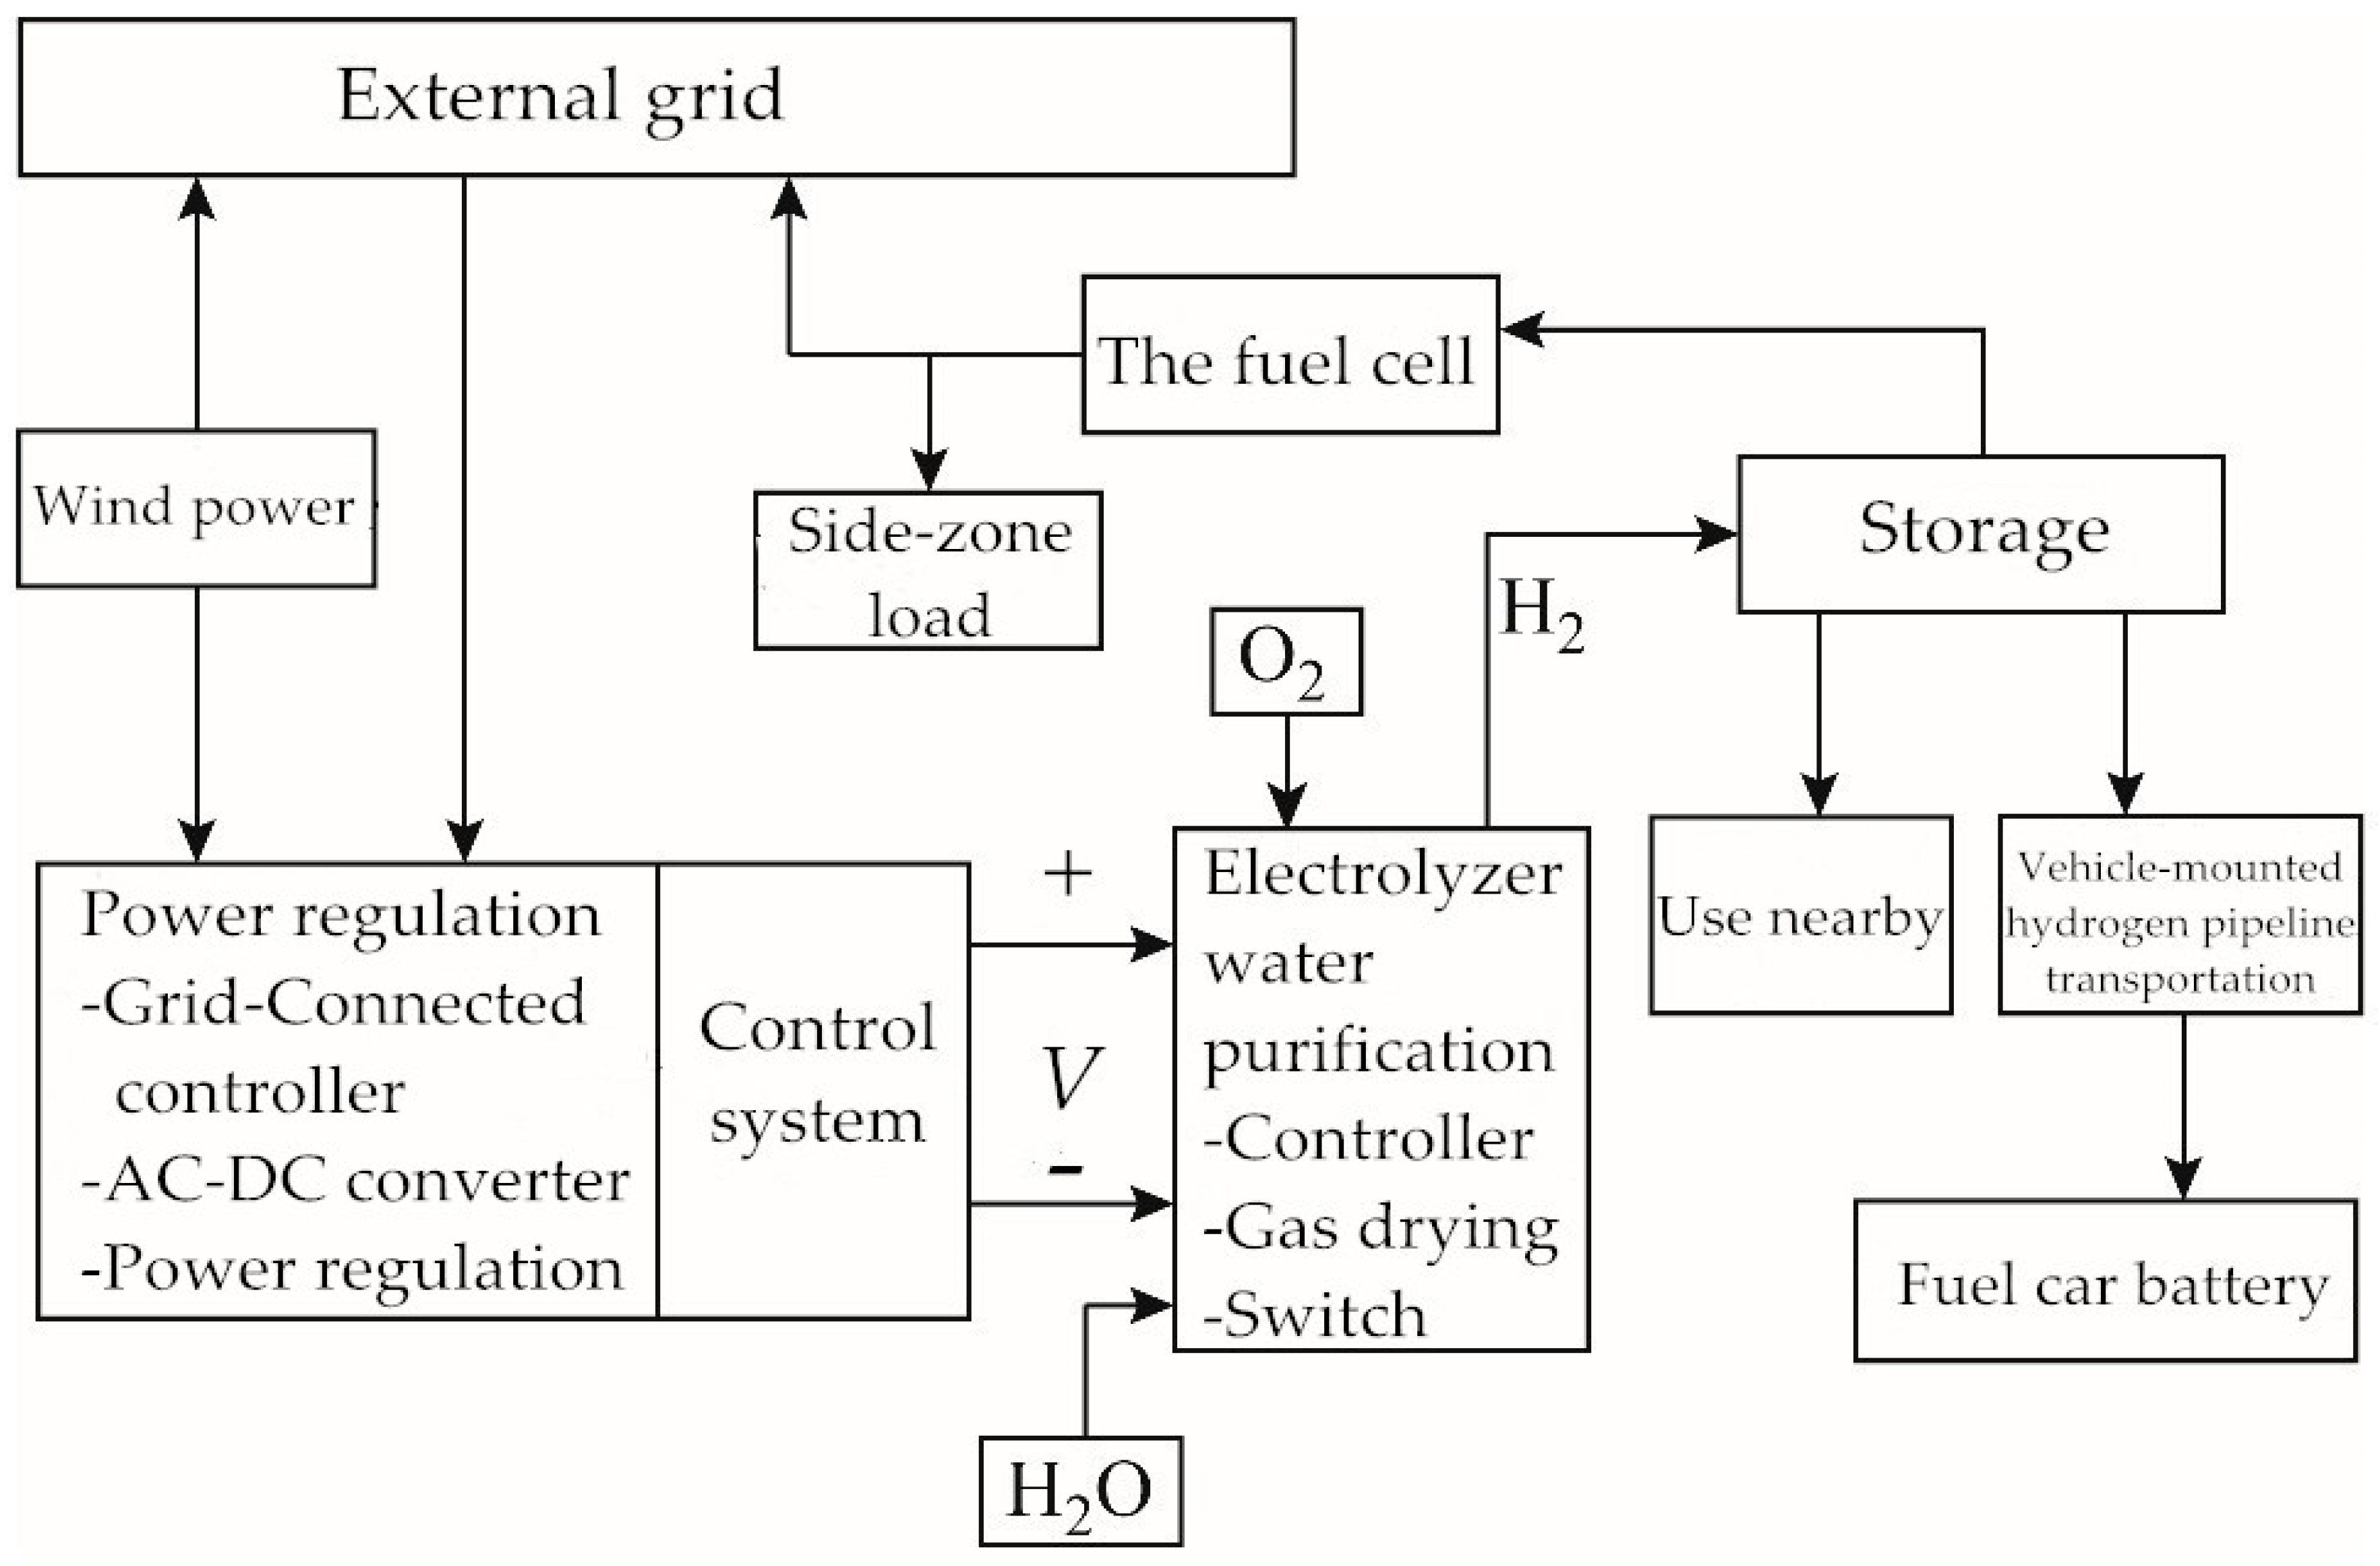
2.3.2. Hydrogen Production by Wind Power

The wind power hydrogen generation system mainly includes wind turbines, electrolytic water devices, fuel cell devices, hydrogen storage devices, compression devices, rectifiers, inverter devices, and control systems [24]. The structure diagram is shown in Figure 7 [52]. The idea of this system is that the electrical energy generated by the wind turbine flows into the grid through the transformer. After meeting the local electrical load demand, the excess wind power can input DC to the water electrolysis device through the rectifier to electrolyze water. Hydrogen produced by electrolytic water enters a hydrogen-cooling separator through a hydrogen outlet pipe for cooling and separation and is discharged to obtain high-purity hydrogen. The obtained hydrogen is injected into the hydrogen storage equipment through pipelines and compression devices. Some are directly supplied to nearby hydrogen-consuming enterprises such as industry and some transportation industries. The remaining hydrogen is used for fuel cell power generation. The technical research started late in China. In the past 5 years, there have been few research results and a single research mainly focused on coordinated scheduling [53,54,55]. Additionally, analyses of the economics of the system are small in number [56] and are not put into commercial operation [57]. There are a significant number of problems needed to be solved at present. However, as a clean energy source, hydrogen energy relies on environmental protection, high energy density, and high conversion efficiency, technology surrounding hydrogen production via wind power will be paid more and more attention.
The demonstration project of comprehensive utilization of wind power for hydrogen production in Zhangjiakou, Hebei Province can produce 17.52 million cubic meters of hydrogen per year, which can effectively solve the problem of large area wind abandonment in the Bashang area. It is the largest wind power hydrogen production project in the world and the first wind power hydrogen production project in China. In addition, Baicheng, Songyuan, and other places in Jilin Province carry out wind power hydrogen production projects as a means of wind power regulation and storage.

3. Methods and Data Management

3.1. Economic Analysis Methods

This paper uses the net present value (NPV) method and real options (RO) method to calculate the economy of the DWP project in order to reflect comprehensively the investment value of the project.

3.1.1. NPV Method

There are many methods to evaluate the project economy, such as the payback period method (PP), net present value method (NPV), net future value method (NFV), net present value effect method (UNPV) and internal rate of return method (IRR) [58]. This article will use the NPV, IRR and payback time (Pt) to analyze the technical economy of the wind power absorption system. The calculation formulas of each indicator are as follows:
  • The NPV mainly inspects the absolute value index of the project profitability. It reflects the present value of the excess profits that the project can obtain in addition to the profits that meet the requirements of the discount rate. The financial NPV of the project is greater than 0, indicating that the project is feasible and reaches or exceeds the profit level required by the discount rate.
    The NPV can be calculated as follows:
    N P V = t = 0 n ( C I C O ) ( 1 + i ) t
    where “CI” represents the annual income of the project in CNY 0.001 million, “CO” represents the annual expenditure of the project which includes static investment and dynamic investment in CNY 0.001 million, “i” represents the discount rate in percentage and “t” represents the operation period of the project in year.
  • The IRR refers to the discount rate that can make the accumulated present value of the net cash flow of the project in each year equal to zero in the whole calculation period. The IRR is therefore a measure of the financial risk and is used to evaluate the profitability of the investment. When the IRRi, the project is feasible. The project is not feasible in other situations. The calculation formula is:
    t = 0 n ( C I C O ) t ( 1 + I R R ) t = 0
  • The Pt refers to the time required to recover the project investment with the net income of the project, which is widely calculated by the dynamic investment recovery period. The shorter the investment payback time, the better the profitability and anti-risk ability of the project. The criterion of the investment payback time is the benchmark investment payback period, which can be determined according to the industry level or the requirements of investors. The formula is:
    t = 0 P t ( C I C O ) t ( 1 + i ) t = 0

3.1.2. RO Method

The concept of the real option comes from the financial option. The financial option is an agreement between the buyer and the seller, which promises the buyer an agreed price to buy or sell a certain number of products before or at a specified time without performing any obligation [59]. The option is actually a right of choice. The real options refer to options where products are physical assets. When wind power investment enterprises believe that investing in wind power can bring benefits, they will choose to invest in wind power projects. When the investment is postponed, the deferred option may bring about an increase in benefits. It is assumed that the value of the subject matter follows a standard normal distribution and investors can borrow or lend at risk-free rates. A fixed risk-free interest rate is also supposed. Assuming that the on-grid price conforms to the geometric Brownian motion, we use the classical Black-Scholes (B-S) option pricing model to calculate the option value, as shown in the formulas.
C = S N ( d 1 ) X e r T N ( d 2 )
d 1 = ln ( S X ) + ( r + σ 2 2 ) T σ T
d 2 = d 1 σ T
In which “S” is the spot price, “X” is the option execution price, “σ” is the future volatility of the subject matter, “T” is the term of the real option, “r” is the risk-free interest rate, “N(d1)” and “N(d2)” are the cumulative probability of standard normal distribution, and “C” is the real option value (ROV).

3.2. Data Management

The detailed steps for analyzing the economy of DWP projects by the NPV method and the RO method are as follows:
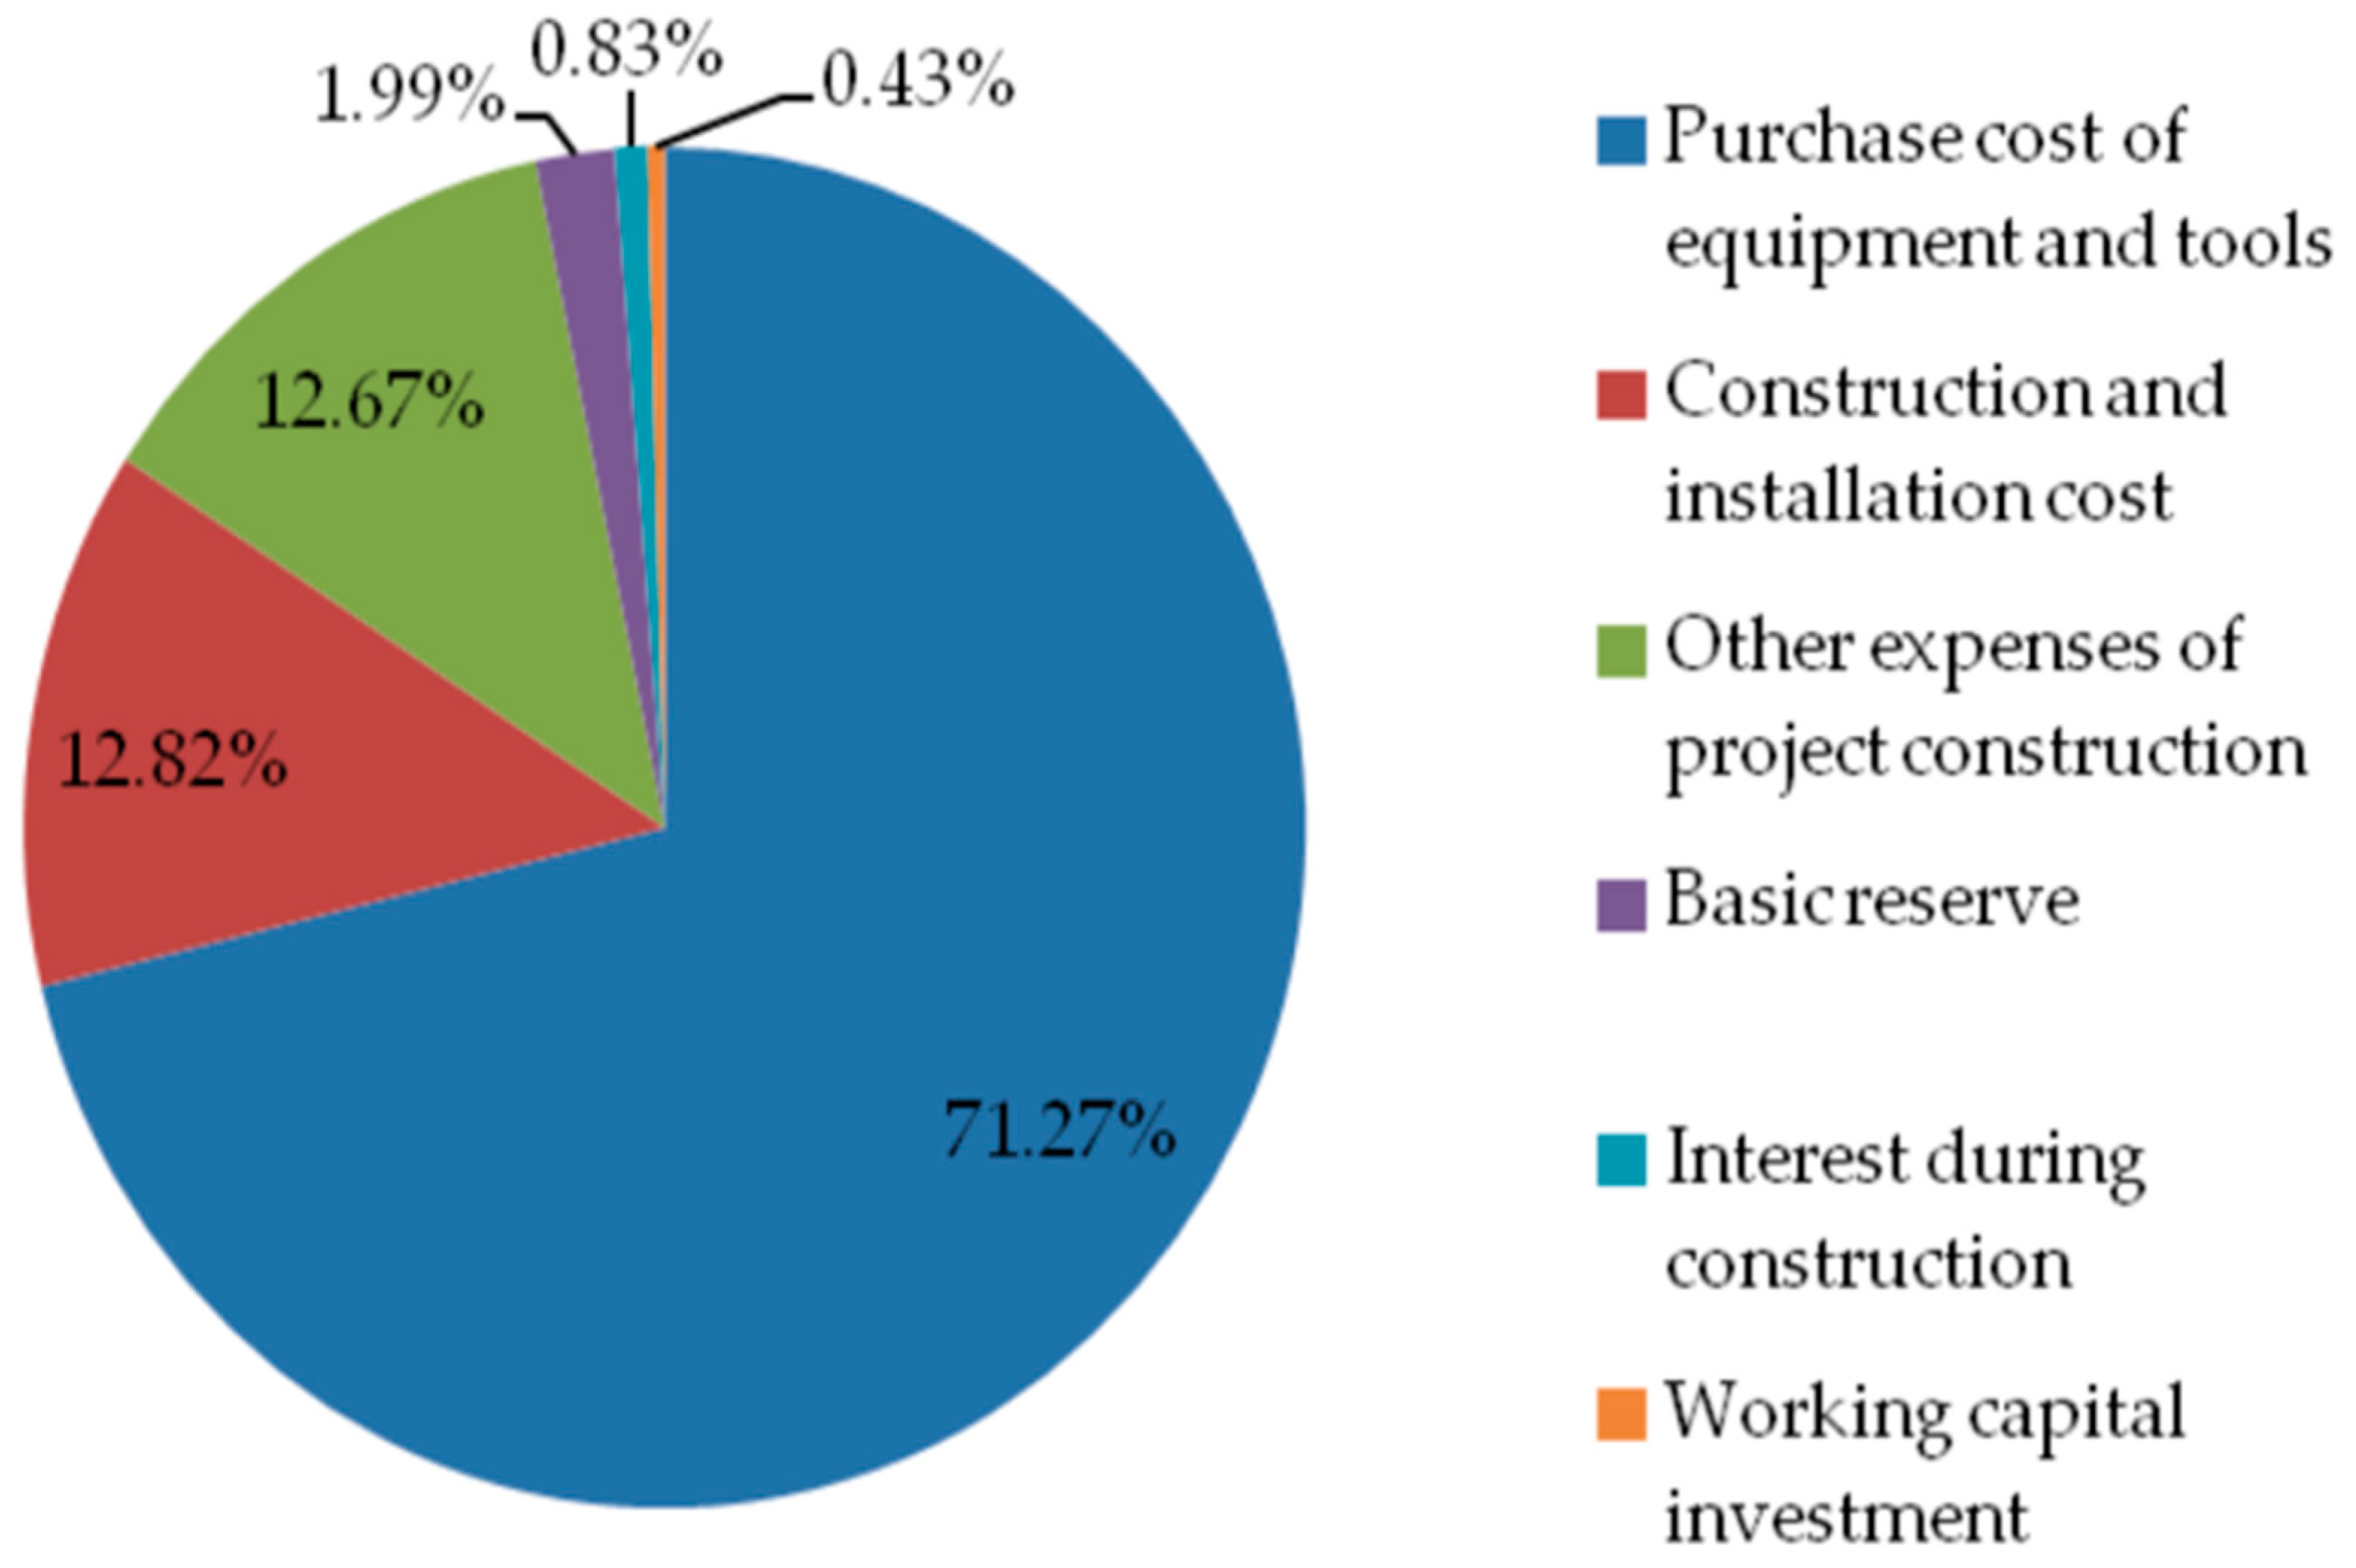
  • Step 1: Estimate the cost. Collect the cost indicators of wind power projects by using the estimation method. Estimate the project cost, other project construction costs, basic reserve funds, construction period interest and working capital investment by the cost quota method with reference to the feasibility study report, environmental assessment report and Code for Economic Evaluation of Wind Power Projects (NB/T 31085-2016).
  • Step 2: Calculate the income. The annual income of the project is calculated by multiplying the annual power generation or daily power generation that affects the income and that is officially released by the government where the wind power project is located by the local on-grid electricity price (including government subsidies) at that time. In addition, other subsidies given by the government should also be included in the annual income of the project, such as energy conservation and emission reduction income.
  • Step 3: Calculate the net income. Calculate the annual net income of the project by subtracting the estimated project cost from the project income calculated in the previous step.
  • Step 4: Set assumptions. It is assumed that the construction period of the project is 1 year and the operation period is 15 years. The loan during the construction period is CNY 13.2782 million. The service life of major fixed assets such as wind turbines is 15 years. The depreciation is carried out by the straight-line method and the residual value rate is 5% during the operation period.
  • Step 5: Calculate the NPV, IRR and Pt. The NPV, IRR and Pt can be solved by substituting the data into the formulae (1)–(3).
  • Step 6: Calculate the real option value (ROV). Bring the numerical value calculated in step 5 and relevant assumptions into the formulae (4)–(6).
  • Step 7: Economic analysis. Analyze the economy and feasibility of the project according to the NPV, IRR, Pt and ROV results.
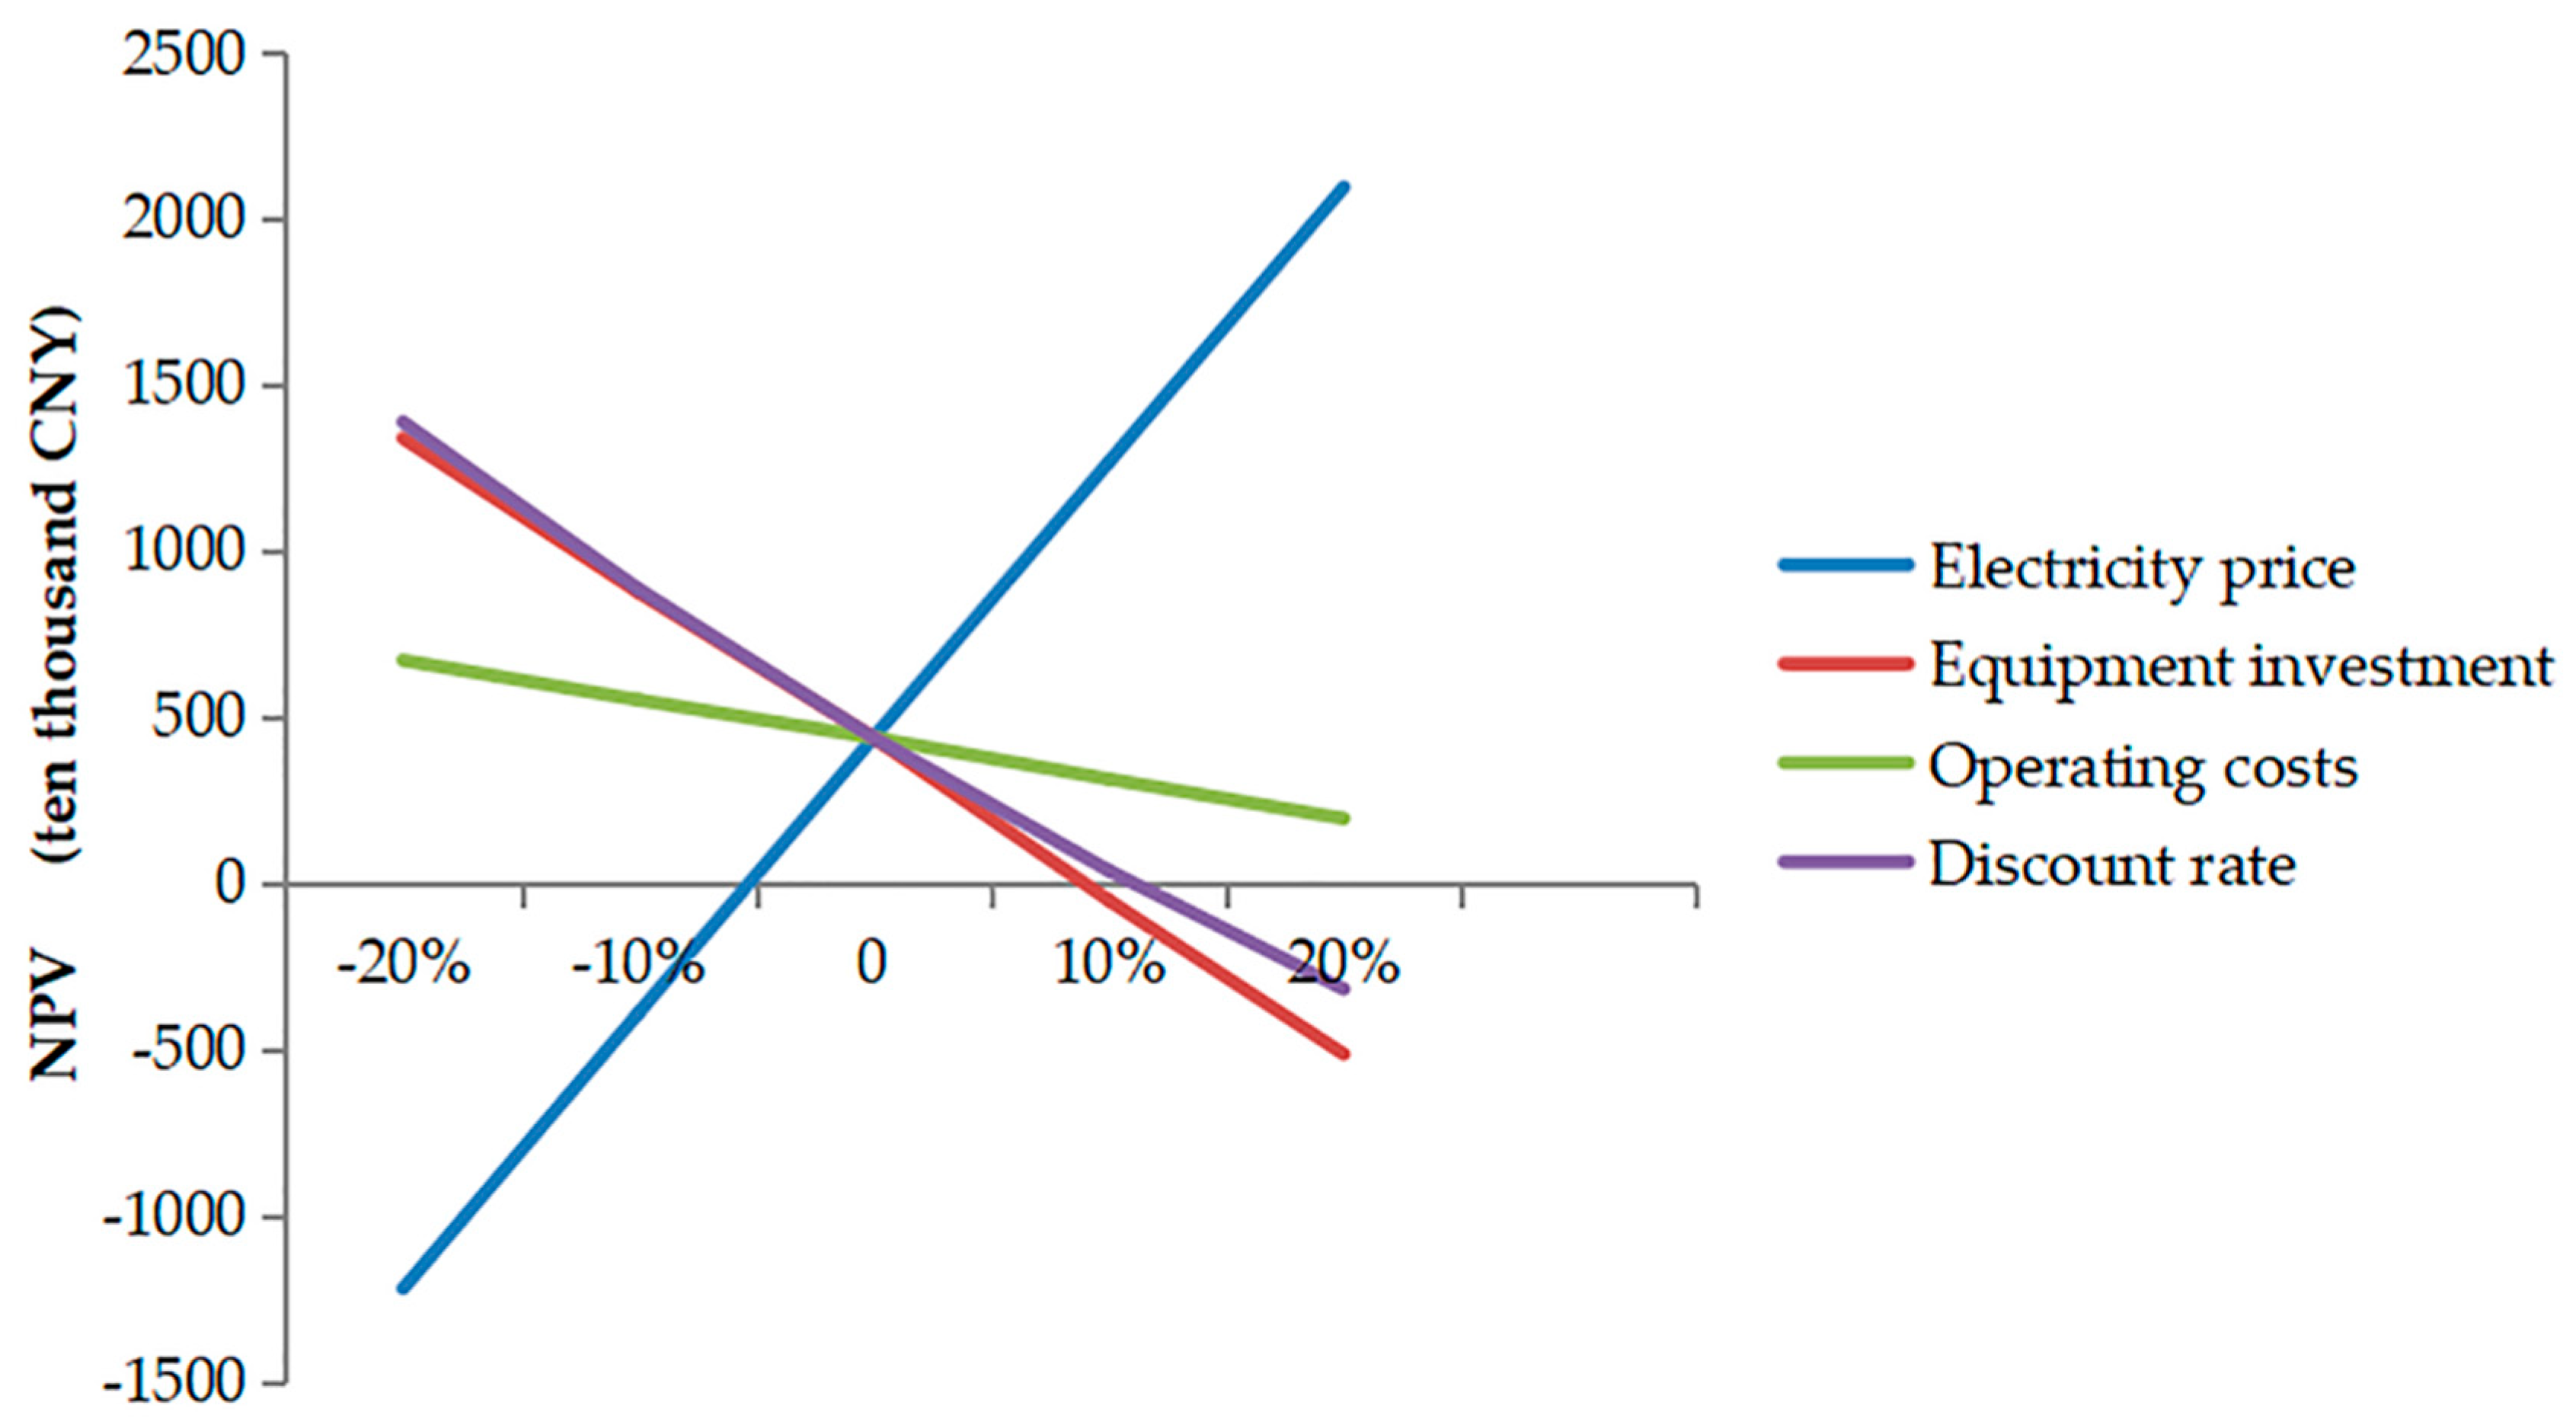
  • Step 8: Sensitivity analysis. Analyze the factors affecting the project economy, and conduct sensitivity analysis on the influence of the project investment cost, operating cost, on-grid electricity price and discount rate in order to make the project more economical.
The process of the steps of economic analysis is as shown in Figure 8.
The NPV method assumes that the cash flow can be realized and remains unchanged in the expected future. This method has the advantages of simple and easy operation. It has strong adaptability and generally meets the decision-making of mutually exclusive investment schemes with the same project life. However, the factors considered in this method are relatively simple, and they lack the management flexibility value brought to investors when the uncertain factors of the project change [60].
The RO method can make up for the deficiency of the NPV method. It is widely used in the power industry, which can actively manage the uncertainty of risks by flexibly considering uncertain factors such as market and industry competition. Moreover, the evaluation value of investment projects is closer to the actual value of projects [60]. This method is a quantitative analysis method that must be combined with qualitative analysis to reflect the enterprise value more comprehensively.

4. Case Analysis

In this article, a case study of a 10 MW distributed wind power grid-connected project in B City, Inner Mongolia Autonomous Region is made to provide a decision-making basis for a wind farm construction which can reduce wind curtailment.

4.1. Basic Overview

The 10 MW distributed wind power grid-connected project is part of the first batch of distributed wind power projects in Inner Mongolia during the “Thirteenth Five-Year” plan, which was invested in and newly built by Bayannur Nengde Wind Power Co., Ltd. The construction site of the project is in the northeast of B City—A resourceful city in wind resources and belongs to the class “I” of wind resource areas. A total of four wind turbines with a single unit capacity of 2.5 MW were installed and a new 35 kV transmission line with a line length of 5.5 km, including 5.35 km of overhead lines, 24 towers and 0.15 km of cable lines, was built. All the power generated is incorporated into the large power grid. The project, started on 20 October 2018, connected to the grid for the first time on 12 September 2019.
It is assumed that the loan for the construction period is CNY 13.2782 million with a one-year term loan. All engineering costs form fixed assets with a service life of 15 years. During the operation period, depreciation is accrued by the straight-line average method. The net residual value rate at the end of the period is 5%. The annual repair rate during the operation period is 1.2%. The annual insurance premium is 0.25% of the fixed assets. The material quota is 15 CNY/kW and the other expenses quota is 25 CNY/kW. The annual average wage of employees is CNY 80,000, the welfare coefficient is 50% and the quota is 2 people. The value added tax (VAT) rate is 3%. According to the data released by the Inner Mongolia Coal Trading Center, the price of electric coal was about 480 CNY/t in January 2020. The input tax of deductible fixed assets and reserve for the price difference is not considered for the project temporarily and the on-grid price is tax inclusive.
For wind power project investment enterprises, the discount rate has a great influence on the investment cost, which is second only to the power generation load coefficient and construction cost of projects. The discount rate of 5% is applicable when the investment environment is relatively stable and the default risk of investors is relatively low. The discount rate of 10% is applicable to investors who are faced with a great financial crisis, backward technology and a price disadvantage [61]. This paper assumes that the discount rate involved is 8% considering the average market interest rate at that time and the discount rate of similar items in this case study.

4.2. Economic Analysis

4.2.1. NPV Method Results and Analysis

Based on the above data and information, the summary investment estimate and economic benefit estimate of the project are calculated as shown in Table 1 and Table 2.
Taking this case as a sample, a net present value model estimates the three financial indicators of the project, namely, the net present value, internal rate of return, and the dynamic investment payback period. From the dynamic profitability index reflected in the cumulative net cash flow of the project in Figure 9, it can be seen intuitively that although the net cash flow of the project in the early stage is negative, the cumulative net cash flow is positive from the tenth year and presents year by year growth. The total investment for the development of the project is about CNY 70 million. The annual operating income is CNY 10.4482 million. From Table 3, the after-tax financial net present value, calculated as the sum of all the discounted yearly cash flows, is CNY 4.3721 million. The after-tax financial internal rate of return of 9% is higher than the benchmark rate of return of 8%. The after-tax dynamic investment recovery time is 9.04 years shorter than the project operation period of 15 years. In the long run, the economic benefits of the project are obvious. In terms of power consumption, 30.73 million kWh are connected to the grid every year. This effectively decreases the rate of wind power abandonment in the Mengxi area and realizes the full utilization of wind energy resources. Based on the above analysis, the project is economically feasible.

4.2.2. RO Method Results and Analysis

After calculation, the S is CNY 85.4318 million, the X is CNY 81.0597 million and the σ is tentatively set at 12.5%, and remains unchanged every year. The T is 2 years and the r is 4.35% according to the one-year lending rate of the central bank in 2019. It can be seen that the comprehensive value of the project, including option value, can reach CNY 21 million by being delayed for two years, which is more economically feasible than the results of the NPV method after substituting the above data into the formulas.

4.2.3. Sensitivity Analysis

To further analyze the impact of uncertain variables on the economy of the 10 MW distributed wind power grid-connected project, identify the key variables and provide a theoretical basis for the formulation of DWPC policy, this article selects indicators from two aspects of cost and income to perform sensitivity analysis on the NPV and IRR. In terms of cost, the main variables are equipment investment, operation cost and discount rate. The on-grid price of wind power is the main variable for income. The benchmark values of each sensitive factor are shown in Table 4. The changes in equipment investment, operating costs, and on-grid prices of wind power change in positive and negative directions by 10% and 20%. The discount rate takes values of 6%, 7%, 9%, and 10%. Figure 10 is a graph of the impact of the changes in various sensitive factors on the NPV.
(1) The first part is the equipment investment. In the case of a feed-in tariff of 0.34 CNY/kWh, the changes in the NPV and IRR are measured by equipment investment costs of 10% and 20% floating up and down. The results show that the NPV and IRR are inversely related to changes in project equipment investment costs. The NPV of the project is more sensitive to equipment investment compared with operating costs and discount rates. Take the equipment investment costs of CNY 40 million, CNY 45 million, CNY 55 million, and CNY 60 million as samples. The corresponding net present values are CNY 13.3743 million, CNY 8.7447 million, CNY −0.5146 million, and CNY −5.1442 million, respectively. The net present value of the project is 0 if the equipment investment cost is CNY 54.4735 million. This shows that the investment cost of the project’s fans and other equipment is not feasible when it exceeds CNY 54.4735 million. The higher the investment cost on the internal rate of return, the lower the internal rate of return. Within the calculation range, the project’s internal rate of return is equal to the discount rate when the equipment investment increases by 10%. The project’s internal rate of return is reduced to 7% when the equipment investment amount is CNY 60 million and the expected economic benefits cannot be achieved.
(2) The second part is the operating costs. Figure 11 shows that the operating cost is inverse relation to the net present value of the project under the premise that other sensitivity factors remain unchanged. However, within the test range, the net present value changes relatively small because the operating cost is relatively small compared to the investment in fixed assets such as fans. The change in the operating cost does not have great impact on the net present value. Therefore, the net present value does not show significant volatility with changes in operating costs. When the operating cost increased to CNY 1.65 million, the net present value decreased by 28.39% from the baseline value and thus decreased to CNY 3.1310 million. When the operating cost decreases to CNY 1.2 million, the net present value of the project increases by CNY 2.3253 million from the baseline value, which can increase by 53.18%.This demonstrates that the project will have significant profitability by greatly reducing operating costs. In terms of the internal rate of return, when the operating cost of the project fluctuates between CNY 135–165, the IRR of 9% is greater than the discount rate of 8% and has better profitability. When the operating cost increases to CNY 1.8 million, the IRR is equal to the project discount rate. According to the law that the operating cost and the net present value change in reverse, the operating cost should not exceed CNY 1.8 million.
(3) The third part is the discount rate. The discount rate is negatively correlated with the NPV of the project, while other sensitivity factors are fixed. That is, the higher the discount rate, the lower the NPV. The main reason is that as the discount rate increases, the debt repayment required by the project loan increases. Furthermore, it reduces the net cash flow and the net present value. In general terms, the discount rate is straightly tied to the net present value. It is calculated that when the discount rate is 6% and 7%, the NPV of the project is CNY 13.86 million and CNY 8.8433 million, respectively. When the discount rate is increased to 9% and 10%, the NPV of the project is CNY 0.3805 million and CNY −3.1885 million, respectively. This shows that the project can barely achieve profitability when the discount rate of the project is up to 9%.
(4) The fourth part is the feed-in tariff. The net present value is CNY −12.1882 million, CNY −3.90.86 million, CNY 12.6528 million and CNY 20.9334 million under the scenarios of the on-grid electricity price of 0.272 CNY/kWh, 0.306 CNY/kWh, 0.374 CNY/kWh and 0.408 CNY/kWh, respectively. It can be found that the net present value is positively related to the electricity price level under the premise that other parameters remain unchanged. When the electricity price is reduced to 0.322 CNY/kWh, the net present value of the project is 0. Therefore, the on-grid electricity price should be maintained at least at 0.190 CNY/kWh so that the project has a development and utilization value. In terms of the internal rate of return, the electricity price level has a positive correlation with the internal rate of return of the project. When the electricity price changes within the range of ±10% and ±20%, the IRR is 5%, 7%, 11% and 13%, which is greater than the basic rate of return. This can indicate that the project is attractive and profitable within the estimated range.

4.2.4. Conclusion of Economic Evaluation

The above economic analysis shows that the net present value is about CNY 4.3721 million with an internal rate of return of 9% and a dynamic investment payback time of 9.04 years. The project value, including the option value, is about CNY 21 million, which has a favorable economy and feasibility. The results are the same as those in [62]. This case also has positive social benefits. It promotes a new urbanization level (it is located in a developing area of China) and a proportion of renewable energy, and it gains recognition from the local residents. The results of the sensitivity analysis of uncertain factors show that the NPV of the project is positively related to the on-grid price and negatively related to the construction investment, operation investment and discount rate. The NPV is most sensitive to the on-grid price of wind power followed by the investment cost of equipment. Investment and construction costs account for most of the total project cost, thus, they represent a vital function in the total project cost [61]. Therefore, the on-grid tariff and the equipment investment cost are two key factors for the profitability of wind power investment projects. Besides, the cost of wind power projects is absolutely sensitive to the load factor [61], and it decreases with the increase in load factor.

5. Conclusions

This paper summarized the main technical schemes of DWP in terms of power consumption from the three aspects of “source-network-load” in China. The “source” mainly uses energy storage technology to dispatch temporary electricity, which includes an energy storage battery, hydrogen energy storage, heat storage of an electric boiler and pumped storage. The “network” is the transmission and distribution lines connecting the power generation end and the power consumption end. It includes transmission and distribution lines across regions and smart MG technology. The “load” promotes DWPC by increasing the power load, which includes the increase in high energy-consuming enterprises and electric vehicle charging stations. Differently from what was previously mentioned in this study, the establishment of transregional transmission and distribution lines has advantages of wind power near grid connection and consumption, no need to add additional equipment, and relatively low costs. Simultaneously, it is inferior on a small scale and has a high labor cost of later operation and maintenance. By calculating the NPV, IRR, Pt and ROV of the case, this paper analyzed the economy and the viability of the DWP grid-connected project and the single-factor sensitivity of the four uncertain factors of equipment investment costs, operation costs, discount rate and on-grid price.
Taking a 10 MW distributed wind power grid-connected project in B City of China as an example, the results show that the NPV is CNY 4.3721 million and the ROV is CNY 16.6022 million, the dynamic investment recovery cycle is 9.04 years, and the capital return rate is 9%, which indicates that the project has a good economy under the condition of a discount rate of 8% and an operation cycle of 15 years. Moreover, the project has a remarkable effect on energy conservation and environmental protection, with a coal saving benefit of CNY 5.9016 million, an annual maximum CO2 emission reduction of about 31 thousand tons and a SO2 of about 0.1 thousand tons. It also has positive social benefits, including the promotion of the proportion of renewable energy and of the local new urbanization level (as it is located in a developing area of China) and recognition from the local residents.
Through the sensitivity analysis, it can be seen that the NPV is highly susceptible to the feed-in tariff and has a positive correlation with the NPV. This shows that the further development of China’s DWP needs a reasonable feed-in tariff, especially for small wind power enterprises with small profits. China should continue to maintain the corresponding subsidy policy for a clean energy tariff. On the other hand, investment in fixed assets during the construction period has a significant impact on the project’s economy. The project gradually loses its economic feasibility with a growth in equipment investment costs. Currently, the manufacturing cost of the wind power industry has been to a large extent debased in China, and it is of great importance to reduce equipment investment costs. This will provide active economic circumstances for the development of DWP and lay an economic foundation to abate the wind curtailment rate in China.
In order to implement a rapid and healthy development of DWP in China, this article makes the following recommendations.
  • It can be seen from the economic analysis that wind power projects have made outstanding contributions to energy conservation, emission reduction and social benefits. It is better to develop vigorously clean energy, especially wind energy, to optimize the energy structure. This will accelerate the pace of China’s achievement of energy conservation and emission reduction targets.
  • It is considerably difficult for DWP project investment enterprises to achieve profitability without government subsidies, especially for the small and low-profit enterprises mentioned in this case. Therefore, China should continue to implement the electricity price subsidy policy and innovate the way by which the electricity price is subsidized. Issuance of green certificates and a quota system through the market could generate economic benefits.
  • Equipment investment costs play a vital role in the economy of DWP projects [61]. The manufacturing cost of major equipment such as wind turbines will be further reduced with scientific and technological innovation. This can contribute to achieving higher economic benefits and provide space for normalized prices.
  • Finally, the utilization hours of wind farms should be increased. This can increase revenue, achieve the emission reduction targets promised by China in the international community as quickly as possible, and promote a sound and rapid development pace of China’s economy.
This study analyzed the economy of a DWP project with typical technical schemes by combining methods of the net present value and real options. The investors of the DWP project in this case study are small and low-profit enterprises, which is certainly representative of most DWP projects, providing a good setting for analysis. In addition, the influence of inflation on the on-grid price and discount rate was not considered in this case study, and relevant content should be added in future studies.
Further research should be in the form of case studies of DWP projects, with the technical path of reducing wind curtailment on a larger scale and using other advanced methods to conduct a more accurate economic analysis of DWP projects—the binomial model, for instance.

Author Contributions

Conceptualization and methodology, S.S.; formal analysis, H.H.; data curation, Y.D.; writing—original draft preparation, S.S. and Y.D.; writing—review and editing, Y.D., H.H. and Y.G.; supervision, H.H. and Y.G.; funding acquisition, H.H. All authors have read and agreed to the published version of the manuscript.

Funding

This research was funded by the Fundamental Research Funds for the Central Universities, grant number 2010QG01.

Conflicts of Interest

The authors declare no conflict of interest.

References

  1. Xinhuanet. Xi Jinping’s Speech at the Opening Ceremony of the Paris Climate Change Conference. 2015. Available online: http://www.xinhuanet.com//world/2015-12/01/c_1117309642.htm (accessed on 19 May 2020).
  2. Falcone, P.M. Tourism-based circular economy in Salento (South Italy): A SWOT-ANP analysis. Soc. Sci. 2019, 8, 216. [Google Scholar] [CrossRef] [Green Version]
  3. Thombs, R.P. When democracy meets energy transitions: A typology of social power and energy system scale. Energy Res. Soc. Sci. 2019, 52, 159–168. [Google Scholar] [CrossRef]
  4. Kokkinos, K.; Karayannis, V.; Moustakas, K. Circular bio-economy via energy transition supported by Fuzzy Cognitive Map modeling towards sustainable low-carbon environment. Sci. Total Environ. 2020, 721, 137754. [Google Scholar] [CrossRef] [PubMed]
  5. Falcone, P.M.; Lopolito, A.; Sica, E. Instrument mix for energy transition: A method for policy formulation. Technol. Forec. Soc. Chang. 2019, 148, 119706. [Google Scholar] [CrossRef]
  6. Owen, R.; Geraldine, B.; Fergus, L. Enabling investment for the transition to a low carbon economy: Government policy to finance early stage green innovation. Curr. Opin. Environ. Sustain. 2018, 31, 137–145. [Google Scholar] [CrossRef]
  7. National Energy Administration. The Revolutionary Strategy of Energy Production and Consumption (2016–2030). 2017. Available online: http://www.gov.cn/xinwen/2017-04/25/content_5230568.htm (accessed on 8 June 2020).
  8. National Energy Administration. Notice of China Energy Administration on the Development of Decentralized Access Wind Power. 2011. Available online: https://www.doc88.com/p-7793288661915.html (accessed on 8 August 2020).
  9. National Energy Administration. Guidance on the Development and Construction of Decentralized Access Wind Power Projects. 2011. Available online: http://www.waizi.org.cn/doc/35139.html (accessed on 8 August 2020).
  10. National Energy Administration. Guidance on the Implementation of the “Thirteenth Five-Year” plan for Renewable Energy Development. 2017. Available online: http://zfxxgk.nea.gov.cn/auto87/201707/t20170728_2835.htm (accessed on 8 August 2020).
  11. National Energy Administration. Notice on Accelerating the Construction of a Decentralized Access Wind Power Project. 2017. Available online: http://zfxxgk.nea.gov.cn/auto87/201706/t20170606_2801.htm (accessed on 8 August 2020).
  12. Rao, A.G.; Van den Oudenalder, F.S.; Klein, S.A. Natural gas displacement by wind curtailment utilization in combined-cycle power plants. Energy 2019, 168, 477–491. [Google Scholar] [CrossRef]
  13. Li, C. Comprehensive review of renewable energy curtailment and avoidance: A specific example in China. Renew. Sustain. Energy Rev. 2015, 41, 1067–1079. [Google Scholar] [CrossRef]
  14. Bird, L.; Lew, D.; Milligan, M.; Carlini, E.M.; Estanqueiro, A.; Flynn, D.; Gomez-Lazaro, E.; Holttinen, H.; Menemenlis, N.; Orths, A.; et al. Wind and solar energy curtailment: A review of international experience. Renew. Sustain. Energy Rev. 2016, 65, 577–586. [Google Scholar] [CrossRef] [Green Version]
  15. Pei, W.; Chen, Y.; Sheng, K.; Deng, W.; Du, Y.; Qi, Z.; Kong, L. Temporal-spatial analysis and improvement measures of Chinese power system for wind power curtailment problem. Renew. Sustain. Energy Rev. 2015, 49, 148–168. [Google Scholar] [CrossRef]
  16. National Energy Administration. Notice on Doing a Good Job of Renewable Energy Consumption in the “Three North” Region. 2016. Available online: http://zfxxgk.nea.gov.cn/auto92/201602/t20160216_2202.htm (accessed on 8 June 2020).
  17. National Energy Administration. Notice on Promoting Electric Energy Storage to Participate in Peak Load Regulation Auxiliary Services in the “Three North” Region. 2016. Available online: http://zfxxgk.nea.gov.cn/auto92/201606/t20160617_2267.htm (accessed on 8 June 2020).
  18. National Energy Administration. Measures for the Administration of Full Guaranteed Acquisition of Renewable Energy Power Generation. 2020. Available online: http://guangfu.bjx.com.cn/news/20160328/720237.shtml (accessed on 8 June 2020).
  19. Energy Research Institute. Road Map for Wind Power Development in China 2050; Energy Research Institute: Beijing, China, 2020; pp. 58–67. [Google Scholar]
  20. Zhang, N.; Lu, X.; McElroy, M.B.; Nielsen, C.P.; Chen, X.; Deng, Y.; Kang, C. Reducing curtailment of wind electricity in China by employing electric boilers for heat and pumped hydro for energy storage. Appl. Energy 2016, 184, 987–994. [Google Scholar] [CrossRef] [Green Version]
  21. Shi, Q.; Ding, J.; Liu, K.; Yan, W. Economic optimal operation of microgrid integrated energy system with electricity, gas and heat storage. Electr. Power Autom. Equip. 2019, 39, 269–276. [Google Scholar] [CrossRef]
  22. Lu, Z.; Yang, Y.; Geng, L.; Pan, L.; He, L.; Li, X. Low-carbon economic dispatch of the integrated electrical and heating systems based on benders decomposition. Proc. CSEE 2018, 7, 1922–1933. [Google Scholar] [CrossRef]
  23. Lv, Q.; Jiang, H.; Chen, T.; Wang, H.; Lv, Y.; Li, W. Wind power consumption scheme of thermal power plant based on electric boiler and its national economic evaluation. Autom. Electr. Power Syst. 2014, 38, 6–12. [Google Scholar] [CrossRef]
  24. Valverde-Isorna, L.; Ali, D.; Hogg, D.; Abdel-Wahab, M. Modelling the performance of wind–hydrogen energy systems: Case study the hydrogen office in Scotland/UK. Renew. Sustain. Energy Rev. 2016, 53, 1313–1332. [Google Scholar] [CrossRef]
  25. Jiang, K.; Li, H.; Li, W.; Cheng, S. On several battery technologies for power grids. Autom. Electr. Power. Syst. 2013, 37, 47–53. [Google Scholar] [CrossRef]
  26. Gur, T.M. Review of electrical energy storage technologies, materials and systems: Challenges and prospects for large-scale grid storage. Energy Environ. Sci. 2018, 10, 3055. [Google Scholar] [CrossRef]
  27. Zhang, M.; Liang, J.; Sun, Y.; Ling, Z. Availability of distributed wind power—Battery energy storage system. Power Constr. 2016, 37, 29–34. [Google Scholar] [CrossRef]
  28. Schmidt, O.; Melchior, S.; Hawkes, A.; Staffell, I. Projecting the future levelized cost of electricity storage technologies. Joule 2019, 3, 81–100. [Google Scholar] [CrossRef] [Green Version]
  29. Dehghani-Sanij, A.R.; Tharumalingam, E.; Dusseault, M.B.; Fraser, R. Study of energy storage systems and environmental challenges of batteries. Renew. Sustain. Energy Rev. 2019, 104, 192–208. [Google Scholar] [CrossRef]
  30. Ge, W.; Gao, M.; Zhang, Y.; Li, J.; Che, X.; Liu, Y. Optimal economic dispatch of integrated energy system based on electric boiler for wind power accommodation. South. Power Syst. Technol. 2019, 13, 59–66. [Google Scholar] [CrossRef]
  31. Ehsan, A.; Yang, Q. Scenario-based investment planning of isolated multi-energy microgrids considering electricity, heating and cooling demand. Appl. Energy 2019, 235, 1277–1288. [Google Scholar] [CrossRef]
  32. Wang, F.; Li, D.; Fang, J.; Han, X. Economic evaluation of wind power consumption based on energy storage systems coordinated regenerative electric boilers. Advan. Technol. Electr. Engin. Energy 2019, 38, 50–56. [Google Scholar] [CrossRef]
  33. Li, G.; Zhuang, G.; Tian, C.; Wang, H. Multi-objective optimization control of wind power consumption based on regenerative electric boiler system integrated with large-scale energy storage. Electr. Power Autom. Equip. 2018, 38, 46–52. [Google Scholar] [CrossRef]
  34. Cui, Y.; Chen, Z.; Yan, G.; Tang, Y. Coordinated wind power accommodating dispatch model based on electric boiler and chp with thermal energy storage. Proc. CSEE. 2016, 36, 4072–4081. [Google Scholar] [CrossRef]
  35. Xu, M.; Jiang, D. Energy efficiency and economic analysis of wind power heating system. China Energy 2015, 37, 42–47. [Google Scholar] [CrossRef]
  36. Lv, Q.; Chen, T.; Wang, H.; Yu, T.; Li, Q.; Tang, W. Analysis on peak-load regulation ability of cogeneration unit with heat accumulator. Autom. Electr. Power. Syst. 2014, 38, 34–41. [Google Scholar] [CrossRef]
  37. Lv, Q.; Chen, T.; Wang, H.; Li, L.; Lv, Y.; Li, W. Combined heat and power dispatch model for power system with heat accumulator. Electr. Power Autom. Equip. 2014, 34, 79–85. [Google Scholar] [CrossRef]
  38. Li, J.; Xing, Z.; Xing, J.; Fan, X.; Yan, G. Desing of optimized planning platform of electric boiler with heat storage to enhance wind power consumption. Acta Energ. Solar. Sin. 2018, 39, 3270–3276. [Google Scholar]
  39. Benato, A.; Stoppato, A. Pumped thermal electricity storage: A technology overview. Therm. Sci. Eng. Prog. 2018, 6, 301–315. [Google Scholar] [CrossRef]
  40. Han, M.; Chang, X.; Li, J.; Yang, G.; Shang, T.U. Application and development of pumped storage technology. Sci. Technol. Rev. 2016, 34, 57–67. [Google Scholar] [CrossRef]
  41. Lv, Q.; Li, L.; Zhu, Q.; Wang, H.; Liu, R.; Li, W. Comparison of coal saving effect and national economy of three schemes of wind rejection and absorption. Autom. Electr. Power. Syst. 2015, 39, 75–83. [Google Scholar] [CrossRef]
  42. Ghorbani, N.; Makian, H.; Breyer, C. A GIS-based method to identify potential sites for pumped hydro energy storage-case of iran. Energy 2019, 169, 854–867. [Google Scholar] [CrossRef]
  43. Li, Y.; Miao, S.; Yin, B.; Luo, X.; Wang, J. Real-time dispatch model for power system with advanced adiabatic compressed air energy storage. Trans. China Electrotech. Soc. 2019, 34, 387–397. [Google Scholar] [CrossRef]
  44. Shu, Y.; Zhang, Z.; Guo, J.; Zhang, Z. A study on key factors and solution of renewable energy accommodation. Proc. CSEE 2017, 37, 1–9. [Google Scholar] [CrossRef]
  45. Zhang, Y.; Hu, B. Study on wind power exploitation, transmission and accommodation in northern region of China. Electr. Power 2012, 45, 1–6. [Google Scholar] [CrossRef]
  46. Li, G.; Zhao, J.; Yao, Z. Control strategy study roundup of intelligent microgrid. Electrotech. Electr. 2012, 1, 1–4. [Google Scholar] [CrossRef]
  47. Saponara, S.; Saletti, R.; Mihetpopa, L. Hybrid micro-grids exploiting renewables sources, battery energy storages and bi-directional converters. Appl. Sci. 2019, 9, 4973. [Google Scholar] [CrossRef] [Green Version]
  48. Rong, J.; Ai, X.; Wu, J.; Tian, Y.; Zhang, L. Unit commitment strage considering cooperated dispatch of high proportion of electric vehicles and wind power generation. Smart Power 2019, 47, 25–31. [Google Scholar] [CrossRef]
  49. Wang, L.; Wu, X.; Li, H.; Tong, H.; Yang, J. Research on cooperative optimal scheduling of flexible electric vehicles and distributed generator. Renew. Energy Res. 2020, 38, 252–258. [Google Scholar] [CrossRef]
  50. Wang, X.; Zhang, H.; Zhang, S. Game model of wind power and electric vehicles as virtual power plants participating in the power market. Autom. Electr. Power. Syst. 2019, 43, 155–164. [Google Scholar] [CrossRef]
  51. Limmer, S.; Rodemann, T. Peak load reduction through dynamic pricing for electric vehicle charging. Int. J. Electr. Power Energy Syst. 2019, 113, 117–128. [Google Scholar] [CrossRef]
  52. Sun, H.; Li, Z.; Chen, A.; Zhang, Y.; Mei, C. Current status and development trend of hydrogen production technology by wind power. Trans. China Electrotech. Soc. 2019, 34, 4071–4083. [Google Scholar] [CrossRef]
  53. Duan, Q.; CNY, T.; Mei, S.; Chen, J. Energy coordination control of wind power-hydrogen energy storage and coal chemical multi-functional coupling system. High Volt. Technol. 2018, 44, 176–186. [Google Scholar] [CrossRef]
  54. Cai, G.; Chen, C.; Kong, L.; Peng, L. Control of hybrid system of wind/hydrogen/fuel cell/supercapacitor. Trans. China Electrotech. Soc. 2017, 32, 84–94. [Google Scholar] [CrossRef]
  55. Cai, G.; Chen, C.; Kong, L.; Peng, L.; Zhang, H. Modeling and control of grid-connected system of wind/PV/electrolyzer and SC. Power Syst. Technol. 2016, 40, 2982–2990. [Google Scholar] [CrossRef]
  56. Haghi, E.; Fwoler, M.; Raahemifar, K. Economic analysis of hydrogen production in context of a microgrid. In Proceedings of the IEEE International Conference on Smart Energy Grid Engineering, Oshawa, ON, Canada, 14–17 August 2017. [Google Scholar] [CrossRef]
  57. Cai, G.; Kong, L.; Xue, Y.; Sun, B. Overview of research on wind power coupled with hydrogen production technology. Autom. Electr. Power Syst. 2014, 38, 127–135. [Google Scholar] [CrossRef]
  58. Dorota, K. Fuzzy capital budgeting. Fuzzy Sets Syst. 2000, 11, 367–385. [Google Scholar] [CrossRef]
  59. Lin, Q. Financial Engineering, 3rd ed.; China Renmin University Press: Beijing, China, 2013. [Google Scholar]
  60. De Neufville, R. Real options: Dealing with uncertainty in systems planning and design. Int. Asses. 2003, 4, 26–34. [Google Scholar] [CrossRef]
  61. International Energy Agency (IEA). Projected Costs of Generating Electricity (2010 Edition); IEA: Paris, France, 2010; p. 154. [Google Scholar]
  62. FD.BJX.COM.CN. Taking the 10 MW Distributed Wind Power Project in the Eastern Region as a Sample to Calculate the Project Economy. 2020. Available online: http://news.bjx.com.cn/html/20180402/889137.shtml (accessed on 8 August 2020).
Figure 1. Schematic diagram of a combination of wind energy and the storage battery system.
Energies 13 04147 g001
Figure 2. Schematic diagram of wind power and the clean heating system.
Energies 13 04147 g002
Figure 3. Schematic diagram of the joint of wind power and a pumped storage system.
Energies 13 04147 g003
Figure 4. Schematic diagram of the advanced adiabat compressed air energy storage (AACAES) system.
Energies 13 04147 g004
Figure 5. Schematic diagram of smart microgrid (MG) structure.
Energies 13 04147 g005
Figure 6. Schematic diagram of an electric vehicle charging station connected to the load side.
Energies 13 04147 g006
Figure 7. Flow chart of H2 production by the wind energy system.
Energies 13 04147 g007
Figure 8. The process of economic analysis.
Energies 13 04147 g008
Figure 9. Cumulative net cash flow.
Energies 13 04147 g009
Figure 10. Analysis chart of sensitivity factors.
Energies 13 04147 g010
Figure 11. The proportion of various expenses in the total investment.
Energies 13 04147 g011
Table 1. Total investment estimate (CNY 10,000).
IndexEquipment Purchase CostConstruction and Installation CostOther Engineering and Construction CostBasic Reserve CostInterest during the Construction PeriodWorking Capital InvestmentTotal Cost
10 MW
Distributed Wind Power
Grid
Connection Project
4988.71897.08887.05139.457.76307000
Table 2. An estimate of economic benefits (CNY 10,000).
IndexPower Generation IncomeCoal Saving Income Subsidy IncomeFixed Assets Recovery IncomeTotal Income
10 MW Distributed Wind Power
Grid-Connected
Project
1044.82590.0221.18294.31950.32
Table 3. Main economic indicators.
IndexNPV (CNY 10,000)IRR (%)Pt (year)
10 MW Distributed Wind Power
Grid-Connected
Project
437.2199.04
Table 4. Baseline values of sensitivity factors.
FactorsEquipment Investment
(CNY 10,000)
Operating Cost
(CNY 10,000)
Discount Rate (%)Feed-in Tariff
(CNY/kWh)
Reference value500015080.34

