Abstract
The feasibility and cost-effectiveness of hydrogen-based microgrids in facilities, such as public buildings and small- and medium-sized enterprises, provided by photovoltaic (PV) plants and characterized by low electric demand during weekends, were investigated in this paper. Starting from the experience of the microgrid being built at the Renewable Energy Facility of Sardegna Ricerche (Italy), which, among various energy production and storage systems, includes a hydrogen storage system, a modeling of the hydrogen-based microgrid was developed. The model was used to analyze the expected performance of the microgrid considering different load profiles and equipment sizes. Finally, the microgrid cost-effectiveness was evaluated using a preliminary economic analysis. The results demonstrate that an effective design can be achieved with a PV system sized for an annual energy production 20% higher than the annual energy requested by the user and a hydrogen generator size 60% of the PV nominal power size. This configuration leads to a self-sufficiency rate of about 80% and, without public grants, a levelized cost of energy comparable with the cost of electricity in Italy can be achieved with a reduction of at least 25–40% of the current initial costs charged for the whole plant, depending on the load profile shape.
1. Introduction
The strategic role of green hydrogen technologies in microgrids based on renewable energy sources (RES) is strengthening in the global decarbonization process. In this context, their main distinguishing features are their storage capability, which can range from small scale (hourly or daily) to large scale (seasonal); the absence of greenhouse emissions; and the flexibility in following variable electricity supply and demand [1]. The numerous microgrid projects involving hydrogen technologies are a response to the growing interest in this energy carrier for the storage of non-dispatchable energy sources. Several real cases of hydrogen storage installations were presented by Colombo et al., including a microgrid in Chile that includes a 125 kWp solar photovoltaic (PV) system backed by 450 kWh hydrogen storage and 132 kWh lithium storage systems [2]. A renewable hydrogen-based microgrid for a community in Cornwall (ON, Canada) was introduced and analyzed by Mukherjee et al. [3]. Solar PV systems, wind turbines, electrolyzers, hydrogen tanks, fuel cells, and fuel cell vehicles were considered as the components providing energy to the community. In the framework of the REMOTE project [4], a microgrid including a 170 kWp photovoltaic system, a lithium-ion accumulation system with a capacity of 600 kWh, and a hydrogen storage system of 1000 kWh is going to be installed in Ginostra, a small village in the Aeolian Islands (Italy). By being the first community to be 100% powered by RES, the project wants to prove the technical and economic feasibility of energy storage solutions based on fuel cells for isolated areas.
The integration of hydrogen technologies in the microgrid generally involves a “power-to-power” process. During periods of energetic overproduction, due to the intermittent and non-dispatchable nature of RES, like solar and wind energy, the excess electrical power is used to produce hydrogen by electrolysis. The latter is the most environmentally-friendly process for obtaining hydrogen from RES. Through this process, hydrogen and oxygen are obtained only from water molecules and are extremely pure. The efficiency is generally between 60% and 81%, depending on the technology adopted and the electrolyzer size [5]. The produced hydrogen is then stored in proper reservoirs. To overcome the low energy storage density of hydrogen due to its low molar mass, a high-pressure storage at 250–700 bar in steel or composite tanks is often included in stationary applications [6]. Finally, when microgrid demand is high, the produced hydrogen is re-converted into electrical power via fuel cell power generation systems [7]. Batteries could be part of the system for short-term energy storage but may not be the most suitable technology for large-scale energy storage due to high costs, low energy storage density, and limited life cycles [8]. For these reasons, hydrogen energy storage systems can be a suitable alternative for ensuring long-term energy storage [9], and the coupling between hydrogen storage systems and batteries may lead to increased flexibility in following the load demand [10,11]. Depending on the situation, the surplus of electrical energy can be used to charge the batteries or the hydrogen tanks. Similarly, the demand can be covered by using the energy stored in one of these two systems. Highly integrated energy systems require the development and the implementation of effective and reliable energy management strategies that are able to ensure the proper operation of the microgrid and to determine the priority between batteries and hydrogen storage in different conditions [12]. Numerous studies concern this research topic. Catilla et al. [13] focused on the design and implementation of an event-based control architecture to manage a renewable-based microgrid for the energy demand of an office. Their results showed that the use of event-based control architecture produces a significant reduction in the number of changes in the control action with an acceptable deterioration of set-point tracking for a microgrid with several types of electrochemical storage devices. Petrollese et al. [14] proposed an energy management system that employs a model predictive control (MPC) algorithm coupled with an optimal scheduling algorithm. The MPC controls the components of the renewable hydrogen microgrid, which include PV units, battery, and a hydrogen storage system. They concluded that MPC is able to better use the two storage systems (battery for short-term and hydrogen for long-term storage) and reduce the operating cost of the microgrid. The reduction in the microgrid operating costs, due to the implementation of an effective energy management strategy, was confirmed by Abid et al. [15]. The results demonstrated that this reduction becomes evident when the microgrid operates in an islanded mode. Monforti et al. [16] compared two strategies for an energy management system based on hydrogen priority vs. battery priority for the operation of a hybrid renewable microgrid. The results demonstrated that the hydrogen-priority strategy moves the microgrid toward island operation because it saves a higher amount of energy, whereas the battery-priority strategy reduces the energy efficiency in the storage round trip. As highlighted by Gunasekaran et al. [17], the implementation of optimized energy management strategies is also fundamental for rural microgrids not connected to the public grid to maximize the RES production and to reduce the fuel consumption of backup systems. All the above-cited studies showed that the optimal energy management strategy for microgrids involving two or more energy storage systems is not univocal, but strongly depends on the system design and architecture, penetration of RES systems, user habits, and objective function chosen. Consequently, further efforts are required to propose and investigate effective and customized microgrid configurations to identify optimal system design approaches and corresponding energy management strategies for specific users.
In this framework, this paper aims to investigate the potential and feasibility of hydrogen-based microgrids in applications characterized by renewable energy production and low energy demand during the weekend, such as public buildings and small- and medium-sized enterprises (SMEs). The configuration of microgrid under construction at the Renewable Energy Facility (REF) in Sardinia (Italy) including a PV plant, a battery bank, and a hydrogen storage system was taken as a case. Specific mathematical models were developed and used to investigate microgrid performance during a typical year of operation. An energy management strategy was implemented, and different electrical duty-load profiles and sizes of equipment were considered. A preliminary economic analysis was subsequently conducted to evaluate the cost-effectiveness of hydrogen-based microgrids.
The specific objectives of this study were to:
- identify guidelines for the optimal design configuration of hydrogen-based microgrids in applications characterized by high RES penetration and low energy demand during weekends;
- evaluate the achievable self-sufficiency rate of such microgrids managed to produce hydrogen whenever the electric power exceeds the minimum hydrogen generator load; and
- assess the equipment cost reduction required for obtaining a levelized cost of energy comparable to the current cost of electricity in Italy.
2. Materials and Methods
As mentioned, the REF, founded by Sardegna Ricerche, is going to complete a microgrid suitable for R&D activities and designed to optimize the integration of several energy production and storage systems. The microgrid will be able to achieve instantaneous energy balancing of the buildings, guaranteeing high self-sufficiency for most of the year. Figure 1 shows the microgrid schematic, which includes several generation units such as a photovoltaic power plant constituted by a 44 kWp flat-plate PV system and a 6.2 kWp concentrated PV system with Fresnel lenses, and two types of fuel cell (FC) generators: a proton exchange membrane fuel cell (PEMFC, 5 kW) and a solid oxide fuel cell (SOFC, 9.5 kW). As shown in the schematic, the SOFC micro-combined heat and power (m-CHP), used to fulfill the building base load, is fed by LPG (currently, the methane network is not available in Sardinia) and a small quantity of biomethane from both a methanation process (fed by hydrogen) and an anaerobic digester. The PEMFC is used to support the microgrid during peak demand. It is fueled by hydrogen produced by two hydrogen generators (1.05 Nm3/h each) powered by the excess renewable energy during the weekends and stored at about 14.8 bar in four stainless steel tanks of 1.1 m3 each. The whole plant is connected to the public grid and is equipped with several electrochemical storage systems (about 100 kWh in total). Although almost the whole building is air conditioned with reversible heat pumps, a small part is heated by the thermal power released by the SOFC, stored in a tank (2.0 m3) as hot water in winter, cooled by cooling energy produced by a dedicated air/water heat pump (by a small part of the excess of the electricity produced by the microgrid during the day), and stored in a tank (0.3 m3) filled with phase change material (PCM) in summer.
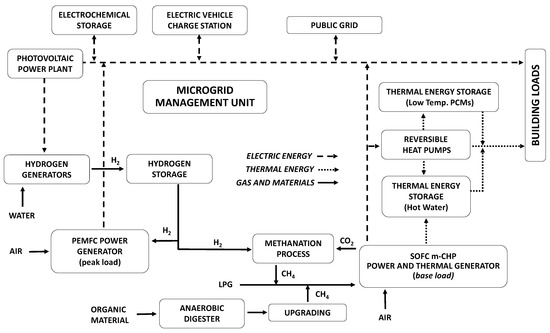
Figure 1.
Schematic of the renewable energy platform microgrid.
Focusing on the feasibility of hydrogen-based microgrids, Figure 2 shows the schematic of the microgrid proposed in this paper. According to this solution, the user needs are primarily matched by the photovoltaic plant during the daytime and by batteries and fuel cell for the rest of the day. When the photovoltaic power exceeds the user needs, to reduce the battery pack size, the hydrogen generator is turned on when the electric power available is higher than the minimum load imposed for the hydrogen generator. To maximize the self-sufficiency of the building, the microgrid can only import electricity from the public grid when it is unable to sustain the user request.
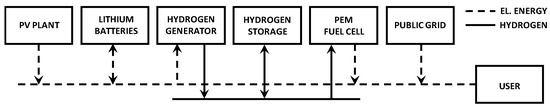
Figure 2.
Schematic of the hydrogen-based microgrid.
2.1. Mathematical Models
The hydrogen-based microgrid performance during one year of operation was evaluated by means of specific mathematical models developed in the MATLAB environment. All the meteorological data for a site placed in south-central Sardinia (Italy) were determined by Meteonorm software [18]. The energy demand was modelled using a simplified daily electrical load profile, which included only base-load power (Pb) and peak-load power (Pp) with peak duration tp. Figure 3 shows the assumed load profile during weekdays, where the peak-load is reached during working hours, whereas during the night and weekends, only base-load power is demanded. The assumed energy demand is typical for public buildings and SMEs. To maintain a general approach, no seasonal changes were considered in this study. A specific approach must be suggested for any case strongly affected by seasonality and not easily attributable to the results of this preliminary study.
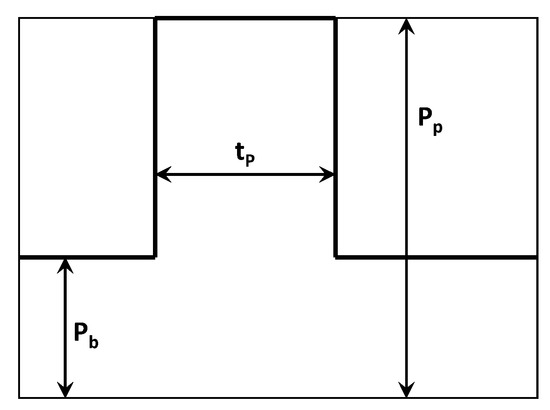
Figure 3.
User duty load profile during weekdays.
2.1.1. PV System
The PV generation profile was simulated using the meteorological data obtained by Meteonorm and the performance parameters of a modular PV section. The latter was based on a 10 kW PV subarray composed of two strings with 14 PV modules characterized by a peak power of 360 Wp (Table 1 reports the other main PV module characteristics), whereas the number of PV subarrays and, consequently, the overall PV size, was evaluated according to the annual energy production of a single module and the considered load profile.

Table 1.
Main characteristic of the hydrogen-based microgrid [20,21,22].
For the simulation of the annual performance of the PV module, a panel orientation toward south (azimuth equal to 0°) with a tilt angle of 30° was assumed. The operating temperature of the PV module was determined using the following correlation:
where is the ambient temperature; is the nominal operating cell temperature (NOCT, temperature of the cell without any load), with an incident radiation of 800 W/m2 and an ambient temperature of 20 °C; GI is the global solar irradiation available on the surface of the PV array calculated starting from the global horizontal irradiance (GHI) using the method proposed by Duffie et al. [19]; and are the heat transfer coefficients at the effective and NOCT conditions, respectively; is the transmittance–absorptance coefficient (set to 0.9); and is the nominal PV efficiency. The actual PV efficiency is subsequently calculated according to the following relationship:
where is the temperature coefficient and is the PV cell temperature under standard test conditions (25 °C). The power output of the PV subarray is calculated as:
where is the number of PV modules in the PV subarray (set to 28), is the active area of each PV module, and is the inverter efficiency, given by the manufacturer as a function of the PV power output. Soiling of the modules, wiring losses, shading, aging, and other secondary losses are accounted in a derating factor .
The PV system was sized starting from the expected annual performance of the single PV subarray and the annual energy requested by the user. In particular, a dimensionless PV-to-load ratio , defined as the ratio between the annual energy produced by the PV and the annual load consumption, was introduced. Consequently, the nominal power of the PV array () was determined as:
where is the annual energy requested by the user and is the nominal power of the PV subarray (10.08 kWp).
2.1.2. Battery Bank
The stored energy in the battery bank was evaluated through the state of charge (), which is the ratio between the stored energy and the nominal storage capacity. It was calculated using the following correlation by monitoring the charging () and discharging power () over time:
where and are the battery efficiency during charging and discharging phases, respectively; is the applied time step (imposed equal to 1 h); and is the battery nominal capacity. The battery efficiency depends on several operating parameters such as current, SOC, and battery lifetime. To simplify the model, lithium-ion batteries characterized by a constant charging and discharging efficiency of 98% and 97%, respectively, and a depth-of-discharge of 90% were considered. The battery capacity was determined as that required to fully store the excess of energy produced by the PV system not directly used by the load neither for hydrogen production. With this design choice, the overall consumption of the self-produced energy is guaranteed, and no excess energy is released to the grid.
2.1.3. Hydrogen Section
The hydrogen section is constituted by a hydrogen generation system in which the excess power produced by the PV plant is converted into hydrogen, a hydrogen storage section where the hydrogen is stored for a postponed use, and a PEMFC generation system, which re-converts the hydrogen in electricity during power deficit periods.
A variable hydrogen generator size was assumed in this analysis. A dimensionless parameter , defined as the ratio between the hydrogen generator nominal size () and the PV nominal size (), was introduced for determining the hydrogen generator size. The fuel cell was sized to fully satisfy the peak-load power (). Finally, like the battery storage system, the hydrogen storage capacity was determined with the assumption that all the hydrogen produced by the hydrogen generators can be stored in the tanks without reaching a full charge.
Since the PV power supplying the hydrogen section and the load demand are time variables, both hydrogen generators and PEMFC often operate in off-design mode. As shown in Figure 4, this operability leads to an efficiency variation of the two devices. Both curves were extrapolated and reworked starting from confidential information on commercial devices. In particular, the hydrogen generator curve includes the energy consumption of the auxiliary systems involved in the hydrogen production process, such as hydrogen compression.
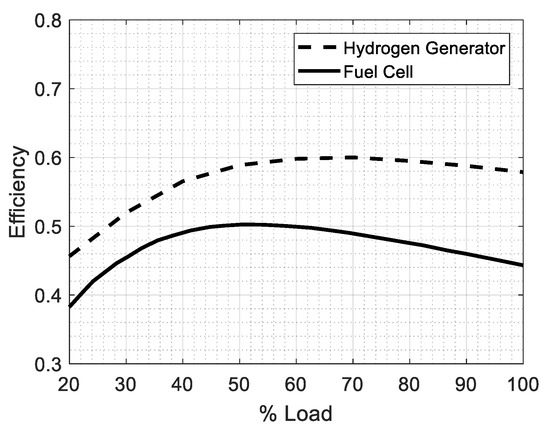
Figure 4.
Hydrogen generator and proton exchange membrane (PEM) fuel cell efficiency curves.
The electrical power required by the generator () is therefore dependent on the hydrogen generator efficiency () given by Equation (6), where and are the hydrogen mass flow rate and lower heating value, respectively. Likewise, the electrical power generated by the fuel cell () depends on the fuel cell efficiency (), given by Equation (7).
It was assumed that both the hydrogen generator and fuel cell can operate in a range between 20% and 100% of their rated power. The energy stored inside the hydrogen storage system at a specific time was evaluated using the state-of-charge of the hydrogen tank (), determined by Equation (8), monitoring the energy converted by the hydrogen generator and that used by the fuel cell, (with hydrogen storage capacity):
2.1.4. Energy Management Strategy
A specific energy management strategy for the microgrid was developed with the main objective of minimizing the annual energy drawn from the grid and thus maximizing the self-sufficiency of the user. A logical diagram of the energy management strategy proposed in this paper is shown in Figure 5. As mentioned above, the user needs are primarily matched by photovoltaic plant during the daytime, whereas batteries are the first energy storage system involved to cover the eventual deficit of energy. However, once the energy content stored in batteries is lower than a given threshold value (imposed equal to the energy required for 1 h at base-load power), the fuel cell is switched on. When the electricity produced by the PV plant exceeds user needs, as soon as enough electric power is available, the hydrogen generator is turned on to minimize the battery pack size. The public grid is used only when the microgrid generation system is unable to sustain the user request.
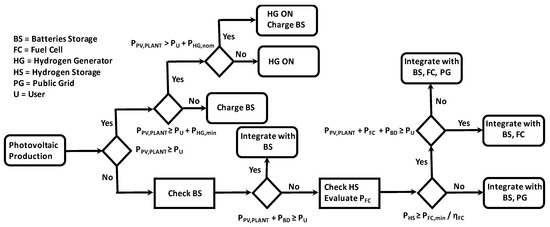
Figure 5.
Proposed plant logic diagram.
The main component characteristics used for the system modelling are reported in Table 1.
3. Results and Discussion
This section reports the expected annual performance of the microgrid equipped with batteries and hydrogen storage system for several design options. As mentioned in the previous section, plant design and assessment of the yearly energy performance are based on two parameters:, which provides the PV size using the ratio between the annual energy produced by the PV and the annual energy requested by the user, and , which determines the hydrogen generator size using the ratio between the hydrogen generator nominal size () and the PV nominal size (). For all the cases analyzed, a specific annual energy production of about 1550 kWh/kW was achieved for the PV plant based on the expected yearly meteorological conditions obtained by Meteonorm and the mathematical model presented in Section 2.1.1.
Figure 6 shows the variation in the hydrogen storage capacity () as a function of and parameters, for two values of the ratio between base-load and peak-load () of 0.25 (Figure 6a) and 0.5 (Figure 6b). The hydrogen storage capacity is shown in terms of equivalent hours that the stored hydrogen can supply to the fuel cell under nominal conditions. Regardless the shape of the load demand, for values lower than 1.2, the hydrogen storage is sized for a daily storage capacity and the PV relative size has a low impact on this parameter. A higher , which means a higher PV size compared to user needs, leads to a higher quantity of available energy that can be converted into hydrogen; consequently, the storage capacity of the hydrogen system increases up to reach a weekly or a monthly storage capacity. This variation is particularly evident in Figure 6a, where the energy consumption during no sunshine hours is low and a limited request for hydrogen from the fuel cell occurs. The hydrogen storage capacity also strongly depends on In the case of a hydrogen generator with a size equal to 60–70% of the PV size, a lower hydrogen storage capacity is required for a given . In these conditions, following the logic diagram in Figure 5, the utilization factor of battery storage decreases and that of the hydrogen section increases, with the subsequent reduction in the required storage capacities for both the battery bank and hydrogen section (the hydrogen produced is used in the following hours by the fuel cell).
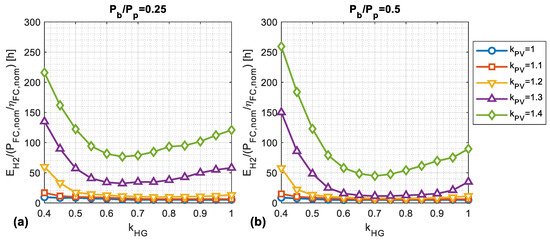
Figure 6.
Hydrogen storage capacity (expressed as the number of hours with the fuel cell (FC) running at nominal power) as a function of
and different values for (a) = 0.25 and (b) = 0.5.
For a better understanding of the expected performance of the hydrogen section, the main performance indicators of hydrogen generation and use via the fuel cell were analyzed in detail.
Figure 7 shows the annual energy sent to the hydrogen generator () as a percentage of the annual energy produced by the PV plant (solid lines) and the corresponding average conversion efficiency (dashed lines). The percentage of PV energy converted into hydrogen ranged between 35% and 60%, with higher values obtained with the rise in and the subsequent increase in the excess of PV energy produced during daytime. Because an increase of about 34% in the PV nominal size occurs from = 0.25 (Figure 7a) to 0.5 (Figure 7b), a rise in the hydrogen generator use (of about five percentage points) was consequently observed by comparing Figure 7a,b. This increase is limited since the hydrogen generators mainly operate during peak demand periods and the influence of the base load is marginal. For a given size of the PV system, a maximum value of is reached for a value of about 60–65%, confirming the best match between PV size and hydrogen generator size in that range. The average conversion efficiency was found with lower , indicating that smaller hydrogen generators work close to the best conditions and more energy is stored in the batteries, while the influences of the load profile and PV relative size are marginal.
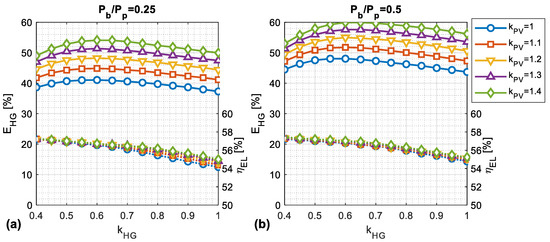
Figure 7.
Energy sent to the hydrogen generator (solid lines) and average conversion efficiency (dashed lines) as a function of
and different values for (a) = 0.25 and (b) = 0.5.
Figure 8 shows the annual operating hours of the fuel cell (solid lines) and the corresponding average conversion efficiency (dashed lines). In both cases (Figure 8a,b), the operating hours were similar and ranged between 1200 to 2700 h per year. Even in this case, the was the main parameter affecting the annual utilization factor of the device. The fuel cell operating hours were also influenced by the size of the hydrogen generator; for a of about 60%, an increase in the hydrogen production was detected. A larger amount of hydrogen is available during nighttime with a consequent increase in fuel cell use. Unlike the hydrogen generator, the performance of the fuel cell was also strongly influenced by the load request, since the fuel cell is mainly used to cover the base load at night. For this reason, in Figure 8b, the fuel cell can operate close to its maximum conversion efficiency, reducing the relative consumption of hydrogen, despite a higher ratio that should lead to a faster hydrogen depletion, an increase in operating hours was observed with the increase in the base-to-peak ratio.
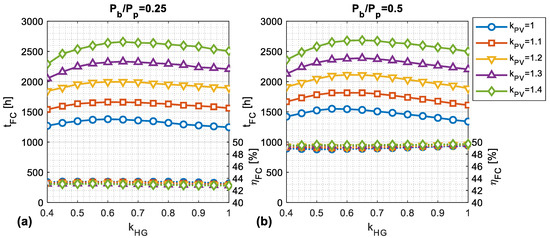
Figure 8.
Numbers of hours in which the fuel cell is turned on during the year (solid lines) and related efficiency (dashed line) as a function of
and different values for (a) = 0.25 and (b) = 0.5.
Batteries are the other energy storage system introduced in the microgrid for covering the mismatch between energy supply and demand. Batteries mainly operate to balance the minor differences in terms of energy excess or deficit. Therefore, the battery storage capacity is influenced by numerous factors, including the hydrogen storage system performance. Figure 9 shows the battery storage capacity expressed as equivalent hours of operation per year of the PV system under nominal conditions. The curves follow the same trend depicted for the hydrogen storage system, but in this case, the mismatch between energy supply and demand can be fulfilled with no large capacity. Regardless the load profile shape and both PV and hydrogen storage sizes, the required battery capacity was in the range of 0.5–1.5 h of operation of PV under nominal conditions for more than 90% of the analyzed cases. For the hydrogen section, the lowest demand for storage capacity was obtained for a value in the range of 0.60–0.70, highlighting the mutual interdependence of the battery capacity with the hydrogen section design. The larger the use of the hydrogen section, the lower the storage capacity required for the batteries. The PV relative ratio has a secondary effect on the battery capacity, since the major share of excess energy to be stored is sent to the hydrogen section.
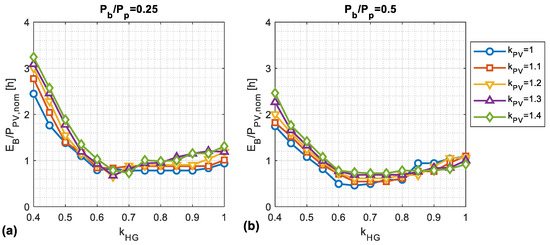
Figure 9.
Ratio between battery size and photovoltaic (PV) size as a function of
and different values for (a) = 0.25 and (b) = 0.5.
Finally, since the microgrid is sized and managed to maximize user self-sufficiency, the achieved self-sufficiency ratio (SSR), calculated as the ratio between the annual energy demand supplied by the microgrid and the overall annual energy demand requested by the user, is shown in Figure 10. The SSR increases with almost linearly. However, full self-sufficiency was not achieved for any system solution analyzed, and a self-sufficiency higher than 80% was only achieved with a higher than 1.3 for a ratio of 0.25, and with a higher than 1.4 for a ratio of 0.5. As shown in the following section, this oversizing leads to unacceptable cost of energy. The effect of the size of the hydrogen generators on the SSR was almost negligible compared to the PV-to-load ratio with slight reduction obtained with a of 0.6–0.7 for a given value. This reduction mainly occurs due to the important use in this range of the hydrogen system, which is characterized by a lower roundtrip efficiency compared to batteries.
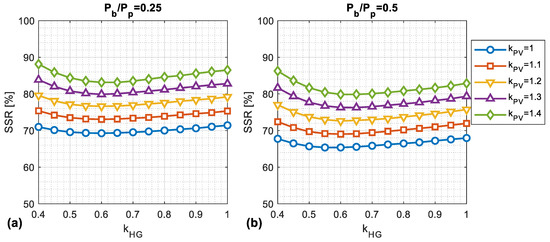
Figure 10.
Hydrogen-based plant self-sufficiency ratio as a function of
and different values for (a) = 0.25 and (b) = 0.5.
4. Preliminarily Economic Analysis
The previous section showed how a hydrogen-based energy storage system operates in PV microgrids supplying facilities with low demand during weekends (like in public, commercial, and SME buildings). The following preliminary economic analysis investigated in which conditions the proposed plant can become cost effective for medium-sized photovoltaic plants with nominal power in the range 200–1000 kWp and a peak load of 100–500 kW, in which the produced energy is only partially exploited during the weekend to fulfill the base load (no peak loads are present). The analysis considers the levelized cost of energy (LCOE), calculated according to the simplified methodology proposed by the International Energy Agency [23], using the following equation:
where is the total capital investment; , , and are the additional investment cost, the operation and maintenance costs, and the net electricity production in year k, respectively; the annual interest rate; and is the operating lifetime. The includes the whole equipment cost, the balance of plant costs (), and the engineering costs ():
where , , , , and are the specific costs of PV plant, batteries, hydrogen generator, fuel cell, and storage system, respectively. For simplicity, TCI was determined at the beginning of the operating lifetime period and the investment costs in the following years were neglected. Finally, annual operating and maintenance costs and hydrogen production were assumed as constant during the overall operating lifetime. Table 2 reports the main assumptions for the economic analysis.
Table 2.
Economic analysis assumptions [23,24,25,26,27].
Estimating costs for these technologies is difficult, since most of them are under development or the commercial market has not yet fully developed. The PV plant and the batteries costs were deducted from the IRENA report [26]. According to Parra et al. [24], the CAPEX for proton exchange membrane (PEM) electrolyzers ranges between 1200 and 2000 EUR/kW, which should drop in long term to 400–1700 EUR/kW (without compression costs). In the IEA report [25], the CAPEX ranged from 1100 to 1800 USD/kW. A hydrogen generator cost of 1300 EUR/kW was therefore assumed for a preliminary approach. Although alkaline electrolyzers have a lower CAPEX, PEM electrolyzers are compact systems, do not treat corrosive liquid electrolytes, better manage dynamic variations, and have a larger part-load operating range [26,28]. For pressurized storage tanks, the CAPEX can range between 200 to 2000 EUR/kg [24]. In this work, an intermediate value of 1000 EUR/kg was considered, which could be representative of a range of pressure between 150 to 200 bar [29]. Although PEMFC use has been growing over the past 20 years, the market is young. A cost estimation was provided in [27], where the cost of 100 and 250 kW stacks were reported as 2670 and 1727 USD/kW, respectively, both for a production of 10,000 units/year. Since, in this respect, both the fuel processor (for natural gas or propane) and heat recovery components are considered, a rough cost of 1500 EUR/kW was considered in this study. Every other unmentioned cost was considered to be included in the BoP, including hydrogen compression costs. Considering a hydrogen compression ratio in the range of 3–5, compressor efficiencies of about 70%, and specific compressor costs ranging between 1000 and 5000 EUR/kWe [24], the expected initial cost for the hydrogen compression section should weigh 1–6% of the hydrogen generator cost. Given the computed working hours for electrochemical components (about 45,000 h for kPV = 1.2 and less than 60,000 h in the worst-case scenario considered), only scheduled maintenance was considered and not complete substitution.
Based on these assumptions, Figure 11 shows the expected LCOE for the proposed microgrid configuration. The values obtained ranged from about 370 to about 1250 EUR/MWh. The lowest LCOEs were achieved by small PV sections coupled with low capacity storage sections and, subsequently, with the smallest SSR. The achievement of higher SSR compared to that obtained with only the direct use of the PV plant resulted in an increase in the electricity cost due to the introduction of storage systems. By referring to the hydrogen generator relative size, the highest cost-effectiveness was reached with a in the range of 60–70% regardless the PV size and the load demand shape, confirming that this is the optimal relative size for this device also from an economic point of view. Notably, the variation in the LCOE with the PV-to-load ratio was not as linear as that observed with the SSR, but an important increase in the cost of energy was found for values higher than 1.2. In these conditions, it was previously observed that an increase occurred in the storage sections from a daily to a weekly capacity. This increase was determined according to the energy management strategy adopted, since no limitations in the storage capacity were introduced a priori. The full exploitation of the storage capacity of both batteries and hydrogen system is limited to few hours of operation, leading to an unprofitable design choice.
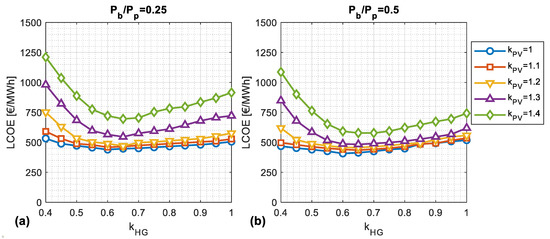
Figure 11.
Levelized cost of energy as a function of
and different values for = 0.25 (a) and = 0.5 (b).
This finding is confirmed by the histograms shown in Figure 12, where the state-of-charge of the batteries and hydrogen tanks is compared with the corresponding percentage of occurrence among the various analyzed design cases. The state-of-charge of batteries rarely reaches full charge (SOC of 100%), whereas the highest percentages of occurrence were obtained in the range of 0–20%. An oversizing of batteries is therefore obtained with the proposed design approach. Since a share of the batteries capacity is not exploited for a large part of the year, an eventual reduction in their storage capacity would result in a marginal decrease in the SSR but in an important reduction in the initial cost of the plant. Although the frequency distribution shape of the hydrogen state-of-charge is different compared to that obtained for batteries, even for this storage system, full charging was rarely observed. This finding becomes particularly evident for hydrogen sections characterized by very high storage capacities (as shown in Figure 6). Like batteries, a proper reduction in the capacity of this storage system would be a cost-effective solution at the expense of a marginal reduction in user self-sufficiency.
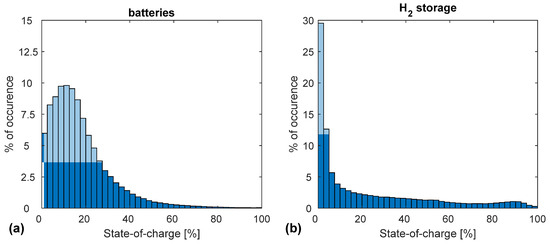
Figure 12.
Frequency distribution of the state-of-charge for (a) batteries and (b) hydrogen tanks.
The effect of a decrease in the overall storage capacity (batteries and hydrogen storage) on the self-sufficiency rate and the corresponding cost of energy is shown in Figure 13. Starting from the performance without any restriction in the storage capacity, as analyzed so far (hereinafter called the base configuration), two other configurations were introduced: a microgrid configuration with a battery bank and a hydrogen storage section able to cover the 98th percentile of their theoretical requirements and a microgrid configuration with storage capacities curtailed to cover the 95th percentile of the observed theoretical demand.
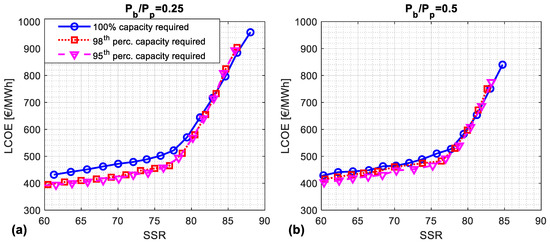
Figure 13.
Levelized cost of energy (LCOE) vs. self-sufficiency ratio (SSR) without limitation on the storage capacity and with a reduction to the 98th and 95th percentile of the theoretical requirements for (a) = 0.25 and (b) = 0.5.
As expected, a typical trend of two conflicting objectives (maximization of SSR and minimization of LCOE) was obtained. The reduction in the storage capacity benefited the cases with low values of SSR (lower than about 80%) regardless of the load profile shape. In these cases, an LCOE reduction up to 10% compared to the base configuration was achieved by a proper reduction in the two storage capacities by keeping the same level of SSR. SSRs higher than 80% were achievable only with an important increase in the storage sections; in these cases, a curtailment of the storage capacity was detrimental. The economic benefits achieved with the reduction in the storage capacities without a simultaneous reduction in the SSR became increasingly marginal. It is evident for the first case that the performance variation by transition from covering the 98th percentile of their theoretical requirements to the 95th is negligible. Finally, if the criterion for the selection of the best design solution is the identification of the point in the curve that minimizes the distance to the “ideal point” (representing the nonexistent solution that simultaneously minimizes the LCOE and maximizes the SSR), the best trade-off is reached by a PV-to-load ratio equal to about 1.2 and a of 0.6. This design solution achieves an SSR of about 77% with a LCOE of 465 EUR/MWh (considering a storage capacity decreased to the 95th percentile of the theoretical value). The latter value is not competitive with the current cost of electricity and the overall investment is not profitable without a proper incentive and an important reduction in the specific equipment costs.
In this regard, since the costs of all the devices involved in this study are expected to considerably decrease in the future, in particular with the development of the hydrogen market, a sensitivity analysis on the specific costs was conducted. The optimal design solution previously found, namely, a PV plant size that overcomes the user need of 20% and a hydrogen generator nominal power equal to 60% of the PV peak power, was considered. When setting to 0.6 and to 1.2, for both of 0.25 and 0.5, the equipment costs can be roughly allocated as 60% to the hydrogen section and 40% to PV and batteries, and, in general, the fuel cell is about 10% of the total costs. As stated before, all the supposed costs are expected to decrease in the future, for instance, PV cost is already about 800 USD/kW in India’s market and is continuously decreasing each year [26], and battery costs are expected to continuously decrease from a dynamic market that involves mobility. Similarly, hydrogen generators are expected to decrease in cost down to 200–900 USD/kW in the long term due to a renewed interested in the hydrogen economy, not only for electricity production but also as an energy carrier that can be introduced to the natural gas network.
Following this analysis, Figure 14 shows a range of cost reductions compared to the current costs for both the hydrogen section (production, storage, and use) and PV systems with batteries. A LCOE comparable to the cost of electricity in Italy, which is about 200–220 EUR/MWh, was achieved only with a reduction in the cost of both sections of at least 40% for a = 0.25. In the case of a of 0.5, the reduction should be at least 20% for PV and batteries and 25% for the hydrogen section. Mainly, a higher ratio leads to a greater chance for these plants to be profitable, and a ratio of 0.5 could make a plant with a SSR of about 80% profitable if an appropriate public grant is introduced.
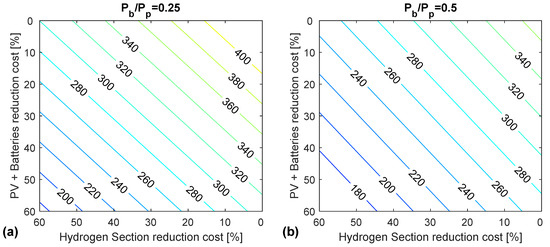
Figure 14.
Sensitive analysis on LCOE (expressed in (EUR/MWh)) for different hydrogen section (hydrogen generator + storage + fuel cell) and PV section (PV + batteries) costs considering a
of 1.2 and equal to 0.6 for (a) = 0.25 and (b) = 0.5.
Case Study Analysis
Finally, a possible case study was analyzed to provide an overview of the main dimensions of the different components. A load profile characterized by a peak load of 100 kW and a base-to-peak load ratio of 0.25 were taken for the case study. The annual energy demand was therefore around 440 MWh. By configurating the hydrogen-based microgrid on the basis of the optimal and values determined in the previous analysis (1.2 and 0.6, respectively,) a PV plant with a nominal power of about 330 kW (33 subarrays of 10 kW each) would be required to cover 120% of the annual energy demanded by the load with a hydrogen generator of about 200 kW nominal power and a fuel cell of 100 kW. The PV annual energy production would therefore be about 520 MWh. If no limitation in the energy storage capacity is introduced, a battery capacity of about 300 kWh and a storage system able to store about 86 kg of hydrogen would be needed. In these conditions, the expected self-sufficiency of the building would be 76.6% with a corresponding levelized cost of energy of about 498 EUR/MWh. If the energy storage capacities are set to cover the 95th percentile of the theoretical requirements, the battery bank capacity decreases to about 90 kWh and the hydrogen storage system should store about 50 kg of hydrogen. In these conditions, the hydrogen section would operate for about 4000 h/year (2160 and 1900 h/year for the hydrogen generator and fuel cell, respectively). A slight reduction in the SSR should occur (75.4%) but the corresponding LCOE would be reduced to about 420 EUR/MWh.
5. Conclusions
In this study, an energy assessment and a preliminary economic analysis were conducted on hydrogen-based microgrids applied to public buildings and small- and medium-sized enterprises (SMEs), characterized by low electricity demand during weekends. A mathematical model was developed to determine the expected annual energy flows and an energy management strategy was proposed with the aim to maximize user self-sufficiency.
The results demonstrated that an efficient and cost-effective design can be obtained with a ratio between the annual energy produced by the PV system and the annual energy requested by the user of about 1.2 and a hydrogen generator nominal power equal to about 60% of the PV nominal power. Particular attention should be paid to the storage section size, since the sizing based on the theoretical requirement (all the excess energy is stored) without introducing any limitation could result in a limited exploitation of the storage capacity, leading to an unprofitable design choice. For this reason, a reduction in the storage capacity to the 98th percentile of the theoretical requirements leads to significant economic benefits without reducing the self-sufficiency of the user. In these conditions, which allow a self-sufficiency ratio of about 80%, a LCOE comparable to the cost of electric energy in Italy is achievable without public grants, only with an important reduction in the initial costs. In particular, a cost reduction of at least 20% for PV and batteries and 25% for the hydrogen section is required to reach grid parity when the ratio between base load and peak load is 0.50, whereas the required cost reduction increases to more than 40% for both sections when the base load to peak load ratio is reduced to 0.25.
Author Contributions
Conceptualization, M.P. and F.S.; methodology, M.P. and F.S.; formal analysis M.L.; writing—original draft preparation M.P., F.S., and M.L.; writing—review and editing, M.P., F.S., M.L., and G.C.; supervision, G.C. All authors have read and agreed to the published version of the manuscript.
Funding
This research received no external funding.
Conflicts of Interest
The funders had no role in the design of the study; in the collection, analyses, or interpretation of data; in the writing of the manuscript, or in the decision to publish the results.
Nomenclature
| Symbols | |
| area (m2) | |
| AC | annual costs (EUR/year) |
| c | specific costs |
| E | energy (Wh) |
| lobal irradiance (W/m2) | |
| mass flow rate (kg/s) | |
| LCOE | levelized cost of energy (EUR/Wh) |
| LHV | lower heating value (J/kg) |
| P | electric power (W) |
| SOC | state-of-charge (-) |
| T | temperature (°C) |
| t | time (h) |
| TCI | total capital investment (EUR) |
| U | overall heat transfer coefficient (W/(m2 K)) |
| η | efficiency (-) |
| Subscripts | |
| A | ambient conditions |
| B | battery |
| BC | battery charging |
| BD | battery discharging |
| b | base load |
| FC | fuel cell |
| HG | hydrogen generator |
| H2 | hydrogen |
| NOCT | nominal operating cell temperature |
| nom | nominal conditions |
| PV | photovoltaic |
| U | user |
References
- Dawood, F.; Shafiullah, G.; Anda, M. Stand-Alone Microgrid with 100% Renewable Energy: A Case Study with Hybrid Solar PV-Battery-Hydrogen. Sustainability 2020, 12, 2047. [Google Scholar] [CrossRef]
- Colombo, P.; Saeedmanesh, A.; Santarelli, M.; Brouwer, J. Dynamic dispatch of solid oxide electrolysis system for high renewable energy penetration in a microgrid. Energy Convers. Manag. 2020, 204, 112322. [Google Scholar] [CrossRef]
- Mukherjee, U.; Maroufmashat, A.; Ranisau, J.; Barbouti, M.; Trainor, A.; Juthani, N.; El-Shayeb, H.; Fowler, M. Techno-economic, environmental, and safety assessment of hydrogen powered community microgrids; case study in Canada. Int. J. Hydrogen Energy 2017, 42, 14333–14349. [Google Scholar] [CrossRef]
- REMOTE Project—Just Another WordPress Site. Available online: https://www.remote-euproject.eu/ (accessed on 5 May 2020).
- Shiva Kumar, S.; Himabindu, V. Hydrogen production by PEM water electrolysis—A review. Mater. Sci. Energy Technol. 2019, 2, 442–454. [Google Scholar] [CrossRef]
- Maleki, A.; Askarzadeh, A. Comparative study of artificial intelligence techniques for sizing of a hydrogen-based stand-alone photovoltaic/wind hybrid system. Int. J. Hydrogen Energy 2014, 39, 9973–9984. [Google Scholar] [CrossRef]
- El-Shafie, M.; Kambara, S.; Hayakawa, Y. Hydrogen Production Technologies Overview. J. Power Energy Eng. 2019, 7, 107–154. [Google Scholar] [CrossRef]
- Yilanci, A.; Dincer, I.; Ozturk, H.K. A review on solar-hydrogen/fuel cell hybrid energy systems for stationary applications. Prog. Energy Combust. Sci. 2009, 35, 231–244. [Google Scholar] [CrossRef]
- Hydrogen-Based Microgrid Demonstration Project Successfully Completed—FuelCellsWorks. Available online: https://fuelcellsworks.com/news/hydrogen-based-microgrid-demonstration-project-successfully-completed/ (accessed on 29 April 2020).
- Cau, G.; Cocco, D.; Petrollese, M.; Knudsen Kær, S.; Milan, C. Energy management strategy based on short-term generation scheduling for a renewable microgrid using a hydrogen storage system. Energy Convers. Manag. 2014, 87, 820–831. [Google Scholar] [CrossRef]
- Raceanu, M.; Bizon, N.; Marinoiu, A.; Varlam, M. Design and Experimental Investigations of an Energy Storage System in Microgrids. In Power Systems; Springer: Berlin/Heidelberg, Germany, 2020; pp. 207–232. [Google Scholar]
- Vivas, F.J.; De las Heras, A.; Segura, F.; Andújar, J.M. A review of energy management strategies for renewable hybrid energy systems with hydrogen backup. Renew. Sustain. Energy Rev. 2018, 82. [Google Scholar] [CrossRef]
- Castilla, M.; Bordons, C.; Visioli, A. Event-based state-space model predictive control of a renewable hydrogen-based microgrid for office power demand profiles. J. Power Sources 2020, 450, 227670. [Google Scholar] [CrossRef]
- Petrollese, M.; Valverde, L.; Cocco, D.; Cau, G.; Guerra, J. Real-time integration of optimal generation scheduling with MPC for the energy management of a renewable hydrogen-based microgrid. Appl. Energy 2016, 166, 96–106. [Google Scholar] [CrossRef]
- Abid, S.; Alghamdi, T.A.; Haseeb, A.; Wadud, Z.; Ahmed, A.; Javaid, N. An Economical Energy Management Strategy for Viable Microgrid Modes. Electronics 2019, 8, 1442. [Google Scholar] [CrossRef]
- Monforti Ferrario, A.; Vivas, F.J.; Segura Manzano, F.; Andújar, J.M.; Bocci, E.; Martirano, L. Hydrogen vs. Battery in the Long-term Operation. A Comparative Between Energy Management Strategies for Hybrid Renewable Microgrids. Electronics 2020, 9, 698. [Google Scholar] [CrossRef]
- Gunasekaran, M.; Ismail, H.M.; Chokkalingam, B.; Mihet-Popa, L.; Padmanaban, S. Energy Management Strategy for Rural Communities’ DC Micro Grid Power System Structure with Maximum Penetration of Renewable Energy Sources. Appl. Sci. 2018, 8, 585. [Google Scholar] [CrossRef]
- Meteotest Meteonorm Software—Worldwide Irradiation Data. Available online: https://meteonorm.com/en/ (accessed on 21 May 2020).
- Duffie, J.A.; Beckman, W.A.; Worek, W.M. Solar Engineering of Thermal Processes, 4th ed.; John Wiley & Sons Inc.: Hoboken, NJ, USA, 2013; Volume 116, ISBN 1118418123. [Google Scholar]
- SunPower X-Series: X22-360 DC. Available online: https://www.global.sunpower.com/sites/default/files/2019-11/sp_X22_360_345_ds_UK_A4_MC4_527767.pdf (accessed on 2 July 2020).
- ABB PVI-10.0/12.5-TL-OUTD Datasheet. Available online: http://new.abb.com/power-converters-inverters/solar/string/three-phase/pvi-10-0kw-12-5kw (accessed on 28 January 2016).
- Product Info | LG Home Battery RESU13. Available online: https://www.lgessbattery.com/eu/home-battery/product-info.lg (accessed on 2 July 2020).
- International Energy Agency. Projected Costs of Generating Electricity 2015 Edition; OECD Publications: Paris Cedex, France, 2015. [Google Scholar]
- Parra, D.; Valverde, L.; Pino, F.J.; Patel, M.K. A review on the role, cost and value of hydrogen energy systems for deep decarbonisation. Renew. Sustain. Energy Rev. 2019, 101, 279–294. [Google Scholar] [CrossRef]
- International Energy Agency. The Future of Hydrogen Seizing Today’s Opportunities, Prepared for the G20; IEA Publications: France, 2019; Available online: https://www.iea.org/ (accessed on 14 June 2020).
- IRENA International Renewable Energy Agency. Renewable Power Generation Costs in 2018; International Renewable Energy Agency: Abu Dhabi, United Arab Emirates, 2018; ISBN 978-92-9260-040-2. [Google Scholar]
- Battelle Memorial Institute. Manufacturing Cost Analysis of 100 and 250 kW Fuel Cell Systems for Primary Power and Combined Heat and Power Applications; Battelle Memorial Institute: Columbus, OH, USA, 2016. [Google Scholar]
- Carmo, M.; Fritz, D.L.; Mergel, J.; Stolten, D. A comprehensive review on PEM water electrolysis. Int. J. Hydrog. Energy 2013, 38, 4901–4934. [Google Scholar] [CrossRef]
- Parks, G.; Boyd, R.; Cornish, J.; Remick, R.; Review Panel, I. Hydrogen Station Compression, Storage, and Dispensing Technical Status and Costs: Systems Integration; National Renewable Energy Laboratory: Denver, CO, USA, 2020. [Google Scholar]


© 2020 by the authors. Licensee MDPI, Basel, Switzerland. This article is an open access article distributed under the terms and conditions of the Creative Commons Attribution (CC BY) license (http://creativecommons.org/licenses/by/4.0/).