Optimal Design of Isolated Mini-Grids with Deterministic Methods: Matching Predictive Operating Strategies with Low Computational Requirements


Abstract
:1. Introduction
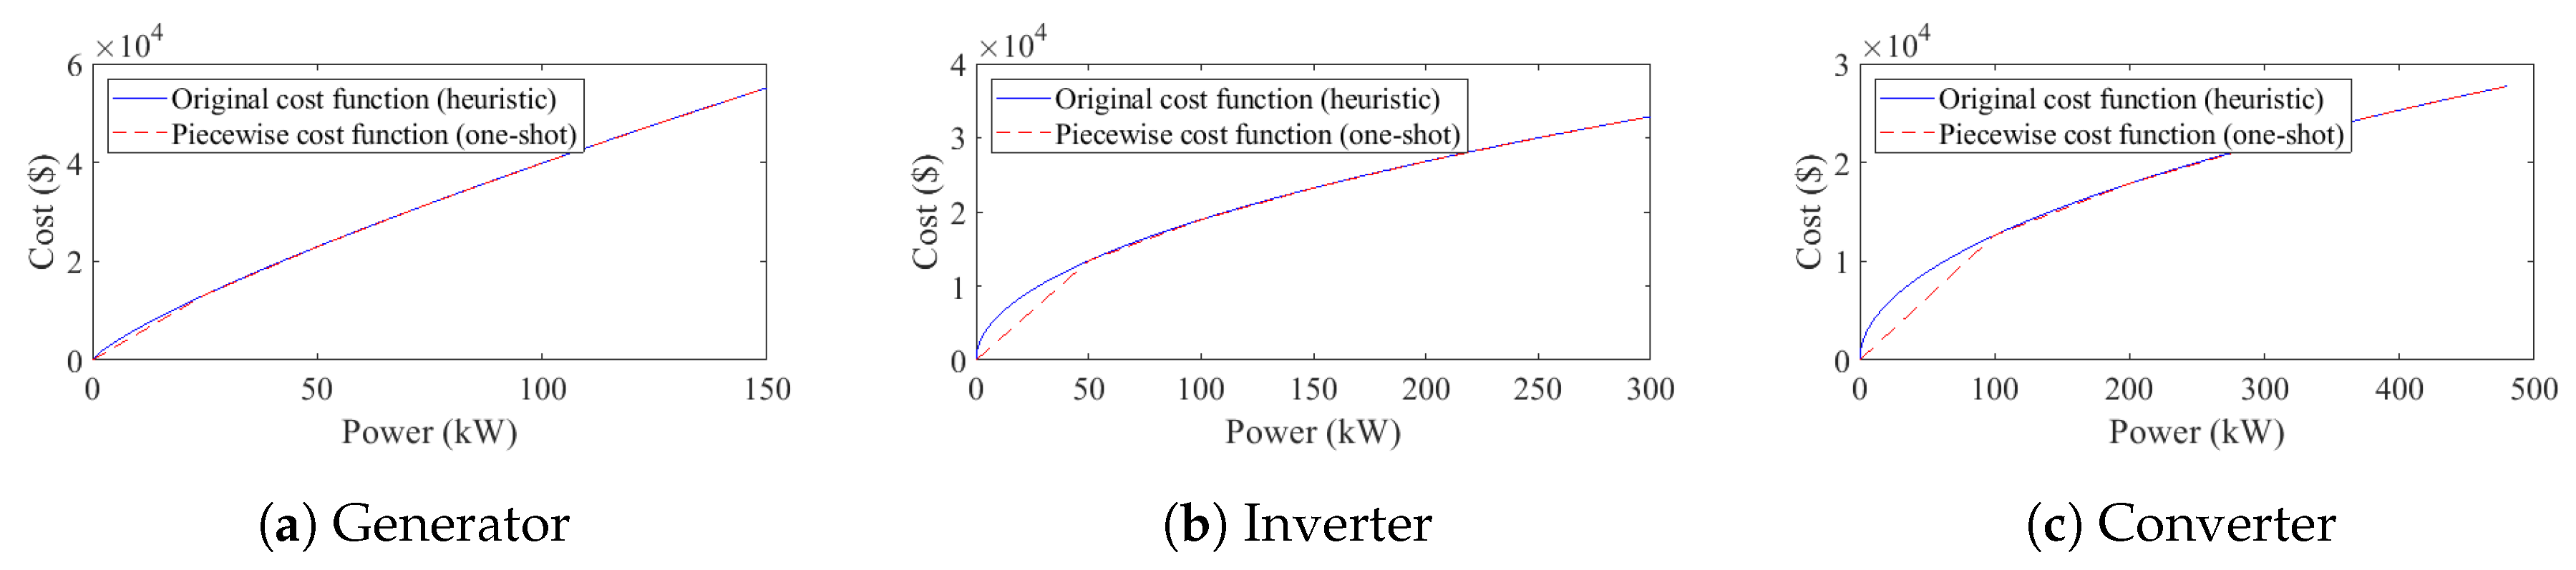
2. One-Shot (OS) Model
2.1. Description
2.2. Mathematical Formulation
3. Heuristic-Based Sizing Methodologies (LFS, CCS, RHS)
3.1. Description
3.2. Initial Search Space
- The maximum size of the AC inverter and the fuel-fired generator is set to be larger or equal to the yearly peak demand of the load.
- The maximum capacity of the battery is set to be equal to the average daily demand of the load.
- The maximum size of the PV plant is chosen so that the corresponding yearly demand is higher than the yearly demand by a given factor (+50%).
- The maximum size of the battery converter is chosen to be no lower than the capacity of the inverter and of the photovoltaic plant.
- The lower bound of the design of each asset is zero, so that the solver could not install some components.
3.3. Operating Strategies
3.3.1. Load Following Strategy
3.3.2. Cycle Charging Strategy
3.3.3. Rolling Horizon Strategy
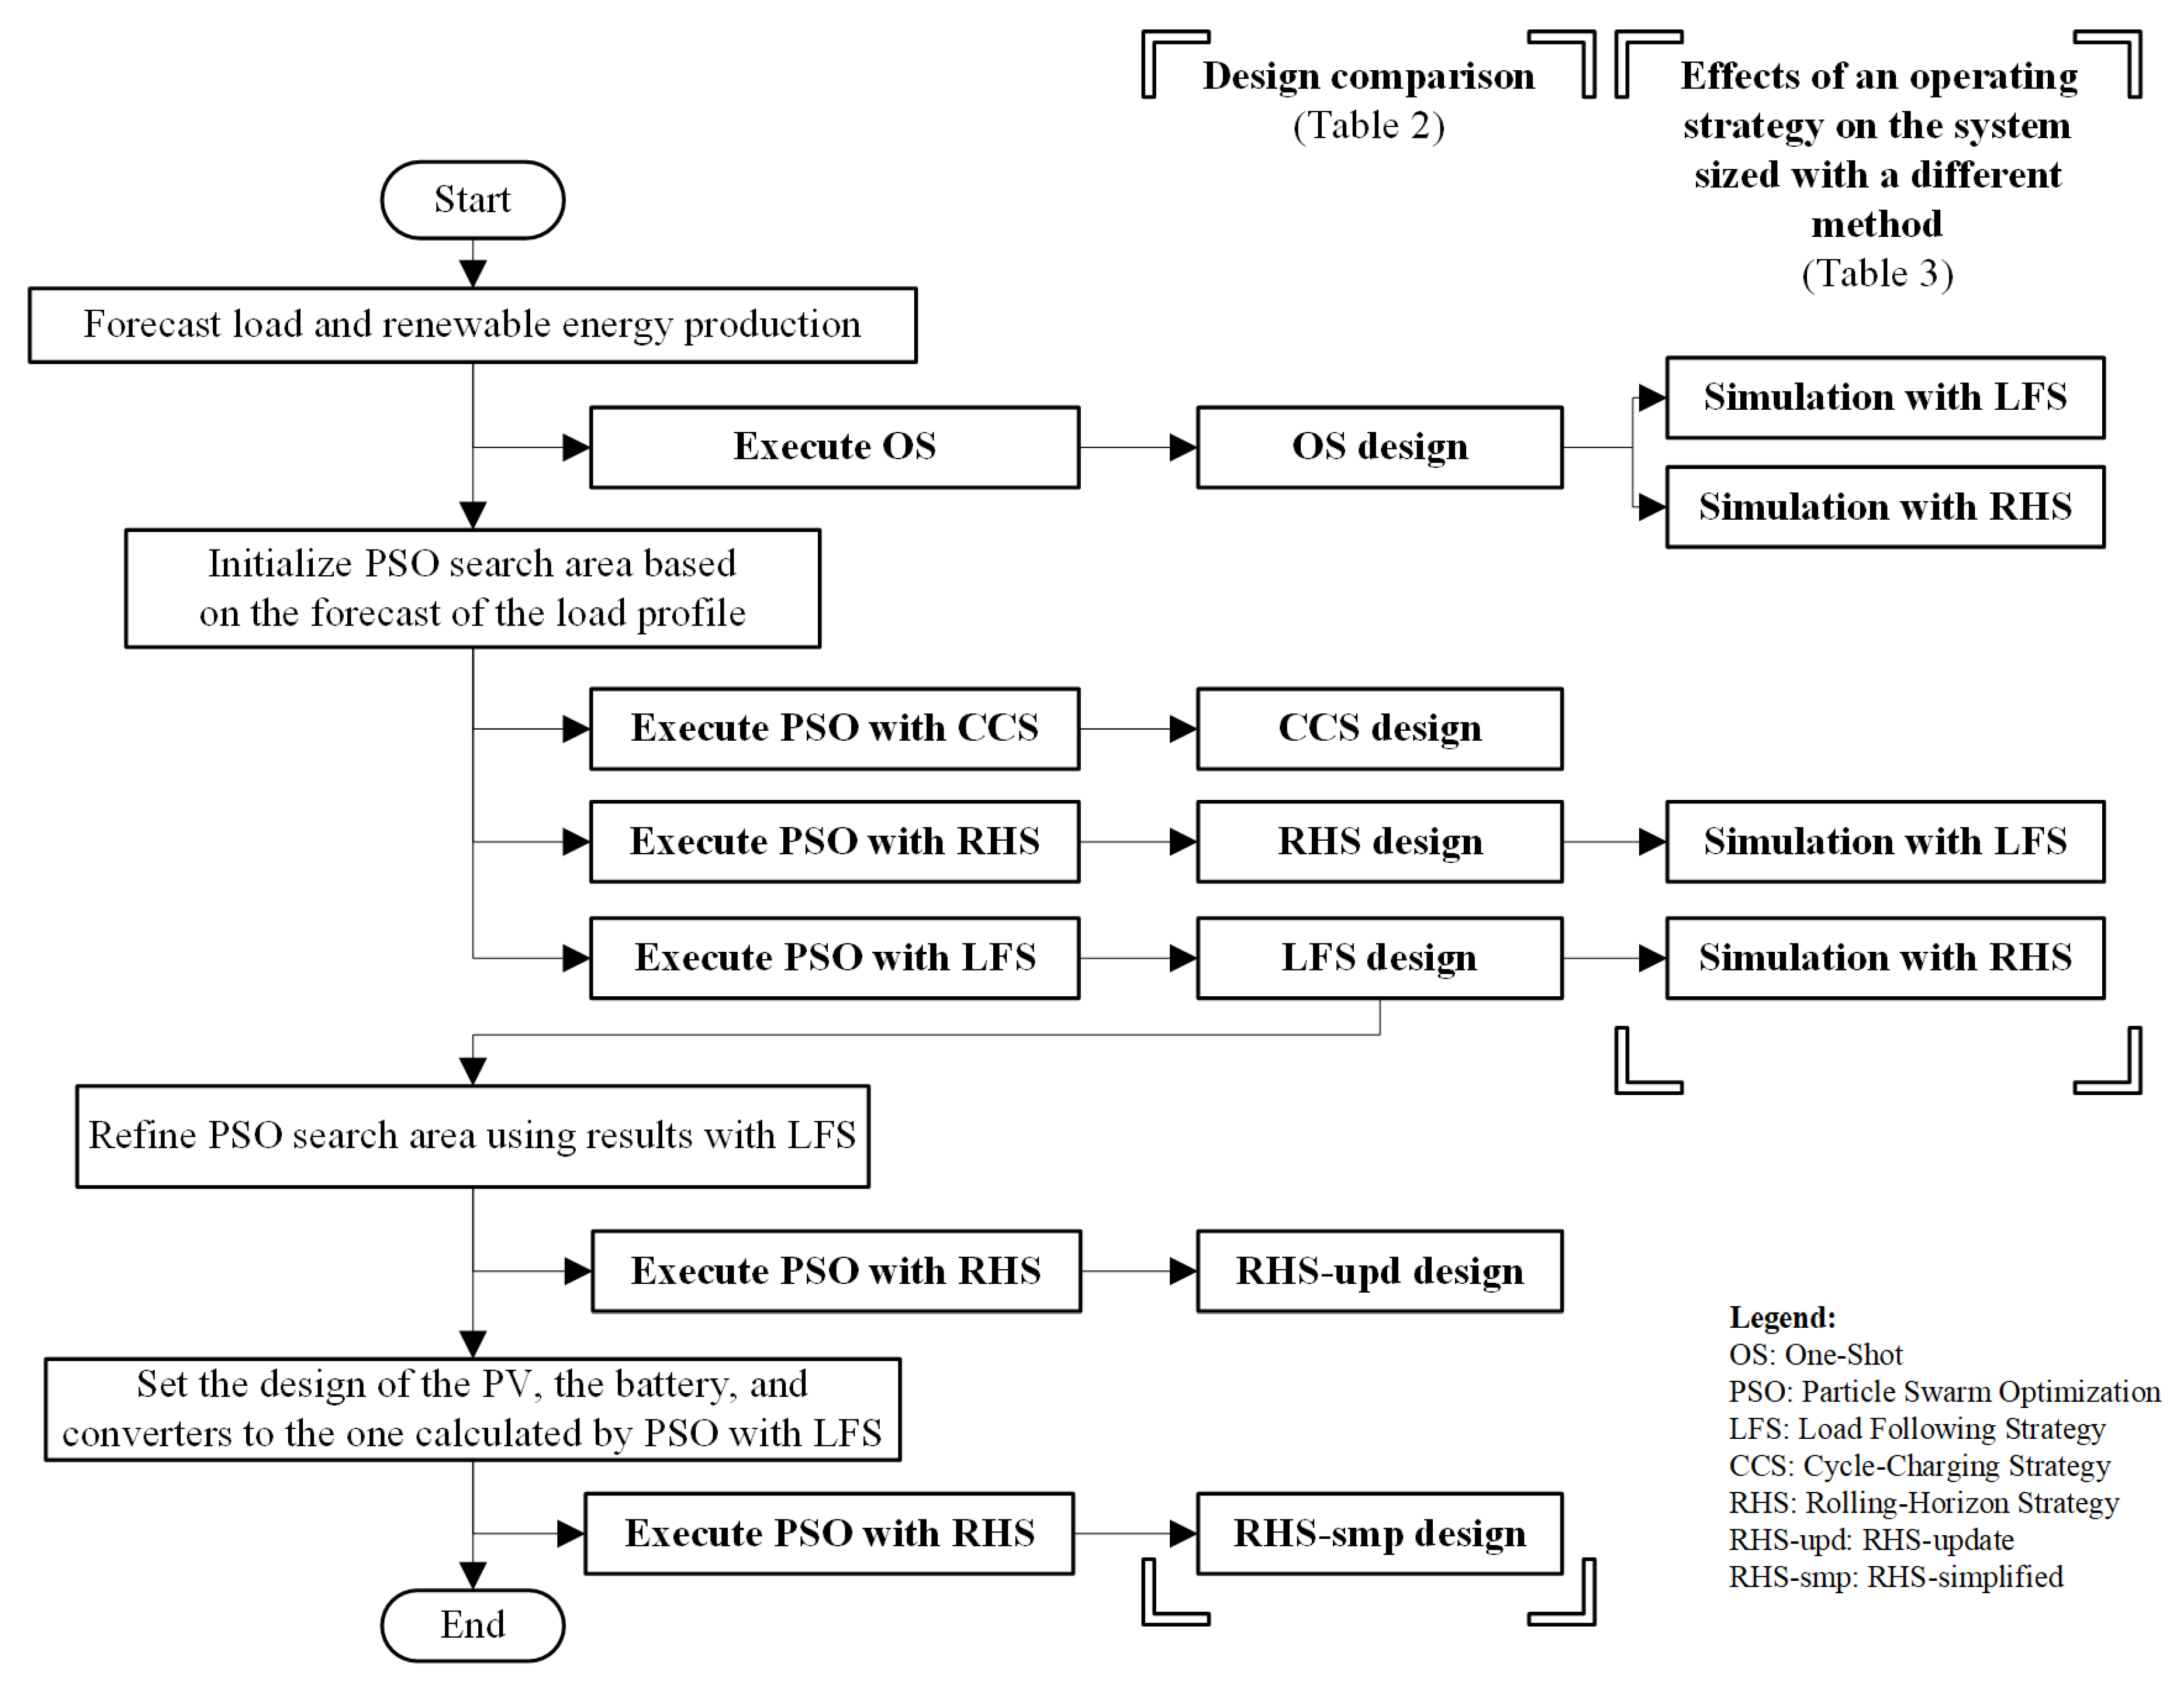
4. Simplified Design Approaches to Reduce Computational Requirements Based on Search Space Update (SSU)
4.1. The General Procedure
4.2. Initial Search Space
4.3. Preliminary Optimization
4.4. Update of the Search Space
- (upd)
- In the case denoted “upd”, the upper and lower bound of the design of each component in the advanced operating strategy is changed to be below or above a given percentage (i.e., 10%) of the design obtained with the simplified priority-list method.
- (smp)
- According to the literature, the sizing of renewable assets, of the battery and of converters sometimes do not change significantly with an advanced operating strategy [35,39], hence it may be better to perform the optimization only on the variables that are considerably affected. Therefore, in this case, denoted “smp”, the sizing of such components is not optimized in the subsequent optimization phase, rather it is fixed; instead, only the other components are optimized, such as the fuel-fired generators.
4.5. Optimization with Advanced Operating Strategies
- RHS-upd: this method uses the sizing obtained with LFS to update the search space to be used by the RHS-integrated PSO methodology. The criteria for the update are:
- For the diesel genset, the upper bound of the search space is set within a given tolerance (i.e., +10%) of the optimal LFS sizing, while the lower bound is kept at 0. In fact, according to [35,39], it can occur that the size of the diesel generator is even halved with respect to the LFS sizing; to be conservative, then, the limit has been put equal to zero.
- RHS-smp: this method brings to extremes the assumptions made for RHS-upd, as it only optimizes the diesel generator size, while the design of the other components is inherited from the LFS results from the first stage. For the diesel generator, the search space is modified with the same criterion: the lower bound is zero, and the upper bound is a 10% increase of the diesel genset sized by the LFS. In this approach, the computational times are expected to decrease even further, by having four less optimization variables, and by the focused reduction of the diesel generator search space.
5. Case Study
5.1. Description
5.2. Solar Irradiation and Load Profiles
5.3. Investment and Maintenance Costs, Component Efficiencies
5.4. Comparing Procedure
5.5. Parameters for the Particle Swarm Optimization
6. Results and Discussion
7. Conclusions
Author Contributions
Funding
Conflicts of Interest
Abbreviations
| CAPEX | Capital Expenditures |
| CCS | Cycle Charging Strategy |
| EV | Electric Vehicle |
| LFS | Load Following Strategy |
| MILP | Mixed-Integer Linear Programming |
| NPC | Net Present Cost |
| OPEX | Operational Expenditures |
| OS | One-Shot |
| PSO | Particle Swarm Optimization |
| RHS | Rolling Horizon Strategy |
| SSU | Search Space Update |
| SDG | Sustainable Development Goal |
| SOC | State Of Charge |
References
- Phimister, E.; Vera-Toscano, E.; Roberts, D. The Dynamics of Energy Poverty: Evidence from Spain. Econ. Energy Environ. Policy 2015, 4, 153–166. [Google Scholar] [CrossRef] [Green Version]
- Winkler, H.; Simões, A.F.; la Rovere, E.L.; Alam, M.; Rahman, A.; Mwakasonda, S. Access and Affordability of Electricity in Developing Countries. World Dev. 2011, 39, 1037–1050. [Google Scholar] [CrossRef]
- Onyeji, I.; Bazilian, M.; Nussbaumer, P. Contextualizing electricity access in sub-Saharan Africa. Energy Sustain. Dev. 2012, 16, 520–527. [Google Scholar] [CrossRef]
- United Nations; UN General Assembly. Transforming our World: The 2030 Agenda for Sustainable Development; Division for Sustainable Development Goals: New York, NY, USA, 2015. [Google Scholar]
- IEA. SDG7: Data and Projections. Available online: https://www.iea.org/reports/sdg7-data-and-projections (accessed on 6 May 2020).
- IEA; IRENA; UNSD; World Bank; WHO. Tracking SDG7: The Energy Progress Report 2020; World Bank: Washington, DC, USA, 2020; p. 171. [Google Scholar]
- Hubble, A.H.; Ustun, T.S. Composition, placement, and economics of rural microgrids for ensuring sustainable development. Sustain. Energy Grids Netw. 2018, 13, 1–18. [Google Scholar] [CrossRef]
- Franz, M.; Peterschmidt, N.; Rohrer, M.; Kondev, B. Mini-Grid Policy Toolkit; Technical Report; EUEI-PDF, ARE and REN21; European Union Energy Initiative Partnership Dialogue Facility (EUEI PDF): Eschborn, Germany, 2014. [Google Scholar]
- RES4Africa Foundation; Field Studies for Mini-Grid Optimization International Research Group; ERM; FAO; RINA; PwC. RE-Thinking Access to Energy Business Models. Ways to Walk the Water-Energy-Food Nexus Talk in Sub-Saharan Africa; Gangemi Editore: Rome, Italy, 2019. [Google Scholar]
- ESMAP. Mini Grids for Half a Billion People: Market Outlook and Handbook for Decision Makers. Executive Summary; Energy Sector Management Assistance Program (ESMAP) Technical Report 014/19; World Bank: Washington, DC, USA, 2019. [Google Scholar]
- International Renewable Energy Agency (IRENA). Innovation Outlook: Renewable Mini-Grids; International Renewable Energy Agency: Abu Dhabi, UAE, 2016; p. 184. [Google Scholar]
- IRENA. Global Renewables Outlook: Energy Transformation 2050, 2020th ed.; International Renewable Energy Agency: Abu Dhabi, UAE, 2020. [Google Scholar]
- Ambrose, H.; Gershenson, D.; Gershenson, A.; Kammen, D. Driving rural energy access: A second-life application for electric-vehicle batteries. Environ. Res. Lett. 2014, 9. [Google Scholar] [CrossRef] [Green Version]
- Goel, S.; Sharma, R. Performance evaluation of stand alone, grid connected and hybrid renewable energy systems for rural application: A comparative review. Renew. Sustain. Energy Rev. 2017, 78, 1378–1389. [Google Scholar] [CrossRef]
- Barley, C.D.; Winn, C.B. Optimal dispatch strategy in remote hybrid power systems. Sol. Energy 1996, 58, 165–179. [Google Scholar] [CrossRef]
- HOMER Energy. HOMER Pro Version 3.13 User Manual. Available online: https://www.homerenergy.com/products/pro/docs/latest/index.html (accessed on 6 May 2020).
- Mandelli, S.; Barbieri, J.; Mereu, R.; Colombo, E. Off-grid systems for rural electrification in developing countries: Definitions, classification and a comprehensive literature review. Renew. Sustain. Energy Rev. 2016, 58, 1621–1646. [Google Scholar] [CrossRef]
- Siddaiah, R.; Saini, R.P. A review on planning, configurations, modeling and optimization techniques of hybrid renewable energy systems for off grid applications. Renew. Sustain. Energy Rev. 2016, 58, 376–396. [Google Scholar] [CrossRef]
- Bernal-Agustín, J.L.; Dufo-López, R. Simulation and optimization of stand-alone hybrid renewable energy systems. Renew. Sustain. Energy Rev. 2009, 13, 2111–2118. [Google Scholar] [CrossRef]
- Energy 4 Impact; INENSUS. Billing, Revenue Collection and Metering Models for Mini-Grids; Technical Report April; Green Mini-Grid Help Desk. 2019. Available online: https://www.energy4impact.org/file/2098/download?token=EcIaPTX_ (accessed on 25 April 2020).
- Barsali, S.; Giglioli, R.; Giuntoli, M.; Lutzemberger, G.; Poli, D. Control strategies and real time operation of storage systems integrated with MV photovoltaic plants. In Proceedings of the 2015 IEEE 15th International Conference on Environment and Electrical Engineering, EEEIC 2015-Conference Proceedings, Rome, Italy, 10–13 June 2015; Institute of Electrical and Electronics Engineers Inc.: Piscataway, NJ, USA, 2015; pp. 243–248. [Google Scholar] [CrossRef]
- Mandelli, S.; Colombo, E.; Merlo, M.; Brivio, C. A methodology to develop design support tools for stand-alone photovoltaic systems in developing countries. Res. J. Appl. Sci. Eng. Technol. 2014, 8, 778–788. [Google Scholar] [CrossRef]
- Al-falahi, M.D.; Jayasinghe, S.D.; Enshaei, H. A review on recent size optimization methodologies for standalone solar and wind hybrid renewable energy system. Energy Conv. Manag. 2017, 143, 252–274. [Google Scholar] [CrossRef]
- Erdinc, O.; Uzunoglu, M. Optimum design of hybrid renewable energy systems: Overview of different approaches. Renew. Sustain. Energy Rev. 2012, 16, 1412–1425. [Google Scholar] [CrossRef]
- Liu, Y.; Yu, S.; Zhu, Y.; Wang, D.; Liu, J. Modeling, planning, application and management of energy systems for isolated areas: A review. Renew. Sustain. Energy Rev. 2018, 82, 460–470. [Google Scholar] [CrossRef]
- Graham, V.A.; Hollands, K.G.T. A method to generate synthetic hourly solar radiation globally. Sol. Energy 1990, 44, 333–341. [Google Scholar] [CrossRef]
- Gambino, V.; Del Citto, R.; Cherubini, P.; Tacconelli, C.; Micangeli, A.; Giglioli, R. Methodology for the Energy Need Assessment to Effectively Design and Deploy Mini-Grids for Rural Electrification. Energies 2019, 12, 574. [Google Scholar] [CrossRef] [Green Version]
- Riva, F.; Ahlborg, H.; Hartvigsson, E.; Pachauri, S.; Colombo, E. Electricity access and rural development: Review of complex socio-economic dynamics and causal diagrams for more appropriate energy modelling. Energy Sustain. Dev. 2018, 43, 203–223. [Google Scholar] [CrossRef]
- Twaha, S.; Ramli, M.A. A review of optimization approaches for hybrid distributed energy generation systems: Off-grid and grid-connected systems. Sustain. Cities Soc. 2018, 41, 320–331. [Google Scholar] [CrossRef]
- Sörensen, K. Metaheuristics-the metaphor exposed. Int. Trans. Oper. Res. 2015, 22, 3–18. [Google Scholar] [CrossRef]
- Brenna, M.; Falvo, M.C.; Foiadelli, F.; Martirano, L.; Poli, D. From Virtual Power Plant (VPP) to Sustainable Energy Microsystem (SEM): An opportunity for buildings energy management. In Proceedings of the 2015 IEEE Industry Applications Society Annual Meeting, Addison, TX, USA, 18–22 October 2015; Volume 6, pp. 1–8. [Google Scholar] [CrossRef]
- Carrión, M.; Arroyo, J.M. A computationally efficient mixed-integer linear formulation for the thermal unit commitment problem. IEEE Trans. Power Syst. 2006, 21, 1371–1378. [Google Scholar] [CrossRef]
- Li, B.; Roche, R.; Miraoui, A. Sizing of a stand-alone microgrid considering electric power, cooling/heating and hydrogen. In Proceedings of the 2017 IEEE Manchester PowerTech, Manchester, UK, 18–22 June 2017; IEEE: Piscataway, NJ, USA, 2017; pp. 1–6. [Google Scholar] [CrossRef] [Green Version]
- Malheiro, A.; Castro, P.M.; Lima, R.M.; Estanqueiro, A. Integrated sizing and scheduling of wind/PV/diesel/battery isolated systems. Renew. Energy 2015, 83, 646–657. [Google Scholar] [CrossRef] [Green Version]
- Fioriti, D.; Poli, D.; Cherubini, P.; Lutzemberger, G.; Micangeli, A.; Duenas-Martinez, P. Comparison among deterministic methods to design rural mini-grids: Effect of operating strategies. In Proceedings of the IEEE PowerTech 2019, Milan, Italy, 23–27 June 2019; pp. 1–6. [Google Scholar] [CrossRef]
- Mazzola, S.; Vergara, C.; Astolfi, M.; Li, V.; Perez-Arriaga, I.; Macchi, E. Assessing the value of forecast-based dispatch in the operation of off-grid rural microgrids. Renew. Energy 2017, 108, 116–125. [Google Scholar] [CrossRef]
- Chauhan, A.; Saini, R.P. A review on Integrated Renewable Energy System based power generation for stand-alone applications: Configurations, storage options, sizing methodologies and control. Renew. Sustain. Energy Rev. 2014, 38, 99–120. [Google Scholar] [CrossRef]
- Ahmad Khan, A.; Naeem, M.; Iqbal, M.; Qaisar, S.; Anpalagan, A. A compendium of optimization objectives, constraints, tools and algorithms for energy management in microgrids. Renew. Sustain. Energy Rev. 2016, 58, 1664–1683. [Google Scholar] [CrossRef]
- Fioriti, D.; Lutzemberger, G.; Poli, D.; Micangeli, A.; Duenas-Martinez, P. Optimal design of off-grid power systems operated by a rolling-horizon strategy: A method to reduce computational requirements. In Proceedings of the 5th International Forum on Research and Technologies for Society and Industry: Innovation to Shape the Future, RTSI 2019-Proceedings, Florence, Italy, 9–12 September 2019; pp. 202–207. [Google Scholar] [CrossRef]
- Moretti, L.; Astolfi, M.; Vergara, C.; Macchi, E.; Pérez-Arriaga, J.I.; Manzolini, G. A design and dispatch optimization algorithm based on mixed integer linear programming for rural electrification. Appl. Energy 2019, 233–234, 1104–1121. [Google Scholar] [CrossRef]


| Strategy | Bounds | PV | Battery | DC/DC | Inverter | Diesel Generator |
|---|---|---|---|---|---|---|
| (kW) | (kWh) | (kW) | (kW) | (kW) | ||
| LFS, CCS, RHS | Lower Bound | 0 | 0 | 0 | 0 | 0 |
| Upper Bound | 900 | 3000 | 900 | 300 | 300 | |
| RHS-upd | Lower Bound | LFS sizing −10% | 0 | |||
| Upper Bound | LFS sizing +10% | LFS sizing +10% | ||||
| RHS-smp | Lower Bound | none-value set to LFS solution | 0 | |||
| Upper Bound | none-value set to LFS solution | LFS sizing +10% | ||||
| Strategy | Ex. time | NPC | CAPEX | OPEX | Load cur. | Gen. | PV | Batt. | DC/DC | Inv. | Gen. | |
|---|---|---|---|---|---|---|---|---|---|---|---|---|
| (min) | (k$) | (k$) | (k$) | (%) | (%) | (kWp) | (kWh) | (kW) | (kW) | (kW) | (%) | |
| LFS | 1.8 | 1848 | 1421 | 427 | 0.19 | 7.0 | 754 | 2053 | 388 | 212 | 121 | - |
| CCS | 1.8 | 1837 | 1422 | 415 | 0.14 | 7.2 | 754 | 2060 | 385 | 209 | 120 | 20.57 |
| RHS | 166 | 1790 | 1351 | 439 | 0.02 | 9.0 | 734 | 1949 | 390 | 187 | 71 | - |
| RHS-upd | 111 | 1790 | 1345 | 445 | 0.01 | 9.3 | 730 | 1941 | 380 | 191 | 72 | - |
| RHS-smp | 13 | 1795 | 1404 | 391 | 0.02 | 7.2 | 754 | 2053 | 381 | 210 | 70 | - |
| OS | 403 | 1796 | 1352 | 444 | 0.16 | 11.3 | 725 | 1987 | 460 | 200 | 50 | - |
| Simulation | Design | NPC | NPC 1(±%) | CAPEX | OPEX | Load Curt. | Gen. | ||
|---|---|---|---|---|---|---|---|---|---|
| Strategy | Obtained with | (k$) | w.r.t. RHS | w.r.t. LFS | w.r.t. OS | (k$) | (k$) | (%) | (%) |
| RHS | LFS | 1814 | +1.3% | −1.8% | +1.0% | 1421 | 393 | 0.00 | 7.2 |
| RHS | 1790 2 | Ref. RHS | −3.1% | −0.33% | 1351 | 439 | 0.02 | 9.0 | |
| OS | 1808 | +1.0% | −2.2% | +0.67% | 1352 | 456 | 0.34 | 8.5 | |
| LFS | LFS | 1848 2 | +3.2% | Ref. LFS | +2.9% | 1421 | 427 | 0.19 | 7.0 |
| RHS | 1972 | +10.2% | +6.7% | +9.8% | 1351 | 621 | 2.43 | 6.6 | |
| OS | 2072 | +15.8% | +12.1% | +15.4% | 1352 | 720 | 4.03 | 4.8 | |
| OS | OS | 1796 2 | +0.34% | −2.8% | Ref. OS | 1314 | 487 | 0.07 | 12.0 |
© 2020 by the authors. Licensee MDPI, Basel, Switzerland. This article is an open access article distributed under the terms and conditions of the Creative Commons Attribution (CC BY) license (http://creativecommons.org/licenses/by/4.0/).
Share and Cite
Micangeli, A.; Fioriti, D.; Cherubini, P.; Duenas-Martinez, P. Optimal Design of Isolated Mini-Grids with Deterministic Methods: Matching Predictive Operating Strategies with Low Computational Requirements. Energies 2020, 13, 4214. https://doi.org/10.3390/en13164214
Micangeli A, Fioriti D, Cherubini P, Duenas-Martinez P. Optimal Design of Isolated Mini-Grids with Deterministic Methods: Matching Predictive Operating Strategies with Low Computational Requirements. Energies. 2020; 13(16):4214. https://doi.org/10.3390/en13164214
Chicago/Turabian StyleMicangeli, Andrea, Davide Fioriti, Paolo Cherubini, and Pablo Duenas-Martinez. 2020. "Optimal Design of Isolated Mini-Grids with Deterministic Methods: Matching Predictive Operating Strategies with Low Computational Requirements" Energies 13, no. 16: 4214. https://doi.org/10.3390/en13164214
APA StyleMicangeli, A., Fioriti, D., Cherubini, P., & Duenas-Martinez, P. (2020). Optimal Design of Isolated Mini-Grids with Deterministic Methods: Matching Predictive Operating Strategies with Low Computational Requirements. Energies, 13(16), 4214. https://doi.org/10.3390/en13164214