2.1. Tank-to-Wheel (TTW) Analysis
The procedure used to test the energy performance of different powertrains has shown full applicability and solid reliability [
5,
6].
The test path, planned in metropolitan area of Rome, Italy, is designed to be in line with average per capita daily driving profile in Italy (length, time, road type distribution), as reported by the ISFORT mobility reports 2017 [
11], 2018 [
12], and 2019 [
13], generally considered as a reference in Italy for this kind of data.
The test drives were made on five cars available on the market, equipped with a different electrification level of powertrain and characterized as shown in
Table 1.
As can be seen in
Table 1 the vehicles have been selected with quite similar specifications in terms of power and mass.
The powertrains have a range of electrification level, from 0 to 1. Level 0 is assigned to the two vehicles with conventional ICE and no electric aid to the traction, level 1 is given to the BEV, and the two hybrids have an electrification level between 0 and 1.
Considering hybrid vehicles, the hybridization ratio is considered as an electrification level. The hybridization ratio is the ratio between the power of the electric motor and the sum of the power of the electric motor and the engine, and is widely used in literature, [
14,
15,
16,
17]. The Toyota Yaris hybrid has a level of electrification higher than the Toyota Prius. Nevertheless, the experimental analysis on the behavior of vehicles in real drive conditions, with particular regard to the ZEV mode operation of the two vehicles [
9], has shown the Prius operates in ZEV much more frequently than the Yaris.
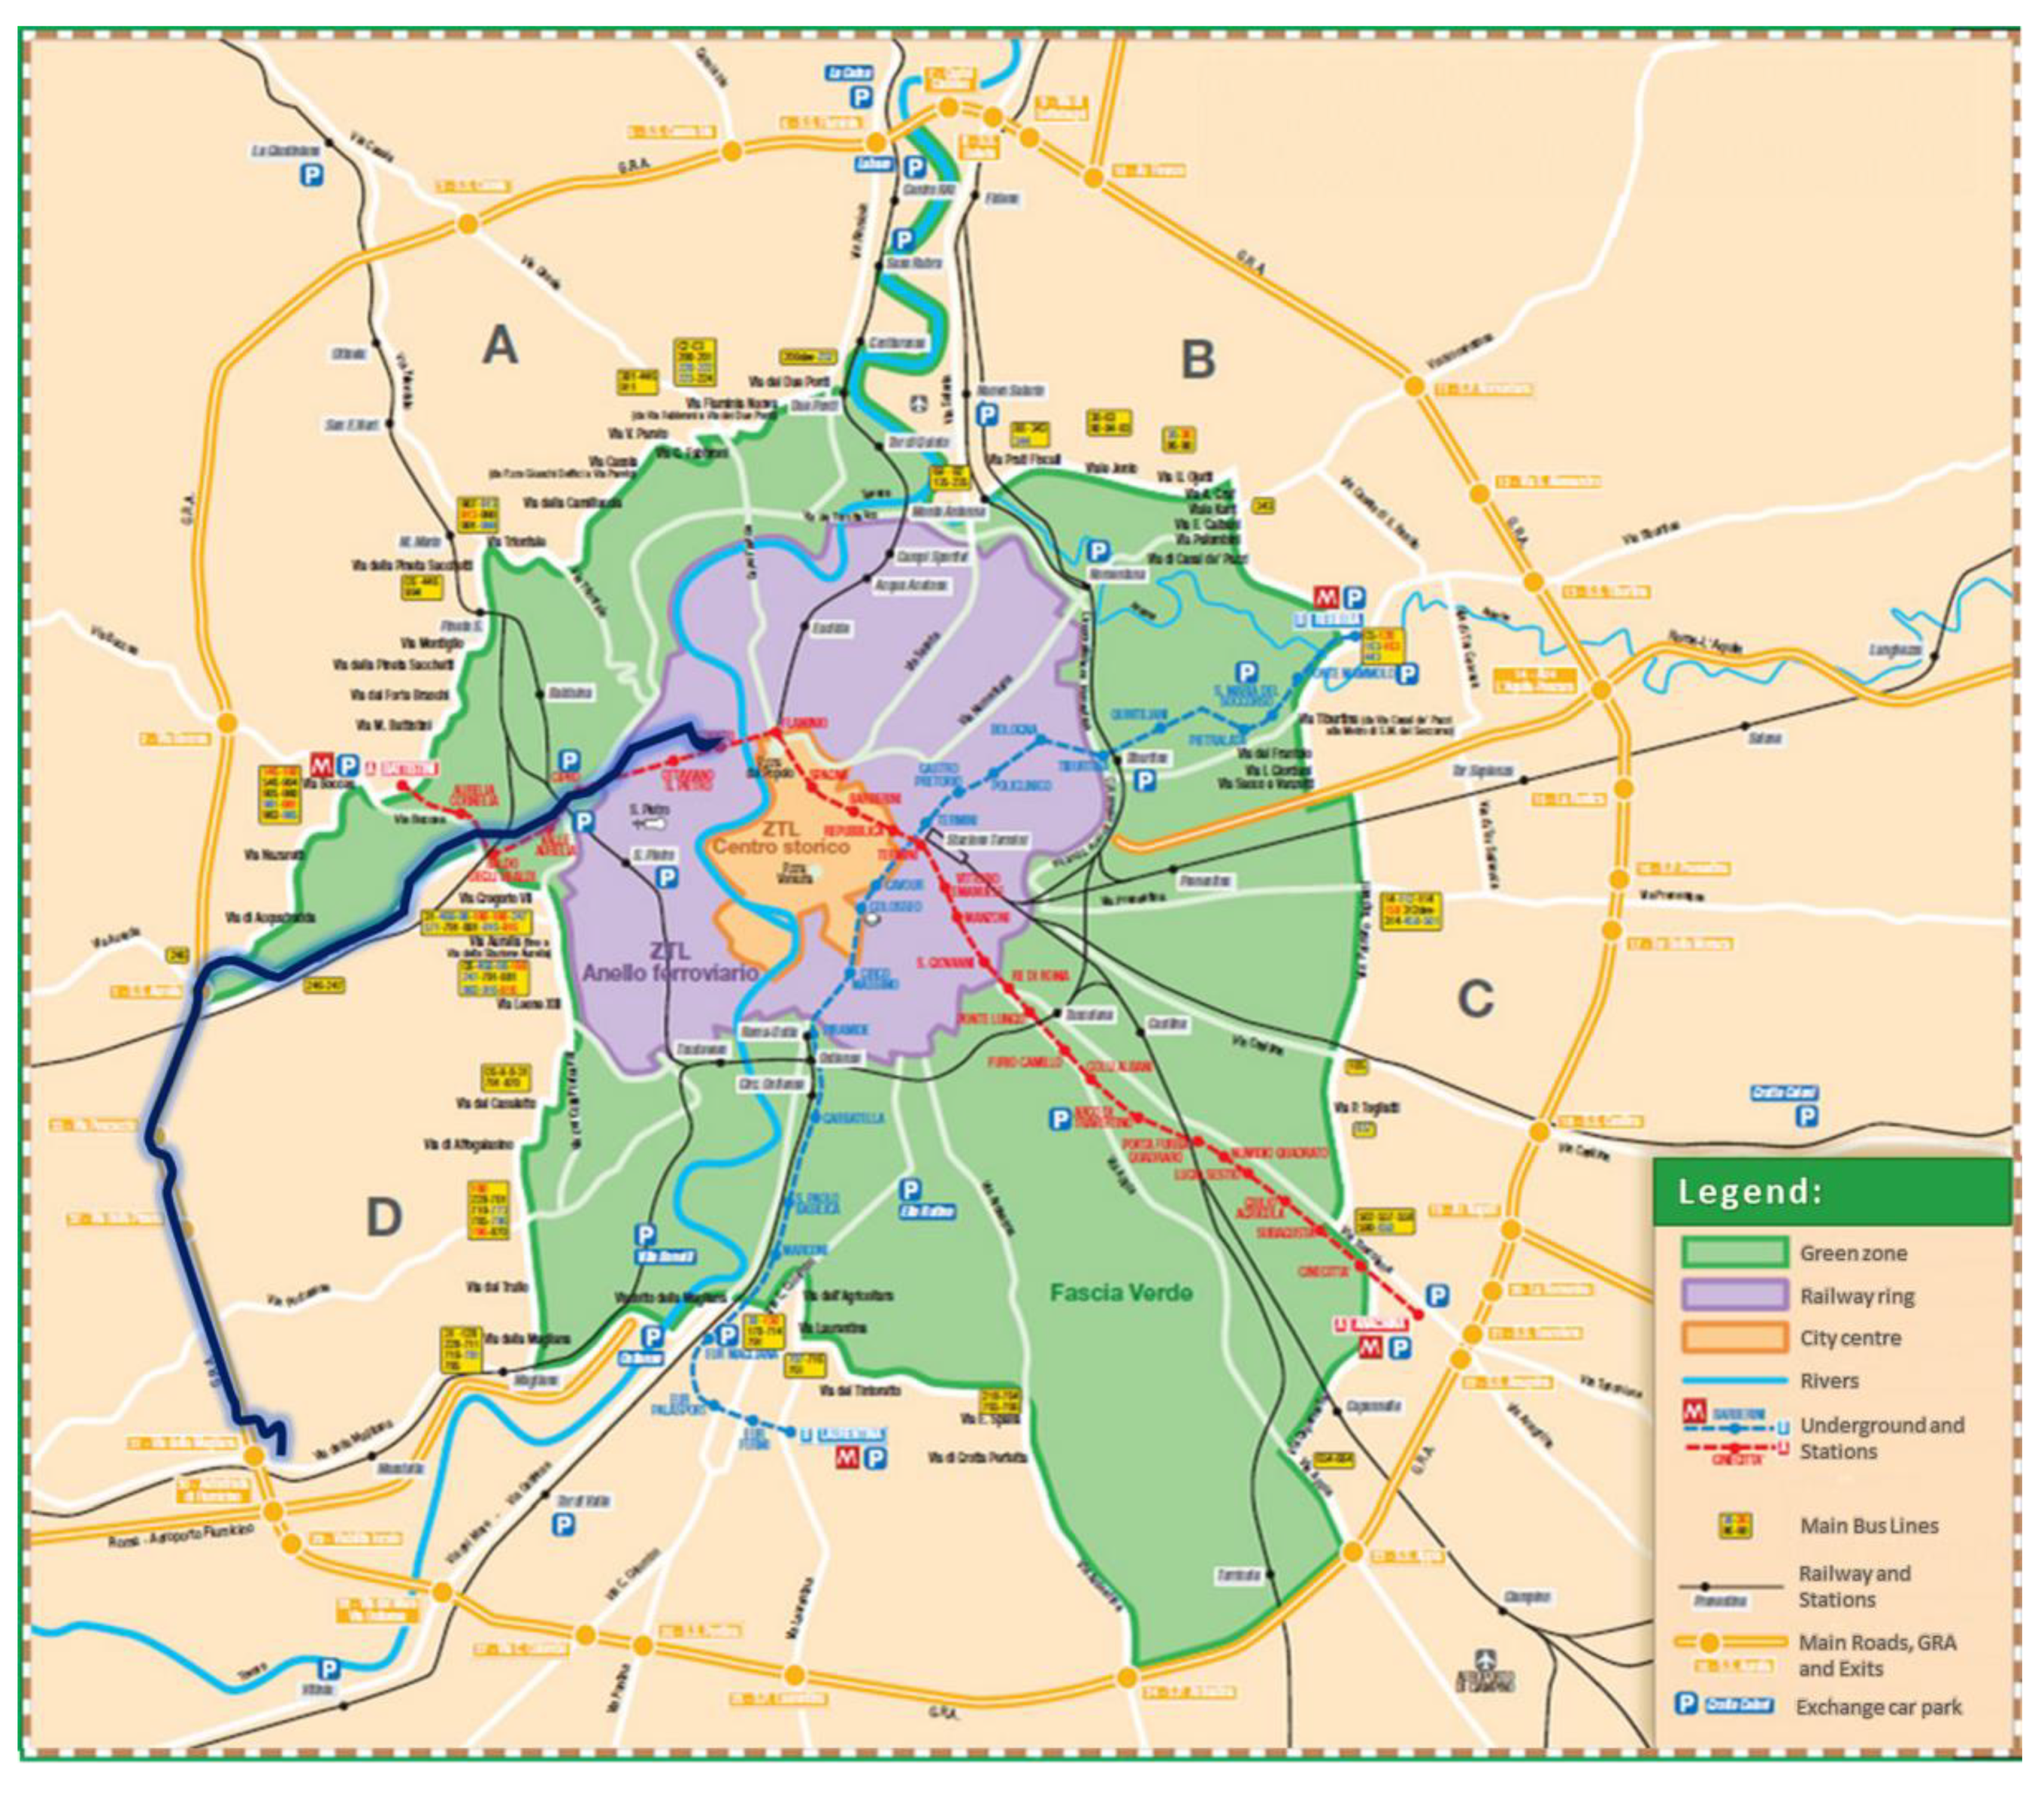
Two test paths have been designed and used for the experimental activity: Urban and extra-urban/highway. The urban test path has high (
Figure 2) and low (
Figure 3) traffic density sections. The two urban sections are located in the so-called “green traffic area” and “railway ring area” (green and purple areas, respectively, in
Figure 4) of Rome, regularly used as a reference for road traffic restrictions.
The extra-urban/highway test path is shown in
Figure 5 [
9]. The test paths have been assembled considering the average per capita daily travel in Italy, as reported by the ISFORT mobility report [
14]. In the test paths four sections have been identified:
The test conditions were designed considering all the main variables affecting the energy performance, like driving attitude, circulation intensity, and auxiliaries energy request [
18,
19,
20,
21,
22].
The tests were conducted on the routes described above according to our test protocol [
8] which includes:
Compliance with speed limits;
Drivers clustered by gender and age (to take into account different driving styles);
Three tests in three different time slots for each driver (10:00–13:30–15:00);
Tests carried out on standard traffic days, i.e., not on holidays, or holiday periods (Christmas, Easter, July–August);
Auxiliaries (for example air conditioning) turned off;
Eco-mode (when selectable).
As the objective of the study was not to analyze the energy result on a specific driving cycle, but in generally meaningful conditions, a large number of tests has been made on the same path with comparable traffic conditions (considering time, day of the week) and the tests were analyzed mainly considering the average speed.
The energy performance is assessed exclusively referring to real time measured values, and related calculations; consumption and/or efficiency models of the vehicles analyzed have not been used.
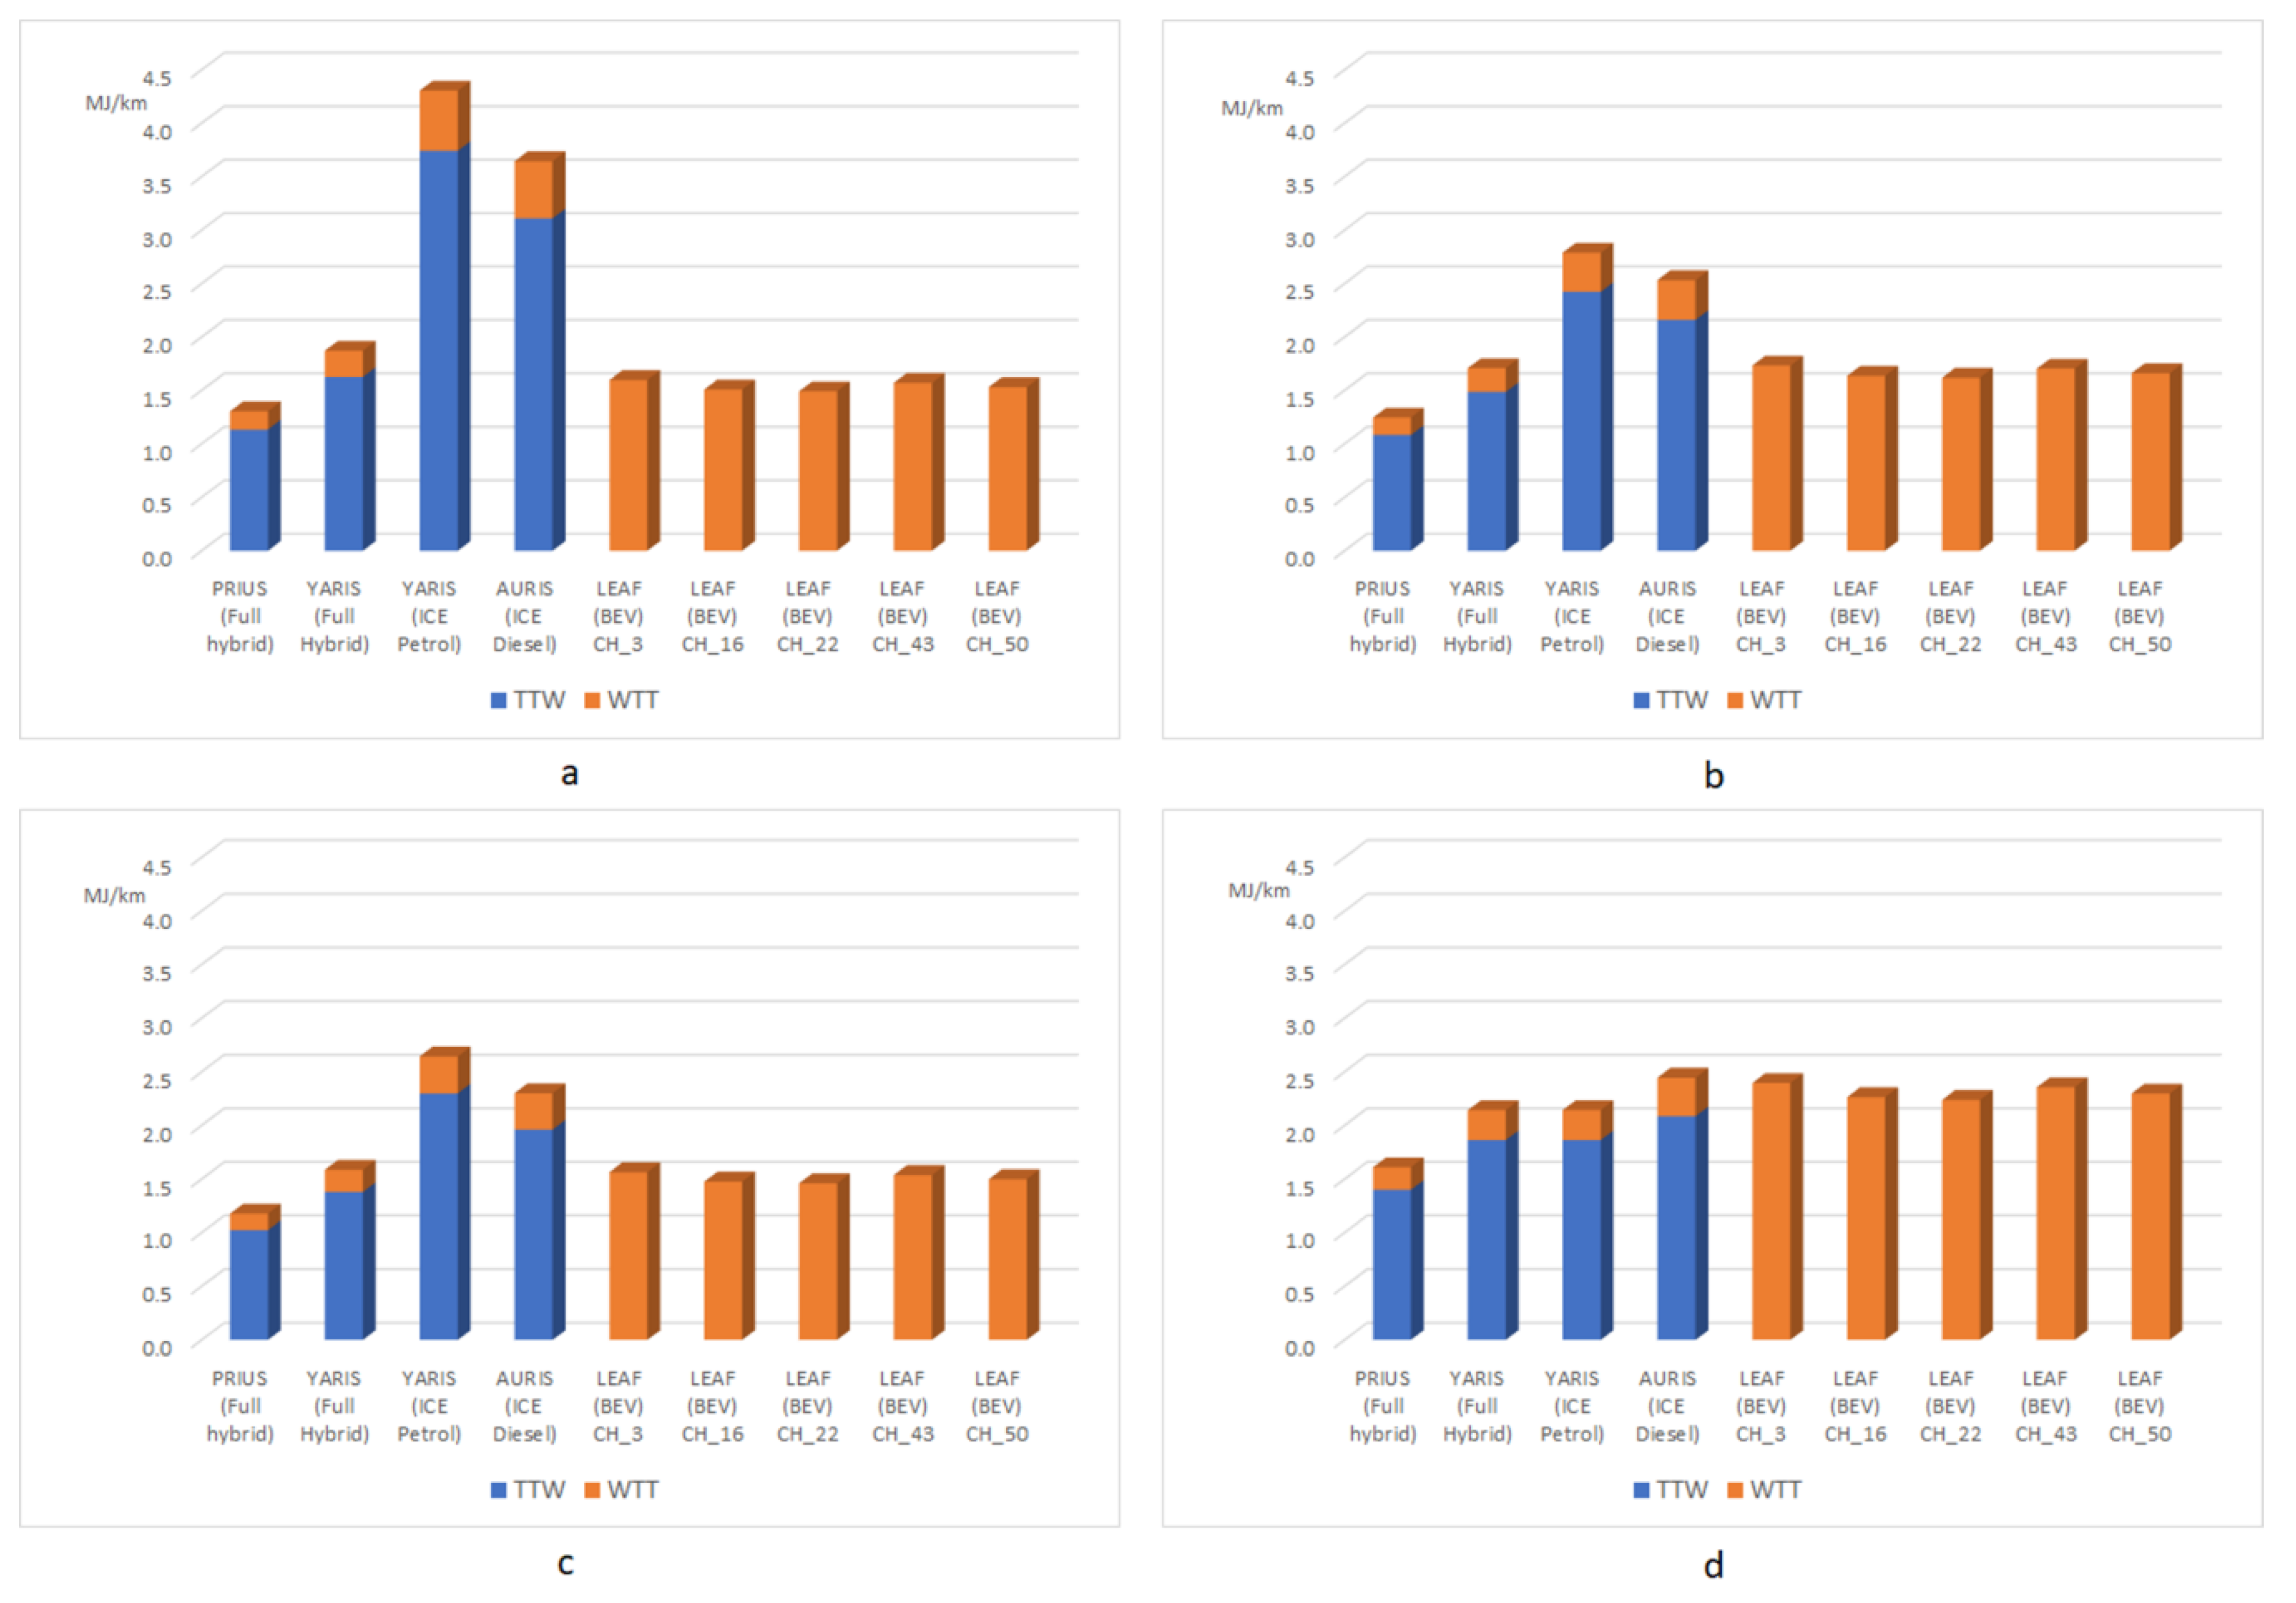
Figure 6 illustrates the energy consumption (MJ/km) of the tested vehicles found in the experimental acquisition campaign in the test run in the different sections it is divided into. The Leaf BEV had the lowest energy consumption thanks to the greater efficiency of the traction system: −114% compared to Full HEV Prius, −193% compared to Full HEV Yaris, −376% compared to Yaris ICE petrol, and −330% compared to Auris ICE Diesel. Lower consumption occurred in urban with high traffic density sections (0.47 MJ/km) and remained substantially unchanged for urban with low traffic intensity sections (0.52 MJ/km, +8.5%) and extra-urban sections (0.46 MJ/km, −2.1%), and increased significantly in the highway sections (0.71 MJ/km, +50%). Consumption of the two Full HEV vehicles (Prius and Yaris) showed completely similar trends; the lower consumption of the Prius was due to the greater efficiency thanks to the higher braking energy recovery capacity of the Prius [
9].
Compared to conventional ICE vehicles, the two full HEVs had low energy consumption in urban with high traffic density sections (1.13 MJ/km Prius and 1.63 MJ/km Yaris); these consumptions decreased passing to urban with low traffic density sections (1.08 MJ/km, −4%, Prius and 1.49 MJ/km, −9%, Yaris) and presented a minimum in the extra-urban stretches (1.02 MJ/km, −10%, Prius and 1.38 MJ/km, −15%, Yaris) thanks to the greater contribution of regenerative braking which increased the efficiency of the hybrid traction system. The energy consumption of full HEVs vehicles increased in the highway sections (1.40 MJ/km, +23%, Prius, and 1.86 MJ/km, +14%, Yaris) where they were similar to those of conventional ICE vehicles.
The two conventional ICE vehicles had high energy consumption in urban areas with high traffic density (3.47 MJ/km Yaris petrol and 3.11 MJ/km Auris Diesel) due to the low efficiency of the thermal engine at low engine speeds; these consumptions decreased significantly passing to urban sections with low traffic density (2.42 MJ/km, −35% Yaris petrol, and 2.16 MJ/km, −31%, Auris Diesel) and extra-urban sections (2.30 MJ/km, −39% Yaris petrol, and 1.96 MJ/km, −37%, Auris Diesel). Turning to the motorway sections, the consumption of the Yaris decreased compared to the extra-urban sections (1.86 MJ/km, −19%), while those of Auris Diesel remained almost constant but slightly increasing (2.09 MJ/km, +6%).
For the car models fueled by fossil fuels, the mileage (ML (g/km)) was obtained from data acquisition, while for the electric vehicle the value measured was the need of electricity (EC (MJ/km)).
Consumption was calculated from data acquired by the vehicle control unit via the OBD interface with a PC with suitable software for reading and storing the selected data. In vehicles powered by fossil fuel, the data stored was the flow rate (g/s) of fuel, while for the electric vehicle it was the electrical power (voltage and current) supplied by the traction battery pack.
From the mileage the energy consumption was calculated considering the low heating value (LHV) (MJ/kg):
Starting from energy consumption, TTW NRPEC and the TTW GHG (
Figure 1) were obtained considering a non-renewable primary energy consumption factor f
NR and GHG emission factor f
GHG (g/MJ) identified considering national standard parameters [
23].
Table 2 shows the values of the low heating value, non-renewable primary energy consumption factor, and GHG emission factor for the energy vectors used [
23].


