Abstract
Over recent years, a technological revolution has taken place in which conventional lighting has been replaced by light emitting diodes (LEDs). Some studies have shown the possibility that blue light from these artificial sources could have deleterious effects on the retina. Considering that people spend a non-negligible time in front of screens from computers and mobile phones, the eyes receive blue light of different intensities depending on the source. Nevertheless, any study about the visual and non-visual effects of blue light must consider precise measurements taken from actual artificial sources. For this reason, we have analyzed the spectral emission of 10 different electronic devices and weighted them according to the hazard caused by blue light to the eyes, comparing the results with solar radiation simulated with a radiative transfer model. The maximum spectral irradiance of the measured electronic devices at 10 cm from the detector was located between 440 nm and 460 nm. The irradiance for blue light hazard ranged from 0.008 to 0.230 Wm−2 depending on the particular characteristics of each electronic device. In contrast, the solar radiances in the same spectral range are larger both under clear and cloudy conditions.
1. Introduction
The rapid development of new technologies arising from scientific research since the end of the 20th century have resulted in the emergence of multiple portable electronic devices, as well as illumination systems based on light emitting diodes (LED). The large number of applications has significantly changed people’s daily lives [1] and has improved the efficiency and light quality of illumination in residential and private sectors [2]. There is currently a continuous effort to improve the efficiency of LEDs, both for semiconductor materials and the driver circuit [3,4].
The spectral emission of LED lamps is centered at visible wavelengths, including an important fraction of blue light. The exposure to blue light has a key role in the regulation of the circadian rhythms of sleep–wakefulness through its influence on photoreceptor cells in the retina [5]. Blue light also produces other non-visual effects, such as the inhibition of pineal melatonin production, an increase in heart rate and the stimulation of cortisol secretion [6,7,8]. Since blue light acts as a neurophysiological stimulant, several therapeutic effects have been described, from depression [9] to a reduction of blood pressure [10]. Besides the positive influence, some studies have indicated negative effects on the balance of circadian cycles and on the quality of sleep after long exposures to blue light, mainly from mobile phones [11]. On the other hand, some studies have also reported negative effects on the eye retina, most of which are based on the analysis of cells that were irradiated with blue light. Nakanishi-Ueda et al. [12] detected oxidative cellular damage on cultivated cells of bovine retinas when they were exposed to blue (470 nm) LED light with a high irradiance of 48 Wm−2. Similar results were observed for rat retinas under 10 Wm−2 irradiance exposure [13]. Moreover, Nakamura et al. [14] irradiated pigmented mice and found damage to the retinal pigment epithelium and photoreceptors after 3-day exposure to 1100 lux of blue LED light (456 nm). Similarly, Chamorro et al. [15] radiated human retinal pigment epithelial cells with different LED colors—blue (468 nm), green (525 nm) and red (616 nm)—as well as white light in 12 h light–dark cycles and observed cell DNA damage and apoptosis.
The increasing number of studies about the possible negative effects of artificial blue light, together with the rapid development of new devices during recent years, has been a cause for concern for the authorities responsible photobiological safety. In 2011, the European Standard EN12464-1:2011:E, which controls the light in indoor work places, mentioned the need to limit blue light sources [16], and in 2013, the International Commission on Non-Ionizing Radiation Protection (ICNIRP) published guidelines that included safety levels to avoid health disorders [17]. Additionally, the ICNIRP published an action spectrum for blue light hazards [18], describing the effectiveness of each wavelength to cause harm to the retina due to its photochemical effect, as well as safe exposure limits.
A controversial aspect of this research is that, in some studies, the selected values used to irradiate samples were not comparable to the common blue light-emitting devices available for most of the population. For this reason, real measurements of this kind of device, as well as comparisons with natural ambient light, are necessary. In this respect, O’Hagan et al. [19] published a pioneer study analyzing the spectral emission of many electronic devices, concluding that none of them could be associated with eye harm due to the low radiance in the blue spectral range.
The objective of the present study is to analyze the spectral emissions of a sample of portable electronic devices and compare them with solar radiation under different conditions. This analysis widens the number of spectra previously measured by O’Hagan et al. [19]. With this purpose, we have measured different types of electronic devices that are commonly used, such as smartphones, laptops and electronic tablets. The analysis has focused on biologically active irradiance according to the blue light hazard action spectrum.
2. Materials and Methods
In this study, we have measured the spectral irradiance from multiple electronic devices at different distances from their source. The measurements were performed with a double monochromator spectroradiometer Irradian SR9910 V7 (Irradian SL) from 300 to 600 nm with a 1 nm spectral resolution. Before each scan, the spectroradiometer automatically performed a zero measurement to determine dark conditions. Good maintenance and regular calibrations of spectroradiometers are key to precise spectral measurements. For those reasons, every two years, the spectroradiometer—as well as the guide light—has been calibrated both in terms of irradiance and wavelength in the Institute of Optics of the Spanish Scientific Research Council. The calibration is traceable to the National Standard for Luminous Intensity and Luminous Flux. This spectroradiometer was previously used in other studies regarding emissions from LED lamps [11].
The sample consisted of 10 electronic devices (five smartphones, one laptop and four electronic tablets). The screens showed a blue full-screen image with maximum brightness to establish common characteristics for all the situations. According to the IEC/EN 62471 standard [20], the measurement of LED lights should be made at a distance of 20 cm from the source. However, a recent study about the impact of the smartphone viewing distance on sleep analyzed the typical distances in sitting positions and found values ranging from about 13 to 30 cm, with lower distances for a lying position [21]. For these reasons, we decided to measure the irradiance with the sensor located at two distances from the electronic devices, which were in a vertical position. All measurements were done at a common distance of 10 cm, but for the second distance, we selected a larger distance of 30 cm for smartphones and another at 40 cm for tablets and laptops. These distances allowed us to establish the range of irradiances that a user would typically receive, from the shortest distance to a more usual one.
The spectral irradiances were weighted by the blue light hazard sensitivity (Figure 1). This action spectrum ranges from 400 to 700 nm, with maximum effectiveness in the 400–500 nm spectral range. The weighting function decreases by a factor of 10 at about 500 nm and by three orders of magnitude above 600 nm.
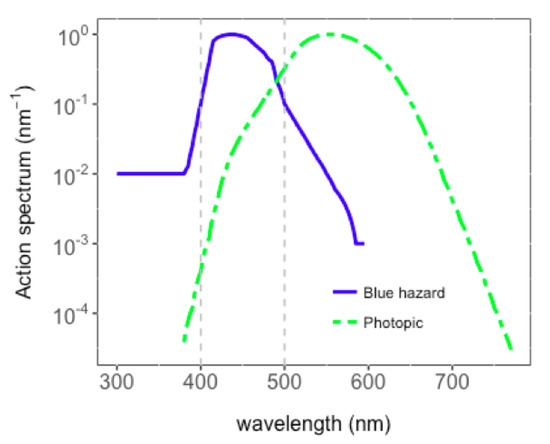
Figure 1.
Action spectra for blue light hazard and for photopic vision. The ordinate axis is represented in a log scale to show the large differences between wavelengths. The two dashed vertical lines represent the blue light range from 400 to 500 nm.
In some studies related to the effects of blue light on eyes, the emissions of LED lamps were only characterized by their illuminance in lux without considering the action spectrum for blue light hazard. The illuminance is the radiant flux received per unit area but weighted with the eye’s sensitivity to visible light, characterized by the action spectrum for photopic vision. When this action spectrum is compared with that of the blue light hazard, it is evident that the maximum effectiveness is centered at different wavelengths; i.e., around 100 nm larger for eye sensitivity. The differences between both spectra result in different biological irradiances, as shown in Figure 2 for the two different spectra measured in this study. There are clear differences in the magnitude of the weighted spectral irradiances and the wavelength of the maximum intensity. In some cases, the blue spectral range is misrepresented due to the smaller weight in the photopic spectrum. For these reasons, it is important to obtain reliable measurements of LED lamps and to determine the irradiance for blue light hazard.
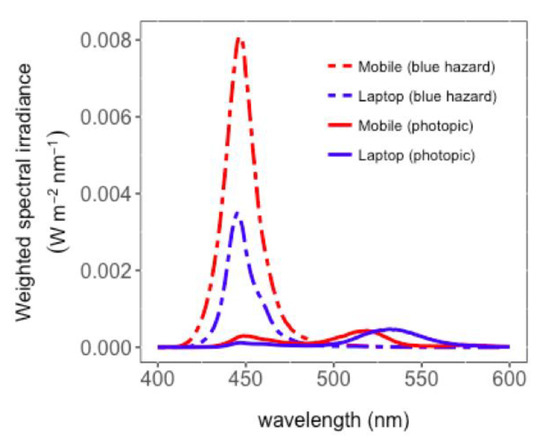
Figure 2.
Weighted spectral irradiances for blue light hazard and for photopic vision at 10 cm determined for one laptop and one mobile phone in the sample.
The solar spectra were estimated with the Coupled Ocean–Atmosphere Radiative Transfer (COART [22,23]) model (https://satcorps.larc.nasa.gov/jin/coart.html). The COART model calculates the spectral irradiance on a horizontal layer at the Earth’s surface as well as spectral radiances for multiple directions in the sky. The model includes variables related to the atmospheric radiative transfer, such as ozone, aerosols and clouds, as well as geographical and temporal coordinates. For this study, we determined the spectral radiation for clear-sky and overcast conditions for two solar heights (h): 70° (representative of midday on the summer solstice at mid-latitudes) and 30° (representative of midday on the winter solstice at mid-latitudes). Under clear-sky conditions, the model assumes that the highest radiance is obtained from the solar disk and the lowest in a perpendicular plane to the position of the Sun. On the other hand, under overcast conditions, due to the thick clouds, the solar rays are completely blocked. For the simulations, we considered a mid-latitude summer atmospheric profile with no stratospheric aerosols but with urban aerosols close to the surface.
The solar global radiation received on a horizontal surface has two components: direct and diffuse radiation. The direct component represents the solar radiation coming from the solar disk, which is almost not scattered or absorbed by the atmosphere, and the diffuse component represents the radiation from the sky that has been scattered before reaching the surface. Considering the characteristics of our study, we analyzed the diffuse irradiance that reaches the Earth’s surface, ignoring the direct component of the global radiation. Since irradiance considers the entire sky, we also simulated the sky radiances in the direction determined by the solar height but with an azimuth angle of 180° and therefore opposite to the Sun’s position.
3. Results and Discussion
Figure 3 shows the measured spectral irradiances from different artificial sources. The maximum emission of all the measured electronic devices was located between 440 nm and 460 nm, and its spectral irradiance was lower than 0.012 Wm−2 nm−1. Only one of the tablets shows this highest value (Figure 3a), but most of the other devices showed a maximum spectral irradiance lower than 0.04 Wm−2 nm−1. The artificial spectra showed a second maximum at 520 nm, but with values lower than 0.002 Wm−2 nm−1. When the detector was located at 30/40 cm from the artificial source, the spectral irradiance decreased for all wavelengths. Escofet and Bará [24] measured spectral irradiances from different artificial sources to analyze the impact on circadian rhythms and found similar maximum spectral values at around 450 nm. Similarly, O’Hagan et al. [19] showed the spectrum from one LED with a maximum at the same wavelength. The differences in the second maximum are related to the particular color configuration selected in each study. In our case, blue-colored screens reduced the intensity of this second maximum in comparison with other studies that used white screens.
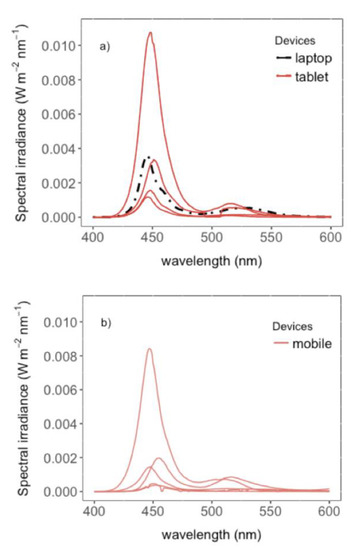
Figure 3.
Spectral irradiances measured at 10 cm for different electronic devices: (a) One laptop and four electronic tablets; (b) five mobile phones.
The spectral irradiances were integrated from 280 to 680 nm to determine the total emissions. The electronic devices showed an average total irradiance of 0.099 ± 0.096 Wm−2 and a median of 0.072 Wm−2. In each group of electronic devices, there were some cases with irradiances higher than 0.1 Wm−2; however, most of the electronic devices showed irradiances lower than 0.05 Wm−2. The values decreased if the distance from the source increased up to 30/40 cm, below 0.05 Wm−2. The total irradiance was very sensitive to the wavelength interval of integration and the experimental conditions, making it difficult to compare these values with other previous studies. These values are lower than those integrated by Escofet and Bará [24], since they measured a white image on a screen; therefore, there was an increase due to the contribution of longer wavelengths. The integrated irradiances were lower than the solar diffuse irradiances (in the same wavelength interval) on a horizontal surface under any of the studied situations. The diffuse irradiance ranged from 60 to 82 Wm−2 (h = 30°–70°) under clear conditions and from 147 to 60 Wm−2 (h = 70°–30°), considering overcast conditions with thick clouds. The differences according to the solar height for both sky situations were related to the increase in the multiple scattering by clouds.
The measured spectral irradiances were weighted with the blue light hazard action spectrum. Figure 4 shows this biologically active irradiance for all the electronic devices. As expected, the maximum values were located at around 450 nm, where there was a coincidence between the maximum emission and the highest effectiveness for blue light hazard. The contribution of these electronic devices to blue light hazard was only in the range between 420 to 575 nm. In this spectral range, the combined effect of low emission and effectiveness resulted in a negligible contribution. Almost all electronic devices showed spectral weighted irradiances lower than 0.010 Wm−2 nm−1 when the detector as located at 10 cm; when this distance increased, the values were even lower. On the other hand, the solar spectral diffuse irradiances weighted by the blue light hazard spectrum were higher than those from the artificial devices, with values between 0.20 to 0.55 Wm−2 nm−1 at 450 nm depending on the solar height and the sky conditions.
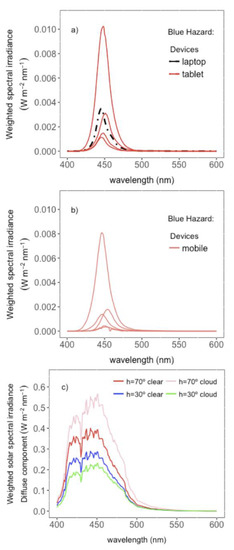
Figure 4.
Weighted spectral irradiances for blue light hazard measured at 10 cm for different electronic devices: (a) one laptop and four electronic tablets; (b) five mobile phones; (c) solar diffuse spectral irradiance for blue light hazard on a horizontal plane at surface level, simulated with the Coupled Ocean–Atmosphere Radiative Transfer (COART) model for different altitude heights (h) and sky conditions.
The weighted spectral irradiances were integrated from 380 to 680 nm (Table 1). The blue light hazard irradiances ranged from 0.01 to 0.29 Wm−2 with an average and median of 0.099 ± 0.096 Wm−2 and 0.072 Wm−2, respectively. The large standard deviation reflected the wide range of device characteristics. Escofet and Bará [24] showed that the use of hardware filters reduced the spectral irradiance at these wavelengths. The differences were possibly also related to use of screen filters in some of the devices, especially in mobile phones. For larger distances from the source, the blue light hazard irradiances were reduced in more than 80% for most of the cases. These results agree with the radiances for blue light hazard that were determined for multiple electronic devices by O’Hagan et al. [19].

Table 1.
Weighted irradiances for blue light hazard from 380 to 600 nm at 10 cm and at 35/40 cm (smartphones/tablets) for the different electronic devices and the estimated solar diffuse irradiances for blue light hazard under four different atmospheric conditions (solar height, h and cloudiness).
Similarly, we integrated the solar diffuse spectra for blue light hazard in the same wavelength range and found values between 18 to 25 Wm−2 for clear sky conditions and 14.5 and 35.5 Wm−2 for simulations under cloudy conditions. The analysis of the blue light hazard for the simulated radiances received from the opposite position of the Sun showed values ranging from 2.5 to 6.0 Wm−2 sr−1. As expected, the sky radiances in some directions were lower than the diffuse irradiances on a horizontal surface due to the decrease in the solid angle. These values are similar to those presented by O’Hagan et al. [19] for radiances in June and January; however, there are differences related to the exact directions (height and azimuth angles) selected and the atmospheric conditions in both studies. Okuno et al. [25] showed extremely high effective radiances for blue hazard when the detector was pointed at the sun, confirming the danger of looking directly at the sun.
4. Discussion
The spectral irradiance—measured with a precise spectroradiometer—showed that the emissions of the considered electronic devices were lower than those received from the sky on a horizontal surface as a result of the multiple scattering of the solar beam with air molecules and atmospheric aerosols throughout the atmosphere. Moreover, the simulated radiances at surface level arriving from the sky—directly opposite the Sun’s position—were also lower than the emissions of the electronic devices.
Due to the particular spectral emissions of these devices, the weighted irradiance for blue light hazard ranged from 0.008 to 0.230 Wm−2. It is important to consider that the irradiances shown in this study correspond to the emissions from blue screens on the electronic devices. In other conditions, images combine the three primary colors, reducing the amount of blue light but increasing the emissions at longer wavelengths, thus also contributing to eye hazards.
The observed differences between devices are related to the particular characteristics as well as to the use of filters on the screens that reduce the blue light emission. These weighted irradiances are lower than those estimated from solar spectra under clear and cloudy conditions. Our results agree with other previous studies in which the emission of different electronic devices was measured and evaluated regarding their potential blue light hazard [19,25].
Although the blue light emission of the measured devices did not show high values that should be a cause for concern for eye diseases, these levels could influence circadian rhythms and sleep quality [26,27]. These non-visual effects were beyond the scope of this study; nevertheless, more and deeper analysis of the impact of low-level visible light on the human circadian system and possible consequences for human health are necessary. Moreover, lightning regulations and practice continue to focus on visual effects and energy efficiency, with little or no attention paid to their effects on the intrinsically photosensitive retinal ganglion cells (ipRGCs) [28]. We would like to emphasize that it is crucial that these future analyses should be based on precise spectral measurements of a large number of different artificial sources to avoid unrealistic values and conclusions.
Author Contributions
Conceptualization, D.B.M.; methodology, D.B.M. and Y.S.; formal analysis, Y.S.; resources, D.B.M.; writing—original draft preparation, Y.S.; writing—review and editing, D.B.M. and R.A.G.-L.; supervision, R.A.G.-L. All authors have read and agreed to the published version of the manuscript.
Funding
This research received no external funding.
Acknowledgments
The authors would like to acknowledge the kind participation of the volunteers who lent their devices to be measured. The authors would also thank Jin for the maintenance of COART model.
Conflicts of Interest
The authors declare no conflict of interest.
References
- Tu, J.-C.; Zhang, X.-Y.; Huang, S.-Y. Key factors of sustainability for smartphones based on Taiwanese consumers’ perceived values. Sustainability 2018, 10, 4446. [Google Scholar] [CrossRef]
- Collins, A.J.; Djokic, S.Z.; Drapela, J.; Guo, Z.; Langella, R.; Testa, A.; Watson, N.R. Analysis of approaches for modeling the low frequency emission of LED lamps. Energies 2020, 13, 1571. [Google Scholar] [CrossRef]
- Adragna, C.; Gritti, G.; Raciti, A.; Agatino Rizzo, S.; Susini, G. Analysis of the input current distortion and guidelines for designing high power factor quasi-resonant flyback LED drivers. Energies 2020, 13, 2989. [Google Scholar] [CrossRef]
- Raciti, A.; Rizzo, S.A.; Susini, G. Circuit model of LED light bulb suitable for typical voltage THD on LV distribution networks. Energy Build. 2019, 212, 109665. [Google Scholar] [CrossRef]
- Hughes, S.; Jagannath, A.; Hankins, M.W.; Foster, R.G.; Peirson, S.N. Photic regulation of clock systems. Meth. Enzymol. 2015, 552, 125–143. [Google Scholar] [CrossRef] [PubMed]
- Gupta, M.A.; Gupta, A.K. Sleep-wake disorders and dermatology. Clin. Dermatol. 2013, 31, 118–126. [Google Scholar] [CrossRef]
- Van De Werken, M.; Giménez, M.C.; De Vries, B.; Beersma, D.G.; Van Someren, E.J.; Gordijn, M.C. Effects of artificial dawn on sleep inertia, skin temperature, and the awakening cortisol response. J. Sleep Res. 2010, 19, 425–435. [Google Scholar] [CrossRef][Green Version]
- Dijk, D.J.; Duffy, J.F.; Silva, E.J.; Shanahan, T.L.; Boivin, D.B.; Czeisler, C.A. Amplitude reduction and phase shifts of melatonin, cortisol and other circadian rhythms after a gradual advance of sleep and light exposure in humans. PLoS ONE 2012, 7, e30037. [Google Scholar] [CrossRef]
- Lam, R.W. Beyond Seasonal Affective Disorder: Light Treatment for SAD and Non-SAD Disorders; American Psychiatric Press: London, UK, 1998. [Google Scholar]
- Stern, M.; Broja, M.; Sansone, R.; Gröne, M.; Skene, S.S.; Liebmann, J.; Suschek, C.V.; Born, M.; Kelm, M.; Heiss, C. Blue light exposure decreases systolic blood pressure, arterial stiffness, and improves endothelial function in humans. Eur. J. Prev. Cardiol. 2018, 25, 1875–1883. [Google Scholar] [CrossRef]
- Baeza, D.; San Juan, M.; González-Lezcano, R.A. Towards a sustainable indoor lightning design: Effects of artificial light on the emotional state of adolescents in the classroom. Sustainability 2020, 12, 4263. [Google Scholar] [CrossRef]
- Nakanishi-Ueda, T.; Majima, H.J.; Watanabe, K.; Ueda, T.; Indo, H.P.; Suenaga, S.; Hisamitsu, T.; Ozawa, T.; Yasuhara, H.; Koide, R. Blue LED light exposure develops intracellular reactive oxygen species, lipid peroxidation and subsequent cellular injuries in cultured bovine retinal epithelial cells. Free Radic. Res. 2013, 47, 774–780. [Google Scholar] [CrossRef] [PubMed]
- Meng, Z.; Chen, X.Y.; Zhang, J.; Li, Y.; Wang, W. Influence of 460–480 nm wavelength light at three different irradiances on retina tissue of SD rats. Zhonghua Yan Ke Za Zhi 2013, 49, 438–446. (In Chinese) [Google Scholar] [PubMed]
- Nakamura, M.; Yako, T.; Kuse, Y.; Inoue, Y.; Nishinaka, A.; Nakamura, S.; Shimazawa, M.; Hara, H. Exposure to excessive blue LED light damages retinal pigment epithelium and photoreceptors of pigmented mice. Exp. Eye Res. 2018, 177, 1–11. [Google Scholar] [CrossRef] [PubMed]
- Chamorro, E.; Bonnin-Arias, C.; Pérez-Carrasco, M.J.; de Luna, J.M.; Vázquez, D.; Sánchez-Ramos, C. Effects of light emitting diode radiation on human retinal pigment epithelial cells in vitro. Photochem. Photobiol. 2013, 89, 468–473. [Google Scholar] [CrossRef]
- CEN, European Standard for Standardization. Light and Lighting—Lighting for Work Places: Part 1: Indoor Work Places; EN12464-1; CEN: Brussels, Belgium, 2011.
- International Commission on Non-ionizing Radiation Protection (ICNRP). Guidelines on limits of exposure to incoherent visible and infrared radiation. Health Phys. 2013, 105, 74–96. [Google Scholar]
- Bergman, R.S.; Barling, L.; Bouman, A.; Drop, P.; Goodman, T.; Hietanen, M.; Ikai, Y.; Kohmoto, K.; Kotschenreuther, R.; Levin, R.; et al. Photobiological Safety of Lamps and Lamp Systems; S 009/E:2002; CIE: Geneva, Switzerland, 2002. [Google Scholar]
- O’Hagan, J.B.; Khazova, M.; Price, L.L.A. Low-energy light bulbs, computers, tablets and the blue light hazard. Eye 2016, 30, 230–233. [Google Scholar] [CrossRef]
- European Committee for Electrotechnical Standardization (CENELEC). Photobiological Safety of Lamps and Lamps Systems; IEC: Brussels, Belgium, 2009; p. 62471. [Google Scholar]
- Yoshimura, M.; Kitazawa, M.; Maeda, Y.; Mimura, M.; Tsubota, K.; Kishimoto, T. Smartphone viewing distance and sleep: An experimental study utilizing motion capture technology. Nat. Sci. Sleep 2017, 9, 59–65. [Google Scholar] [CrossRef]
- Jin, Z.; Stammes, K. Radiative transfer in nonuniformly refracting layered media: Atmosphere-ocean system. Appl. Opt. 1994, 33, 431–442. [Google Scholar] [CrossRef]
- Jin, Z.; Charlock, T.P.; Rutledge, K.; Stammes, K.; Wang, Y. Analytical solution of radiative transfer in the coupled atmosphere-ocean system with a rough surface. Appl. Opt. 2006, 45, 7443–7455. [Google Scholar] [CrossRef]
- Escofet, J.; Bará, S. Reducing the circadian input from self-luminous devices using hardware filters and software applications. Light. Res. Technol. 2017, 49, 481–496. [Google Scholar] [CrossRef]
- Okuno, T.; Saito, H.; Ojina, J. Evaluation of blue-light hazards from various light sources. Dev. Ophtalmol. 2002, 35, 104–112. [Google Scholar] [CrossRef]
- Glickman, G.; Levin, R.; Brainard, G.C. Ocular input for human melatonin regulation: Relevance to breast cancer. Neuro. Endocrinol. Lett. 2002, 2, 17–22. [Google Scholar]
- Lucas, R.J.; Peirson, S.N.; Berson, D.M.; Brown, T.M.; Cooper, H.M.; Gzeisler, C.A.; Figueiro, M.G.; Gamlin, P.D.; Lockley, S.W.; O’Hagan, J.B.; et al. Measuring and using light in the melanopsin age. Trends Neurosci. 2014, 37, 1–9. [Google Scholar] [CrossRef] [PubMed]
- Commission Internationale de l’Eclairage. CIE Position Statement on Non-Visual Effects of Light. Recommending Proper Light at the Proper Time, 2nd ed. October 2019. Available online: http://cie.co.at/publications/position-statement-non-visual-effects-light-recommending-proper-light-proper-time-2nd (accessed on 16 August 2020).
© 2020 by the authors. Licensee MDPI, Basel, Switzerland. This article is an open access article distributed under the terms and conditions of the Creative Commons Attribution (CC BY) license (http://creativecommons.org/licenses/by/4.0/).