Abstract
Transition to a low carbon energy system requires extensive private investment and novel financing instruments. Corporate power purchase agreements (PPAs) have been proven effective in increasing renewables financing. The challenge is to scale this corporate model to smaller energy consumers that form a significant part of the global total energy demand and carbon dioxide emissions. This paper examines collateral strength and global potential of the real estate sector as an offtaker for PPAs. The strength is evaluated by constructing a detailed energy and economic model for 90,000 buildings in the Helsinki Metropolitan Area (HMA), Finland. The global potential is evaluated by creating country-level profiles with global data of interest rates, energy consumption, and energy costs. The results suggest that real estate is a strong offtaker as the HMA’s value of real estate collateral compared to required wind power capital expenditures (that could cover electricity demand of the buildings) is approximately 100:1, and for cash flows, the ratio is 70:1 between gross rents and PPA costs. Analysis of global data suggests that the majority of buildings’ energy consumption in OECD countries as well as a large part of China’s energy consumption could fall into low access finance under the presented concept.
Keywords:
energy transition; renewables; finance; investment; real estate; power purchase agreement; PPA 1. Introduction
A recent study estimated that a 100% renewable energy system requires cumulative investments of 67 trillion EUR by 2050 [1]. As these kinds of investment volumes cannot be reached without private capital, policy actions have been called to decrease the cost of financing for renewable investments [2]. Similarly, it has been pointed out that the future success of renewables deployment will depend on adequate financing instruments [3], as they are capital-heavy investments. To increase the attractiveness of renewables, policies such as feed-in-tariffs, tax exemptions, and investment subsidies have either focused on decreasing initial capital expenditure or guaranteeing a price for generated energy.
As these governmental policies are being terminated, power purchase agreements (PPAs) between private parties have gained a major role in further deployment of renewable energy. Globally, corporate PPAs have been estimated to amount for nearly 20 GW of new renewable deployment in 2019 [4]. PPAs are a long-term contract where generated electricity is sold to an offtaker (e.g., a corporation) with a predetermined price. Removal of price uncertainty reduces cost of capital for both equity and debt financing for renewable developers. This in return benefits the offtaker through a low and predictable rate for electricity. In contrast to often-criticized renewable energy certificates, PPA obligates the seller of the contract to actually invest into a renewable energy project and subsequently sell the generated electricity with a market-determined price that reflects the real cost of renewable energy. PPAs have been tailored to corporations that are large energy consumers and have high credit ratings and capability to commit to long-term contracts. An increasing number of large companies have been eager to commit to 100% renewable targets where PPAs have a crucial role.
However, a significant amount of potential remains unlocked as PPAs are not, in practice, available to smaller organizations and private consumers. Particular scaling challenges are related to transaction costs for defining credit ratings as well as signing commitments as long-term agreements [5]. These challenges must be solved to create an instrument which would be available for the majority of energy consumers and that could serve as a strong collateral for renewable energy financiers.
Real estate is the world’s largest asset class and generally considered as a strong credit collateral. The sector is also the world’s largest end-user of energy. Figure 1 visualizes the approximated economic size of the real estate sector in comparison to investments required for a 100% renewable energy system.
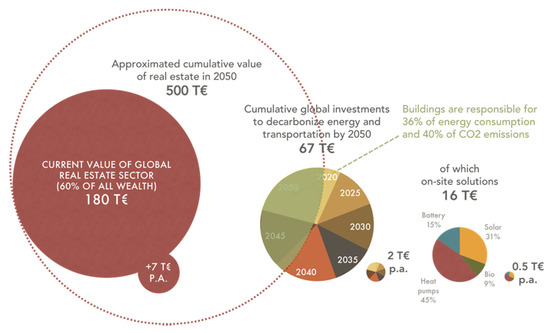
Figure 1.
Economic size of the real estate sector in comparison to investments required for a 100% renewable energy system. Data for real estate value are from [6], annual investments into buildings are from [7] and energy investment data are from [1]. The approximation of the cumulative value of real estate is based on estimations [8] of building stock in 2050 and the current and near future investments into construction. Buildings energy consumption and emissions data are from [9].
On-site energy solutions could cover approximately 23% of total global final end-energy demand by 2050 [1]. As on-site generation cannot deliver all of the energy required by buildings, especially of electricity (in contrast to heating), owners and occupants of real estate eventually have to purchase the rest of the energy from off-site sources. As real estate is a long-term energy consumer, it could be natural that the sector commits into purchasing clean electricity with power purchase agreements, leveraging their strong credit ratings. This presents an interesting opportunity for utilizing real estate wealth as collateral to finance off-site renewable energy developments.
The aim of this paper is to examine the collateral strength and global potential of the real estate sector as an offtaker for PPAs. The strength is evaluated by constructing a bottom–up energy and economic model for nearly 90,000 buildings in the Helsinki Metropolitan Area (HMA), Finland. In the model, hourly-level energy consumption as well as relevant property market information is connected to every building in the city. The model is used to compare electricity costs to real estate rents and to compare real estate values to capital expenditures of new renewable developments. As building-specific data for different countries are difficult to obtain, the global potential is evaluated by creating country-level profiles with global data of interest rates, energy consumption, and energy costs. The country-level profiles are then used to estimate the global potential of real-estate-backed PPAs.
The paper is divided into four sections. The introduction outlines the motivation and context of the paper. The following section presents the methodology and used data. The third section presents the results. Discussions and policy implications conclude the paper.
2. Materials and Methods
The methodology and used data are described in two parts. First, the methodology and data for creating a bottom–up energy and economic model for a city are presented. Then, the methodology for analyzing the global potential with country-level data is presented.
2.1. Bottom–up Energy and Economic Model for a City
This paper uses open source building data for the cities of Helsinki [10], Espoo [11], and Vantaa [12] that forms the 1.2 million population of the HMA. The data, regularly updated by the cities’ building departments, contain detailed information about every building in the city, such as floor area, construction year, building materials, and heating system. To form hourly-level electricity and heat consumption profiles for all of these buildings, energy consumption data were provided by both Vantaa Energy Ltd. [13] and the City of Helsinki [14]. Vantaa Energy provides over 1500 GWh of annual district heating, and they used their data from 583 different buildings to form 59 different heat consumption profiles. Furthermore, the City of Helsinki has published historical electricity consumption data for their owned 428 buildings, which were similarly used to form 48 different electricity consumption profiles. The consumption profiles, in the form of kW/hour/sqm, had 12 building types and approximately five different building decades per building type. This combination of building types and decades was used to connect the energy data to every individual building in the dataset, i.e., the energy data were first matched by the building type and then by the building decade. Then, the energy consumption data were multiplied by the building’s floor area (sqm). The end result was a matrix with ~89 k rows and ~18 k columns, where rows represent buildings and columns represent hourly heat and electricity consumption for the buildings. The analysis was done for the year of 2019, and the model’s aggregated simulated energy consumption was compared to real numbers published by a local energy company.
To transform the electrical energy consumption to monetary costs, relevant price data were acquired. Commonly, electricity costs have three components: distribution, tax, and energy. In Finland, the first two components form approximately 50% to 60% of the total electricity bill, and they cannot be tendered as electrical distribution is a natural monopoly, and the tax is set by the government. The energy component can be tendered; however, it is commonly assumed that the spot price from Nord Pool Spot exchange (a market leader of electricity trading in 14 northern European countries) is the market rate of electrical energy. This paper uses Nordpool’s historical hourly spot pricing [15] as the market rate of electricity. Annual electrical energy costs (later referred as spot costs) are calculated on an hourly basis for every building in the dataset with the following equation:
where is the annual electricity spot costs, i is the hour of the year, is the hour’s Nordpool spot price (€/MWh) and is the hour’s electricity consumption (MWh). To calculate potential savings from a PPA contract, four wind energy developers were contacted to ask what kind of PPA price they could deliver from a new wind park in Finland. News outlets have reported that the lowest wind PPA price in Finland is 29 €/MWh [16], but this is likely a pay-as-produced contract for a very large energy consumer. The developers estimated an initial price range of 32–35 €/MWh for a 10-year PPA where a bankable real estate portfolio with a consumption of 100 GWh would offtake the contract. The developers were chosen based on their activity in the Finnish market as well as their initial interest in participating in this kind of contract. The prices are initial estimations due to the novelty of the contract.
To estimate the collateral strength of the building stock, property values and annual rents were calculated for every building. This required relevant property market information; the authors of [17] estimated rents, vacancy rates, and property yields for different property types (residential, retail, office and logistics) in 40 different HMA areas. Property yield is a common term [18] used in real estate economics to measure required return of a real estate investment, i.e., it represents economic return required by an investor in terms of net rent per real estate value, see Equation (2). Property yield is strongly linked to the location of the property, as property vacancy rates and rents often depend on the location of the property, e.g., the city center is more likely to draw tenants than rural areas, and hence, an investor requires a lower property yield. For a more specific description, recently, the authors of [19] thoroughly explained real estate investment fundamentals in the context of energy.
Real estate value is estimated with Equation (2) that presents a simplified formula for discounted cash flow valuation, which is the most commonly used method by professionals to evaluate the value of real estate [20].
where V is real estate value, R is rental income, OPEX is operating expenses, and is property yield. Since energy costs can form approximately 30% of real estate operating expenses [21], property owners are motivated to cut them to reduce OPEX and subsequently increase V. For example, if annual electricity spot costs are decreased by 10,000 € and the property yield is 4% (e.g., an office building in Helsinki central business district), the value of the property increases by 250,000 €. Recently, the authors of [22] published a case study where the energy costs of a logistics building were significantly decreased by on-site generation (rooftop photovoltaics and ground source heat pumps). The results were validated with a survey of professional property valuers, where almost 80% of the respondents responded that the energy decreased costs should be capitalized into property valuers.
Energy research in the context of real estate valuation has largely focused on energy performance certificates (EPC) as well as on the impact of rooftop photovoltaics on housing prices. Research is often divided to cover either housing prices or commercial property values. For housing, large datasets are often available that allow statistical modeling of prices. Commercial properties are more heterogeneous, which limits the amount of available data to conduct statistical analysis on particular characteristics. Many studies in different markets, such as [23,24,25], have found that higher EPC ratings tend to command a price premium, but this is widely affected by the location and type of the property. Similarly, rooftop photovoltaics have been found to command a price premium for housing. For commercial properties, energy is often assessed as a part of sustainability certificates, such as Leadership in Energy and Environmental Design (LEED) and Building Research Establishment Environmental Assessment Method (BREEAM). Recently, the authors [26] published a review article covering different research on the topic and found that the majority of published articles, such as [27,28], have found positive links between sustainability certificates and commercial property valuation parameters, such as value, occupancy rate, rent, and sales time. Sustainability- and energy-related research in a real estate context has been widely increasing during the past decade, highlighting its growing importance for the sector.
2.2. Country Profiles for Real Estate Power Purchase Agreements
Strength in corporate PPAs lies in high credit ratings of corporations. Renewable developers and their financiers can trust that corporations will not default on their obligations to purchase the produced electricity. In financial markets, the highest credit rating a corporate bond can receive is AAA [29]. In theory, a PPA contract with an AAA-rated corporation is the strongest corporate PPA contract, thus commanding pricing for electricity. To globally estimate risk levels between a corporate PPA and a real estate PPA, historical interest rates between corporate AAA bonds and mortgages are analyzed with US data. For the years between 2000 and 2018, the respective annual average interest rates for a 30-year mortgage and for a corporate AAA bond are 5.26% and 5.09%, with a correlation of 0.99. For the 2010–2018 period after financial crises, the respective rates are 4.11% and 4.10%. It seems that risk levels between these two classes are quite similar, and this argument is used as a basis to estimate the potential of real estate PPAs in different countries.
A country profile is formed by merging three country-level datasets together: mortgage rates and end-user energy prices are retrieved from [30], and the country’s total energy consumption from [31]. The created country profile is then compared to US corporate AAA bond data [32] representing a low-risk PPA offtaker.
3. Results
3.1. Collateral Strength of Real Estate
Aggregated energy consumption of all buildings generated by the energy model was compared to Helen Ltd.’s actual production numbers for the year of 2019 [33]. Helen Ltd. provides district heating for Helsinki, covering over 90% of heat demand in the city. Last year, Helen delivered 6556 GWh of heat, and the model predicted 6514 GWh (difference of 0.6%). Helen also distributes electricity; for building electricity, 4164 GWh was distributed, and the model predicted 4124 GWh (difference of 1.0%). The model seems quite robust, at least for aggregate numbers. Figure 2 presents monthly electricity and heat demand for the HMA as well as electricity demand in a scenario where heating is 100% electrified with heat pumps (using 3.5 as the average coefficient of performance, COP). Even though this paper focuses on electricity, heating and its electrification are included, as many carbon-neutral pathways propose electrification of heating as a solution for carbon neutrality. In these scenarios, such as [1], on-site heat pumps a have significant role in delivering the required heating, as pointed out in Figure 1. Therefore, a larger building electricity consumption increases the significance of this paper’s findings.
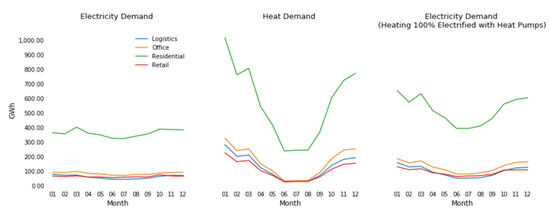
Figure 2.
Electricity and heat demand in the Helsinki Metropolitan Area (HMA). Buildings have been grouped into four commonly used categories in property markets: logistics, office, residential, and retail.
Figure 3 presents a cost comparison between Nordpool spot and a 33 €/MWh wind PPA contract for the whole building stock of the HMA divided into the four major property types. The PPA cost is calculated using Equation (1), but is 33 €/MWh for every hour. The figure also presents CO2 emissions, where 141 kg CO2 per MWh has been used as average for the current electricity [34] and 8 kg CO2 per MWh for onshore wind [35]. For the year of 2019, electrical energy costs would be reduced by 31% and emissions by 94% under a wind PPA agreement. According to Nordpool’s long-term monthly data, the average spot price in Finland has been 40.6 €/MWh for 2010–2019 and 36.6 €/MWh for 2000–2019, higher than the potential PPA price in the long-term.
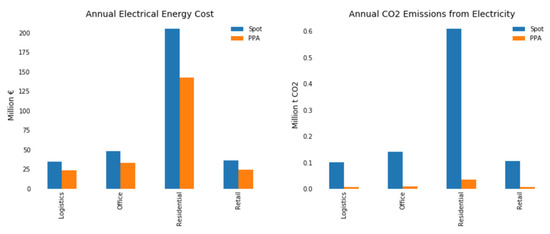
Figure 3.
Annual electrical energy costs (not including tax and distribution) and emissions for the building stock of the Helsinki Metropolitan Area. Hourly spot data from Nordpool for the year of 2019 are used to calculate the costs, and for power purchase agreements (PPAs), a 33 €/MWh average is used.
To estimate the collateral strength of the building stock, property values, annual rents, annual electricity costs, as well as electricity costs per rent ratios have been calculated for every building. Table 1 presents a description of these metrics for the four property types.

Table 1.
Property values, annual rents, annual electricity spot costs and their ratios for the building stock of the HMA.
According to the model, HMA building stock is valued at 237 billion € with an annual gross rent of 17 billion €. The annual spot costs for electricity are 0.324 billion €, which are on average 2.0% of the gross rents. Under the hypothetical 33 €/MWh PPA, the respective numbers would be 0.224 billion € and 1.4%. To generate the electricity demand of the building stock (6777 GWh without heating electricity) with wind turbines operating at a 40% efficiency (3504 annual production hours), 1934 MW of capacity with an estimated capital expenditures (CAPEX) of 2.3 billion € (1.2 million € per MW [1]) is required. The results suggest that real estate is a strong offtaker, as the HMA’s value of real estate collateral compared to the required wind power capital expenditures (that could cover electricity demand of the buildings) is approximately 100:1, and for cash flows, the ratio is 70:1 between gross rents and PPA costs.
3.2. Global Potential of Real-Estate-Backed Power Purchase Agreements
The global potential of real-estate-backed PPA is presented in Figure 4.
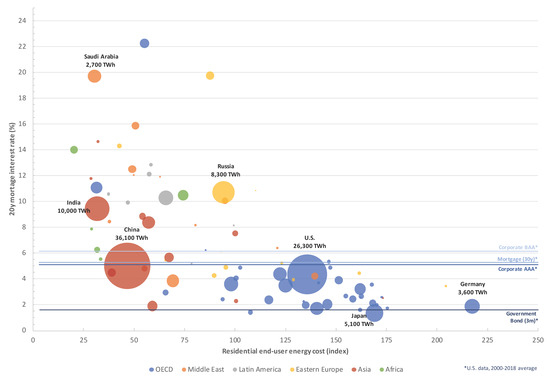
Figure 4.
Techno-economic potential of real-estate-backed power purchase agreements in different countries. Bubble sizes represent total energy demand per country, and location of the bubble represents economic viability of real estate PPA, lower mortgage rates indicating lower financing costs and higher end-user energy costs indicating higher motivation for fixing energy costs. Average US data put the country-level risk and potential into perspective, government bond representing cost of finance for feed-in-tariffs and corporate AAA representing cost of finance for a low risk corporate PPA that is nearly the same level as average US mortgage.
The majority of energy consumption in OECD countries as well as a large part of China’s energy consumption fall below the US Corporate AAA bond, which is used as a reference for representing the cost of capital for current corporate PPA deals. A lower cost of capital can significantly decrease renewables’ levelized cost of electricity (LCOE) [36,37], which is a commonly used metric for comparing energy production investments. To emphasize, part of this low cost of capital for new renewable developments can be obtained with real-estate-backed PPAs, and economically viable energy potential for these agreements can cover a significant part of the building sector’s total energy demand. Furthermore, in OECD countries, the relatively high end-user energy costs likely increase motivation to commit to real estate PPAs. The x-axis location suggests the potential development of end-user prices in developing countries, as almost all of the wealthier OECD countries are further right on the axis.
4. Discussion
Power purchase agreements create value from commitments; a corporation commits to purchase electricity and in return receives a long-term predictable price for clean electricity, and the renewable producer benefits from cheaper financing. The challenge is to scale this corporate model to smaller energy consumers that form a significant part of the global total energy demand and carbon dioxide emissions. The real estate sector, as the world’s largest asset class and end-user of energy, could be used to pool together smaller energy consumers and to increase the availability of clean energy financing.
This paper examines collateral strength and global potential of real estate sector as an offtaker for PPAs. The strength is evaluated by constructing a detailed energy and economic model for 90,000 buildings in the HMA. The global potential is evaluated by creating country-level profiles with global data on interest rates, energy consumption, and energy costs.
The created electricity simulation model has only a 1.0% difference to real delivered electricity. The model estimated that the building stock of the HMA consumes 6.8 TWh of annual electricity for non-heating purposes. PPA could reduce the electrical energy costs (not including distribution and taxes) for the buildings by 31% compared to the hourly-level Nordpool spot pricing in 2019. Emissions would be reduced by 94% compared to the 3-year average emissions of the Finnish electricity system. To cover the electricity demand of the buildings, 1.9 GW of new wind power with an estimated CAPEX of 2.3 billion € is required. The value of the building stock is estimated as 237 billion €, which is over 100 times more than the required CAPEX. The annual gross rents of the buildings are 17 billion €, which are approximately 70 times more than the annual costs of the PPAs. Analysis of global data reveals that the majority of buildings’ energy consumption in OECD countries as well as a large part of China’s energy consumption could fall into low access finance under the presented concept.
The results suggest that real estate is an excellent off-taker for PPAs, and it could have significant global potential for increasing the availability of clean energy financing. The presented bottom–up model is a novel way to analyze both the energy and economic implications of renewables in an urban environment. Creating an energy and economic profile for every individual building provides detailed information that can be utilized by both energy companies and energy financiers. Especially understanding the ratios between energy costs and rents/values of buildings provides important information when developing standardized scalable contract models.
Further research is required from multiple disciplines to understand the challenges of implementing the concept presented in this paper. It would be interesting to utilize the bottom–up energy model in different countries and cities, but a practical challenge is acquiring building data that are often available only in the local language. This paper’s analysis does not take into account the intermittent nature of renewables; thus, calculating the optimal share of renewables to cover a building’s energy consumption would provide interesting results, and potentially business models. This would naturally affect the system price of electricity as well as the emissions of the system. Another topic is the contractual mechanism for managing the intermittent production of renewable energy. There are already developments in this field, e.g., Microsoft and the world’s largest insurer Allianz recently introduced a new insurance product that allows pricing and transferring the intermittency risk to large global parties that can achieve economies of scale in acquiring balancing resources [38]. These kinds of corporate-led PPA innovations could be scaled to smaller energy consumers through the real estate PPA. Finally, the energy cost share of the total income is higher for lower-income groups, who often live in housing backed by governmental operators. Governmental housing companies are large energy consumers, and if they could commit to these kinds of PPA contracts, the energy costs and emissions of the inhabitants could be lowered. It would be interesting to apply the model to some of the largest subsidized housing companies to understand what kind of potential there could be for lowering energy costs with PPAs.
To conclude, this paper discusses policy implications. Building regulations focus on promoting energy efficiency, on-site energy generation, and nearby generation. However, especially in a dense urban environment, energy demand is so high that all of the energy cannot be generated on-site or in nearby areas. Policies could explore whether real the estate sector could be regulated to purchase clean energy from allocated off-site developments through PPA contracts.
Funding
This research received funding from Business Finland (grant 211694) and Academy of Finland (grant 327800).
Conflicts of Interest
The author declares no conflict of interest.
References
- Ram, M.; Bogdanov, D.; Aghahosseini, A.; Oyewo, S.; Gulagi, A.; Child, M.; Breyer, C. Global Energy System Based on 100% Renewable Energy—Power Sector; Lappeenranta University of Technology and Energy Watch Group: Lappeenranta, Finland, 2017. [Google Scholar]
- Schmidt, T.S. Low-carbon investment risks and de-risking. Nat. Clim. Chang. 2014, 4, 237–239. [Google Scholar] [CrossRef]
- Creutzig, F.; Agoston, P.; Goldschmidt, J.C.; Luderer, G.; Nemet, G.; Pietzcker, R.C. The underestimated potential of solar energy to mitigate climate change. Nat. Energy 2017, 2, 17140. [Google Scholar] [CrossRef]
- Corporate Clean Energy Buying Leapt 44% in 2019, Sets New Record. Available online: https://about.bnef.com/blog/corporate-clean-energy-buying-leapt-44-in-2019-sets-new-record/ (accessed on 1 July 2020).
- Innovation in Power Purchase Agreement Structures. Available online: https://www.wbcsd.org/Programs/Climate-and-Energy/Energy/REscale/Resources/Innovation-in-Power-Purchase-Agreement-Structures (accessed on 1 July 2020).
- What Price the World? Real Estate in the Global Asset Universe. Available online: https://pdf.euro.savills.co.uk/global-research/around-the-world-in-dollars-and-cents-2016.pdf (accessed on 1 July 2020).
- McKinsey Global Institute, Reinventing construction: A Route to Higher Productivity. Available online: https://www.mckinsey.com/~/media/McKinsey/Industries/Capital%20Projects%20and%20Infrastructure/Our%20Insights/Reinventing%20construction%20through%20a%20productivity%20revolution/MGI-Reinventing-Construction-Executive-summary.ashx (accessed on 1 July 2020).
- From Thousands to Billions: Coordinated Action towards 100% Net Zero Carbon Buildings By 2050. Available online: https://www.worldgbc.org/sites/default/files/From%20Thousands%20To%20Billions%20WorldGBC%20report_FINAL%20issue%20310517.compressed.pdf (accessed on 1 July 2020).
- IEA. Energy Efficiency: Buildings. Available online: https://www.iea.org/topics/energyefficiency/buildings/ (accessed on 1 July 2020).
- Buildings in Helsinki. Available online: https://www.avoindata.fi/data/en_GB/dataset/helsingin-rakennukset (accessed on 1 July 2020).
- Buildings in Espoo. Available online: https://www.avoindata.fi/data/en_GB/dataset/espoon-rakennukset (accessed on 1 July 2020).
- Buildings in Vantaa. Available online: https://www.avoindata.fi/data/en_GB/dataset/vantaan-rakennukset (accessed on 1 July 2020).
- Vantaa Energy Ltd. Building Heat Consumption Data. 2019. Available online: https://www.vantaanenergia.fi/en/ (accessed on 1 July 2020).
- Energy Consumption Data of City of Helsinki’s Utility and Service Properties. Available online: https://hri.fi/data/en_GB/dataset/helsingin-kaupungin-palvelukiinteistojen-energiankulutustietoja (accessed on 1 July 2020).
- Historical Market Data (Elspot Prices Hourly 2019 EUR). Available online: https://www.nordpoolgroup.com/historical-market-data/ (accessed on 1 July 2020).
- Valtava Tuulivoimalabuumi Alkaa nyt Etelä-Pohjanmaalla—Valmisteilla 80 Tuulivoimalan Rakentaminen. Available online: https://www.talouselama.fi/uutiset/valtava-tuulivoimalabuumi-alkaa-nyt-etela-pohjanmaalla-valmisteilla-80-tuulivoimalan-rakentaminen/23205535-8686-4e1b-b162-afa12f09c48c (accessed on 1 July 2020).
- Datscha. Property Information Data. 2018. Available online: https://datscha.com (accessed on 1 July 2020).
- Baum, A.E.; MacGregor, B.D. The initial yield revealed: Explicit valuations and the future of property investment. J. Prop. Valuat. Invest. 1992, 10, 709–726. [Google Scholar] [CrossRef]
- Leskinen, N.; Vimpari, J.; Junnila, S. Using real estate market fundamentals to determine the correct discount rate for decentralised energy investments. Sustain. Cities Soc. 2020, 53, 101953. [Google Scholar] [CrossRef]
- Shapiro, E.; Mackmin, D.; Sams, G. Modern Methods of Valuation; EG Books: Bairnsdale, Australia, 2013. [Google Scholar]
- Wiley, J.A.; Benefield, J.D.; Johnson, K.H. Green design and the market for commercial office space. J. Real Estate Financ. Econ. 2010, 41, 228–243. [Google Scholar] [CrossRef]
- Leskinen, N.; Vimpari, J.; Junnila, S. The impact of renewable on-site energy production on property values. J. Eur. Real Estate Res. 2020. [CrossRef]
- Cerin, P.; Hassel, L.G.; Semenova, N. Energy performance and housing prices. Sustain. Dev. 2014, 22, 404–419. [Google Scholar] [CrossRef]
- Fuerst, F.; McAllister, P.; Nanda, A.; Wyatt, P. Does energy efficiency matter to home-buyers? An investigation of EPC ratings and transaction prices in England. Energy Econ. 2015, 48, 145–156. [Google Scholar] [CrossRef]
- Marmolejo-Duarte, C.; Chen, A. The Uneven Price Impact of Energy Efficiency Ratings on Housing Segments. Implications for Public Policy and Private Markets. Sustainability 2019, 11, 372. [Google Scholar] [CrossRef]
- Leskinen, N.; Vimpari, J.; Junnila, S. A review of the impact of green building certification on the cash flows and values of commercial properties. Sustainability 2020, 12, 2729. [Google Scholar] [CrossRef]
- Fuerst, F.; McAllister, P. Green noise or green value? Measuring the effects of environmental certification on office values. Real Estate Econ. 2011, 39, 45–69. [Google Scholar] [CrossRef]
- Eichholtz, P.; Kok, N.; Quigley, J.M. Doing well by doing good? Green office buildings. Am. Econ. Rev. 2010, 100, 2492–2509. [Google Scholar] [CrossRef]
- S & P Global Ratings. Available online: https://www.spglobal.com/ratings/en/about/understanding-ratings (accessed on 1 July 2020).
- Price Rankings by Country. Available online: https://www.numbeo.com (accessed on 1 July 2020).
- Energy Use (kg of Oil Equivalent Per Capita). Available online: https://data.worldbank.org/indicator/EG.USE.PCAP.KG.OE (accessed on 1 July 2020).
- Federal Reserve Economic Data. Available online: https://fred.stlouisfed.org (accessed on 1 July 2020).
- Helen Ltd. Business Year 2019. Available online: https://www.helen.fi/en/annual-report/annual-report-2019/year-2019/business-year (accessed on 1 July 2020).
- Motiva, CO2 Emission Coefficient for Finnish Electricity System. Available online: https://www.motiva.fi/ratkaisut/energiankaytto_suomessa/co2-laskentaohje_energiankulutuksen_hiilidioksidipaastojen_laskentaan/co2-paastokertoimet (accessed on 1 July 2020).
- Wang, Y.; Sun, T. Life cycle assessment of CO2 emissions from wind power plants: Methodology and case studies. Renew. Energy 2012, 43, 30–36. [Google Scholar] [CrossRef]
- Darling, S.B.; You, F.; Veselka, T.; Velosa, A. Assumptions and the levelized cost of energy for photovoltaics. Energy Environ. Sci. 2011, 4, 3133–3139. [Google Scholar] [CrossRef]
- Ondraczek, J.; Komendantova, N.; Patt, A. WACC the dog: The effect of financing costs on the levelized cost of solar PV power. Renew. Energy 2015, 75, 888–898. [Google Scholar] [CrossRef]
- Proxy Generation PPAs: The Next Evolution of PPAs for the Corporate & Industrial Buyer. Available online: https://orrick.blob.core.windows.net/orrick-cdn/Proxy_Generation_PPAs.pdf (accessed on 1 July 2020).


© 2020 by the author. Licensee MDPI, Basel, Switzerland. This article is an open access article distributed under the terms and conditions of the Creative Commons Attribution (CC BY) license (http://creativecommons.org/licenses/by/4.0/).