Article

Effect of Principal Stress Field on the Development of Plastic Zone ahead of the Gateroad

1
School of Energy and Mining Engineering, China University of Mining and Technology (Beijing), Beijing 100083, China
2
School of Safety Engineering, North China Institute of Science & Technology, Beijing 101601, China
3
College of Mining Engineering, Taiyuan University of Technology, Taiyuan 030024, China
4
Department of Mining, Metals and Materials Engineering, McGill University, Montreal, QC H3A 2A7, Canada
*
Author to whom correspondence should be addressed.
Energies 2020, 13(17), 4356; https://doi.org/10.3390/en13174356
Submission received: 5 June 2020 / Revised: 20 August 2020 / Accepted: 20 August 2020 / Published: 24 August 2020

Abstract

:
The distribution of a plastic zone ahead of a gateroad plays a significant role in maintaining the long-term stability of mining spaces. For a long time, the principal stress field such as the values, the direction, etc. have been observed to have impacts on plastic zone development, but has not been looked into deeply and systematically. To this end, the influence of principal stress field including the maximum principal stress (P1), the angle between the P1 direction and the Z-axis (α), the minimum principal stress (P3), and the ratio of maximum principal stress to minimum principal stress (P1/P3) on the expansion of the plastic zone ahead of the gateroad is investigated by the (Fast Lagrangian Analysis of Continua) FLAC3D models. The results show that: (1) The plastic zone volume increases first and then decreases with the increase of α, and the direction of butterfly-shaped plastic zone ahead of gateroad is rotating with the evolution of α. (2) The plastic zone volume ahead of excavation face increases gradually with the increase of P1/P3. Mutagenicity of butterfly-shaped plastic zone occurs ahead of the gateroad under a certain value of P1/P3. (3) With the increase of P1 and decrease of P3, the plastic zone volume is of exponential growth. The plastic zone volume approaches infinity when the critical value of maximum principal stress ([P1]) and the minimum principal stress ([P1]) is obtained. (4) The study of the effect of principal stress field on the expansion of plastic zone ahead of the gateroad is helpful for revealing the mechanisms of coal and gas outbursts. The critical stress state of butterfly-shaped plastic zone mutagenicity ahead of the gateroad can be used as an important indicator for assessing the risk of coal and gas outburst. The research can also guide the prevention of coal and gas outburst ahead of the gateroad.

1. Introduction

A gateroad is an essential access or opening to underground mining sites, which plays a significant role in transportation and ventilation [1,2]. Stability of the roadway can ensure the high production and efficiency of excavation activities. Generally, strength of rock mass can be weakened under mining influences, which can create plastic zones around the gateroad [3,4,5]. Plastic zone is a theoretical and important indicator for analyzing and reflecting the surrounding rock’s failure of the gateroad. The distribution of plastic zone can reflect the failure degree, form, and behavior of surrounding rock. Roof deformation and roof fall may be induced within a short time if the range and volume of plastic zone expand to a certain value. Meanwhile, coal-gas outbursts and rock burst may occur suddenly, which can cause serious fatality, injury, or economic loss [1,2,3,4,5].
The disasters induced by the failure of a gateroad is closely associated with the distribution of the plastic zone. The range and shape of the plastic zone are essentially determined by the stress environment around the gateroad [6,7,8]. The difference of stress value, direction, and type can lead to various distribution characteristics of the plastic zone [5].
The distribution characteristics of plastic zone around the gateroad are different in the uniform stress field and nonuniform stress field. Kastner (1962) deduced initially the radius formula for the circular roadway plastic zone in the uniform stress field. The shape of the plastic zone around the gateroad is regarded to be circular [9]. Abdel-Meguid et al. (2003) and Leitman et al. (2009) found that gateroads are often in a nonuniform stress environment. The stability of the roadway under the complex stress field is studied and the elliptical-shaped plastic zone of the gateroad is obtained [10,11]. Chen et al. (2007) proposed the boundary implicit equation for the plastic zone of a circular roadway surrounding rock in a non-uniform stress field [12]. Zhao et al. (2014) investigated the stress distribution and deformation characteristics of gateroad surrounding rock under different stress conditions. The shape of the plastic zone was divided into circular plastic zone, elliptical plastic zone, and butterfly-shaped plastic zone [13]. Meng et al. (2015) obtained five kinds of failure modes in deep soft rock roadway under different stress conditions [14]. Guo et al. (2016) further believed that the butterfly-shaped plastic zone in the non-uniform stress field can be applied to reveal the mechanisms of gateroad dynamic disasters [15].
Moreover, scholars have investigated the factors influencing the distribution characteristics of the gateroad plastic zone. Lu et al. (2010) analyzed the distribution range and shape of the plastic zone under different levels of tectonic stress, vertical pressure, cohesion, and friction angle of the surrounding rock by theoretical formula, numerical simulation, and field measurements [16]. Li et al. (2012) obtained the distribution laws and types of the plastic zone with different spans and lateral pressures using FLAC3D code. The roadways were classified into four types according to the different lateral pressures and spans, including small-span, moderate-span, large-span and extreme-large-span roadways [17]. Shen et al. (2014) discussed the influences of high horizontal stresses and low strength of coal/rock on the distribution of plastic zone [18]. Jiang et al. (2016) carried out a parametrical study with respect to the tension-weakening model to examine the effect of tension-weakening and provide a basis for gateroad stability investigation and rock support design [19]. In addition, Jiang et al. (2016) developed an analytical model of roof beam supported by elastic (Winkler) foundation to examine the effect of foundation rigidity on the deformation behavior of the roadway [20]. Li et al. (2017) built several numerical models to investigate the effects of in-situ stress (the angle between the roadway and the maximum horizontal stress) on the roadway stability [21]. Jia et al. (2017) found that the penetrating phenomenon will occur in the underground roadway during the plastic zone expansion process when the magnitude and direction of the principal stress of surrounding rock are changing [22]. Yuan et al. (2018) deduced the boundary equations for the plastic zone around the deep roadway. The evolution laws for morphology of the plastic zone and the relationship between the morphological indexes and the stability of surrounding rock were also discussed [23]. Cheng et al. (2019) simulated the distribution of stress, displacement and plastic zone with different dip angle [24]. Kong et al. (2019) studied the effect of heterogeneity on rock mass stability in an underground coal mine roadway by field investigation, laboratory testing, and numerical simulation [25]. Guo et al. (2019) proposed the characteristic radii of the circular roadway surrounding rock plastic zone to reflect the shape and key area size of the plastic zone [26]. Furthermore, the theoretical study of the distribution characteristics of the stress field around a circular cavity was performed and the directional sharp-point failure mechanism was determined by analyzing the stress destructive power using the three elements of the Mohr circle [27]. The stress response of the failure zone was also studied by loading and unloading in a single direction and changing biaxial stress models to study the failure laws during the process of rockburst in the roadway [28].
Previous studies have shown that the failure of gateroad is essentially caused by the evolution of plastic zone. It is also significant for investigating the mechanism of dynamic disasters in the gateroad [29,30]. However, the individual components of 3D in-situ stress tensor were not considered in the existing studies. Kang et al. (2010) indicated that the minimum horizontal in-situ stress was approximately half of the maximum one, and the direction of the two stress components was generally different in different orientations [31]. The principal stress field also played an important role in keeping the long-term stability of an underground gateroad. Therefore, it is necessary to investigate the influence of principal stress field on the distribution of the plastic zone ahead of the gateroad.
This paper established several numerical models by FLAC3D to investigate the influence of principal stress field on the expansion of plastic zone ahead of the gateroad. Influence factors included the maximum principal stress (P1), the angle between the P1 direction and the Z-axis (α), the minimum principal stress (P3), and the ratio of maximum principal stress to minimum principal stress (P1/P3). Then, the distribution characteristics of plastic zone are summarized under different principal stress fields, and the implications for the coal and gas outburst induced by the expansion plastic zone ahead of gateroad is also discussed. The following study is expected to provide some new insights into the mechanism, prediction, and prevention of dynamic disasters ahead of the gateroad.

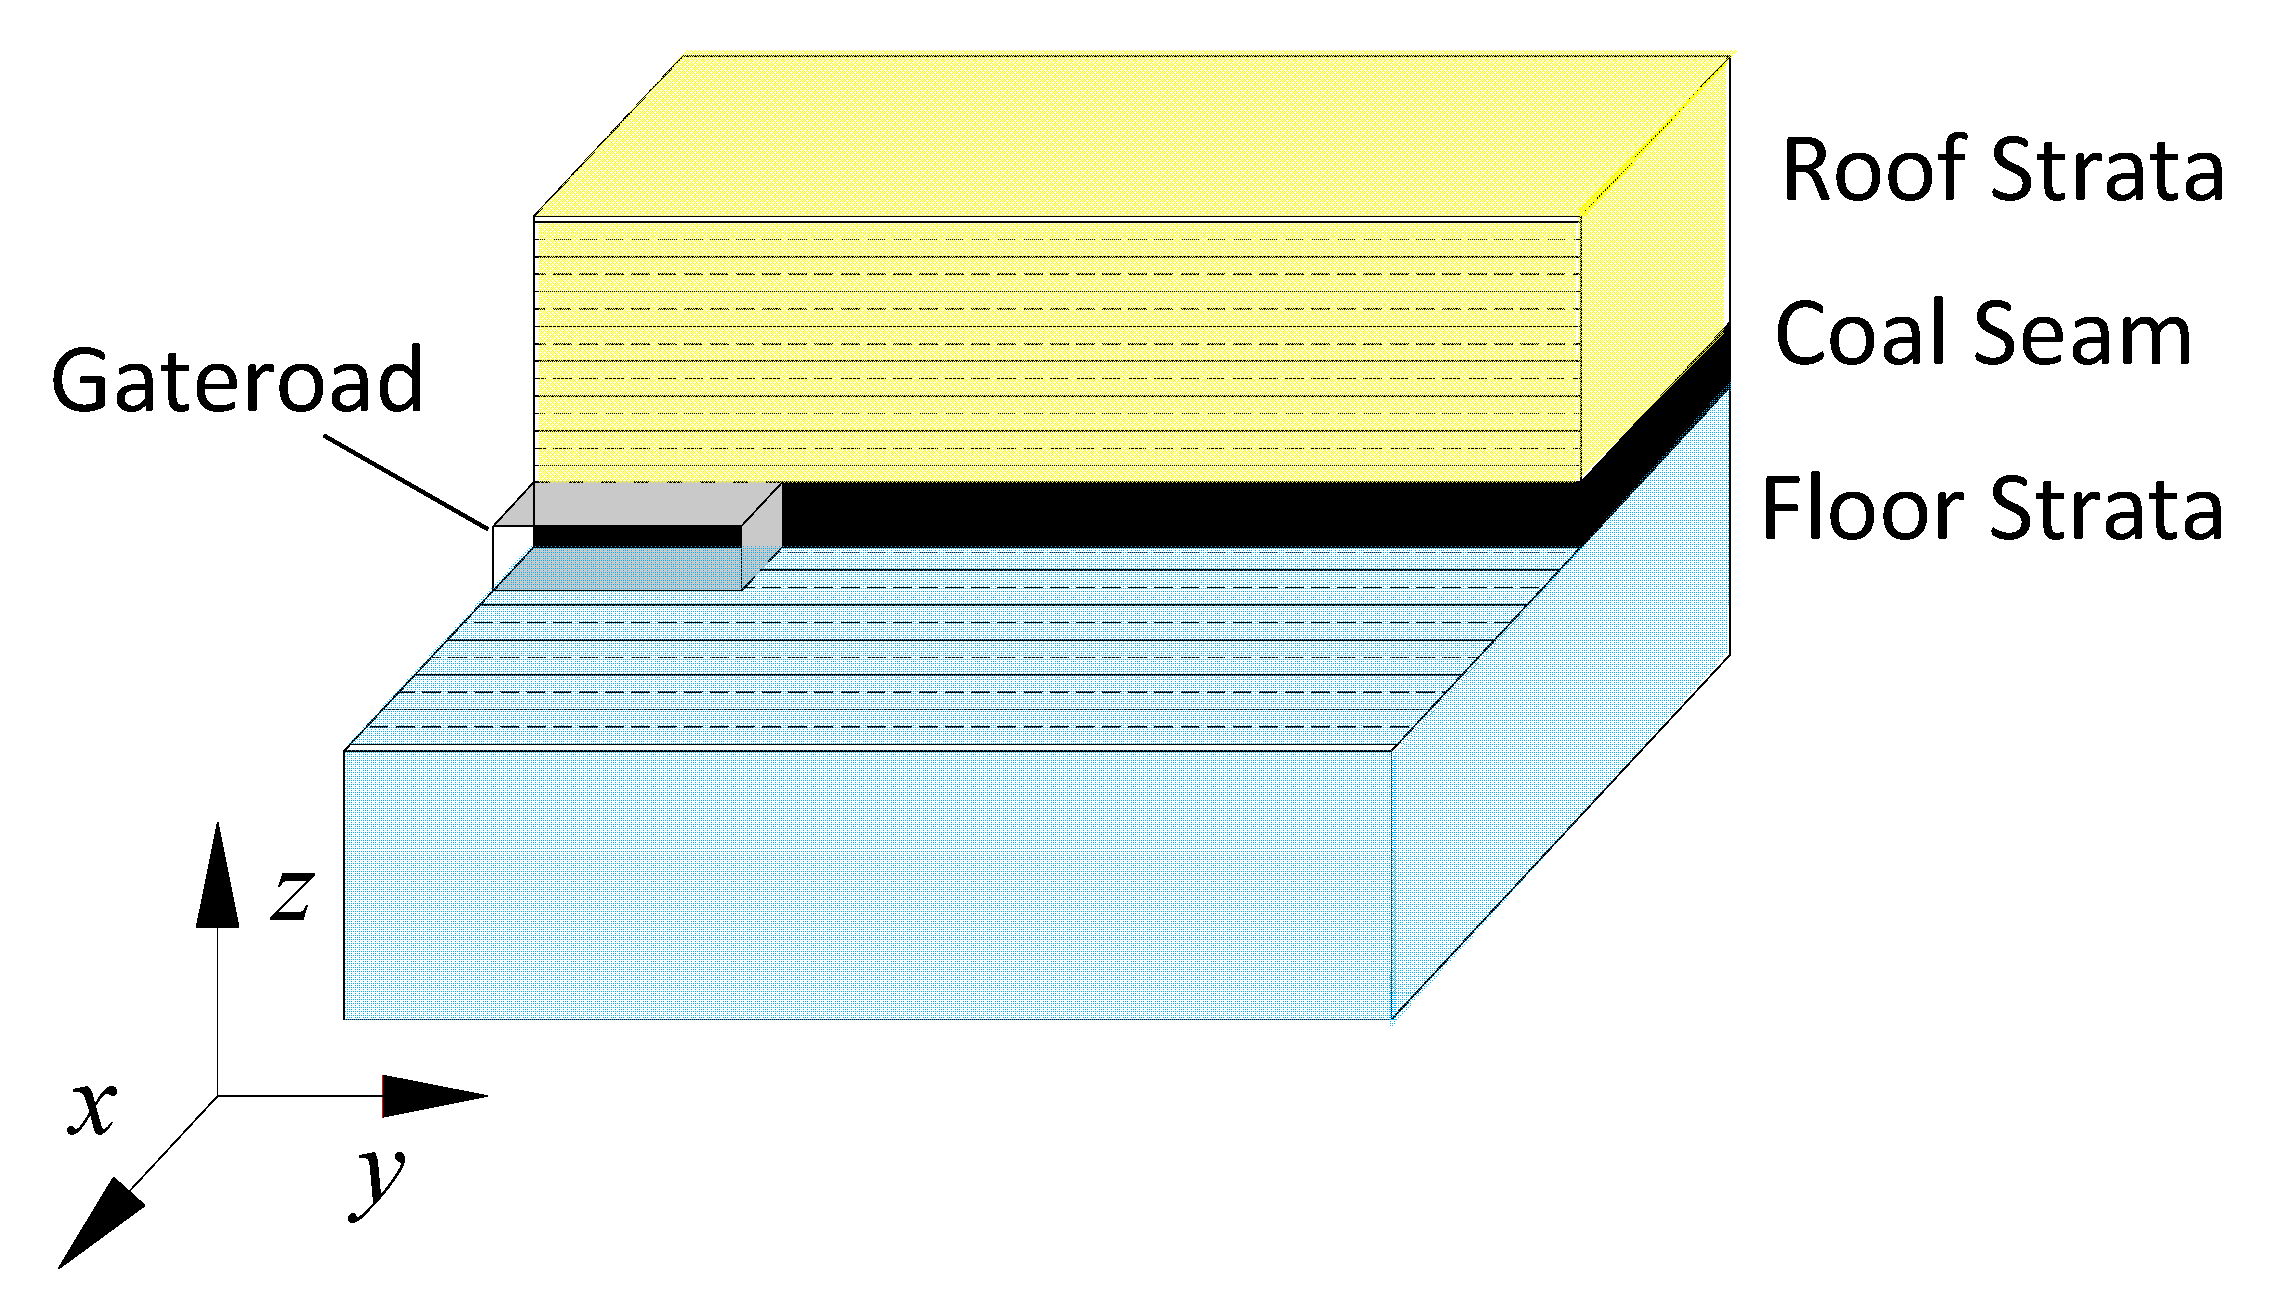
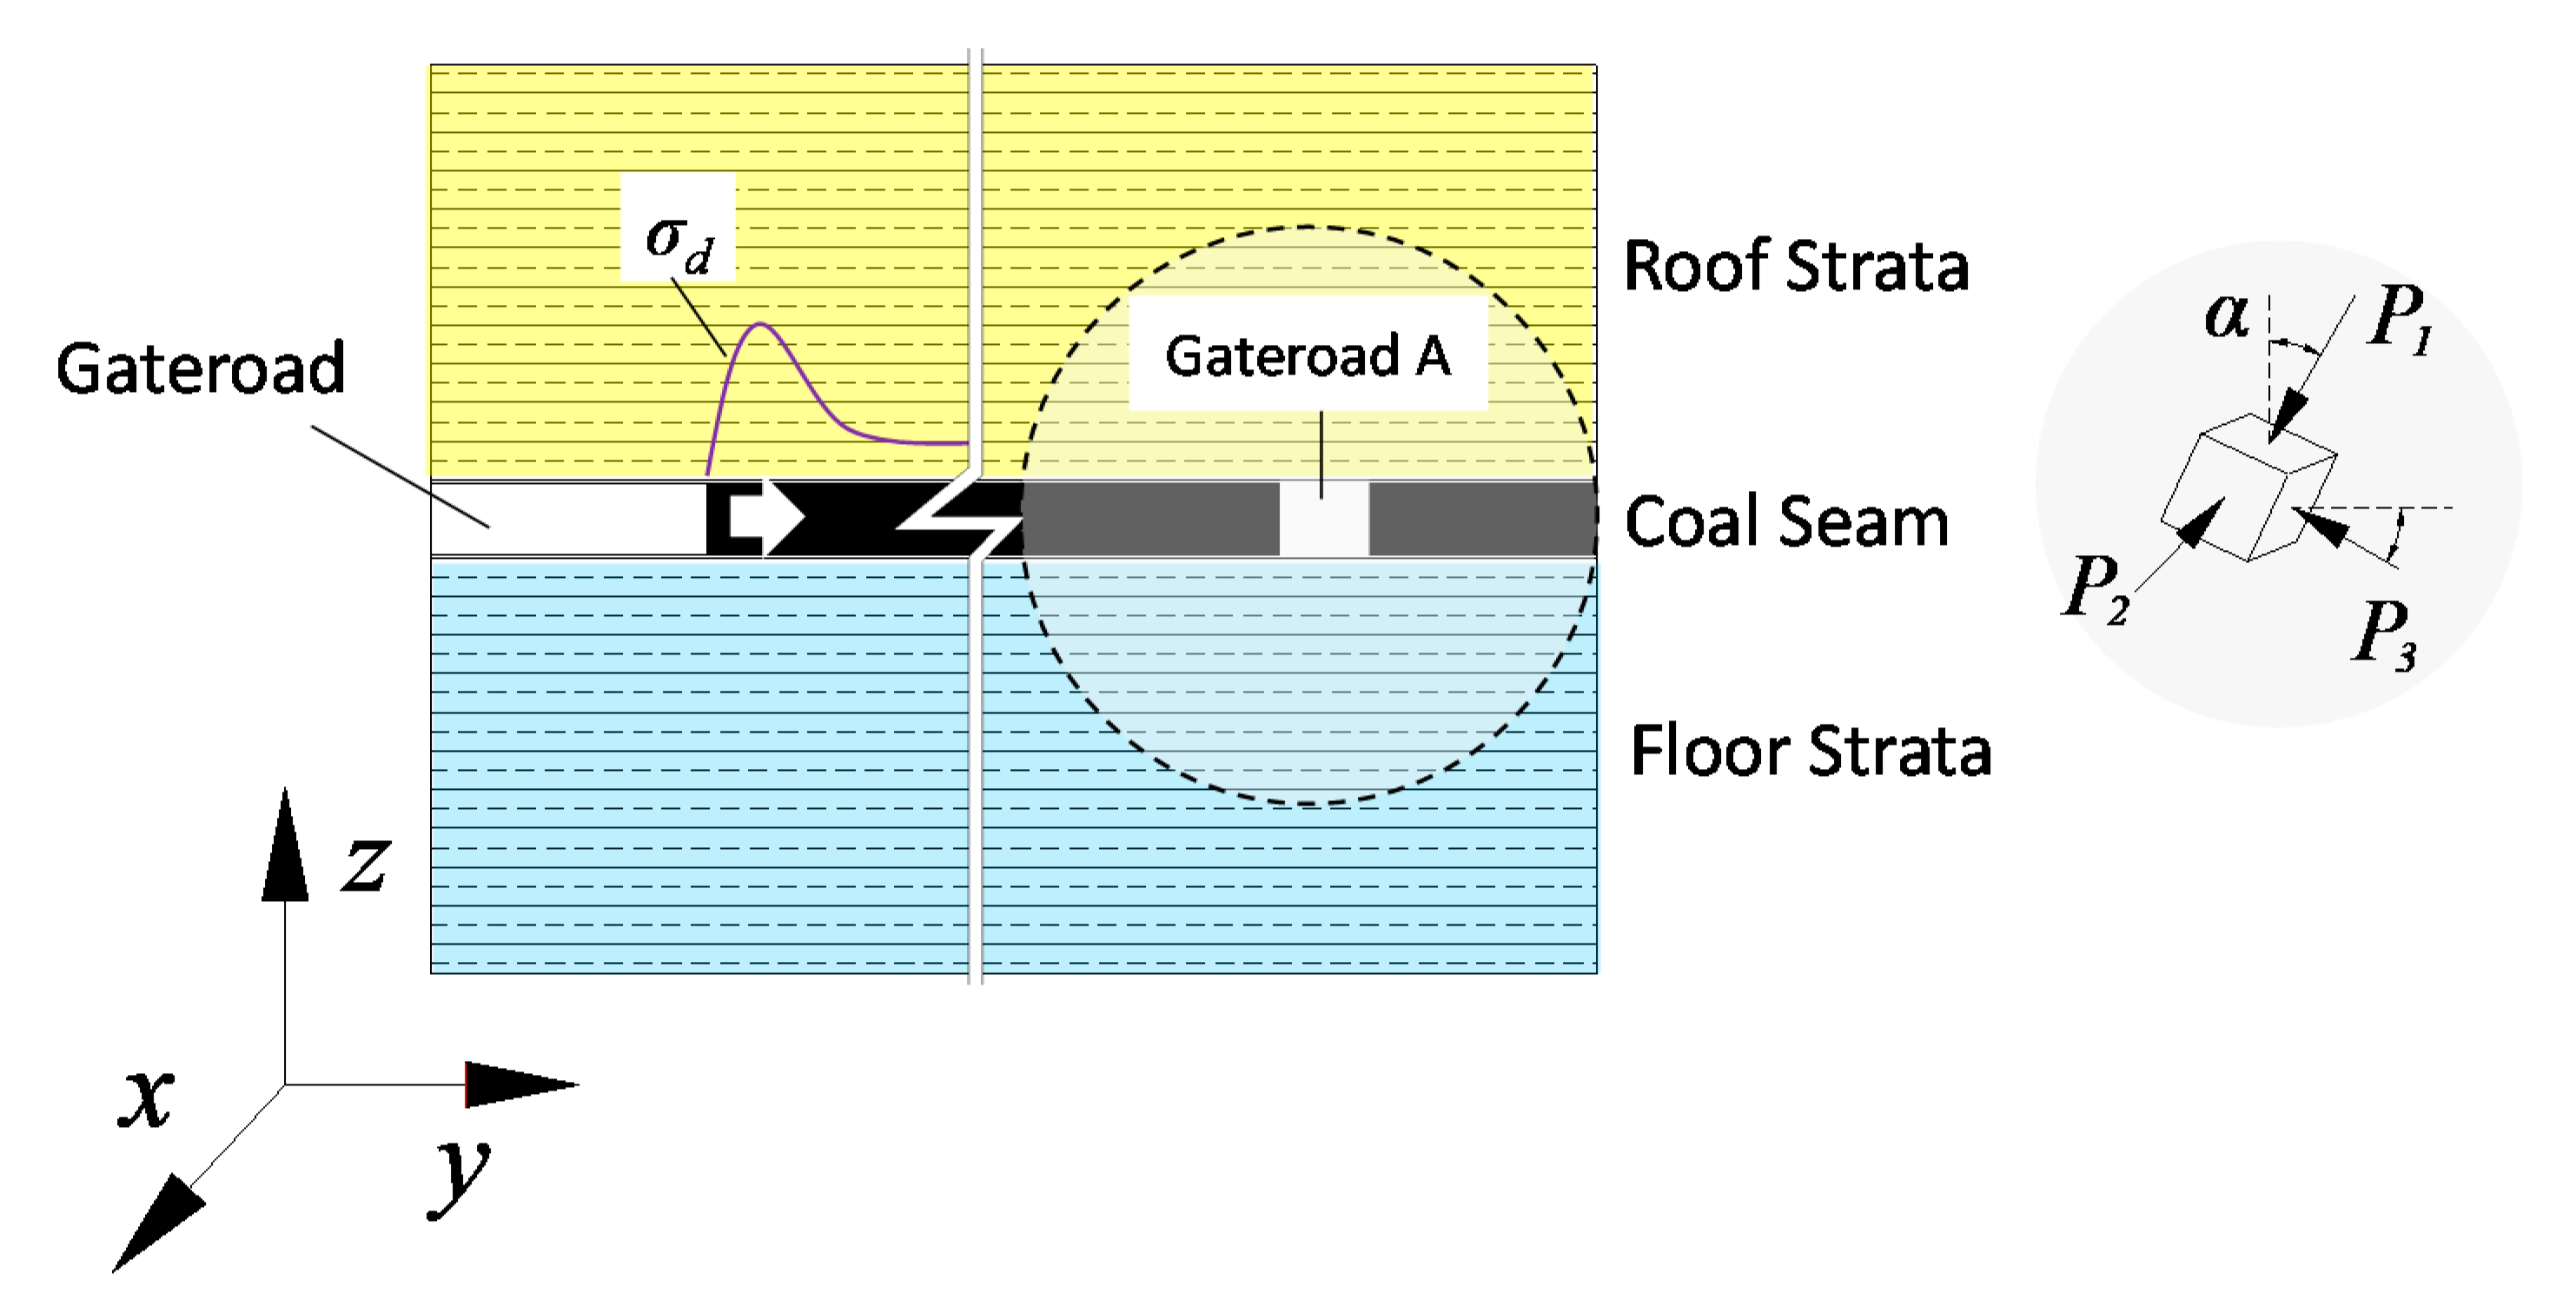
2. Numerical Model Setup

In order to simulate the plastic zone distribution characteristics around the gateroad, a layered rock mass numerical modelling was established by FLAC3D software, which is shown as Figure 1. In the numerical model, the Mohr-Coulomb constitutive model was used. The size of numerical model was 50 m in the X-axial, 80 m in the Y-axial, and 80 m in the Z-axis. The section of gateroad was a rectangle. The length and width were 5 and 4 m, respectively. In the numerical model, the non-excavation planes were fixed with displacement constraints at all directions. The excavation planes were fixed with displacement constraints at the X-axial and the Y-axial directions. The gateroad was located as shown in Figure 1, in which the excavation direction was along the γ-axis.
The mechanical parameters for coal and rock are given in Table 1, which were mainly determined by laboratory testing. The exploration drilling was conducted in the case study coal mine in order to obtain the standard samples and test the geotechnical parameters. The density was calculated by measuring the mass and volume of standard coal/rock samples. The uniaxial compressive tests were carried out to obtain the compressive strength, Poisson’s ratio, and elastic modulus. The internal friction angle and cohesion were acquired by shear tests. Moreover, the bulk modulus and shear modulus were calculated by the following formulae:
{ K = 1 3 ( 1 2 v ) G = 1 2 ( 1 + v )
where K is bulk modulus, G is shear modulus, E is elastic modulus, and ν is Poisson’s ratio.
It should be noted that three kinds of coal are presented in Table 1 with different mechanical parameters, which were numbered No. I, No. II and, No. III coal.

3. Modelling Plans

In mining practice, the original stress field of rock mass is a three-dimensional unequal compressive stress field, which is mainly composed of the self-weight stress field and tectonic stress field. The magnitudes and directions of three principal stresses are different with the spatial positions. Generally, the initial balanced stress field can be affected by the mining-induced stress, which will lead to the size and direction change of principal stresses at different degrees [32]. Based on the existing results, the following four calculation numerical schemes were designed to study the influences of principal stress direction, ratio, and magnitude on the expansionary law of plastic zone in coal and rock mass ahead of the gateroad.

3.1. Plan 1

The magnitude of principal stress in the numerical model was invariant, which was set as follows: P1 = 36.5 MPa, P2 = 20 MPa, P3 = 10 MPa. The lithology of the coal seam was consistent with No. II coal in Table 1. When P1 and P3 were rotated along the X-axis, an angle α was formed by P1 direction and the Z-axis shown in Figure 2. In Plan 1, the plastic zone distribution characteristics ahead of the gateroad were studied when α was 0°, 15°, 30°, 45°, 60°, and 75°, respectively.

3.2. Plan 2

P2 was equal to P3 in the numerical model of Plan 2. α was set at 50°, and the physical and mechanical parameter of coal seam met with those of No. II coal in Table 1. In order to study the effect of P1/P3 (the ratio of maximum principal stress to minimum principal stress) on the plastic zone distribution, the magnitude of P1/P3 was set as 1, 1.5, 2, 2.5, 3, and 3.5, respectively.

3.3. Plan 3

P2, P3, and α in the numerical model were invariant in Plan 3, which were set as follows: P2 = 20 MPa, P3 = 10 MPa, α = 50°. The lithology of coal seam is consistent with No. I, II and III coal in Table 1. The plastic zone distribution characteristics ahead of the gateroad were studied in Plan 3 when the maximum principal stress P1 was 25, 8, 31, 33, 35, and 36.5 MPa, respectively.

3.4. Plan 4

P1, P2 and α in the numerical model were invariant in Plan 4, which were set as follows: P1 = 36 MPa, P2 = 20 MPa, α = 50°. The lithology of coal seam was consistent with No. I, II, and III coal in Table 1. The plastic zone distribution characteristic ahead of the gateroad was studied in Plan 3 when the minimum principal stress P3 was 15, 13, 12, 11, 10, and 9.8 MPa, respectively.

4. Numerical Modelling Results

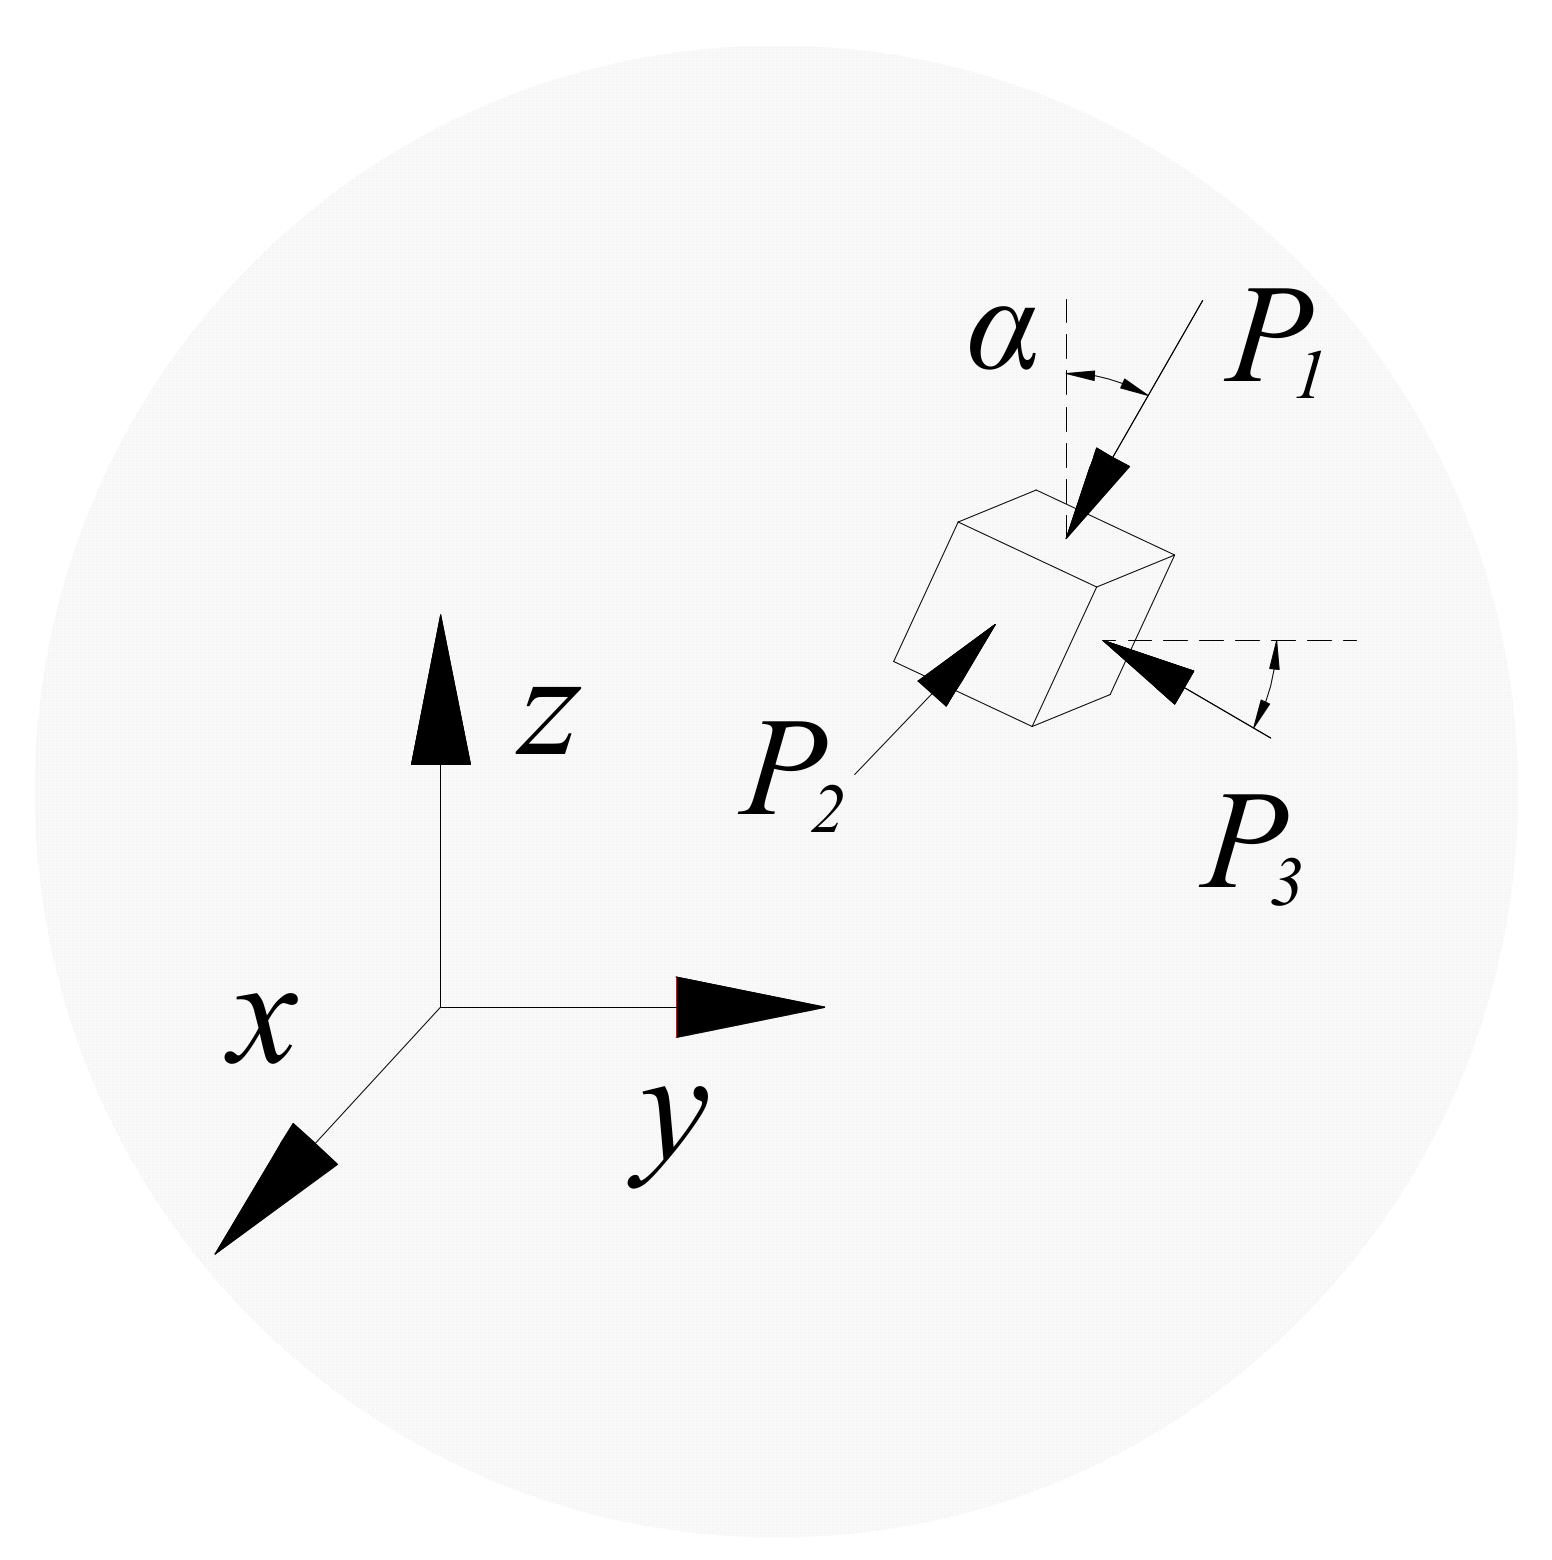
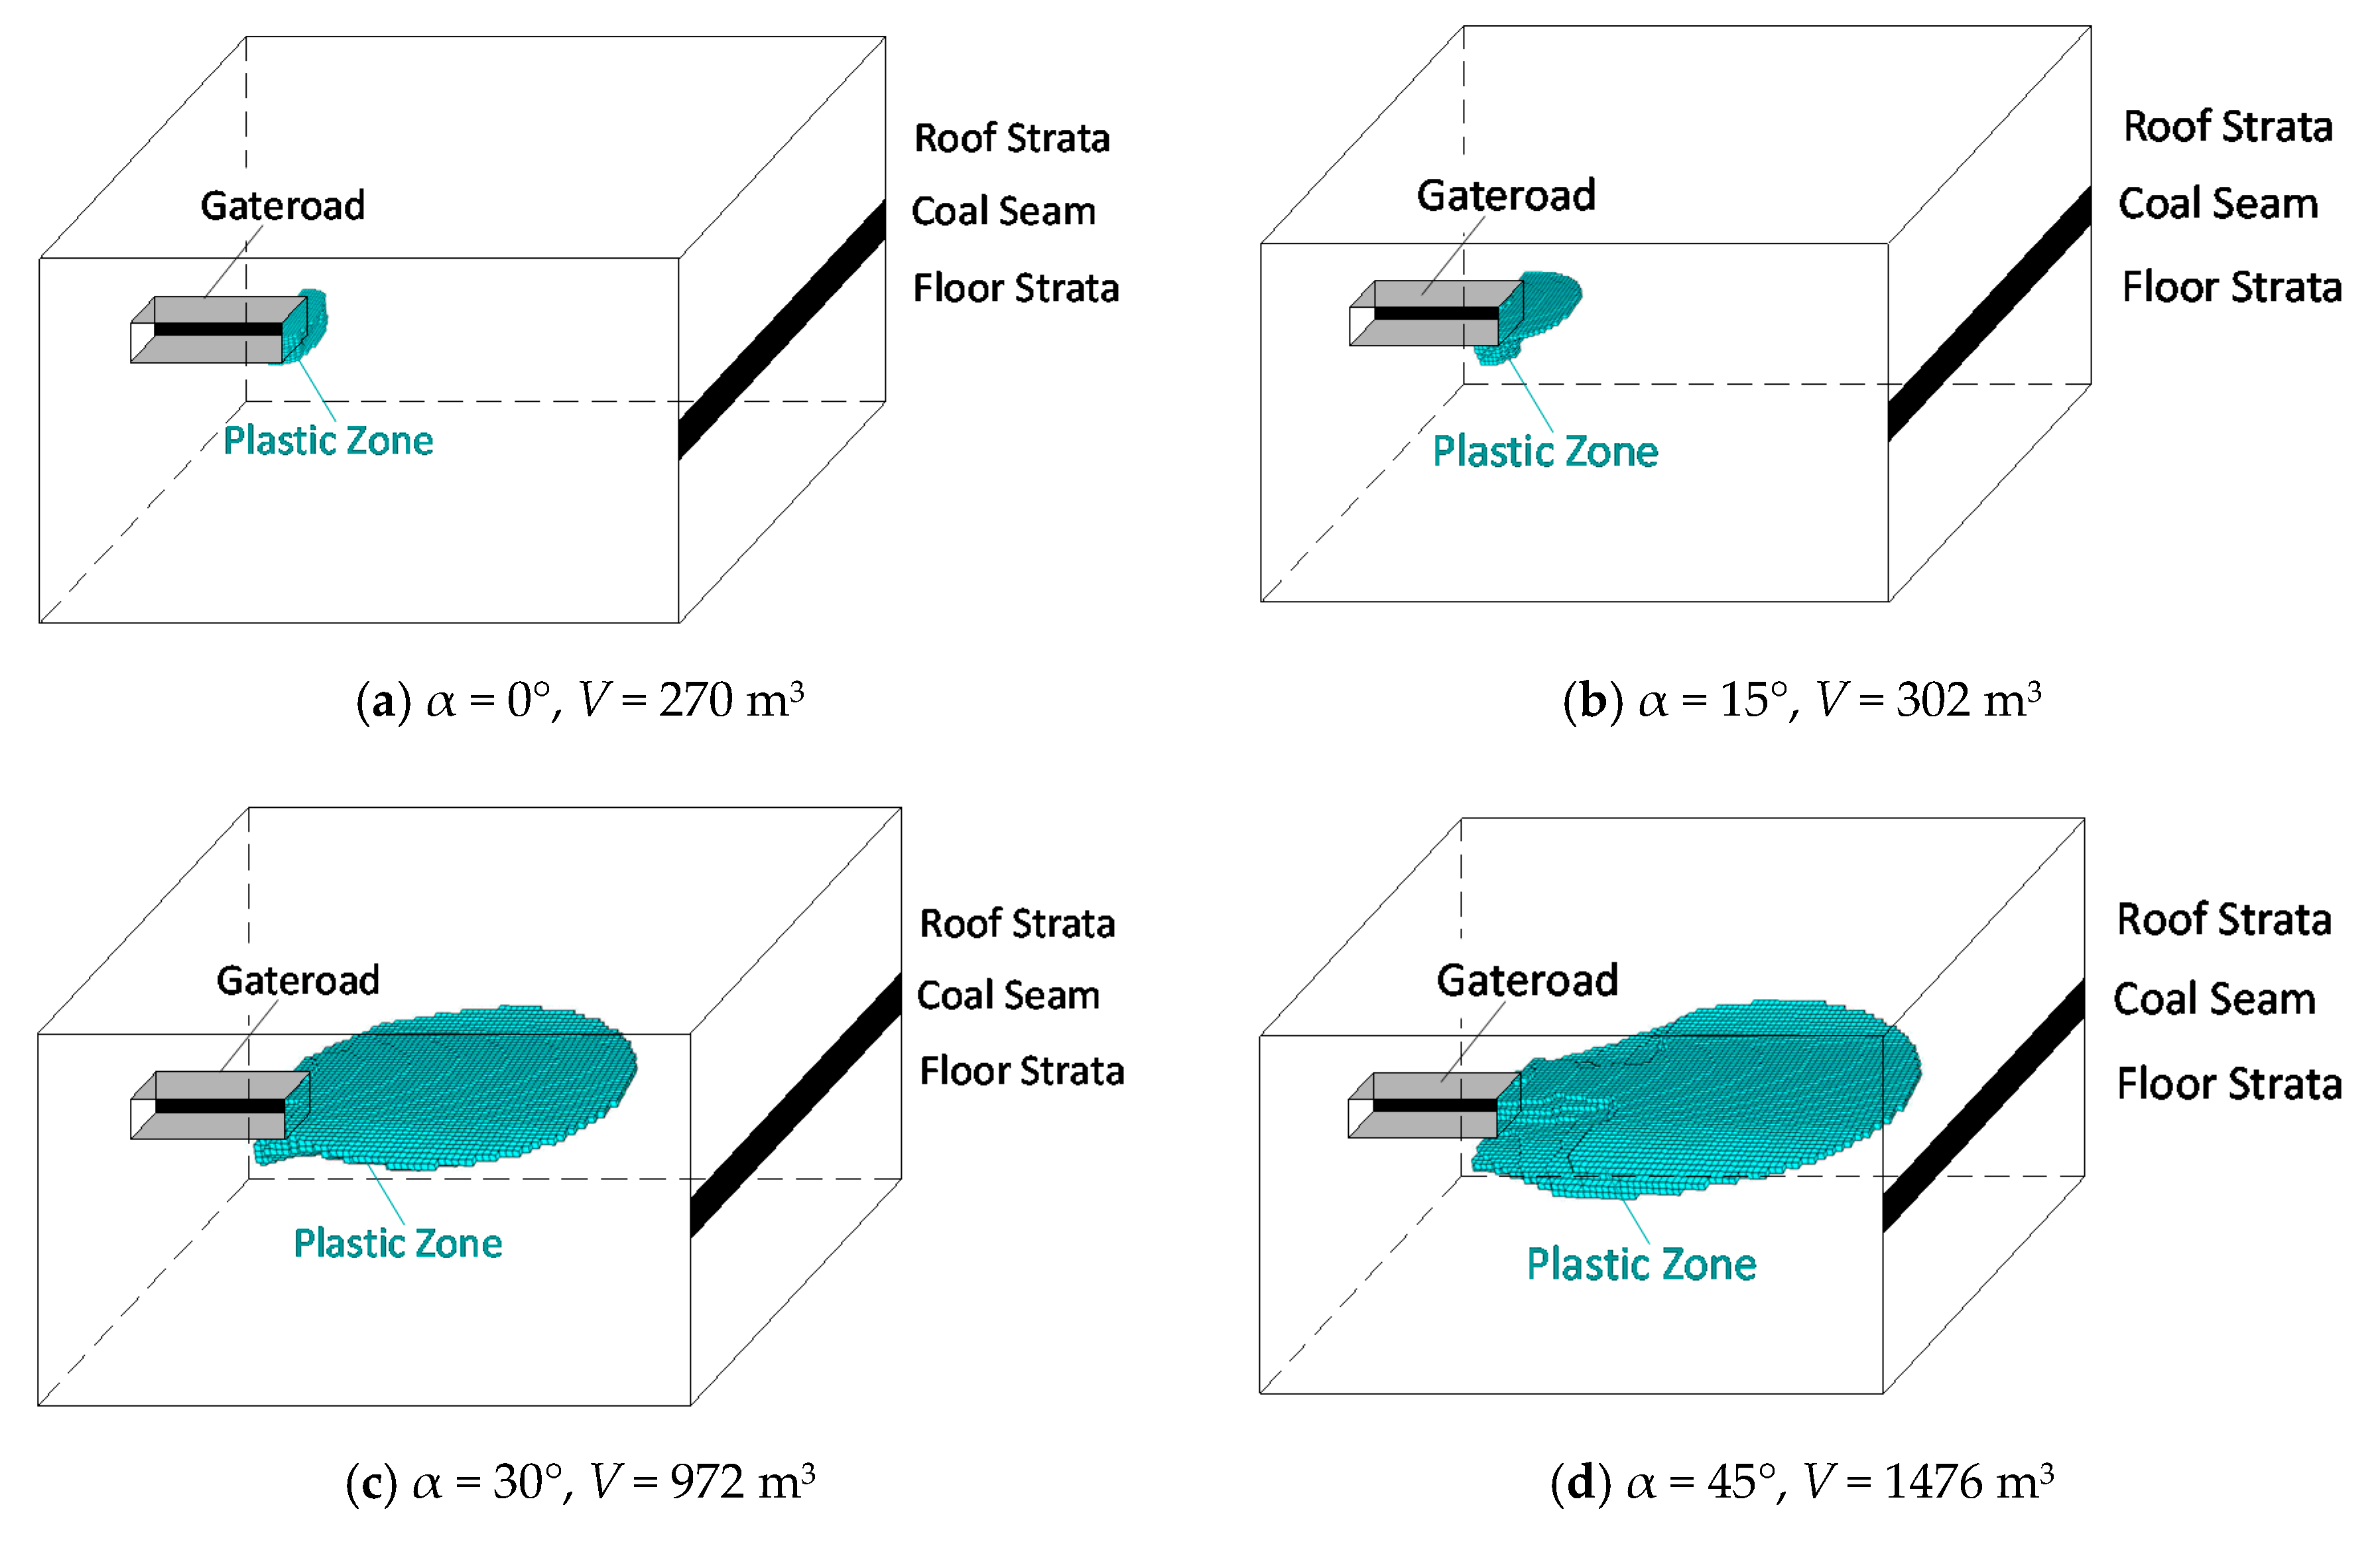
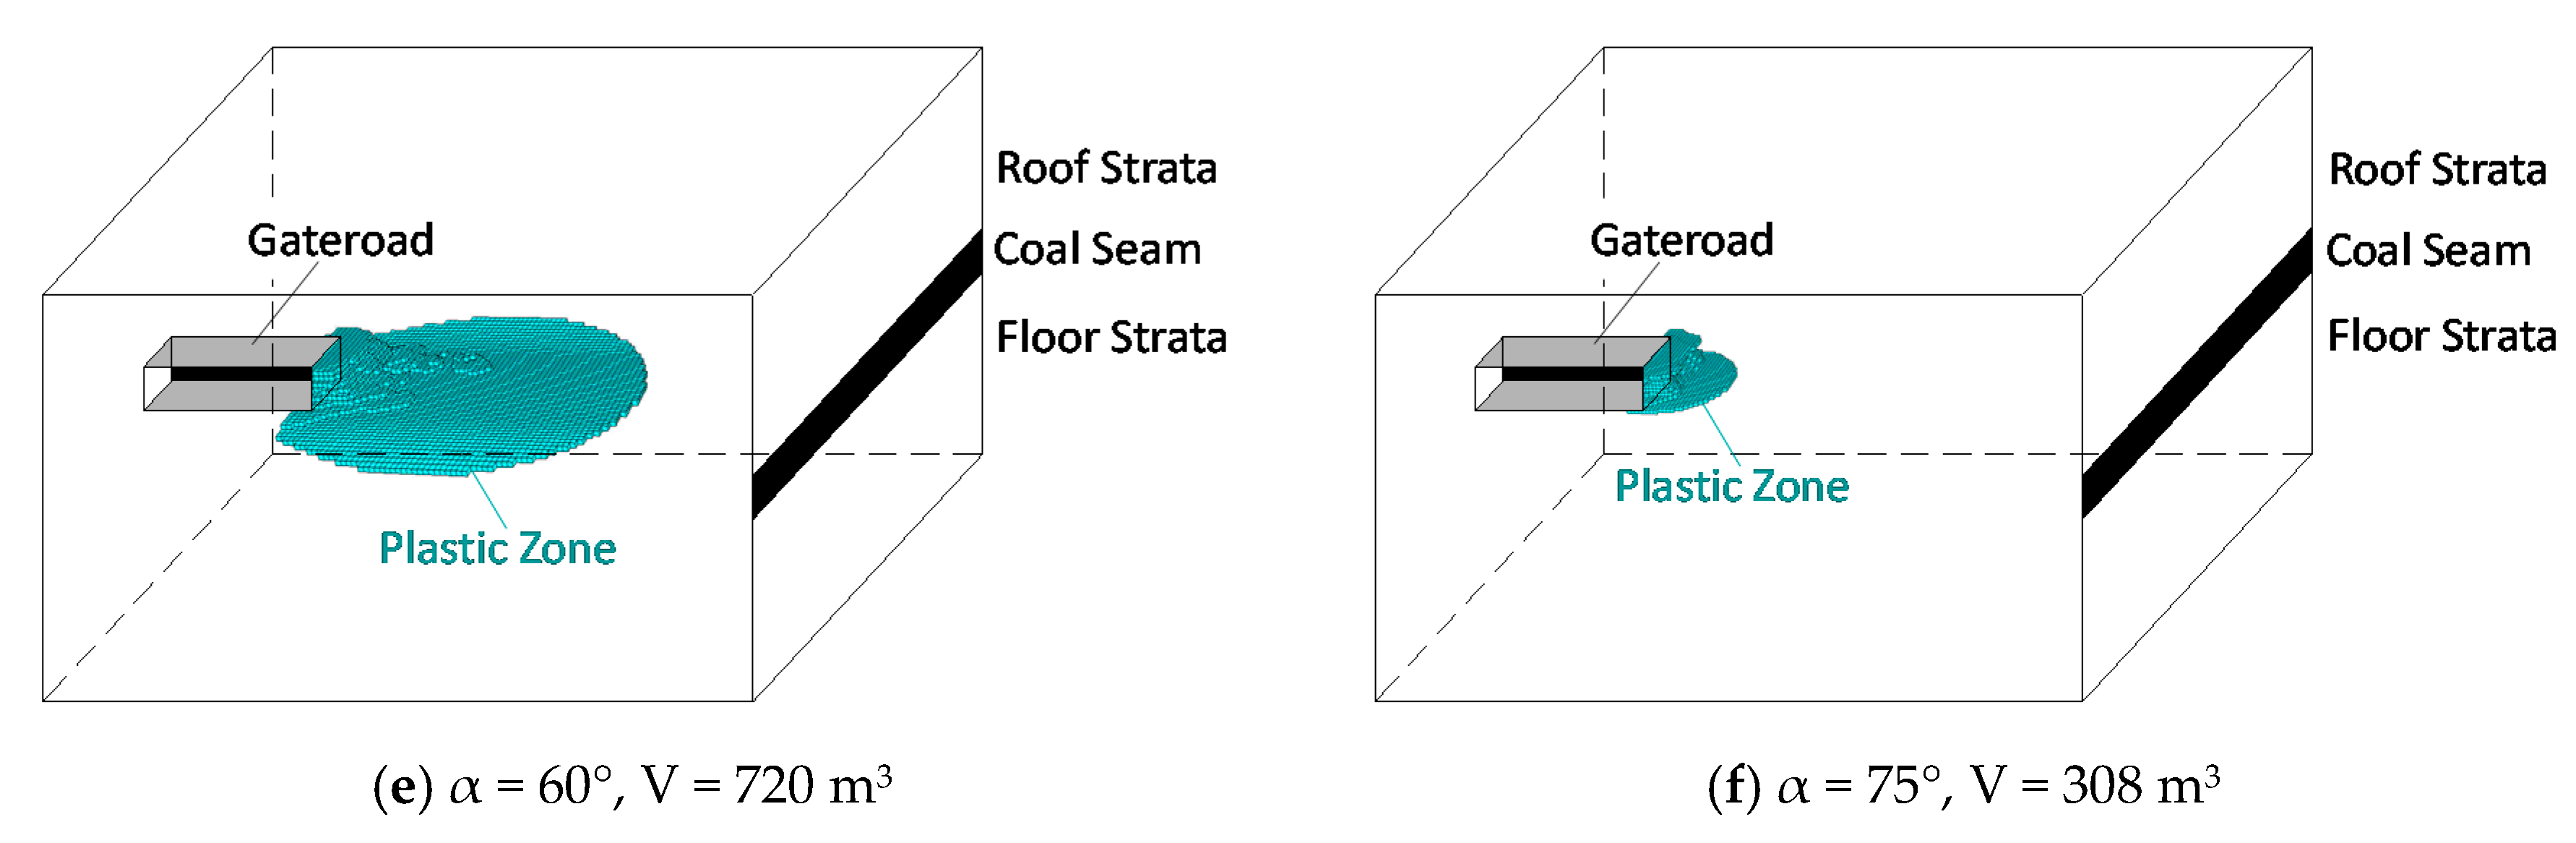
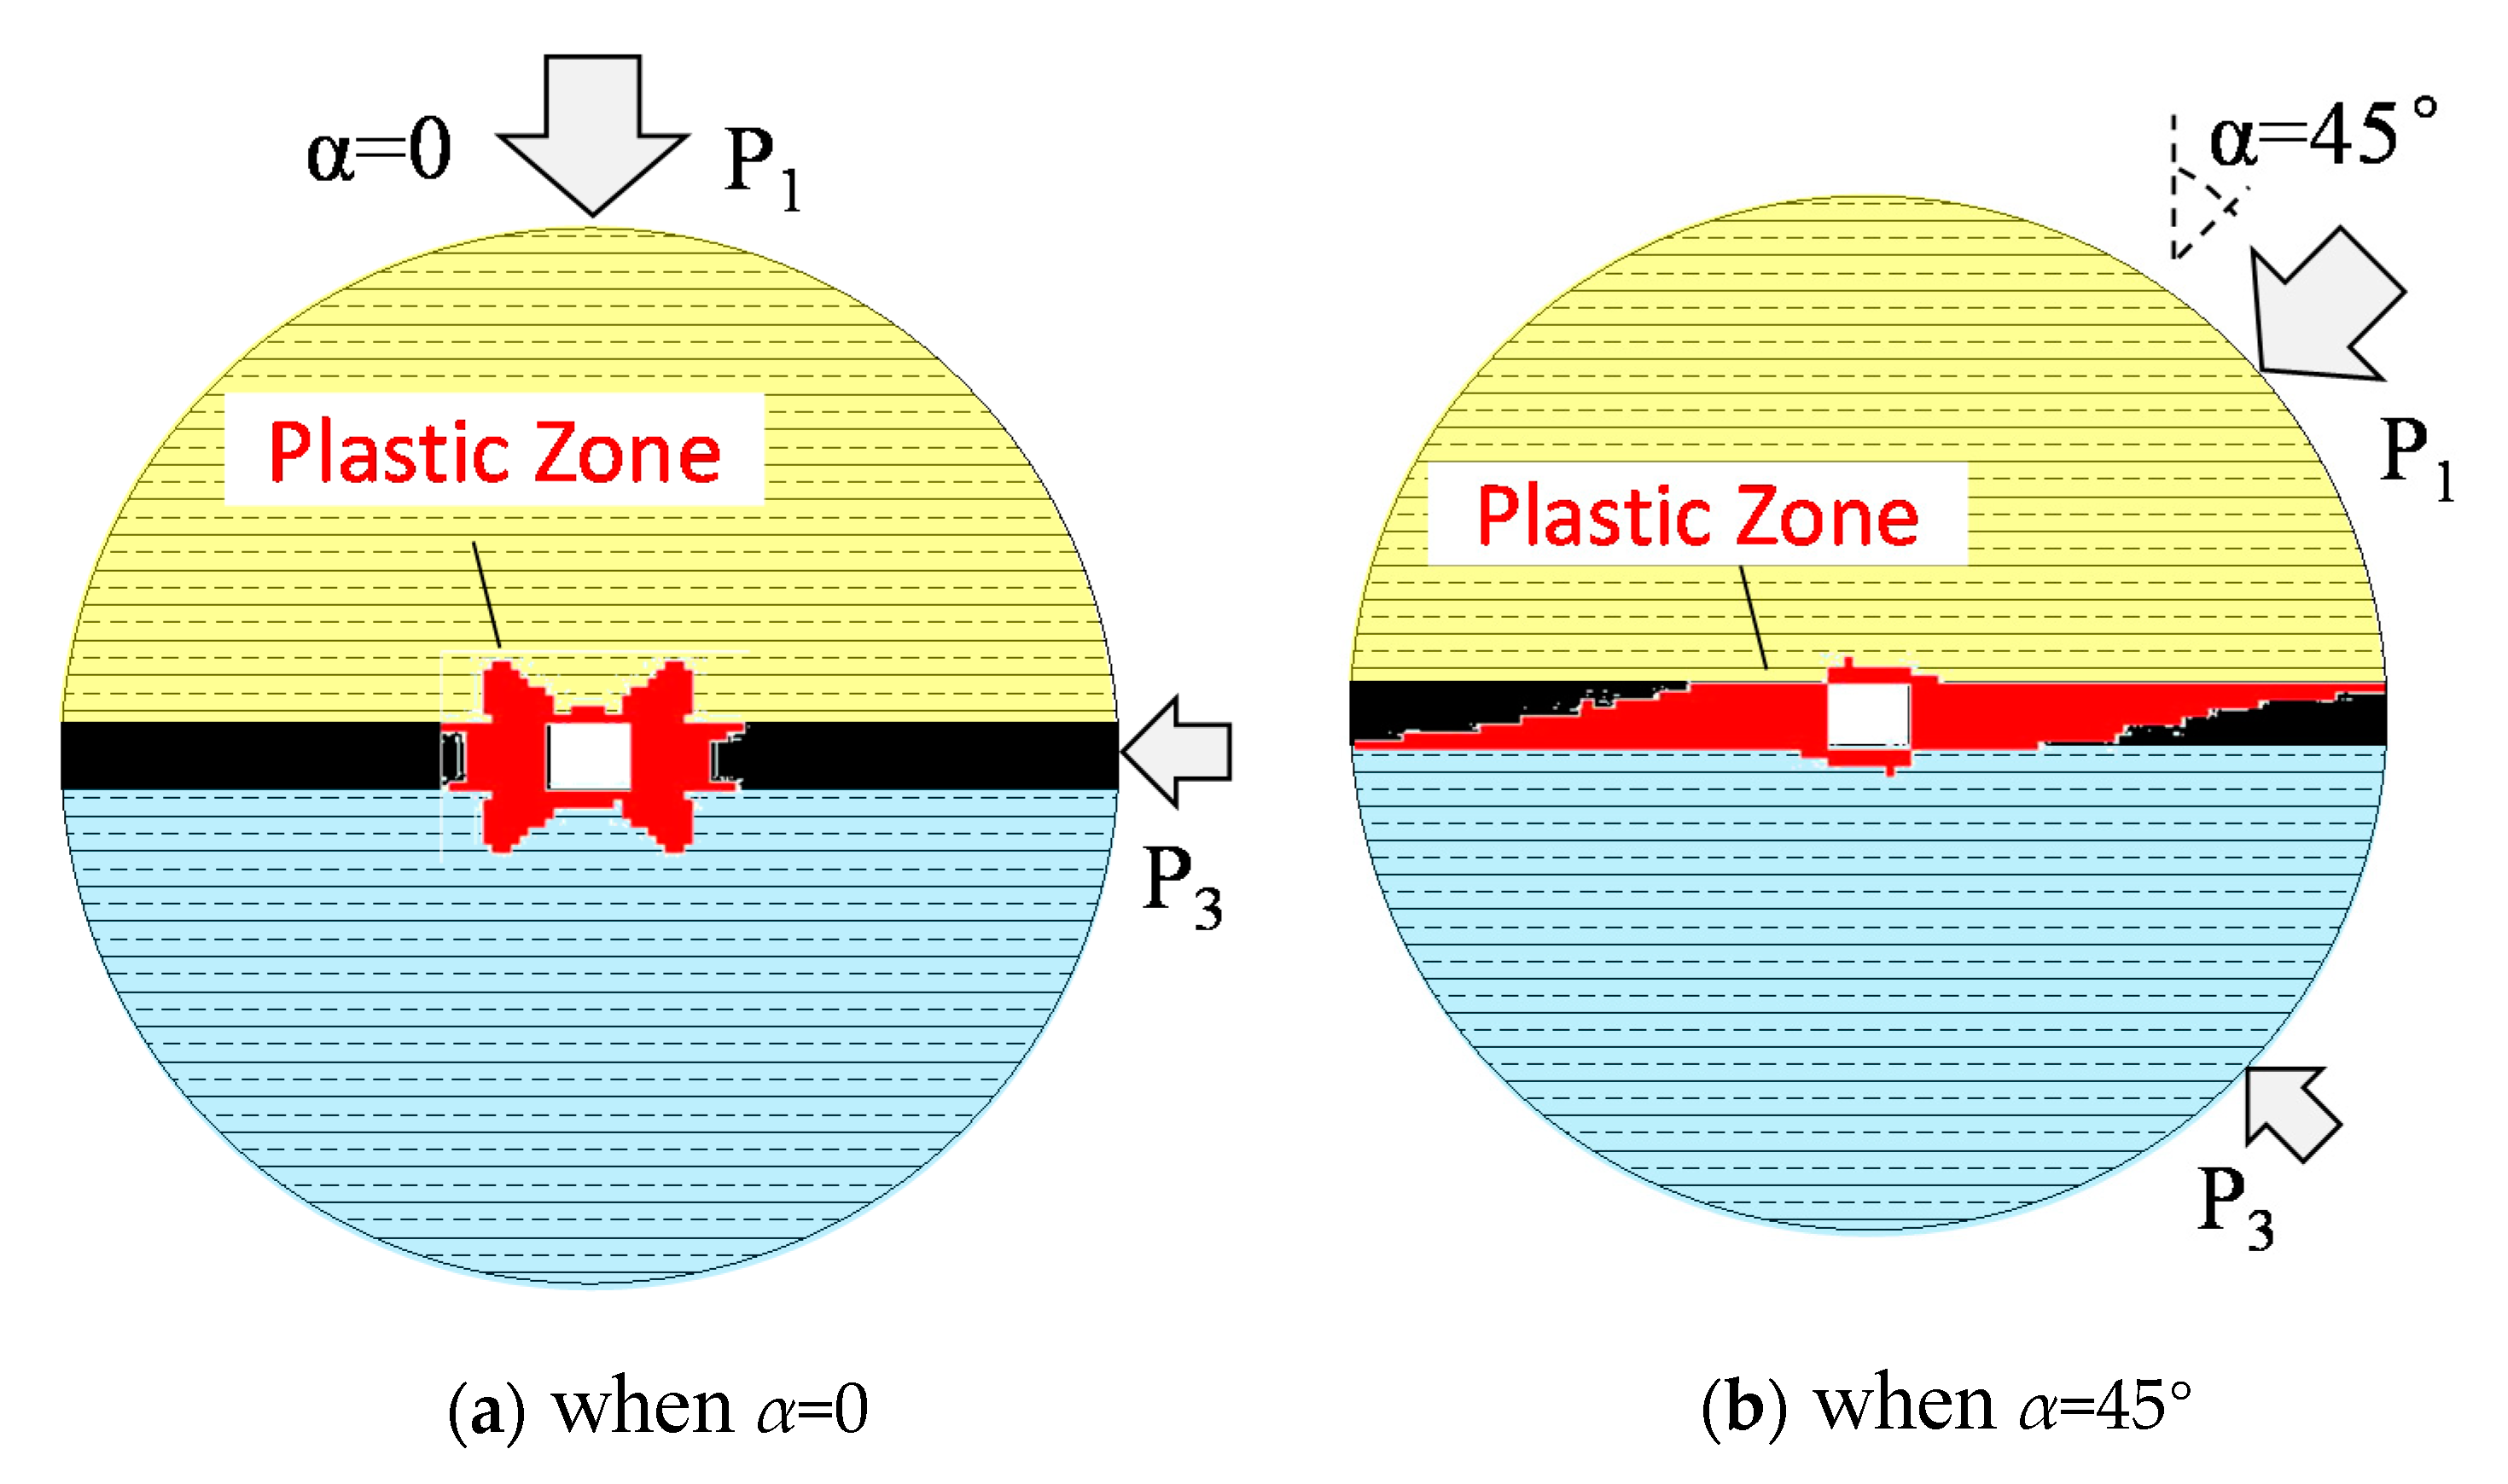
4.1. Influence of α (Angle between the P1 Direction and the Z-Axis)

The results from Plan 1 are shown in Figure 3. It shows that the plastic zone is mainly located ahead of the road when α is 0°, which has a relatively small area, and the plastic zone has no butterfly-shaped characteristics. The plastic zone volume is 302 m3 when the α is 15°. It is primarily distributed in the upper-front part of the gateroad. The shape of plastic zone is like a butterfly wing when α is 30° and 45°, and the volume of plastic zone is 972 m3 and 1476 m3, respectively. It should be noted that the butterfly wing morphology in the plastic zone is relatively complete. Afterwards, the butterfly wing in the plastic zone gradually disappears. When α is 60°, the plastic zone shape is unchanged. However, the volume of plastic zone decreases. The magnitude is 720 m3. Similarly, the plastic zone volume decreases significantly when α is 75°. It drops to 308 m3, and the plastic zone is mainly distributed at the bottom of the gateroad.
Overall, the morphological characteristics of the butterfly wing in the plastic zone are gradually obvious when α ranges from 0° to 45°, and the morphological distribution of butterfly wing is disappeared when the α ranges from 45° to 90°. The plastic zone volume increases first and then decreases with the increase of α. That is, the plastic zone volume fits the normal distribution. The maximum volume of plastic zone is obtained when α is 45°. In this situation, the butterfly wing-shaped plastic zone is deflected into the coal seam. That is, the direction of butterfly-shaped plastic zone ahead of gateroad is rotating with the evolution of α. When the butterfly-shaped plastic zone is in the same direction with the coal seam, the most complete shape and volume of the plastic zone are obtained.

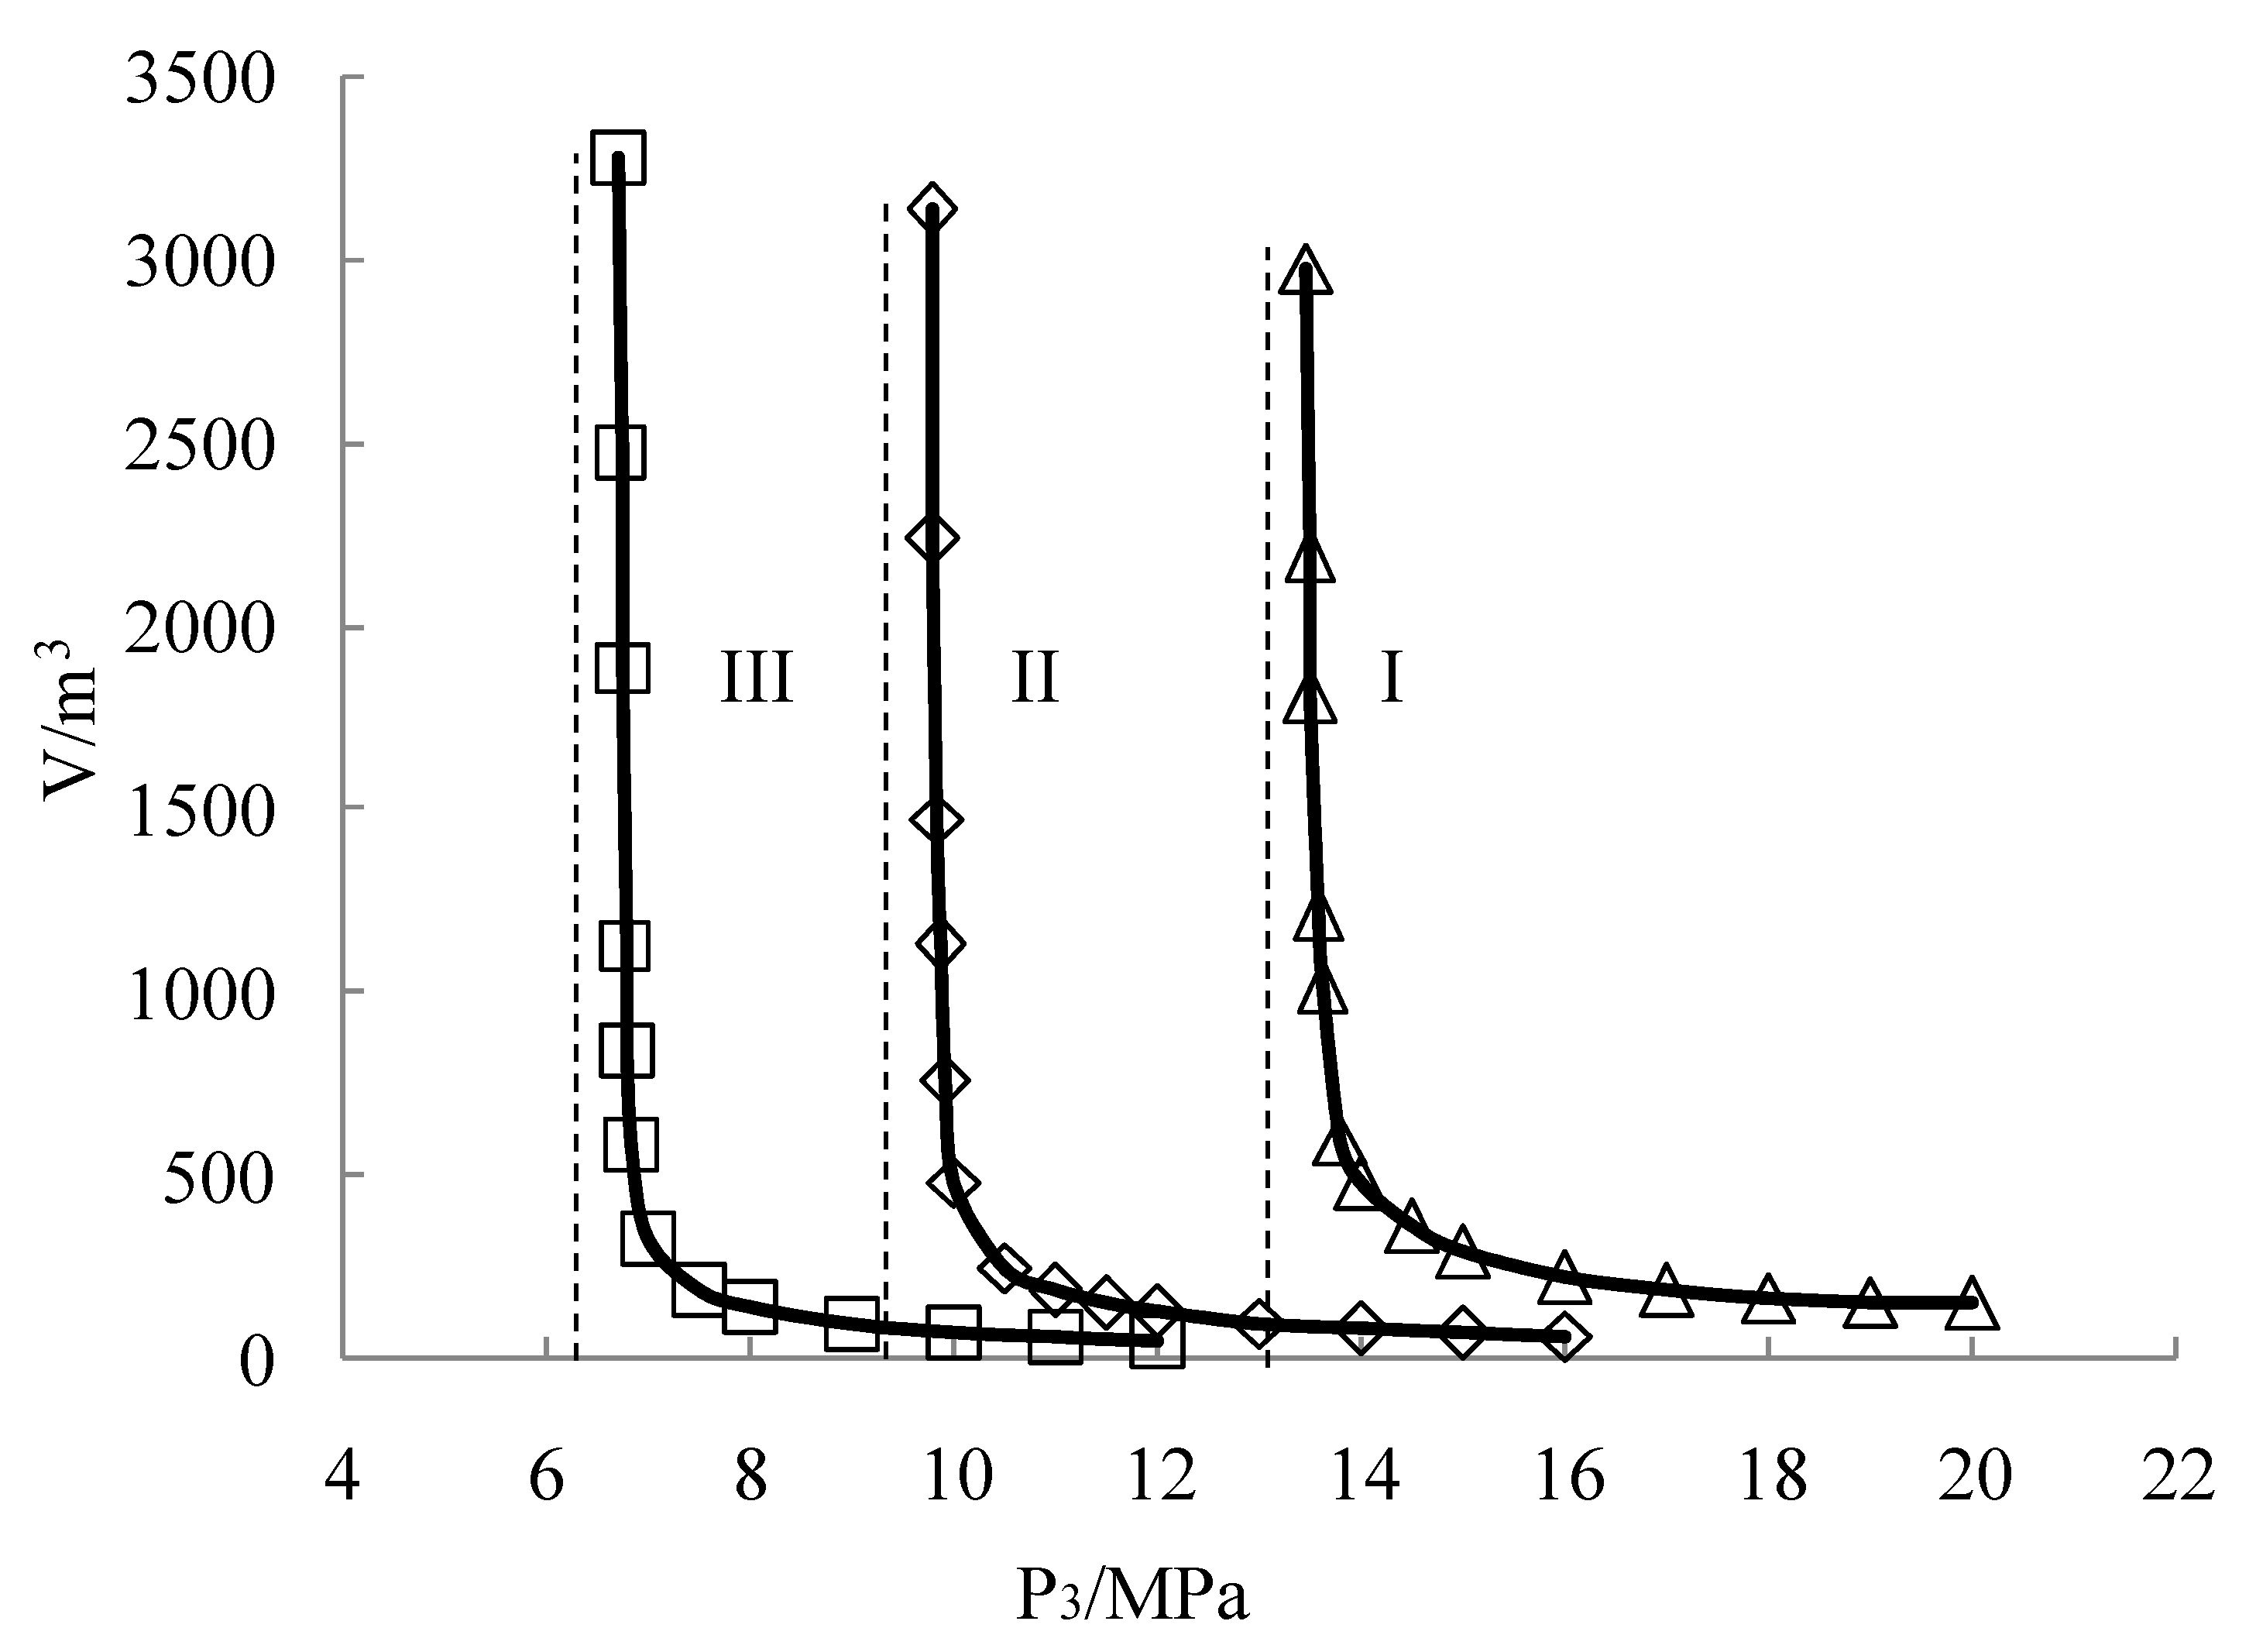
4.2. Influence of P1/P3 (Ratio of Maximum Principal Stress to Minimum Principal Stress)

The relationship of plastic zone volume and P1/P3 are shown in Figure 4 and Figure 5, which are obtained from the numerical calculation results in Plan 2.
(1).
When the magnitude of P1/P3 ranges from 1 to 3, the plastic zone volume ahead of gateroad increases linearly. The growth slope is approximately the same when P1/P3 is 1, 1.5, and 2. In these situations, the plastic zone volume is almost the same if P1 is constant. The shape of plastic zone in Figure 5 corroborates the above explanation. As shown in Figure 5a–c, the plastic zone volume is 68 m3, 59 m3, and 71 m3 when the P1/P3 is 1, 1.5, and 2.
(2).
The growth slope increases when P1/P3 is 2.5 and 3. In these situations, significant differences of plastic zone volume are observed when P1 is constant. The larger the value of P1/P3, the larger the plastic zone volume. In Figure 4, the plastic zone volume is 116 m3 and 232 m3 when the P1/P3 is 2.5 and 3, which is also shown as Figure 5d,e.
(3).
When the magnitude of P1/P3 is 3.5, the plastic zone volume ahead of gateroad presents approximately exponential growth along with the increasing of maximum principal stress. The magnitude reaches to 1878 m3 when the P1 equals to 44 MPa. Shown as Figure 5f, the distribution range of plastic zone is obviously increased ahead of gateroad. It should be noted that the dashed line in the Figure 4 refers to the critical value of maximum principal stress (P1) when the P1/P3 is 3.5. When the green line going asymptotically upwards to the dashed line, the plastic zone volume increases rapidly along with the growth of P1. Ultimately, it increases to infinity when the critical value of P1 is obtained.

4.3. Influence of P1 (Maximum Principal Stress)

The distribution range and shape of plastic zone in Plan 3 are shown in Figure 6, in which the physical and mechanical parameters of coal seam are the same as those of No. II coal in Table 1. In this situation, the volume of plastic zone ahead of the gateroad increases with the growth of maximum principal stress. When P1 is 25 MP, 35 MP, and 36.5 MPa, P2 = 20 MPa, P3 = 10 MPa, α = 50°, the volumes of plastic zone ahead of the gateroad are 55 m3, 272 m3 and 1439 m3, respectively. It should be noted that the shape of plastic zone in these situations evolves like a flat ball.
Figure 7 shows the relationship between the plastic zone volume and the maximum principal stress when the physical and mechanical parameters of coal seam are corresponding with those of No. I, No. II, and No. III coal in Table 1. Apparently, the curves at different situations show a similar evolution trend. With the increase of P1, the exponential growth of plastic zone volume is presented approximately. The plastic zone volume approaches infinity when the critical value of maximum principal stress ([P1]) is obtained. It also indicated that the critical value of P1 is increasing with the growth of coal mass strength.

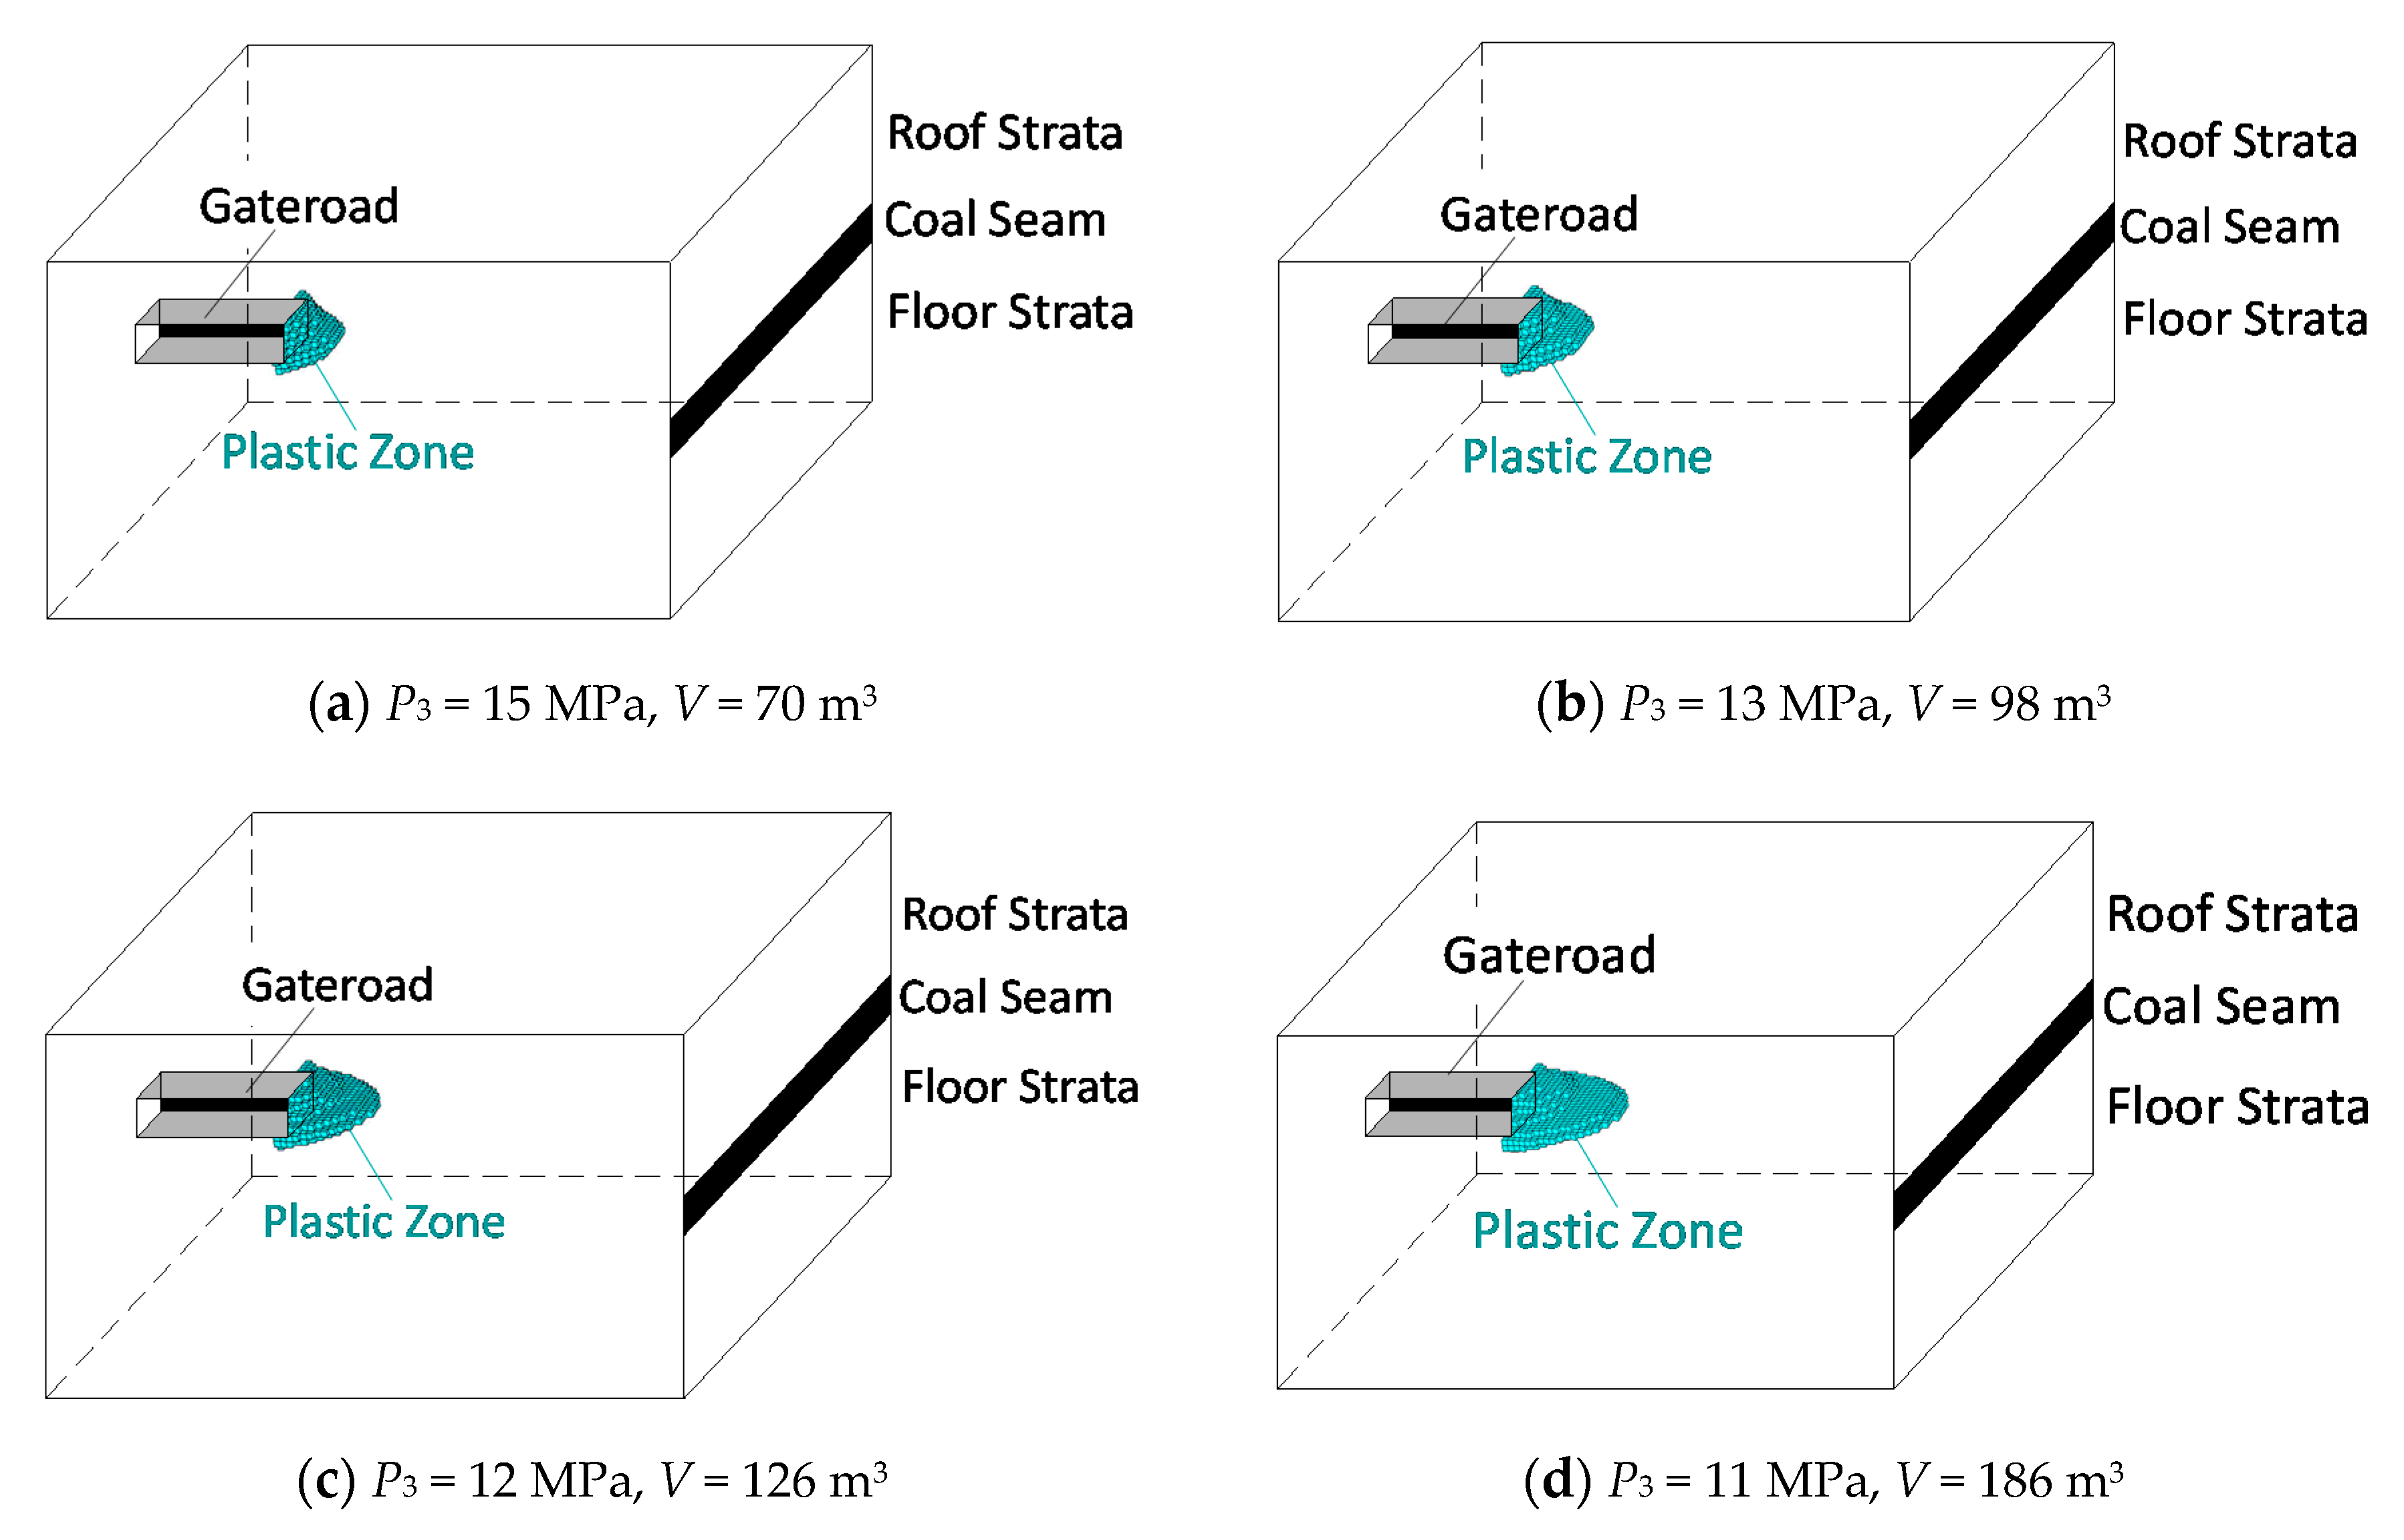
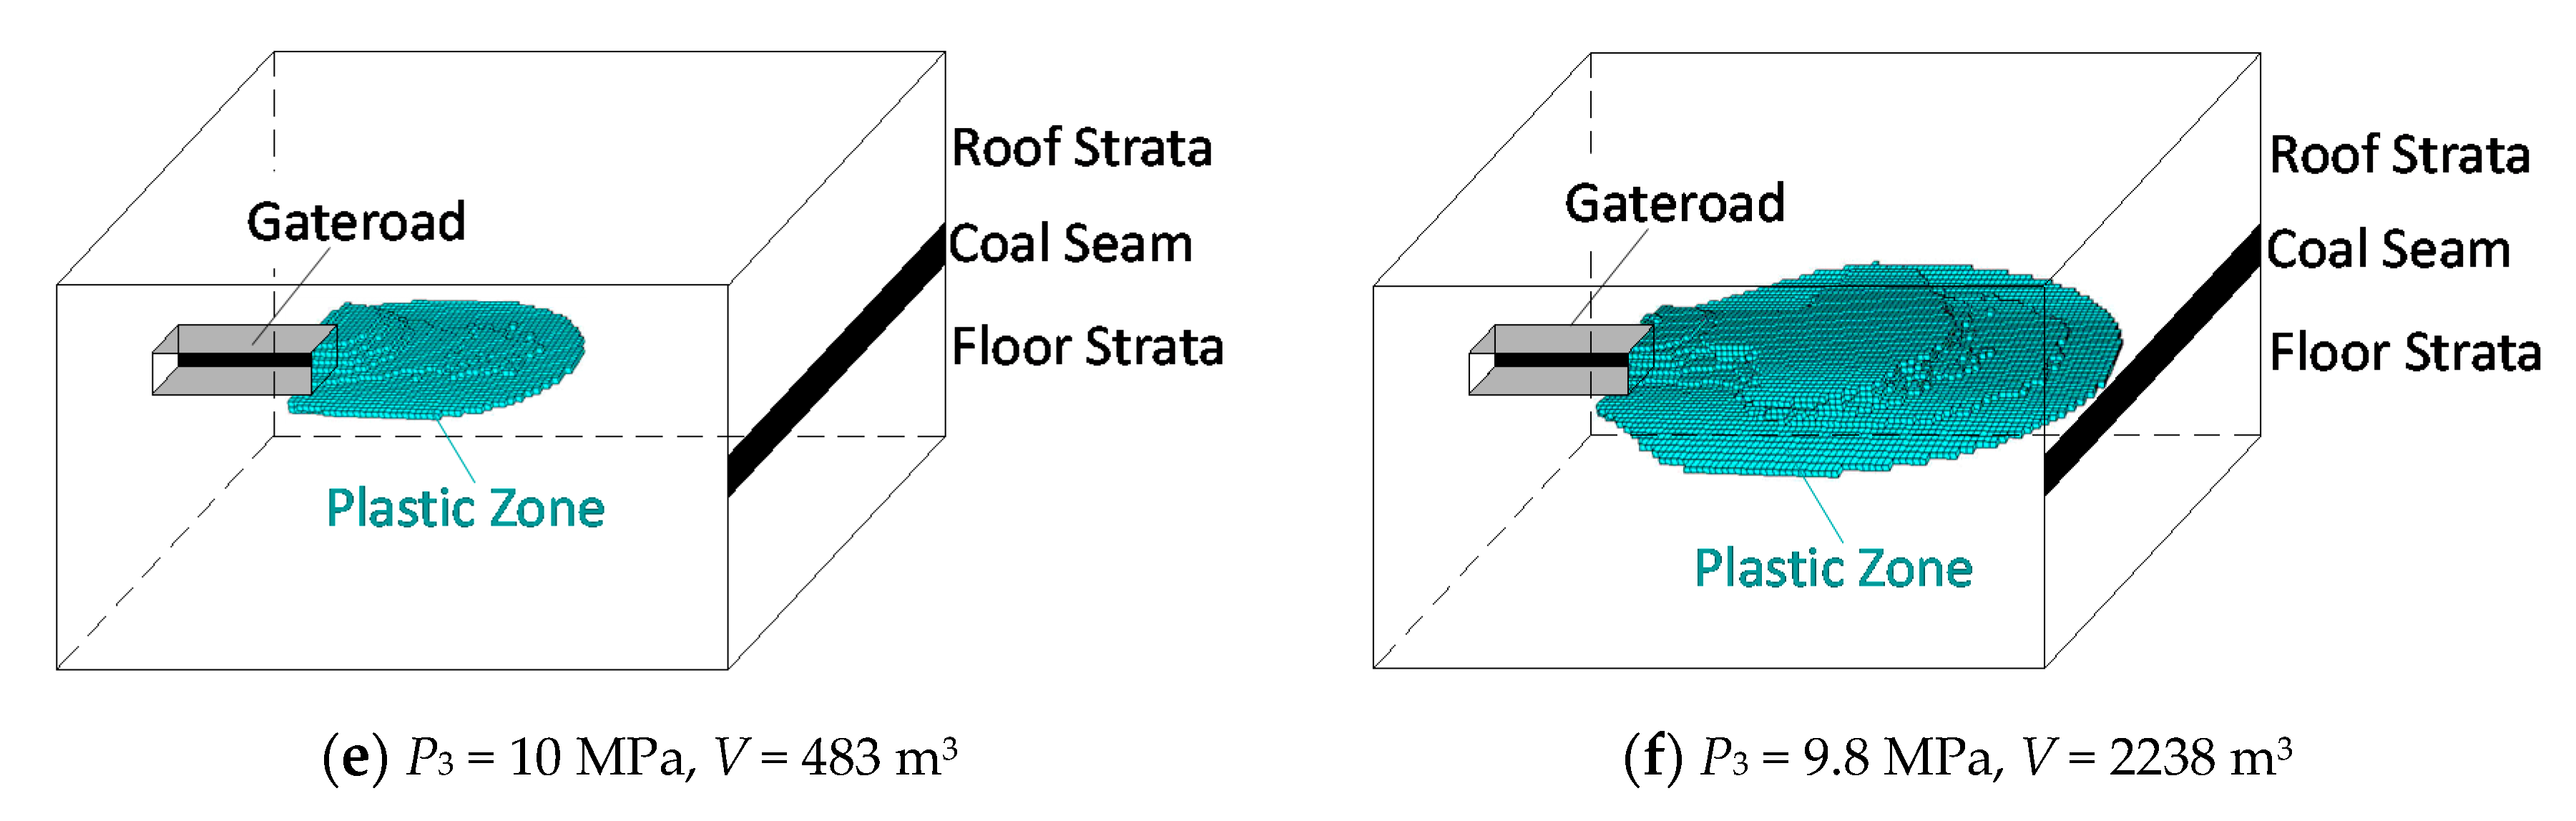
4.4. Influence of P3 (Minimum Principal Stress)

The numerical modelling results in Plan 4 are presented in Figure 8. Evolution of plastic zone with the change of minimum principal stress is studied. Please recall that In Plan 4 the physical and mechanical parameters of coal seam follow those of No. II coal in Table 1. When P3 is 15 MP, 10 MP, and 9.8 MPa, the volume of plastic zone ahead of the gateroad are 70 m3, 483 m3 and 2238 m3, respectively. It is like a flat-ball. With the decrease of minimum principal stress, the flat-ball-shaped distribution characteristic is more obvious.
The relationship between the volume of plastic zone and the minimum principal stress is shown in Figure 9. The physical and mechanical parameters of coal seam are those of No. I, No. II, and No. III coal in Table 1. Overall, the three curves with different parameters of coal demonstrate a similar evolution trend. With the decrease of P3, an approximately exponential growth of plastic zone volume is observed. Moreover, a corresponding critical value of P3 can be spotted when the strength of coal mass is different. The volume of plastic zone approaches positive infinity when the critical value [P3] is obtained. Meanwhile, the critical value of P3 is at its minimum in situation III, while the maximum value has appeared in situation I. That is, the following expression is met in the three situations: [P3]I > [P3]II > [P3]III. It is also indicated that the critical value of P3 decreases with the increase of coal mass strength.

5. Discussion

5.1. Rotation of Butterfly-Shaped Plastic Zone’s Direction ahead of the Gateroad

The numerical model shown in Figure 1 is extended to 200 m in the Y-axis direction, and gateroad A is designed along the X-axis direction as shown in Figure 10. In order to reduce the mutual mining-induced influences, gateroad A is 120 m away from the tunnel face. In this situation, the initial stress field of gateroad A is regarded to be the same as that of pre-mining situation.
According to the numerical results in Plan 1, the plastic zone around gateroad A is shown in Figure 11a when the α is 0°. Apparently, the shape of plastic zone around gateroad A is like a butterfly. Moreover, the butterfly wings are located near the bisector of the angle between the maximum and minimum principal stress. Due to the competence of roof and floor strata, the size of butterfly wing is relatively small in these areas.
As shown in Figure 11b, when α is 45°, the butterfly wings are mainly within the coal seam. In this situation, the size of butterfly wing is relatively large due to the lower strength of coal seam.
For the gateroad, the distribution characteristics of plastic zone are the same as that in Figure 3. When α is 45°, there is a butterfly-shaped plastic zone around the gateroad. Only one butterfly wing is observed, which is similar with that in Figure 11b. It is also located near the bisector of the angle between the maximum and minimum principal stress. Due to the spatial effect of the gateroad, the butterfly wing’s shape is like a flat ball. Learned from Figure 3, the butterfly-shaped plastic zone around the gateroad evolves with the rotation of principal stress’ direction. That is, the direction of butterfly-shaped plastic zone around the gateroad is also rotating.

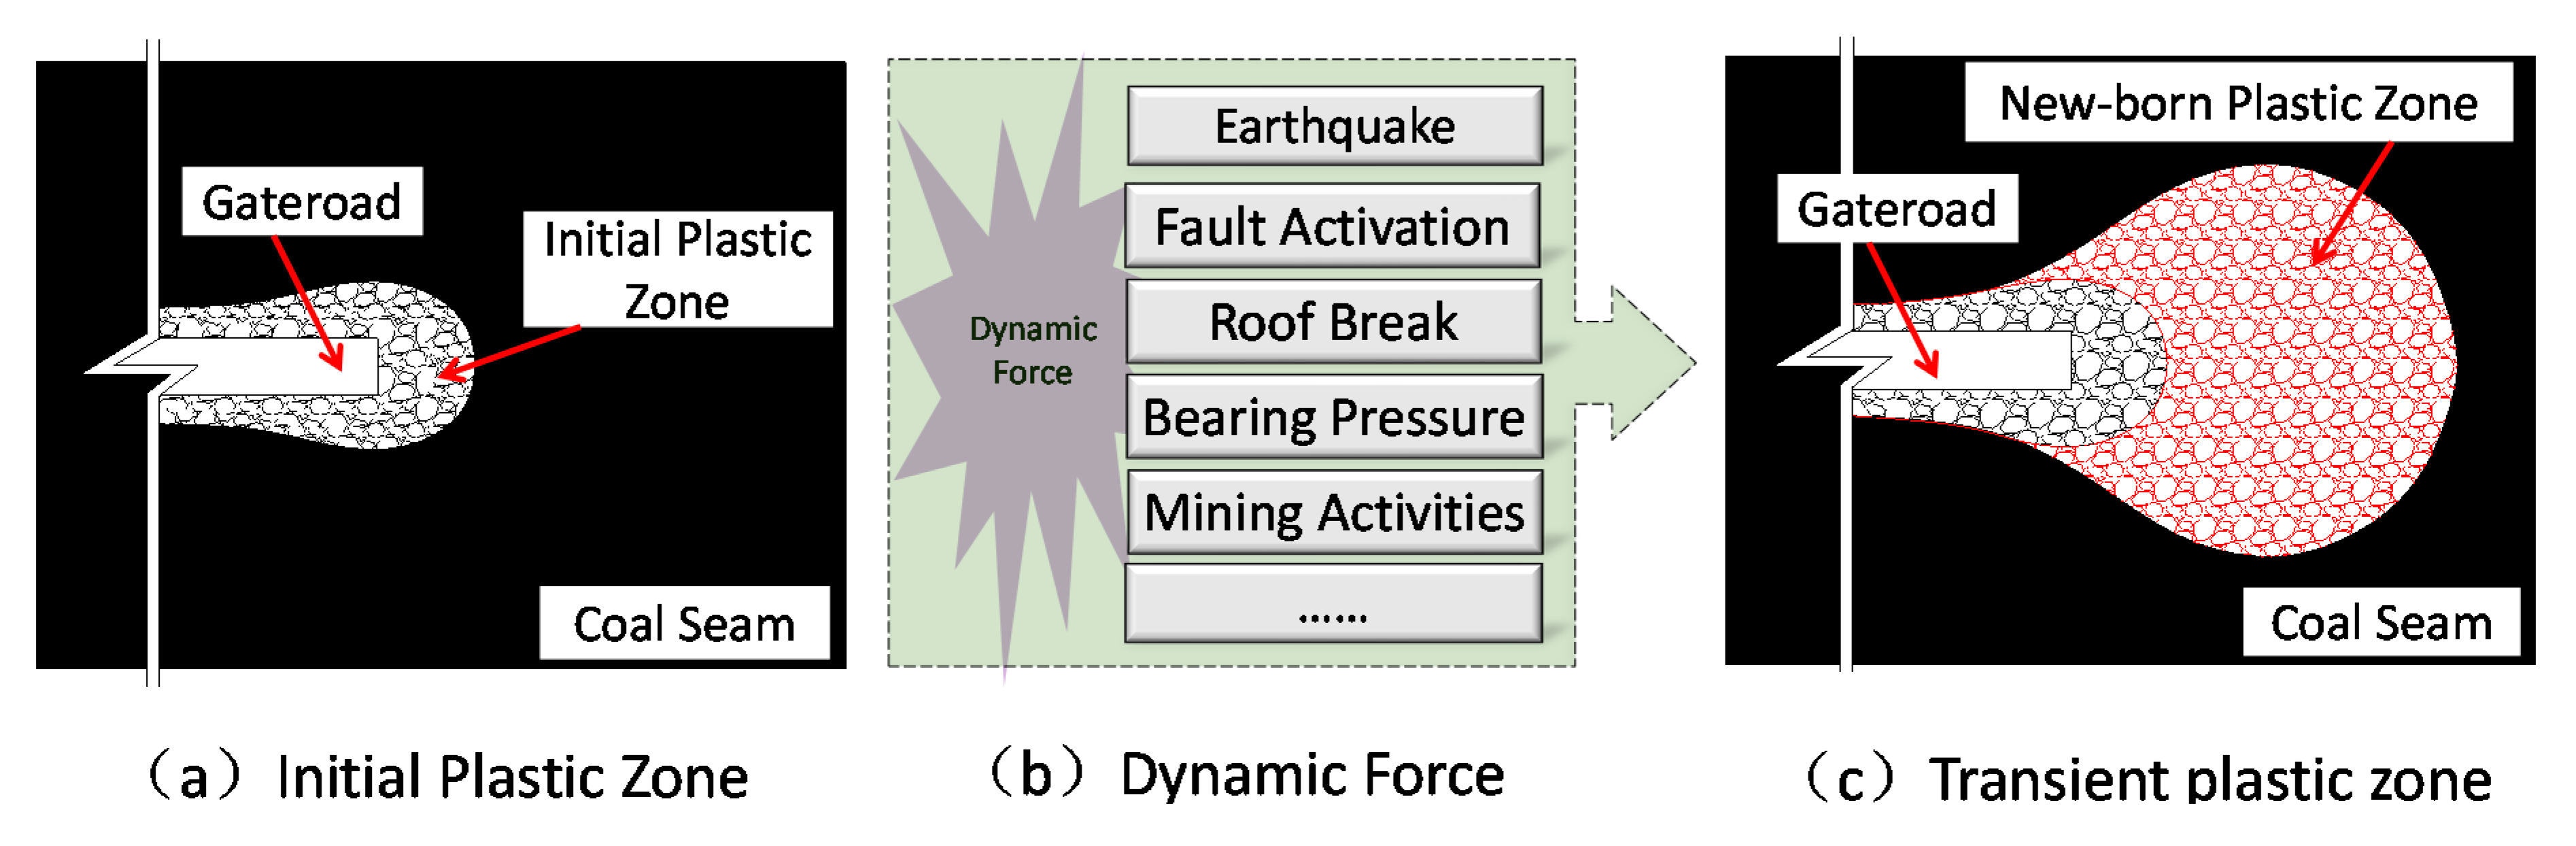
5.2. Mutagenicity of Butterfly-Shaped Plastic Zone ahead of the Gateroad

For a homogeneous circular gateroad, the expansion of butterfly-shaped plastic zone is determined by the size and ratio of principal stress (P1/P3) when the surrounding rock conditions are constant. Moreover, the mutagenicity is presented for the butterfly-shaped plastic zone. When the principal stress is close to certain critical stress value, the butterfly wing plastic zone is very sensitive to the change of the principal stress. A small change of principal stress may cause a sudden mutation of the butterfly wing’s size of the plastic zone. That is, a large extension has appeared for the butterfly-shaped plastic zone.
According to the numerical results of Figure 4, the plastic zone volume ahead of excavation face increases gradually with the increase of P1/P3 under certain surrounding rock and stress conditions, and the morphology of plastic zone becomes a flat-ball butterfly wing. In other words, the expansion of butterfly-shaped plastic zone is determined by the magnitude and direction of principal stress and the ratio of maximum principal stress to minimum principal stress (P1/P3).
Figure 5 also shows that: when P1/P3 is smaller, there is no sharp change for the plastic zone even if P1 is increased to 100 MPa, which is extremely rare in current underground coal mining. Moreover, the butterfly-shaped plastic zone of coal and rock mass ahead of the excavation face will be extremely sensitive to the change of principal stress when the value of principal stress is close to a certain critical stress. That is, the mutagenicity of butterfly-shaped plastic zone occurs ahead of the gateroad under a certain stress condition.

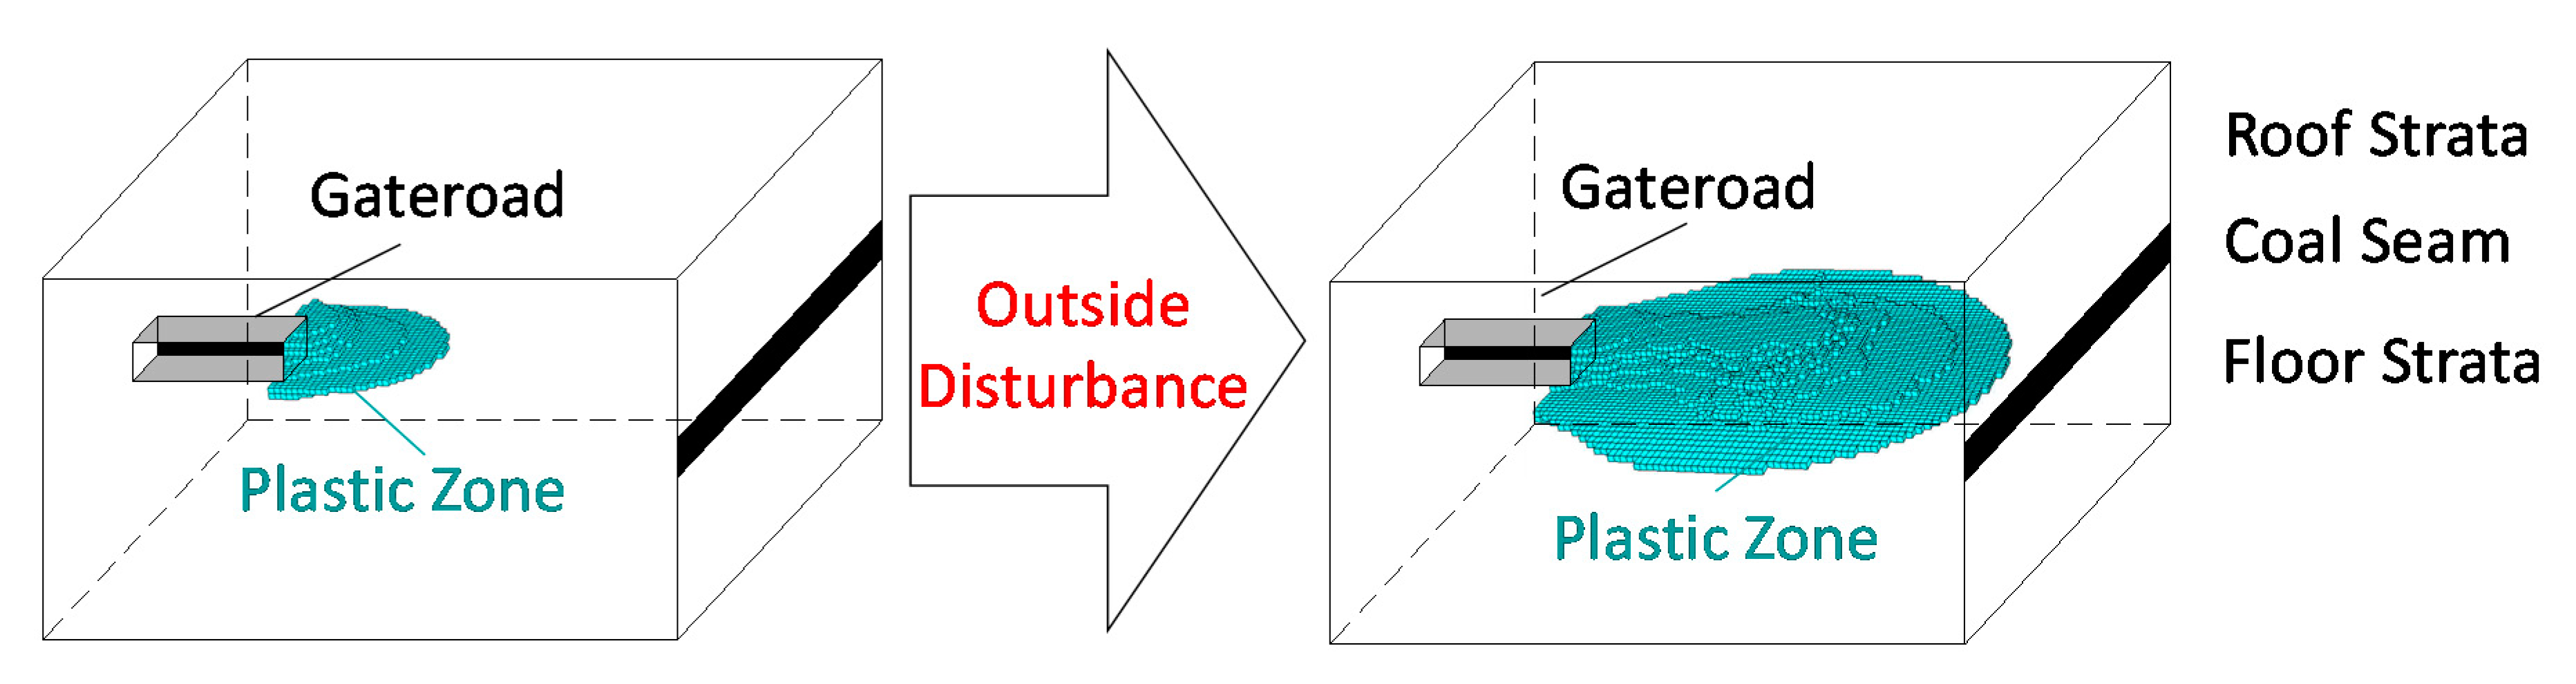
5.3. Expansion of Butterfly-Shaped Plastic Zone ahead of the Gateroad

According to the numerical results mentioned in 4.3 and 4.4, the butterfly-shaped plastic zone volume is growing gradually with the increase of maximum principal stress and the decreasing of minimum principal stress. For the specific coal mass, the corresponding critical value of [P1] and [P3] have existed for the maximum principal stress and the minimum principal stress. In this situation, the plastic zone volume approaches positive infinity. In other words, the infinite expansion of the butterfly-shaped plastic zone occurs.

5.4. Implications for Coal and Gas Outburst Induced by the Expansion Plastic Zone ahead of Gateroad

Based on the mutagenicity of butterfly-shaped plastic zone, the rapid expansion mechanical mechanism of plastic zone around the excavation gateway is studied. Combined with the field physical rockburst phenomena in the gateroad, the mechanism of butterfly-shaped rock burst in the roadway are revealed. According to the evolution law of plastic zone of coal and rock mass ahead of gateroad, the expansion analysis model of plastic zone ahead of gateroad was established, which is shown in Figure 12. The initial plastic zone means the areas appeared under the static stress in the coal and rock mass around the gateroad. The dynamic stress may be the slight disturbances causing small changes in the rock stress field. It may also be the strong disturbances leading to the large changes of stress field magnitude and direction, such as earthquakes, fault activation, roof fracture, abutment pressure, and excavation activities. When the regional static stress field of gateroad is disturbed by the outside dynamic stress, the stress field will adjust to a new balanced state. As a result, the initial plastic zone will expand and evolve into a transient plastic zone.
During the mining process, there may be large differences in the regional principal stress field and the disturbance stress source of the load of gateroad at different positions and excavation periods. In order to make an illustration, a typical example obtained from the results of Figure 6 is listed to analyze the plastic zone expansion process of coal and rock mass around, which is based on a mechanical model.
The initial state of static stress field of the gateroad is: P1 = 35 MPa, P2 = 20 MPa, P3 = 10 MPa, α = 50°. At the same time, the initial plastic zone volume is 272 m3 ahead of the gateroad. If the regional maximum principal stress increases to 1.5 MPa, the transient plastic zone will be formed, which is caused by the external dynamic disturbance. The new volume is 1439 m3, that is, the plastic zone volume increases by 1167 m3 in the evolution process (Figure 13).
The coal and rock bursts occur along with the sudden failure of coal-rock mass and the quick release of methane, which includes the gas-bearing coal and rock mass deformation and destruction of, as well as the energy conversion and release. Based on the expansion plastic zone of coal and rock mass ahead of the gateroad, the occurrence process of coal and gas outburst is described as follows: when the plastic zone ahead of gateroad expands instantaneously under the outside dynamic stress, several longitudinal fractures will appear in the plastic zone of coal and rock mass. In more serious situations, the coal and rock mass ahead of the gateroad will be fractured or fragmented. Then, the adsorbed methane will be desorbed within a very short period and the free methane will be quickly accumulated. Consequently, a methane pack will be generated quickly in the plastic zone of coal and rock mass ahead of the gateroad. It should be noted that: the released elastic energy in the failure process of coal and rock and the accumulated gas in the methane pack increases with the volume of the new-born plastic zone. When the released total energy is large enough, the coal and gas outburst will be induced.
Above all, the sudden new-born plastic zone is the key prerequisite for the occurrence of coal and gas outburst, which provides the inducing conditions for the outburst disaster. When the gas parameter is constant, the larger the volume of the new-born plastic zone, the more energy will be released in a short period of time, and the higher the outburst risk. Therefore, the critical stress state of the butterfly-shaped plastic zone’s mutagenicity ahead of the gateroad can be used as an important indicator for assessment of the coal and gas outburst risk.

6. Conclusions

The paper presents a study of influence of principal stress field including the maximum principal stress (P1), the angle between the P1 direction and the Z-axis (α), the minimum principal stress (P3), and the ratio of maximum principal stress to minimum principal stress (P1/P3) on the expansion of plastic zone ahead of the gateroad. The following conclusions are obtained:
(1).
The shape and range of plastic zone ahead of gateroad are determined by the maximum principal stress (P1) and the angle between the P1 direction and the Z-axis (α). It is also related closely to the minimum principal stress (P3) and the ratio of maximum principal stress to minimum principal stress (P1/P3). Under a certain stress state, a spheroid butterfly-shaped plastic zone will appear in the coal-rock mass ahead of the gateroad, which has a shape of more or less a flat-ball.
(2).
The plastic zone volume increases first and then decreases with the increase of α, and the direction of butterfly-shaped plastic zone ahead of gateroad is rotating with the evolution of α.
(3).
The plastic zone volume ahead of excavation face increases gradually with the increase of P1/P3. The mutagenicity of butterfly-shaped plastic zone is presented ahead of the gateroad under a certain value of P1/P3.
(4).
With the increase of P1 and decreasing of P3, the plastic zone volume is of exponential growth. The plastic zone volume approaches infinity when the critical value of maximum principal stress ([P1]) and the minimum principal stress ([P1]) is obtained.
(5).
The study of the effect of principal stress field on the expansion of plastic zone ahead of the gateroad is helpful for revealing the mechanisms of coal and gas outbursts. The critical stress state of butterfly-shaped plastic zone’s mutagenicity ahead of the gateroad can be used as an important indicator for assessing the risk of coal and gas outburst.
It should be noted that the numerical modelling is one of the alternative methods to investigate the effect of principal stress field on the expansion of plastic zone ahead of the gateroad. FLAC3D is mainly used to analyze the stress distribution and plastic zone evolution of continuous medium. The discontinuous numerical modelling, the similar material simulation and the in-situ monitoring should be further investigated to supplement and compensate the above conclusions in the future research.

Author Contributions

H.L., conceived and designed the framework; L.G., carried out the numerical simulation and wrote the manuscript; X.Z., assisted to conduct theoretical analysis and provided some help in numerical simulation; P.W., performed significant review and editing of the manuscript. All authors have read and agreed to the published version of the manuscript.

Funding

This research was funded by the National Natural Science Foundation of China grant number [51804117, 51774288 and 51674243].

Conflicts of Interest

The authors declare no conflict of interest.

References

  1. Zhang, G.C.; He, F.L.; Jia, H.G.; Lai, Y.H. Analysis of gateroad atability in relation to yield pillar size: A case study. Rock Mech. Rock Eng. 2017, 50, 1263–1278. [Google Scholar] [CrossRef]
  2. Feng, G.R.; Wang, P.F.; Chugh, Y.P. Stability of gate roads next to an irregular yield pillar: A case study. Rock Mech. Rock Eng. 2019, 52, 2741–2760. [Google Scholar] [CrossRef]
  3. Zhang, G.C.; He, F.L.; Lai, Y.H.; Jia, H.G. Ground stability of underground gateroad with 1 km burial depth: A case study from Xingdong coal mine, China. J. Cent. South Univ. 2018, 25, 1386–1398. [Google Scholar] [CrossRef]
  4. Feng, G.R.; Wang, P.F.; Chugh, Y.P.; Zhao, J.L.; Wang, Z.Q.; Zhang, Z.P. A Coal Burst Mitigation Strategy for Tailgate during Deep Mining of Inclined Longwall Top Coal Caving Panels at Huafeng Coal Mine. Shock Vib. 2018, 2018. [Google Scholar] [CrossRef]
  5. Shen, B.; King, A.; Guo, H. Displacement, stress and seismicity in roadway roofs during mining-induced failure. Int. J. Rock Mech. Min. Sci. 2008, 45, 672–688. [Google Scholar] [CrossRef]
  6. Zhang, G.C.; Liang, S.J.; Tan, Y.L.; Xie, F.X.; Chen, S.J.; Jia, H.G. Numerical modelling for longwall pillar design: A case study from a typical longwall panel in China. J. Geophys. Eng. 2018, 15, 121–134. [Google Scholar] [CrossRef]
  7. Lawrence, W.J. A method for the design of longwall gateroad roof support. Int. J. Rock Mech. Min. 2009, 46, 789–795. [Google Scholar] [CrossRef]
  8. Trueman, R. The application of a numerical model to longwall coal mine roadway design. Min. Sci. Technol. 1990, 10, 157–165. [Google Scholar] [CrossRef]
  9. Kastner, H. Statik des Tunel und Stollenbauess; Springer: Berlin/Heidelberg, Germany, 1962. [Google Scholar]
  10. Abdel-Meguid, M.; Rowe, R.K.; Lo, K.Y. Three-dimensional analysis of unlined tunnels in rock subjected to high horizontal stress. Can. Geotech. J. 2003, 40, 1208–1224. [Google Scholar] [CrossRef] [Green Version]
  11. Leitman, M.J.; Villaggio, P. Plastic zone around circular holes. J. Eng. Mech. 2009, 135, 1467–1471. [Google Scholar] [CrossRef]
  12. Chen, L.W.; Peng, J.B.; Fan, W.; Sun, P. Analysis based on unified strength theory of non-uniform stress field circular roadway for plastic zone. J. China Coal Soc. 2007, 32, 20–23. [Google Scholar]
  13. Zhao, Z.Q. Study on Mechanism and Control Method of Deformation and Failure of Surrounding Rock in Large Deformation Mining Roadway; China University of Mining and Technology: Beijing, China, 2014. [Google Scholar]
  14. Meng, Q.B.; Han, L.J.; Xiao, Y.; Li, H.; Wen, S.Y.; Zhang, J. Numerical simulation study of the failure evolution process and failure mode of surrounding rock in deep soft rock roadways. Int. J. Min. Sci. Technol. 2016, 26, 209–221. [Google Scholar] [CrossRef]
  15. Guo, X.F.; Ma, N.J.; Zhao, X.D.; Zhao, Z.Q.; Li, Y.E. The general shapes and criterion for surrounding rock mass plastic zone of round roadway. J. China Coal Soc. 2016, 41, 1871–1877. [Google Scholar]
  16. Lu, Y.; Tu, S.H. Rules of distribution in a plastic zone of rocks surrounding a roadway affected by tectonic stress. Min. Sci. Tech. 2010, 20, 47–52. [Google Scholar] [CrossRef]
  17. Li, C.; Xu, J.H.; Pan, J.Z.; Ma, C. Plastic zone distribution laws and its types of surrounding rock in large-span roadway. Int. J. Min. Sci. Technol. 2012, 22, 23–28. [Google Scholar] [CrossRef]
  18. Shen, B. Coal mine roadway stability in soft rock: A case study. Rock Mech. Rock Eng. 2014, 47, 2225–2238. [Google Scholar] [CrossRef]
  19. Jiang, L.S.; Mitri, H.S.; Ma, N.J.; Zhao, X.D. Effect of foundation rigidity on stratified roadway roof stability in underground coal mines. Arab. J. Geosci. 2016, 9. [Google Scholar] [CrossRef]
  20. Jiang, L.S.; Sainoki, A.; Mitri, H.S.; Ma, N.J.; Liu, H.T.; Hao, Z. Influence of fracture-induced weakening on coal mine gateroad stability. Int. J. Rock Mech. Min. Sci. 2016, 88, 307–317. [Google Scholar] [CrossRef]
  21. Li, H.; Lin, B.Q.; Hong, Y.D.; Gao, Y.B.; Yang, W.; Liu, T.; Wang, R.; Huang, Z.B. Effects of in-situ stress on the stability of a roadway excavated through a coal seam. Int. J. Rock Mech. Min. Sci. 2017, 27, 917–927. [Google Scholar] [CrossRef]
  22. Jia, H.S.; Pan, K.; Liu, S.W.; Peng, B.; Fan, K. Evaluation of the mechanical instability of mining roadway overburden: Research and applications. Energies 2019, 12, 4265. [Google Scholar] [CrossRef] [Green Version]
  23. Yuan, Y.; Wang, W.J.; Li, S.Q.; Zhu, Y.J. Failure mechanism for surrounding rock of deep circular roadway in coal mine based on mining-induced plastic zone. Adv. Civ. Eng. 2018, 1–14. [Google Scholar] [CrossRef]
  24. Hou, C.; Zhang, Y.H.; Yan, Y. Effects of coal seam dip angle on the outburst in coal roadway excavation. Int. J. Min. Sci. Technol. 2019, 29, 757–764. [Google Scholar] [CrossRef]
  25. Kong, P.; Jiang, L.S.; Shu, J.M.; Sainoki, A. Effect of fracture heterogeneity on rock mass stability in a highly heterogeneous underground roadway. Rock Mech. Rock Eng. 2019, 52, 4547–4564. [Google Scholar] [CrossRef]
  26. Guo, X.F.; Zhao, Z.Q.; Gao, X.; Wu, X.Y.; Ma, N.J. Analytical solutions for characteristic radii of circular roadway surrounding rock plastic zone and their application. Int. J. Min. Sci. Technol. 2019, 29, 263–272. [Google Scholar] [CrossRef]
  27. Guo, X.F.; Zhao, Z.Q.; Gao, X.; Ma, Z.K. Directional sharp-point failure mechanism of rocks surrounding underground circular cavities subjected to large-scale failure. Math. Probl. Eng. 2019, 6, 1–19. [Google Scholar] [CrossRef]
  28. Guo, X.F.; Zhao, Z.Q.; Gao, X.; Ma, Z.K.; Ma, N.J. The criteria of underground rock structure failure and its implication on rockburst in roadway: A numerical method. Shock Vib. 2019, 1–12. [Google Scholar] [CrossRef]
  29. Zhao, Z.Q.; Jia, H.S.; Peng, B.; Dong, Y.Y. Tunnel surrounding rock deformation characteristics and control in deep coal mining. Geomaterials 2013, 3, 24–27. [Google Scholar] [CrossRef] [Green Version]
  30. Liu, H.T.; Qiao, B.Y.; Ma, N.J. Stability analysis and design of roadways in adjacent seams: A case study from Tashan coal mine in China. Arab. J. Geosci. 2020, 13, 308. [Google Scholar] [CrossRef]
  31. Kang, H. Study on characteristics of underground in-situ stress distribution in Shanxi coal mining fields. Chin. J. Geophys. 2009, 52, 1782–1792. [Google Scholar]
  32. Feng, G.R.; Wang, P.F. Simulation of recovery of upper remnant coal pillar while mining the ultra-close lower panel using longwall top coal caving. Int. J. Min. Sci. Technol. 2020, 30, 55–61. [Google Scholar] [CrossRef]
Figure 1. Numerical model.
Energies 13 04356 g001
Figure 2. Schematic diagram of principal stress field in the numerical simulation model.
Energies 13 04356 g002
Figure 3. The plastic zone distribution ahead of the gateroad with different α (Angle between the P1 Direction and the Z-Axis).
Energies 13 04356 g003aEnergies 13 04356 g003b
Figure 4. The volume of plastic zone ahead of gateroad along with the change of P1 (the maximum principal stress).
Energies 13 04356 g004
Figure 5. The plastic zone distribution ahead of the gateroad with different P1/P3.
Energies 13 04356 g005
Figure 6. The plastic zone distribution ahead of the gateroad with different P1.
Energies 13 04356 g006
Figure 7. The relationship between the plastic zone volume and the P1.
Energies 13 04356 g007
Figure 8. The plastic zone distribution ahead of the gateroad with different P3 (the minimum principal stress).
Energies 13 04356 g008aEnergies 13 04356 g008b
Figure 9. The relationship between the plastic zone volume and the P3.
Energies 13 04356 g009
Figure 10. Schematic diagram of the vertical section of the numerical calculation model.
Energies 13 04356 g010
Figure 11. Distribution of plastic zone around Roadway A.
Energies 13 04356 g011
Figure 12. Plastic zone expansion process of coal and rock mass around the gateroad.
Energies 13 04356 g012
Figure 13. Evolution process of plastic zone expansion under the influence of outside disturbance.
Energies 13 04356 g013
Table 1. Physical and mechanical parameters of roof, floor, and coal around the gateroad.
LithologyThickness/mFriction Angle/(°)Cohesion/MPaDensity/(kg/m3)Shear Modulus/GPaBulk Modulus/GPa
Roof2338626008.08.2
4251.010504.75.2
Coal430211004.95.7
435313005.26.1
Floor23406.527008.08.5

