Abstract
Distribution planning refers to the act of estimating the risks of distribution systems that may arise in the future and establishing investment plans to cope with them. Forecasted loads are one of the most typical variables used to analyze the risk of the distribution system, thus the efficiency of distribution planning may vary depending on its accuracy. For these reasons, a lot of studies are also being conducted to perform load prediction by incorporating the latest methods, such as machine learning (ML). However, the unchangeable fact is that no matter what prediction method is used, the accuracy and reliability of the predicted load can vary depending on the reliability of the data used. In particular, the detection of temporary load increases, due to load transfer that can occur frequently in the distribution system are essential for securing high-quality data. Therefore, in this study, a LSTM (Long Short-Term Memory) based load transfer detection model was proposed, and the appropriateness and reliability of the proposed method were analyzed by comparing actual planned load transfer data with the estimated load transfer results from the proposed model. It was also shown that the proposed model can improve the efficiency and reliability of the distribution planning by reasonably removing load variations, due to load transfer.
1. Introduction
Distribution planning, which establishes investment plans for the distribution system, is one of the most important tasks for power systems. Although the method for establishing distribution planning may have differences depending on utilities, the predicted load of distribution lines is one of the inputs that does not change. Various methods are incorporated to predict these predicted load, and from a traditional and conservative perspective, linear regression are often applied to predict future loads of distribution lines based on trends. However, the method of conservatively predicting future loads, according to the operational policies that pursue stability or reliability in the past needs to be modified in the face of changes in the value of the operation of the power system, such as pursuing efficiency. Various methods of load prediction are being studied as accurate load forecasting is required to pursue the efficiency. Studies were also conducted on a regression-based method of load prediction [1,2,3,4,5], and methods of load prediction through time series patterning of load data [6,7,8]. In addition, a number of studies have been conducted on how to predict loads, based on machine learning techniques that have recently drawn attention [9,10,11,12,13,14,15,16,17,18,19]. However, even if methods of prediction may change, the fact that high-quality data is needed does not change, especially for data-based methods such as machine learning and big data analysis. That is to say, it is very important to obtain high-quality data as the quality of the forecasting results is greatly affected by the quality of the data. In the case of electric data of distribution systems, the operating environment of the electric facilities fluctuates in real time, so it has the characteristics of continuous change, and abnormal data, such as noise or missing data are frequently generated during the process of transmitting and receiving data. In the case of these abnormal and missing data, it is possible to respond using the preprocessing method generally used. However it is not possible to respond the rapid increase in load, generated by load transfer. Moreover, these rapid increases in load can have a significant impact on estimation of the peak load of distribution lines, which can adversely affect the efficiency of the investment plan. This study, therefore, proposed a method of detecting load transfer, based on machine learning, that had a significant impact on distribution planning, and the appropriateness was verified by comparing them with the statistic based method that widely used for detecting abnormal data. Further analysis was also made on how the peak load of the distribution line could vary depending on the load transfer detection method, demonstrating the effectiveness of the proposed method.
2. Related Works
In [1], the enhanced multiple-regression analysis algorithm, applied to DISPLAN (Distribution Information System PLAN), used in KEPCO, was introduced. In order to improve the accuracy of the load forecasting model, the amount of demand power in the past with the local economy and local households were considered as input variables. For general load forecasting methods, predictions are carried out along the overall trend, resulting in greater error for special days, such as holidays. To overcome these limitations, the authors in [2,3] proposed a method to predict the load of special days, based on the load fluctuation rate before, and after, the point of occurrence of similar events in the past, or based on the fuzzy linear least squares regression model. In [4,5], double seasonal (daily, weekly) or triple seasonal cycles (daily, weekly, and yearly) was applied to improve accuracy in exponential smoothing methods such as ARMA and Holt Winter.
In [6], in order to improve an accuracy of electric load prediction, data were clustered with similar characteristics based on SOM (Self Organization Map) and K-Means algorithms. After that, exponential smoothing techniques and ARIMA models were further applied to predict future loads. Reference [7] presented a method for evaluating the fuzzy regression model based on Tanaka’s approach, which has the fuzzy number for both input and output. In addition, the effects of outliers in fuzzy linear regression for forecasting electric load were analyzed. From the fact that the error of load forecasting on holidays is much higher than on weekdays, [8] conducted a study using fuzzy linear regression model to reduce the error.
Reference [9] used “Neuralnet”, one of the well-known machine learning libraries, to predict future loads by setting demand power, average temperature, perceived temperature, and discomfort index as input data. It was confirmed that predicting future loads using weekly demand power and average temperature data showed the best result. In the case of winter power demand, the correlation with the temperature sensitivity is lower than in summer. Therefore, [10] set the training data with meteorological elements, time elements, regional weights, maximum power. and the winter load prediction was performed based on the DNN model. It was confirmed that the average error rate on weekdays, excluding weekends and holidays, decreased. Reference [11] converted time series data of sequence form into continuous data in two-dimensional space to solve the problem of not properly reflecting the periodicity of time series demand power data in the artificial neural network-based demand power prediction model. In addition, external factors, such as temperature and humidity were considered and applied through correlation analysis. When data missing occurs in predicting demand power based on artificial intelligence, it can greatly affect the results of prediction. Reference [12] proposed the missing data supplementing technique, based on random forest, and improved the accuracy of the prediction result by using the corrected data with MLP (multi-layered perceptron) model. In order to predict the power demand of buildings, Reference [13] applied the supervised and non-supervised deep-learning method, rather than the method using existing physical characteristics. As a result, it was confirmed that the non-supervised deep learning method showed better results. In order to predict the electric load in smart grids, reference [14] organized and carried out the prediction by forming DNN in two ways: The pre-training Restricted Boltzmann Machine (RBM) and Refined Linear Unit (ReLU). As a result, it was confirmed that the proposed model showed more accurate predictions compared to the double-seasonal Holt Winter model and ARIMA model. Selecting models and parameters is very important for accurate load forecasting. Reference [15] used the wrapper and embedded feature selection method to choose best features, and the genetic algorithm to select the optimal time lag and number of layers for LSTM. As a result, it was confirmed that LSTM model, using only optimally selected time lagged features, captured all the characteristics of complex time series and reduced the prediction errors. The prediction of electric loads is difficult due to the nonlinearity. To address this, reference [16] reduced the stochastic variation by applying a Variable Mode Decomposition (VMD) that decomposes electric loads into a different set of frequency components, and performed a load prediction using an Extreme Learning Machine (ELM) optimized by the Differential Evolution (DE) algorithm. Reference [17] proposed a load-forecasting model, based on enhanced-LSTM, which considers the periodicity characteristic of the electric load by using multiple sequences of inputs time lags. An autoregressive model was developed based on Auto Correlation Function (ACF) to find the most relevant time lags for the multi-sequence LSTM. The obtained results showed that GRU- and LSTM-based deep learning model with multi-sequence time lags achieve higher performance than others. Reference [18] proposed a method for carrying out load forecasting to solve the over-fitting problem by adopting pooling-based deep RNN (Recurrent Neural Network) that holds various load profiles in the input pool. Reference [19] presented and verified the hybrid method of probabilistic electricity load forecasting, including generalized extreme machine learning for training wavelet neural network, wavelet preprocessing and bootstrapping. The proposed method considered the uncertainty of predictive model and data noise, and the output of the model was a load probabilistic interval.
As can be easily seen above, a lot of relevant research to load forecasting are focused on improving predictive accuracy by improving the predictive model itself. Although there are differences in methods, such as regression, time series pattern, and machine learning-based method, no matter what predictive model is applied, reliability and accuracy of the data is as important as a predictive model. From this point of view, this paper proposes a LSTM-based method of detecting load transfer that is difficult to detect and correct by general abnormal data detection model.
3. Detection of the Load Transfer
For load variations due to noise and load transfer, it can be considered similar in terms of varying load. However, in the case of load variation caused by noise, the duration is very short and can be easily considered as noise, and thus, an existing pre-processing method can be used to filter them. On the other hand, in the case of the one caused by load transfer, the duration can last from a few minute to several days, making it very difficult to remove them with the existing pre-processing methods. However, as the accuracy of load prediction is required to improve the efficiency of the distribution planning, the inaccuracy in the peak load of the distribution line, due to load transfer, should be dealt with. If such temporary and abnormal data are used unprocessed, the load prediction methods can cause significant errors in the forecast results. Moreover, if distribution planning is established based on such forecasts, it could cause unnecessary over-investment or the problem of not investing, where required. Based on this circumstance, various methods are already applied to detect and handle load transfer, however, most of them rely on human resources, such as handling them directly by the person in charge. In fact, in the case of Korea Electric Power Corp (KEPCO), it is required to check the operation of the switchgear at the time when the peak load on the distribution line occurs to verify that the corresponding peak load is not caused by load transfer. However, given that there are dozens or more distribution lines to be handled by a person in charge, this may not only result in excessive workload, but also human error in the work. For these reasons, we proposed the algorithms that can detect load transfer automatically, and for this purpose, statistical-based method and machine-learning-based method were applied, and the feasibility of each method was analyzed. The details of each method are as follows.
3.1. Statistical Based Load Transfer Detection Model
Detecting abnormal data, based on statistics, is one of the methods already widely used. In statistical-based techniques, it is common to detect abnormal data by checking whether the value exceeding threshold, which was made by analyzing the data. Since the load variation due to load transfer is sudden unlike the usual pattern, this study defined and detected a value in which the load variation per hour exceeds 80% of the standard deviation of it as load variation due to load transfer. The following is the simple flow chart of algorithm related to this and the examples of detecting load transfer. The data used is distribution line electric load data from January to December 2019 on the Cheongyang Distribution Line located in Gangwon Province in South Korea:
Here, : Load variation, : Electric load of distribution line at time t
Here, : Threshold for detection of load transfer, : Mean of , : Standard deviation, : Weight for detection of load transfer.
As can be easily seen in the Figure 1, numerous load transfers were detected in a particular section as the statistical-based algorithm did not reflect the duration of each load pattern. While, load transfer and noise are similar, in terms of causing load variation, they differ in terms of duration. In general, noise has a very short duration, load variations due to load transfer, but, can last as short as several minutes to as long as several months. These characteristics should be reflected to ensure a clear distinction between noise and load transfer. Nevertheless, as previously stated, there is no clear criterion for duration in the case of load transfer, so it is very difficult to identify load variations that are caused by such load transfer only on a statistical basis. Obviously, it may propose compromises to detect load transfer by setting additional constraints, such as waveform analysis. However, users who lack an understanding of the data find it difficult to establish additional criteria. Even users who have a high understanding of the data have limitations; the criteria set by their experience and judgment can vary depending on the users.
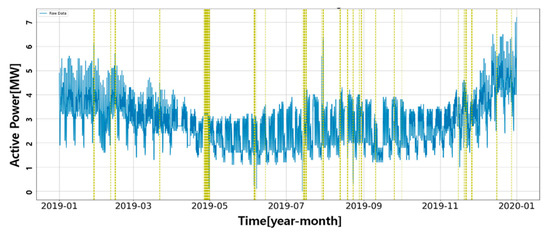
Figure 1.
Statistical based load transfer detection result (Kimhwa D/L).
3.2. Machine Learning based Load Transfer Detection Model
As mentioned above, statistical-based load transfer detection method has limitations in actively detecting load transfer with varying duration. For this reason, this study proposed a machine learning-based load transfer detection method which has a simple principle. First, the load data conducted the simple pre-processing and is used to predict the future load. Next, the predicted load is set as the reference value, which is considered as normal state. Finally, the actual measured data is compared with the predicted data, and detect it as a load transfer if the difference between them exceeds the threshold.
3.2.1. Pre-Processing for Load Transfer Detection Model
As previously mentioned, machine learning-based load transfer detection is a method used for detection by considering the predicted load as a normal state reference, and comparing it with actual measured load. Therefore, it is important to accurately predict the reference load, and thus, it is important to secure high quality learning data through adequate pre-processing. In this study, the pre-processing of commonly applied missing, zero, and repetitive data was performed. Missing data refers to the data which has not been collected abnormally. Zero data means that the load on the distribution line literally represents zero, and as all actual load cannot be eliminated, it can be considered abnormal data. The repetitive data, which was received same load value for over several hours, can also be determined as abnormal data when considering the nature of load fluctuating on the distribution line. In general, detected abnormal data can be excluded from learning data or be replaced through correction. Although data correction can be applied with interpolation methods using the arithmetic mean, the most frequent value, the maximum, and the minimum, it is difficult to replace data based on these interpolation methods if abnormal data persists for a long time. Even if alternative data is created through other methods, it can affect the reliability of the data, which can eventually reduce the accuracy of load transfer detection [20,21,22,23]. In this study, excluding abnormal data from learning data was used to detect abnormal data.
3.2.2. Design of Machine Learning based Load Transfer Detection Model
Normal state presumed reference data was created by machine learning model using the pre-processed data. Various predictive models may be applied to predicting time series data, based on machine learning, but they should be models that can properly reflect the characteristics of time series data. Time series load data is characterized by repeated increases and decreases depending on electric usage. The following Figure 2 illustrates the load of Cheongsong D/L for a period of four years from 2015 to 2019. As shown in the figure, the load varies with the electric usage over time, and the overall trend varies from quarter to year, as well. In addition, it should be able to cope with changes in overall load variations, such as one in 2018 described in the figure. If a machine learning model, such as general RNN is applied, it is highly likely that the forecast will be reduced, as shown in the figure with the premise that the load reduction will continue in the future, as shown in 2018. This is because the model is not allowed to set specific weight of the historical data separately, and is designed to reflect a higher importance of the recent data.
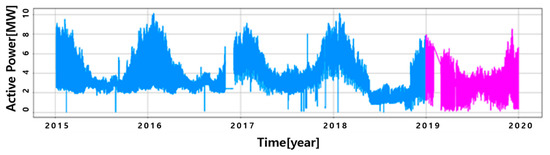
Figure 2.
Four years load of Cheongsong D/L (blue: measured, red: predicted).
To address these problems, the Long Short-Term Memory (LSTM) model was applied to reflect trends in the overall data, not temporary changes. LSTM add cell-state to overcome the vanishing gradient problem in the traditional RNN method, and thus, the trend of overall data, not recent data, is likely to be reflected throughout the entire period. Also, even if the data at a particular point in time changes, the overall trend of historical data can be reflected to prevent a sharp increase or decrease in forecasting load. The basic structure and associated formulas for LSTM model are shown below:
Here: Forget gate activation vector: Input gate activation vector, : Cell state vector, : Output gate activation vector, : Sigmoid function, : Input vector, : Hidden state vector, : Bias vector
LSTM is a model that can mitigate the long-term dependencies problem of the RNN model. RNN model has a single layer, so it is difficult to remember certain feature for a long period of time and to learn by entering new one at the same time. On the other hand, as general LSTM model operates with four layers, it can efficiently remember and learn certain feature of input. The simple operating principles of LSTM are as follows; First, Cell state function brings past cell state into the future. Then, forget gate activation function decides how much feature of the past will be preserved. Next, input gate activation function determines whether new feature is updated. The cell state is updated in the process above to follow. Finally, the output gate activation function determines which part of the updated cell state is exported to the output. This series of processes is shown in Figure 3, and in Equations (3) to (7).
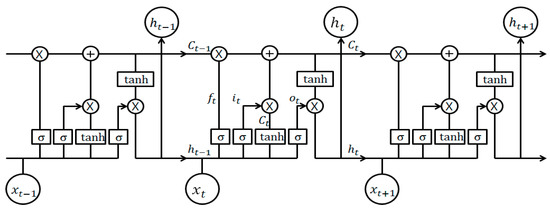
Figure 3.
Basic structure of LSTM.
The built LSTM model can be used to create normal state presumed reference load and the generated load of it is compared with actual load to detect load transfer. Also, in order to secure normality, the difference between the actual measured load and the predicted load was converted to the log probability density function below. After heuristic analysis of the data from about 11,600 distribution line in South Korea, it is designed to be judged as load transfer when the difference of them exceeds 43% of the maximum difference. The log probability density function used is shown below:
Here, : Mean of load, : Covariance matrix, : Dimension of load data, : Load data.
The results of the previous stated series of machine learning-based load transfer detection sequences, as summarized in Figure 4, are shown in Figure 5. The data used is from Cheongyang distribution line located in Gangwon province in 2019 in the South Korea.
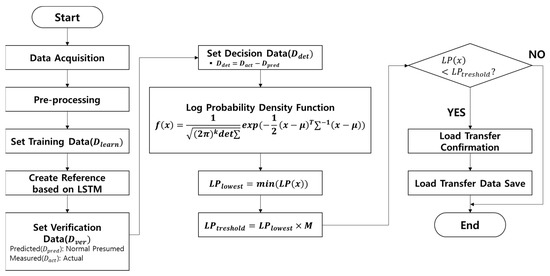
Figure 4.
Machine learning based load transfer detection flow.
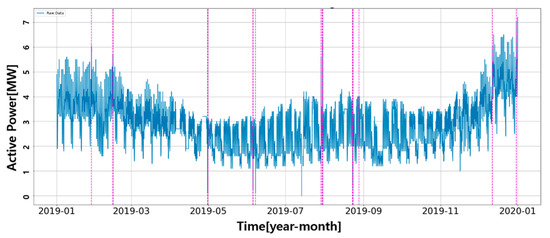
Figure 5.
Machine learning based load transfer detection result (Kimhwa D/L).
Here, : Training data, : Verification data, : Measured data, : predict data, : Load transfer decision data, : Minimum of log probability density function, : Threshold for detection of load transfer, : Weight for detection of load transfer
As can be easily seen in the Figure 5, the machine learning-based load transfer detection results show that the frequency of load transfer detection in particular sections has decreased compared to the statistical based method, and that load transfer has been detected more reasonably.
3.3. Comparative Verification
The methods of detecting load transfer based on statistics and the machine learning were described above. In addition, the simulation results confirmed that the machine learning based detection method could be more efficient than the other. The next step was to compare the actual planned load transfer records with the results from proposed method, in order to verify whether the machine learning-based load transfer detection results were reliable. Also, further analysis was conducted on how the peak load of the distribution line can be different through load transfer detections.
3.3.1. Verification Condition and Procedure
The data used to verify the adequacy of the proposed LSTM-based load transfer detection model are the distribution line load data and planned load transfer data. The load data of the distribution line is received from the CB (Circuit Breaker) at the start point of distribution line in substation, which is separately managed by the KEPCO (Korea Electric Power Corporation)’s SOMAS (Substation Operation Management Automation System). Planned load transfer data, which must be submitted in advance, when needed for the breakdown and reinforcement of distribution lines, is received from branch offices of KEPCO.
To verify the proposed model, the model creates presumed load transfer result using load data of distribution line, firstly. Then the detected results are compared with the actual planned transfer data to determine detection accuracy. Finally, the maximum load distribution line is recalculated by considering load transfer in the view of distribution planning.
3.3.2. The Result of Load Transfer Detection using Proposed Method
To analyze how accurately the machine learning-based load transfer detection method actually detects, the actual planned load transfer records and the detection results from proposed method were compared and analyzed. The Table 1 summarizes the comparative results, and detailed results of proposed method are shown in Figure 6.

Table 1.
Comparative result of load transfer (Kimhwa D/L).
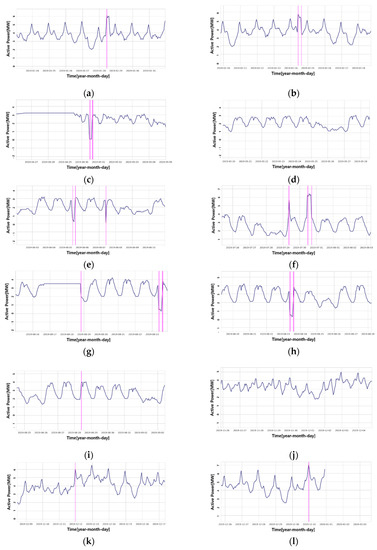
Figure 6.
The results of detection for load transfer using proposed method: (a) 2019.01.28 (b) 2019.02.14. (c) 2019.04.30. (d) 2019.05.24. (e) 2019.06.06–07. (f) 2019.07.29–30. (g) 2019.08.18. (h) 2019.08.23. (i) 2019.08.28. (j) 2019.11.29. (k) 2019.12.11. (l) 2019.12.30.
The results of the machine learning based proposed method can be confirmed to have an accuracy of about 78% by detecting seven out of nine actual planned load transfer record of Kimhwa D/L in 2019. Moreover, the four that were not included in the record were also detected, which are in Figure 6a,b,e,h. When analyzed through waveforms, event described in Figure 6a,b,e are considered as load transfer for distribution system management purpose. In the case of the event in Figure 6h, a pattern different from the previous load pattern was derived, and was detected as a load transfer. It was not clearly a load transfer, but it is reasonable to consider it as an error.
The proposed machine learning-based method can be found, not only the planned load transfer, but also the load transfer that occurs for distribution system management purpose. However, in the case of event described in Figure 6d,j, it can be confirmed that the proposed method did not detect the actual planned load transfer, for the reason that it has no obvious change in load, as can be seen in figures.
3.3.3. Analysis of Peak Load of Distribution Line considering Load Transfer Detection
The adequacy of the machine learning based load transfer detection method was analyzed, and the validity of the proposed method was verified through comparison it with the actual planned load transfer record. If the peak load of the distribution line is estimated after removing the load increase caused by the load transfer, it is expected that the efficiency will be secured in terms of the distribution planning by reducing the peak load of each distribution line. Accordingly, the analysis was conducted on how the peak load of each distribution line could be reduced before, and after, the proposed load transfer detection application for 16 distribution lines. The analysis results are shown in the table below.
As shown in the Table 2, the chances that the peak load rises, due to the load transfer, is unlikely to happen, it can be confirmed that the when it does, the peak load on the distribution line can be reduced by up to 14.41% (1.6 MW) by removing the load increase caused by the load transfer. The reduction of peak load on these distribution lines could improve the efficiency of the distribution planning, as already stated. In particular, Jangheung D/L is classified as dangerous group with the peak load of 11.1 MW before load transfer detection, but after removing the load increase, due to load transfer, it can be changed to the peak load of 9.5 MW and be considered as normal group. Therefore, it has been confirmed that just eliminating the load increase due to such simple load transfer can improve the efficiency of the distribution planning.
Table 2.
Peak load change due to load transfer detection.
4. Conclusions
In this study, a method has been proposed to detect load transfer that may have a significant impact on the peak load on the distribution lines. Statistical and machine learning-based methods were analyzed to detect load transfer, and the result showed that the proposed machine learning-based methods were found to be given better performance, in terms of utilization and reliability. In addition, the results of the proposed method were compared with the actual planned load transfer record to analyze their adequacy. It was confirmed that the accuracy reached approximately 77.78% and shown that it can be 83.33% when it comes to consider all kind of load transfer, not only in planned load transfer. Considering the characteristics of the proposed machine learning-based load transfer detection model, it was confirmed that the detection accuracy decreased when the load variation caused by load transfer was minor. However, in terms of distribution planning, as load transfer with minor load variations are less crucial, the practical usability of the proposed model may be highly assessed even more. Moreover, when the proposed method was applied to 16 distribution lines to eliminate load increases due to load transfer, it was shown that the peak load on distribution lines could be reduced by up to 14.41%. It is self-evident that the efficiency of the distribution planning will be improved if the maximum load of the distribution line exceeding 10 MW can be reduced under 10 MW by removing temporary load transfer.
Although many studies mainly focus on developing models for load forecasting or abnormal data detection, in this study, we proposed machine learning-based load transfer detection model in consideration of actual field application. The proposed method has been confirmed to provide reliable detection results, and it is expected to be used as a pre-treatment method to detect load transfer and to obtain high-quality load data for forecasting loads. In addition, the results of this study are meaningful as they showed the possibilities of expansion in the scope of utilization of machine learning methods in power field.
Author Contributions
Conceptualization, J.-H.K. and B.-S.L.; methodology, J.-H.K.; software, J.-H.K.; formal analysis, J.-H.K. and C.-H.K.; data curation, J.-H.K. and B.-S.L.; writing-original draft preparation, J.-H.K.; writing-review and editing, J.-H.K.; supervision, C.-H.K. All authors have read and agreed to the published version of the manuscript.
Funding
This research received no external funding.
Conflicts of Interest
The authors declare no conflict of interest.
References
- Nam, B.W.; Song, K.B.; Kim, K.H.; Cha, J.M. The spatial electric load forecasting algorithm using the multiple regression analysis method. J. Korean Inst. Illum. Electr. Install. Eng. 2008, 22, 63–70. [Google Scholar]
- Song, K.B. The 24 hourly load forecasting of the election day using the load variation rate. Trans. Korean Inst. Electr. Eng. 2010, 59, 1041–1045. [Google Scholar]
- Song, K.B. Various models of fuzzy least-squares linear regression for load forecasting. J. Korean Inst. Illum. Electr. Install. 2007, 21, 61–67. [Google Scholar]
- Taylor, J.W. Triple seasonal methods for short-term electricity demand forecasting. Eur. J. Oper. Res. 2010, 204, 139–152. [Google Scholar] [CrossRef]
- Taylor, J.W. Short-term electricity demand forecasting using double seasonal exponential smoothing. J. Oper. Res. Soc. 2003, 54, 799–805. [Google Scholar] [CrossRef]
- Park, S.S.; Sho, H.S.; Lee, D.G.; Ji, E.M.; Kim, H.S.; Ryu, K.H. Short-term power load forecasting using time pattern for u-city application. J. Korea Spat. Inf. Syst. Soc. 2009, 11, 177–181. [Google Scholar]
- Hong, D.H.; Lee, S.H.; Do, H.Y. Fuzzy linear regression analysis for fuzzy input-output data using shape preserving operations. Fuzzy Sets Syst. 2011, 122, 513–526. [Google Scholar] [CrossRef]
- Song, K.B.; Baek, Y.S.; Hong, D.H.; Jang, G.S. Short-term load forecasting for the holidays using fuzzy linear regression method. IEEE Trans. Power Syst. 2005, 20, 96–101. [Google Scholar] [CrossRef]
- Shin, D.H.; Kim, C.B. A study on deep learning input pattern for summer power demand prediction. J. Korean Inst. Inf. Technol. 2016, 14, 127–134. [Google Scholar] [CrossRef]
- Ahn, J.Y.; Park, S.M.; Kim, C.B. A study on neural network model for winter electric power demand prediction. J. Korean Inst. Inf. Technol. 2017, 15, 1–9. [Google Scholar] [CrossRef]
- Park, J.W.; Moon, J.H.; Hwang, E.J. An electric load forecasting scheme with high time resolution based on artificial neural network. KIPS Trans. Softw. Data Eng. 2017, 6, 527–536. [Google Scholar]
- Moon, J.H.; Park, S.W.; Hwang, E.J. A multilayer perceptron-based electric load forecasting scheme via effective recovering missing data. KIPS Trans. Softw. Data Eng. 2019, 8, 67–78. [Google Scholar]
- Fan, C.; Xiao, F.; Hea, S.Y.; Zhao, Y. A short-term building cooling load prediction method using deep learning algorithms. Appl. Energy 2017, 195, 222–233. [Google Scholar] [CrossRef]
- Ryu, S.H.; Noh, J.K.; Kim, H.S. Deep neural network based demand side short term load forecasting. Energies 2017, 10, 3. [Google Scholar] [CrossRef]
- Bouktif, S.; Fiaz, A.; Ouni, A.; Serhani, M.A. Optimal deep learning LSTM model for electric load forecasting using feature selection and genetic algorithm: Comparison with machine learning approaches. Energies 2018, 11, 1636. [Google Scholar] [CrossRef]
- Lin, Y.; Luo, H.; Wang, D.; Guo, H.; Zhu, K. An ensemble model based on machine learning methods and data preprocessing for short-term electric load forecasting. Energies 2017, 10, 1186. [Google Scholar] [CrossRef]
- Bouktif, S.; Fiaz, A.; Ouni, A.; Serhani, M.A. Single and multi-sequence deep learning models for short and medium term electric load forecasting. Energies 2019, 12, 149. [Google Scholar] [CrossRef]
- Shi, H.; Xu, M.; Li, R. Deep learning for household load forecasting—A novel pooling deep RNN. IEEE Trans. Smart Grid. 2018, 9, 5271–5280. [Google Scholar] [CrossRef]
- Rafiei, M.; Niknam, T.; Aghaei, J.; Shafie-Khah, M.; Catalao, J.P. Probabilistic load forecasting using an improved wavelet neural network trained by generalized extreme learning machine. IEEE Trans. on Smart Grid. 2018, 9, 5271–5280. [Google Scholar] [CrossRef]
- Kim, J.W. Predictive optimization adjusted with pseudo data from a missing data imputation technique. J. Korea Acad. Ind. Coop. Soc. 2019, 20, 200–209. [Google Scholar]
- Kim, G.D.; Kim, Y.H. Correction of drifter data using recurrent neural networks. J. Korea Converg. Soc. 2018, 9, 15–21. [Google Scholar]
- Little, R.J.; Rubin, D.B. Statistical Analysis with Missing Data; John Wiley & Sons: Hoboken, NJ, USA, 2014. [Google Scholar]
- Graham, J.W. Missing data analysis: Making it work in the real world. Annual review of psychology. Annu. Rev. Psychol. 2009, 60, 549–576. [Google Scholar] [CrossRef] [PubMed]


© 2020 by the authors. Licensee MDPI, Basel, Switzerland. This article is an open access article distributed under the terms and conditions of the Creative Commons Attribution (CC BY) license (http://creativecommons.org/licenses/by/4.0/).