Article

Insights into Nanoscale Wettability Effects of Low Salinity and Nanofluid Enhanced Oil Recovery Techniques

1
Craft & Hawkins Department of Petroleum Engineering, Louisiana State University, Baton Rouge, LA 70803, USA
2
Department of Chemistry, Louisiana State University, Baton Rouge, LA 70803, USA
*
Author to whom correspondence should be addressed.
Energies 2020, 13(17), 4443; https://doi.org/10.3390/en13174443
Submission received: 21 July 2020 / Revised: 17 August 2020 / Accepted: 20 August 2020 / Published: 27 August 2020
(This article belongs to the Special Issue Enhanced Oil Recovery 2020)

Abstract

:
In this study, enhanced oil recovery (EOR) techniques—namely low salinity and nanofluid EOR—are probed at the nanometer-scale using an atomic force microscope (AFM). Mica substrates were used as model clay-rich rocks while AFM tips were coated to present alkyl (-CH3), aromatic (-C6H5) and carboxylic acid (-COOH) functional groups, to simulate oil media. We prepared brine formulations to test brine dilution and cation bridging effects while selected concentrations (0 to 1 wt%) of hydrophilic SiO2 nanoparticles dispersed in 1 wt% NaCl were used as nanofluids. Samples were immersed in fluid cells and chemical force mapping was used to measure the adhesion force between polar/non-polar moieties to substrates. Adhesion work was evaluated based on force-displacement curves and compared with theories. Results from AFM studies indicate that low salinity waters and nanoparticle dispersions promote nanoscale wettability alteration by significantly reducing three-phase adhesion force and the reversible thermodynamic work of adhesion, also known as adhesion energy. The maximum reduction in adhesion energy obtained in experiments was in excellent agreement with existing theories. Electrostatic repulsion and reduced non-electrostatic adhesion are prominent surface forces common to both low salinity and nanofluid EOR. Structural forces are complex in nature and may not always decrease total adhesion force and energy at high nanoparticle concentration. Wettability effects also depend on surface chemical groups and the presence of divalent Mg2+ and Ca2+ cations. This study provides fresh insights and fundamental information about low salinity and nanofluid EOR while demonstrating the application of force-distance spectroscopy in investigating EOR techniques.

1. Introduction

A suite of techniques for enhanced oil recovery (EOR) involve the injection of fluids (liquid or gas) into the subsurface to improve overall recovery efficiency of petroleum reservoirs. Chemical-based methods can recover up to 15% oil-in-place which would have otherwise been left buried in the ground after primary and secondary recovery phases [1]. There are several factors that indicate the success of an EOR technique, such as microscopic sweep efficiency, miscibility and wettability.
Wettability is one of the most significant phenomena in EOR because it describes the interactions of reservoir fluids, rocks and surrounding thermodynamic conditions. It is the tendency of one fluid to spread on or adhere to a rock surface when at least one other immiscible fluid is present [2]. A reservoir is said to be water-wet when it prefers to contact water in the presence of oil. Conversely, if oil for a presumably long-time contacts and spreads over the rock surface in the presence of water, the reservoir is said to be oil wet. For a water-wet rock, pore doublet model showed that small pores tend to be occupied by water while the larger pores contain oil [3]. In this case, the pressure differential (known as capillary pressure) required to expel oil out of the pores will be relatively small, which makes residual oil saturation less, and recovery efficiency high. The reverse is true for oil-wet reservoirs: the rock that is preferentially contacting oil will lead to extensive, continuous oil films which makes oil easily occupy the small pores, with water occupying larger pores. Capillary pressure and residual oil saturation become high, and oil relative permeability becomes low which consequently leads to poor recovery factor. Therefore, the degree of alteration from oil-wet to water-wet is integral to improvement in oil recovery. The wettability types described apply to homogeneous rock wettability—other classes such as neutral, intermediate and fractional wettability have also been identified [4] but are not included for the purpose of simplicity.
Traditional methods of characterizing wettability alteration are contact angle [5], relative permeability [6], Amott index [7] and United States Bureau of Mines (USBM) index [8]. Of these techniques, contact angle measurement is the most common because such measurements can easily be done under reservoir thermodynamic and fluid conditions; it is less time-consuming; and it can be used to probe specific mineralogical effects on wettability. Contact angles were measured using the sessile drop technique and the modified sessile drop technique until the dual-drop-dual-crystal (DDDC) technique [9] was developed. The DDDC approach helped overcome the deficiencies in the earlier methods in terms of honoring three-phase boundary, obtaining reproducible results, and requiring less aging time. However, there are certain limitations that constrain the aforementioned wettability evaluation methods. First, wettability is a function of surface forces but macroscopic contact angle and other larger-scale probing techniques give little or no information about the role of intermolecular interactions dominant at sub-micron- to molecular scales [4,10]. Studying the mechanics of rock/oil/fluid adhesion in the context of wettability alteration will help expand the existing body of knowledge and throw new light on fundamental mechanisms at work. Second, the importance of nanopore confinement in organic-rich, low-porosity carbonates and shale oil reservoirs in the Wolfcamp and Bakken formations for example has recently been recognized because of the prolific near-term performance but elusive long-term potential of these type of rocks [11,12]. For such unconventional reservoirs, a significant portion of in-place hydrocarbons are adsorbed (or adhered) on pore walls, but adhesion in the context of tight oil recovery is poorly understood [13,14]. Third, for chemical EOR techniques, it is important to know if an optimal concentration of chemical (like surfactant, polymer or nanoparticle) exist, for technical and economic reasons. Technically, at extremely high concentration, these materials may aggregate and clog oil-containing pores and pore throats leading to high residual oil saturation and severe permeability damage respectively. Economically, one major reason behind limited use of chemical EOR in the industry is injectant cost and a solution will be to use the least chemical concentration that generates the most net present value. There is a pressing need to develop capabilities of probing EOR processes that can tune wettability and boost recovery in an efficient manner. One such tool is the atomic force microscope.
An atomic force microscope (AFM) is a high-resolution analytical tool that can be used to characterize surface forces in an aqueous environment (EOR injectant phase) when rock minerals are brought into contact with functional group species typically found in crude oils. Studies on the interfaces of rock and functional groups can be performed in liquid media to quantify their impact on wettability alteration. In the past, AFM has been used to determine disjoining pressure (total adhesion force per unit area) and evaluate different wettability states in oil reservoirs [15]. The AFM has also been used to identify the correlation between crude oil composition and brine film thickness [16] and to investigate the role of cationic and anionic surfactants such as dodecyltrimethylammonium bromide and propoxylated sulfate respectively in wettability alteration [17]. The AFM has also been applied to determine bitumen/water surface potential [18]; to characterize nanoparticle size distribution [19]; and to assess nanopores in shale gas rocks [20,21]. Recently, chemical force mapping has been used to probe ionically tuned brine and effects on adhesion in petroleum reservoir rock minerals [16,22,23]. There is also a body of literature on interpretations and broad applications of force measurements [24,25,26].
In this study, AFM was used to conduct a nanoscopic investigation of low salinity (5000 ppm) water flooding (LSWF) and nanofluid EOR by measuring adhesion force and work of adhesion using muscovite mica as the substrate and a tip coated with selected functional groups. Both EOR techniques have received significant attention from academic research and industry in the past decade [27,28,29,30,31,32,33]. Underlying mechanisms of LSWF which have been identified are wettability alteration, multi-ion exchange, electrostatic repulsion, polar component desorption [30,34] while that of nanofluid EOR include: disjoining pressure, Brownian motion, interfacial tension (IFT) reduction and wettability alteration [29,35]. Wettability alteration is proposed to be the dominant mechanism of both low salinity [30] and nanofluid EOR [29], however fundamental research questions remain unanswered. First, the response of surface-active crude oil components to wettability effects has been adequately studied [30,36,37] but the impact of low salinity on desorption of non-polar oils—especially aromatic groups—is not known to great detail. Second, nanofluid EOR promises to improve wettability at core-to-field scales [38,39,40,41] but scientific evidence of oil recovery potential in clay-rich formations at the nanoscale appears scarce in literature. This paper addresses the two areas by characterizing adhesion forces using AFM between non-polar “oil” compounds with -CH3 and -C6H5 groups on mica to test for low salinity effects, and interactions between -CH3, -C6H5 and -COOH terminal groups on mica in different nanofluid solutions. This study is being conducted as part of a research initiative to improve oil recovery in Tuscaloosa Marine Shale (TMS), a reservoir with potentially seven billion barrels of oil-in-place which has experienced few exploration and drilling activities. We have purposely used muscovite mica to investigate the role of low salinity EOR in detaching non-polar functional groups from clay-rich surfaces and the potential of nanoparticle dispersions to improve nanoscale wettability in TMS which typically contain clay minerals such as illite and kaolinite. Rock, brine and oil samples were obtained from the East Feliciana parish of the TMS formation, between a true vertical depth (TVD) interval of 15,197 ft and 15,201 ft. The high-resistivity payzone of interest has 8–10% porosity, permeability of 10 μD, initial reservoir pressure of ~11,000 psia and temperature of 276°F [42]. This study builds on our recent efforts to experimentally demonstrate—perhaps for the first time—the nanoscale EOR potential of silica nanofluids in reducing the adhesion of -CH3 and -C6H5 groups on quartz and feldspar surfaces [43].

2. Materials and Methods

2.1. Mineral Samples

Muscovite mica was used as a rock substitute throughout this study because it closely resembles illite and kaolinite clay minerals which have been identified from X-ray Diffraction (XRD) analyses on our TMS cores in terms of the chemical composition and material properties. The XRD data collected shows that the TMS section contains primarily clays (44%) and quartz (43%), with other minerals such as calcite, pyrite, feldspars and anhydrite in small amounts [42]. Mica sheets were purchased from Ward’s Science (Rochester, NY, USA), and were freshly cleaved before each experiment.

2.2. Brine and Nanofluids

For low salinity experiments, salt solutions were prepared to examine the impact of ionic modification and reduced salinity. As presented in Table 1, the composition of artificially formulated formation brine (FB) used to test for high salinity effects (HS) are: sodium, calcium, potassium and magnesium chloride salts making up a total of 72,800 ppm. Salt solutions of 5000 ppm in concentration (with same constituents as HS) were prepared to examine brine dilution effects (LS). The impact of divalent cation bridging on adhesion was explored by preparing a solution with 5000 ppm total dissolved solids (TDS) but without Mg2+ and Ca2+ ions (LSWOMC). For nanofluids, 8 nm sized hydrophilic SiO2 particles (purchased from US Research nanomaterials, Houston TX; see Figure 1) were dispersed in 1 wt% NaCl, and different concentrations (0, 0.05, 0.1 and 0.5 wt%) were prepared. Key properties of these dispersions are tabulated below (see Table 2). In a real-life scenario, fresh or de-ionized water will promote clay swelling and fines migration, hence our choice of dispersant. To simulate brine, a previously prepared brine formulation (AFB) based on TMS formation water geochemical analyses was used as base case [43]. It contains 60,000 ppm NaCl, 10,000 ppm CaCl2, 2650 ppm KCl, 250 ppm MgSO4 and 150 ppm MgCl2.

2.3. AFM Tip Functionalization

Gold-coated silicon nitride probes were employed for facile thiolate functionalization, which is a proven method to coat AFM probes for chemical force mapping [16,22,44]. A Pyrex PNP-TR-Au silicon nitride probe with a gold coated cantilever and tip of radius 28 nm and width of 3.3 µm was used (see Figure 2a). Analyses of crude oil can be tedious as it is a complex mixture, containing more than a thousand compounds. A convenient evaluation method is through saturate, aromatic, resin and asphaltene (SARA) analyses [45] and the AFM tip can be treated with different solutions to represent these groups. The solutions used to represent alkanes and aromatic groups are 1-Undecanethiol and 2-phenylethanethiol respectively (Figure 2b,c), with key properties summarized in Table 3. These thiols were purchased from Sigma Aldrich (St. Louis, MO, USA). Carboxylic acids are surface-active crude oil components typically found in both resins and asphaltene fractions, thus 11-mercaptoundecanoic acid was used to represent –COOH group (Figure 2d). The acid thiol was purchased as powder.
Coating of gold-coated silicon nitride tips with thiol produces self-assembled monolayers (SAMs) which are very stable, and with long hydrocarbon chains in a configuration presented in Figure 2b–d. The functionalization procedure is completed with the tip-thiol bond on one end, a long hydrocarbon chain, and -CH3, -C6H5 and -COOH groups on the extreme end which contacts the mineral substrates. Gold-coated Pyrex PNP-TR-Au probes were purchased (Asylum Research, Santa Barbara, CA, USA) and functionalized accordingly. The probes (Nominal spring constant ≈ 0.08 N/m) were UV cleaned for 30 min before immersion into respective 1 mM ethanoic thiol solutions. After at least 24 h, the tips were removed and rinsed with absolute ethanol. A freshly prepared tip was used for each experiment.

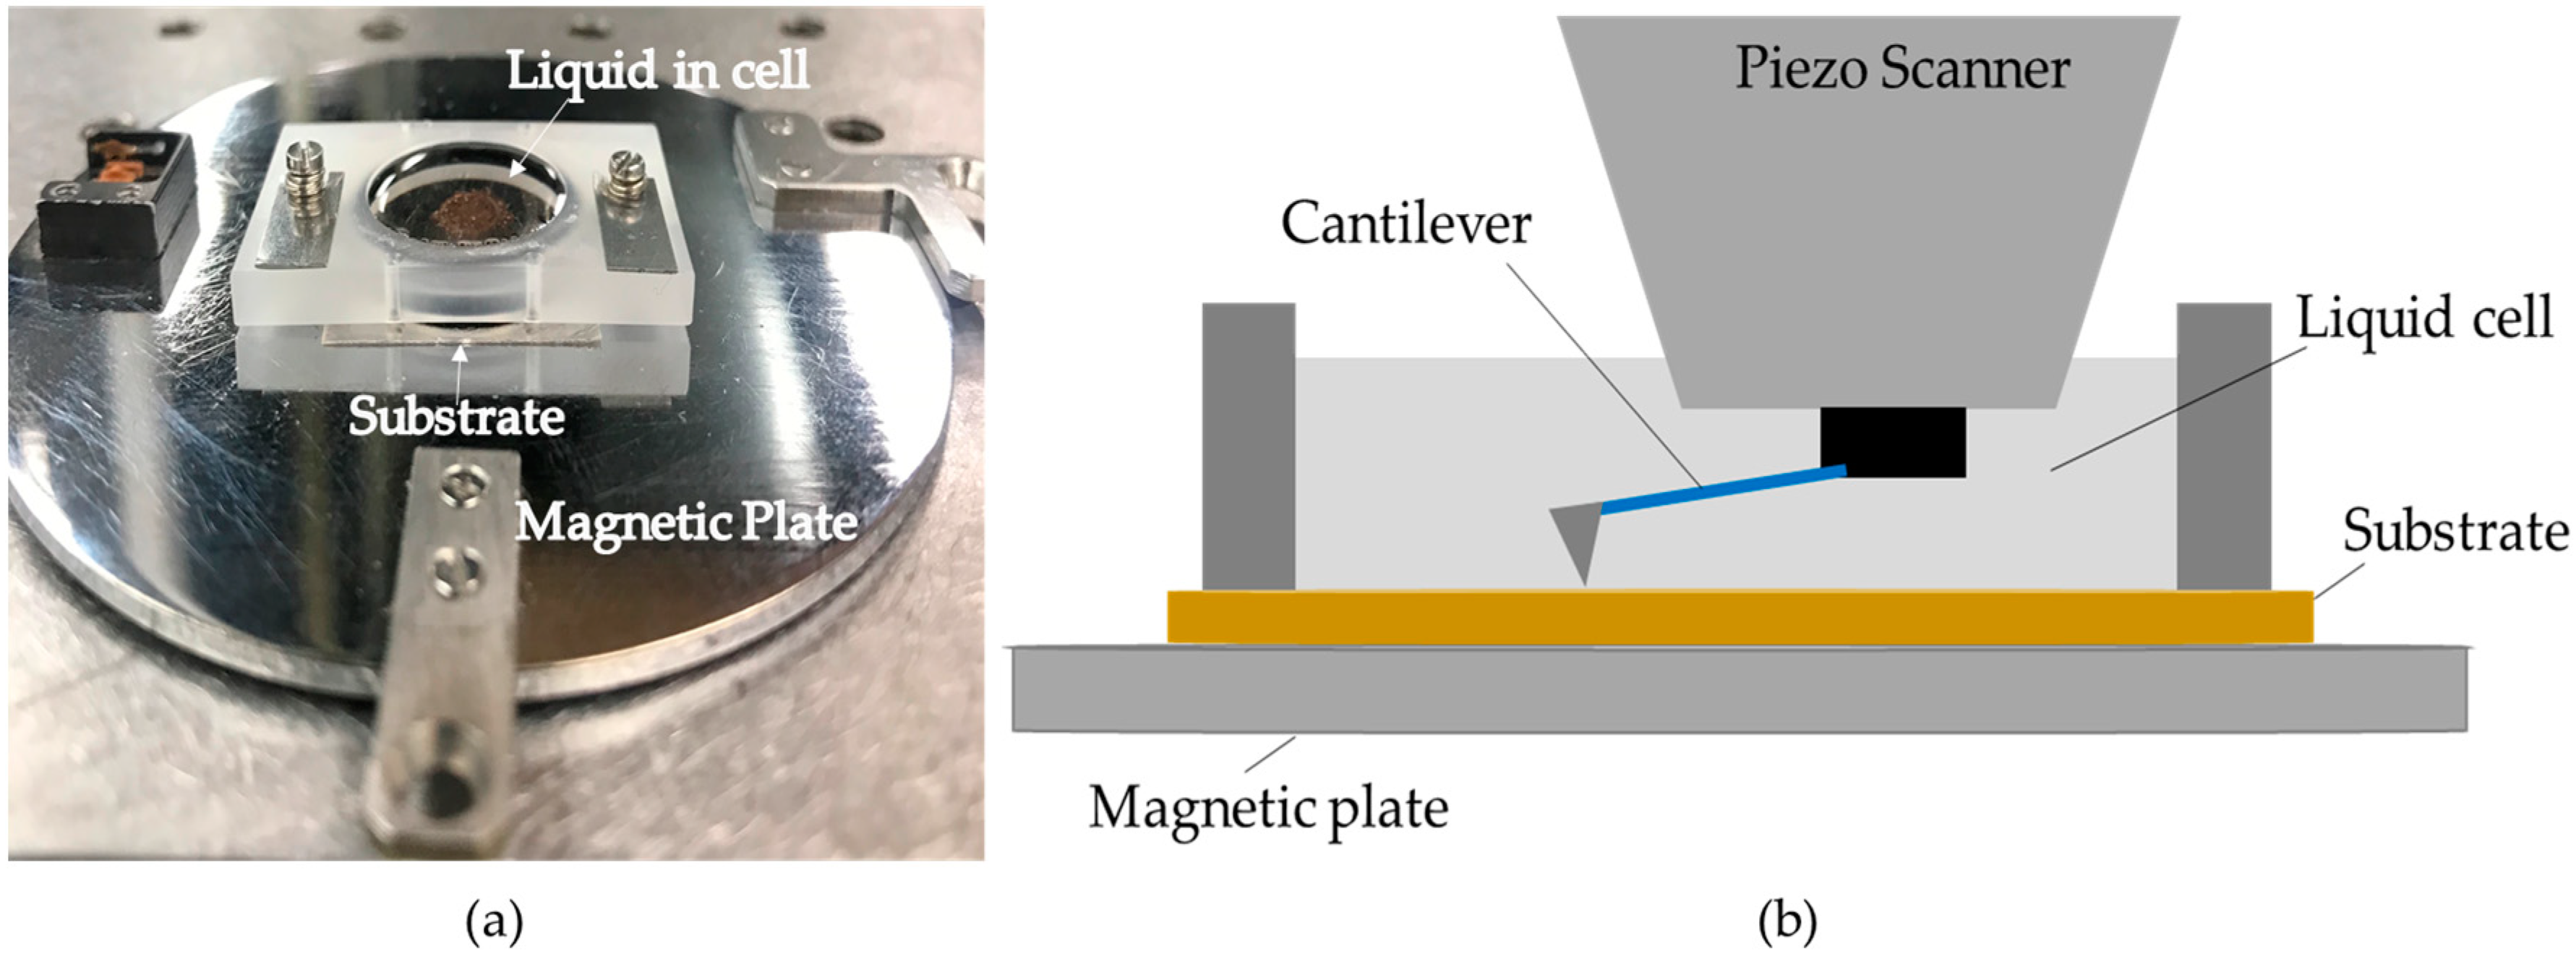
2.4. Experimental Procedure

A schematic of the AFM setup is presented in Figure 3. As the functionalized tip gently approaches the surface, it senses surface properties and causes the cantilever to bend. The position of the laser spot reflected from the cantilever onto the photodiode detector changes in response and the resulting deflection is recorded by the detector. Depending on the tip-sample distance, the feedback controller either allows piezoelectric scanner to adjust the position of the tip or the data is transmitted through topography images and/or force maps.
The design for the liquid cell experiments is shown in Figure 4. The substrate which is muscovite mica is pinned onto the magnetic plate with the liquid cell before the test solution is introduced (Figure 4a). Afterwards, the cantilever is lowered into the liquid-filled cell by adjusting the piezo scanner and the system is allowed to equilibrate (Figure 4b). Chemical force microscopy (CFM) was used to perform adhesion tests in liquids. In CFM, a functionalized probe is used as a chemical sensor which when brought close to a surface can detect nanoscale forces (such as Van der Waal and structural forces) that are resolved in adhesion force measurements [43]. The spatial characterization of adhesion on a given sample area using CFM is referred to as chemical force mapping [44]. Studies with CFM have been reported previously [22,23,44]. Chemical force mapping was performed using a Keysight 5500 AFM (Santa Rosa, CA, USA) using the force volume spectroscopy feature.
Several aqueous media conditions were tested to determine an equilibrium adhesion time, i.e., the time after which there was no significant change in adhesion force (see Figure 5). Substantial variations were observed between 0 and 3 h compared to measurements taken after ≥ 8 h which were not significantly different from those observed after 3 h as shown. For the case of 1 wt% NaCl and 0.5 wt% HNP, evaporation effects might have caused substantial changes in adhesion force measurements after 3 h because the AFM fluid cell was not refilled over the course of the experiments. Nonetheless, it was determined that 3 h was sufficient time to obtain equilibrium adhesion, and this is in accordance with similar experiments performed elsewhere on brine composition effects on rock–oil interactions in carbonate reservoirs [23]. The short time frame makes force spectroscopy provide benefits of efficiency when compared to previous wettability evaluation methods that require days to weeks to obtain statistically tangible and reliable results due to the need for aging and steady state requirement [46,47].
Adsorption of nanoparticles is considered to be crucial for wettability improvement [48,49] and is related to nanoparticle concentration. The sequence of experiments was therefore initiated with artificial formation brine and NaCl solution followed by low to high HNP concentrations, i.e., AFB > 1 wt% NaCl > 0.05 wt% HNP > 0.1 wt% HNP > 0.5 wt% HNP > 1 wt% HNP. The sequence was maintained for each experiment using functionalized probes. Force curves were taken with each test solution, collecting volume maps of adhesion force over a 5 μm × 5 μm scan area with 256 force curve measurements per map. After force volume maps were completed with a specific functionalized probe-substrate combination, the mineral substrate was replaced and the test sequence was repeated. Results from AFM were processed using Gwyddion (version 2.55; released 4 November 2019), an open-source scanning probe microscopy data visualization and analysis tool [50].

3. Results

3.1. Low Salinity EOR

3.1.1. Effect of Brine Salinity on Adhesion of -CH3 Group to Mica

Reduction in brine salinity through dilution and ionic tuning reduced the adhesion force between non-polar -CH3 groups and mica (Figure 6). As the brine salinity was reduced from HS to LS, the mean adhesion force was reduced from 1674 pN to 1134 pN—which is equivalent to more than a 30% decrease. Further, a solution with the same TDS as LS but without calcium or magnesium ions (LSWOMC) was observed to decrease the adhesion force even further, to 318 pN—representing a more than 80% decrease and 70% decrease compared to HS and LS cases, respectively. It has been proposed that a pH of 3 is a reasonable estimate of the isoelectric point of muscovite mica [42] which means that mica will be negatively charged at conditions of higher pH. Neutral salts were used in the formulation of the brine solutions for this study, so a pH close to 7 was expected. A reduction in the concentration of overall dissolved solids will lead to a decrease in the number of potential-determining ions such as Na+, Ca2+ and Mg2+ that may bind hydrophobic groups (-CH3) to negatively charged mica surfaces. As the ionic bridges collapse, there is a net repulsion between the oil compounds and the mineral surface, which is indicated by a decrease in adhesion force that was observed. This repulsive effect will render the surface less oil-wet and potentially reduce residual oil saturation at the pore scale.
Zeta potential measurement across interfaces can provide insight into the role of divalent cations on adhesion force. Xie and co-workers [51] measured zeta potential at brine/kaolinite interfaces during which they observed significant differences in measurements obtained using NaCl compared to CaCl2 and MgCl2 solutions. They showed that the brine/kaolinite zeta potential changed from −14 mV to ~32 mV signifying an increase in negative charges and electrostatic repulsion with a decrease in NaCl concentration 5 wt% to 0.1 wt%. However, a decrease in CaCl2 and MgCl2 from 5 wt% to 0.1 wt% led to a decrease in zeta potential from 9 mV to 2 mV and 7 mV to 1 mV respectively, implying overall positively charged states. Cation bridging as a low salinity oil release mechanism has also been identified at core scales previously [30,36]. Adhesion is a function of both rock/liquid and liquid/liquid interfacial activities [52,53] and brine chemistry also affects oil/water interfacial tension and oil/brine zeta potential. Xie and colleagues [51] observed that, at 10,000 ppm concentration, NaCl led to a more negative zeta potential (~25 mV) than CaCl2 (~13 mV) and MgCl2 (~14 mV).

3.1.2. Effect of Brine Salinity on the Adhesion of -C6H5 Groups to Mica

Aromatic groups are another non-polar functionality that are typically found in crude oils [45]. Similar force mapping experiments were performed in the presence of C6H5 groups on mica, and results are presented in Figure 7. As shown, adhesion forces are lower than in the case of -CH3 even though aromatics are generally more polarizable than alkyl groups. This has also been observed previously by other researchers [16] and the reason is not yet well understood. Wu and colleagues [16] suggested that it might be because C6H5 groups have pi bonds which provide structural stability, and a nucleophilic species can reduce adhesion to mica surfaces. Switching from HS to LS solution reduced the mean adhesion force from 213 to 97 pN, which is more than a 50% decrease (Figure 7). However, removal of divalent calcium and magnesium ions did not appear to further promote wettability alteration beyond LS conditions: adhesion force average in LSWOMC media measured 97 pN while that of LS was 96 pN. This suggests that cationic bridging may not always be an underlying cause of oil recovery via low salinity EOR and it also confirms that crude oil composition influences wettability alteration effects.

3.2. Nanofluid EOR

3.2.1. Effect of Silica Nanofluids on the Adhesion of -CH3 Groups to Mica

Silicon dioxide nanoparticles dispersed in high salinity waters (1 wt% NaCl) can detach molecules of non-polar, alkyl (-CH3) groups from mica surfaces and promote wettability alteration towards a water-wet state (Figure 8). When mica was brought into contact with a tip coated with -CH3 and immersed in AFB and 1 wt% NaCl, the adhesion forces measured 400 pN and 442 pN, respectively (Figure 8a,b).
With 0.05 wt% HNP, the adhesion force decreased to 84 pN (Figure 8c), and a subsequent increase in nanoparticle concentration followed a decrease in surface energies, implying additional wettability improvement (see Figure 8c–e). The lowest adhesion force of 29 pN was obtained with 0.5 wt% HNP, which is more than a 90% decrease compared to AFB. However, it appears there is an optimum number of nanoparticles that favor wettability improvement and a higher concentration of SiO2 nanoparticle dispersion (1 wt% HNP) might in fact increase adhesion force and reverse the wettability trend. Nonetheless, the adhesion force variations as a function of nanofluid concentration provide additional evidence of silica-based nanofluid EOR potential in reservoirs containing predominantly saturated hydrocarbons at the sub-pore scale.

3.2.2. Effect of Silica Nanofluids on the Adhesion of -C6H5 Groups to Mica

Nanofluids can reduce the “sticking” effect of non-polar aromatic (-C6H5) compounds on mica by reducing the adhesion pull-off force (see Figure 9) needed to separate the functionalized tip from the sample. When mica was immersed in formation brine AFB and contacted with a -C6H5 coated tip, the adhesion force was 544 pN (Figure 9a). In 1 wt% NaCl, the adhesion force increased to 735 pN (Figure 9b). However, at 0.05 wt% HNP, the adhesion force decreased substantially to 99 pN (Figure 9c)—signifying a greater than 80% reduction compared to AFB. A subsequent increase in the nanoparticle concentration followed a decrease in the adhesion force, implying additional wettability improvement (see Figure 9c–e). The lowest adhesion force was 52 pN, obtained with 0.5 wt% HNP which is more than 90% lower than that in AFB medium. However, as it was observed for molecular interactions between -CH3 groups and mica, it seems that there is an optimal number of nanoparticles that favor wettability improvement for a mica/aromatic group system such that higher concentration (1 wt% HNP) tends to increase the adhesion force (Figure 9f): a jump in adhesion force from 52 pN at 0.5 wt% HNP to 75 pN at 1 wt% HNP was observed.

3.2.3. Effect of Silica Nanofluids on the Adhesion of -COOH Groups to Mica

Carboxylic acid (COOH) compounds that are usually found in asphaltene and resin components of crude oils are significantly more surface-active than alkyl (CH3) and aromatic (C6H5) groups [54]. Thus, acid groups tend to markedly influence oil-water interfacial tension, reservoir rock wettability, and noticeably respond to wettability alteration effects in chemical EOR [30,36]. The polarity of acid chemical species are evidenced by the high adhesion forces between a COOH terminated AFM tip and mica, irrespective of the surrounding aqueous environment (see Figure 10). The adhesion force in AFB measured 942 pN (Figure 10a) and 3279 pN in 1 wt% NaCl (Figure 10b) which is approx. 5× the force obtained for a tip terminated with -C6H5 and more than 7× the adhesion force recorded with a -CH3 coated tip for the same aqueous medium and mineral substrate. At 0.05 wt% HNP, however, the adhesion force reduced to 484 pN which suggests improvement of the nanoscale wettability towards a less oil-wet state (Figure 10c). An increase in the number of nanoparticles in solution led to a corresponding decrease in the adhesion force: the lowest adhesion force measured was 144 pN at the highest nanofluid concentration of 1 wt% (Figure 10c–f). At this concentration, the adhesion force had dropped by about 90% compared to AFB. An increase in adhesion force between 0.5 wt% and 1 wt% HNP was not observed, as was measured for experiments conducted with non-polar compounds in this study and in a previous report [43]. This suggests that the composition of crude oil has a prominent role in the oil release and mobilization via silica nanofluid EOR, and nonetheless, dispersions of these types of nanomaterials can recover oil containing both polar and non-polar crude oil components.

3.3. Relationship between Adhesion Force, Work of Adhesion and Wettability

The peak adhesion force characterized throughout this study is the point of maximum deflection from the zero base line on the retract portion of the force curve generated under chemical force spectroscopy using AFM [23]. For a functionalized tip in contact with a mineral substrate (substitute for a rock surface) immersed in a liquid medium, the integral area between the approach and retract portions of the force curve is known as the work of adhesion [43] (also see Figure 11). In the context of crude oil/rock/brine (or nanofluid) interactions, this property—also referred to as adhesion energy—is defined as the energy required to separate the oil/rock interface, forming a new oil/brine (or nanofluid) interface and brine (or nanofluid)/rock interface [55]. Hypothetically speaking, the swept regions of TMS rocks containing 100% oil will see a gradual reduction in oil saturation (shift toward less oil-wet state) while regions containing a mixture of oil and connate brine (possibly mixed-wet) may observe an increase in the rock relative permeability to oil and also a decrease in residual oil saturation.
Through multiple mechanisms such as ion exchange and double layer expansion (a mechanism which arises when charged solids are immersed in similarly charged fluids, creating a double layer and leading to electrostatic repulsion), low salinity brine promotes the growth of thin water wetting films, reducing the work of adhesion needed to disrupt oil/rock interfaces [52]. Likewise, injecting dispersions of silicon dioxide nanoparticles into the reservoir can penetrate oil/rock interfaces by forming a wedge film [9,29,56]. By doing so, fluids containing nanoparticles will advance over the area previously occupied by the oil phase, reducing the work of adhesion to gradually change the system to a less oil-wet state. Since the aim of this study is to simulate rock/oil/brine and rock/oil/nanofluid systems using mineral substrate/functionalized tip/brine and mineral substrate/functionalized tip/nanofluid models respectively, it can be said that the work of adhesion obtained from AFM will give an indication of the wetting effects of nanofluid and low salinity EOR, in addition to adhesion force measurements. It has been established from modelling and experimental efforts that both properties are directly related. Two of the most popular models on adhesion mechanics were developed by Johnson, Kendall and Roberts (JKR) [57] and by Derjaguin, Muller and Toporov (DMT) [58]. For a system of interacting bodies such as a sphere and a plane, both models described adhesion force (N) in the form of:
|Fadh| = αadhπRWadh
where αadh is adhesion characterization parameter, R is radius of sphere/plane or sphere/sphere area, depending on the system configuration (nm), and Wadh is the work of adhesion (N/m). Differences between JKR and DMT models are that αadh is 1.5 (for soft surfaces such as rubber and gelatin) in the former and 2 (hard surfaces such as steel) in the latter. It is known that the JKR model applies to large spheres with a high surface energy and low elastic moduli whereas DMT theory is more suited for small spheres with a low surface energy and high elastic moduli [24]. Yet, the boundaries for classifying the magnitude of these parameters are not well known.
With AFM force spectroscopy, the work of adhesion can be directly obtained from force-displacement curves (see Figure 11) and as we also reported in a previous study [43]. As shown in Figure 11, Wadh is the colored area (in yellow) between the approach and retract curves as the AFM tip interacts with a surface.
Let the total adhesion force measured under AFM be Fadh, with spring constant ks, cantilever deflection zcan, piezo displacement zpiezo, true sample-tip separation D and work of adhesion Wadh. It then follows that [26]:
Fadh = kszcan
D = zcan + zpiezo
At contact regime, D = 0 so that zcan equals zpiezo in magnitude but opposite in sign. Wadh from Figure 11 is equivalent to the area of a triangle expressed as:
Wadh = Fadhzpiezo/2
or
Wadh = −Fadhzcan/2
Ignoring the negative sign in Equation (5) (since Wadh is a physical property) and substituting zcan from Equation (2) gives [26]:
Wadh = Fadh2/(2ks)
where Fadh is in N, zcan, zpiezo and D are in m, ks is in N/m and Wadh is in J. This expression provides a convenient means of obtaining adhesion work based on the adhesion force and spring constant, both of which can be obtained from the force-displacement curve. It also eliminates the need to transform hundreds to thousands of force-displacement curves (F(zpiezo)) obtained per adhesion map to force-distance curves (F(D)) [59]. The spring constant was measured to be 0.08 N/m which is the same as provided by the tip manufacturer. To compare our data with JKR and DMT models, the adhesion force and the tip radius must be known. An SEM image of the tip cleaned under UV light was obtained (Figure 12) and the tip radius measured ~28 nm. The measured radius becomes an applicable parameter R in Equation (1) when the tip directly interacts with the mineral substrate, for instance in brine solutions. However, in the presence of nanoparticles adsorbed on the surface, there are two spheres involved—the tip and the nanomaterial. Several authors have maintained that, for a sphere-sphere interaction, R becomes the product of tip radius (28 nm) and nanoparticle radius (8 nm) divided by their sum [60] which is approximately 6 nm, if we assume that the tip apex always contacts an SiO2 nanoparticle on approaching the mica substrate.
To compare DMT and JKR adhesion mechanics models with results from this work, the Wadh in Equation (1) (N/m or J/m2) and Equation (6) (J) should have the same units. Consequently, Equation (1) was multiplied by πR2 (assuming the tip has a circular surface area) and rearranged so that work of adhesion becomes:
Wadh = FadhR/αadh
Next, Equations (6) and (7) were applied to obtain adhesion work values (10−18 J or 1 aJ) for all experiments performed in brine solutions (Table 4) and nanofluids (Table 5). Note that the DMT and JKR equations require adhesion forces to be known, which were obtained using AFM force spectroscopy in this study. Pertinent to low salinity tests, the maximum reduction in the Wadh was calculated as a percentage decrease in surface energies when switching from HS solution to optimal low salinity condition, LSWOMC (see Table 4). For nanofluid experiments, it was calculated as the percentage reduction in Wadh from artificial formation brine (AFB) to the optimum nanofluid concentration, which was 0.5 wt% HNP in the presence of -CH3 and -C6H5 tips and 1 wt% HNP in the presence of COOH groups (Table 5). Note that the reference (high case) solution here is AFB and not necessarily the solution that generates the highest adhesion force.
When a mica substrate was contacted with non-polar undecane compounds, switching from high salinity (HS) to low salinity solution without divalent cations (LSWOMC) caused a 97% decrease in adhesion energy, from 17.5 aJ to 0.6 aJ (Table 4). With aromatic groups, the Wadh was generally lower, although an 81% maximum reduction was observed with low salinity effects, from 0.3 aJ to 5.8 × 10⁻²aJ (Table 4). In comparison, the maximum decrease in Wadh obtained with JKR and DMT equations for -CH3/mica/brine and -C6H5/mica/brine systems were 81% and 55% respectively (Figure 13).
The wettability improvement latency and EOR potential of hydrophilic nanosilica dispersions is also reflected in substantial decrease in Wadh, to the order of 10−20 J (10−2 aJ) or less for molecular interactions of mica with non-polar -CH3 and -C6H5 compounds and typically in units of aJ for -COOH tips on mica in nanofluid media (Table 5). The interaction of -CH3 terminated tip with mica immersed in AFB requires a pull-off adhesion energy of 1 aJ and switching from AFB to optimal nanofluid concentration of 0.5 wt% HNP lowered the adhesion energy to 5.3 × 10⁻³ aJ, equivalent to 99% maximum reduction. In comparison with JKR and DMT models, the maximum reduction obtained was 98% (Figure 14a). The same concentration of silica nanofluids led to a maximum reduction of 99% in Wadh compared to AFB—from 1.9 aJ to 1.7 × 10⁻² aJ—when the mineral surface was contacted with an aromatic C6H5 tip. This matches well with JKR and DMT equations which predicted 98% maximum decrease when 0.5 wt% HNP is used in place of artificial formation brine AFB (Figure 14b). In the presence of polar -COOH group, adhesion work is generally higher compared to -CH3 and -C6H5 compounds, but the effect of silica nanofluid dispersions is still as significant.
Unmodified SiO2 nanoparticle dispersions at 1 wt% concentration (1 wt% HNP) decreased mica/COOH adhesion energy from 5.5 aJ (using AFB) to 0.1 aJ. This is equivalent to 98% maximum decrease which is in excellent agreement with DMT and JKR forecasts of 97% (Figure 14c).

4. Discussion

Adhesion force and energy which are fundamental indicators of wettability alteration were characterized in this study using nanoscale-resolution force spectroscopy to evaluate the effect of ionically tuned brine and unmodified silicon dioxide nanoparticle dispersions as potential EOR injectants. Particularly, the roles of brine chemistry alteration on the adhesion of non-polar CH3 and C6H5 compounds to muscovite mica as well as effects of SiO2 nanoparticles on the adhesion of CH3, C6H5 and COOH compounds to mica were revealed by measuring adhesion forces (nN-pN) using chemical force mapping and obtaining the adhesion energy (aJ) using elemental force curve analyses.
From this work, it was shown that low salinity EOR through brine dilution can steer the wettability of a clay-rich rock containing predominantly non-polar hydrocarbons towards a less oil-wet state by significantly reducing the adhesion force required to desorb molecules containing CH3 and C6H5 functional groups from a mica substrate. Broadly speaking, this has the potential to increase oil relative permeability and decrease water relative permeability, reduce residual oil saturation and boost recovery efficiency. This finding is also in tandem with previous studies conducted by Wu and colleagues [16] on mica in the presence of CH3 and C6H5 coated AFM tips at varying salt concentrations. In their work, they showed that the adhesion force between CH3 groups and mica and C6H5 and mica decreased from 1524 pN to 266 pN and from 738 pN to ~0 pN respectively as salinity was reduced from 8000 ppm to 1000 ppm NaCl. Further, we observed that removal of divalent Mg2+ and Ca2+ cations resulted in the largest decrease in the adhesion force (81%) for a model clay/CH3 compound system. However, removal of the cations did not yield significant post-brine dilution changes when mica was contacted with an aromatic C6H5 coated tip, even though it helped to substantially decrease adhesion force (55%) compared to high salinity conditions. This shows that low salinity EOR is sensitive to crude oil composition, as some authors have indicated [30,37]. Second, it agrees with previous studies in which cation exchange was identified and proposed as a low salinity EOR mechanism for reservoirs with active clay sites containing predominantly alkane hydrocarbons [61]. Overall, such fundamental studies provide more visible evidence of the potential of ionically tuned brine to improve recovery efficiency in reservoirs that do not only contain surface-active crude oil components, but non-polar alkane and aromatic compounds as well.
Similarly, we demonstrated that 8 nm-sized SiO2 particles dispersed in a solution of high salinity (1 wt% NaCl) can promote nanoscale wettability alteration by significantly reducing the adhesion force needed to disrupt model oil/rock interfaces, expose the surface to hydrophilic particles, promote the growth of thin water-wetting films and convert rock surface to less oil-wet state. Adhesion maps were used to illustrate that silica nanofluids can be effective in tuning surface wettability and recovering oil from clay-rich formations containing non-polar compounds with CH3 and C6H5 groups as well as surface-active components containing COOH groups which are typically found in asphaltene and resin fractions of crude oil. First, we observed a tremendous decrease in adhesion force at the lowest concentration of 0.05 wt% HNP tested (~1 × 10¹⁴ particles/mL) compared with artificial formation brine AFB, followed by a subsequent decrease in the adhesion force with an increase in the number of dispersed nanoparticles. For example, when mica was contacted with CH3 and C6H5 tips, at least a 90% reduction in adhesion force was obtained in both scenarios with ~1 × 10¹⁵ SiO2 particles/mL (optimal concentration) compared to AFB. For the case of mica with a COOH tip, the highest percentage decrease (89%) was obtained with 2 × 10¹⁵ particles/mL. To summarize, results presented herein provide a tangible basis for recovery increments obtainable using nanofluid treatments at field scale in shale reservoirs [41].
We compared our AFM data in terms of percentage maximum reduction in adhesion energy via low salinity effects and nanofluids with classical JKR [57] and DMT [58] theories of adhesion mechanics and observed close agreement. For mica with a CH3 tip, a maximum reduction in adhesion work using a low salinity solution (LSWOMC) estimated in this study was 97% compared to 81% predicted by DMT and JKR equations. For mica with a C6H5 tip, we estimated an 81% maximum reduction with LSWOMC whereas JKR and DMT models both predicted 55% decrease. A closer match was observed with nanofluids, and the main reason is that, as per equation (7), the effective radius R for a nanosphere–tip contact describing the interaction of nanoparticles on mica with the AFM tip is smaller than that of a tip-surface configuration which applies to mica/tip/brine system. Using nanosilica dispersions, the maximum decrease in adhesion energy between mica and a CH3 tip obtained in this work was 99%, while JKR and DMT models predicted 98% decrease. The maximum reduction in adhesion energy between mica and C6H5 tip was 99%, compared to 98% based on JKR and DMT equations respectively. Using a COOH tip, we estimated a 98% maximum reduction which is also in excellent agreement with results obtained using JKR (97%) and DMT (97%) models. Differences between JKR and DMT calculations based on surface energies and material roughness have been highlighted earlier, and minor discrepancies between these models and our study are primarily based on the fact that we considered the effect of the deflection of a functionalized tip in response to surface forces (spring constant) whereas JKR/DMT formulations are based on the geometry of the contact between a functionalized tip and the material surface.
In accordance with Derjaguin–Landau–Verwey–Overbeek (DLVO) theory, adhesion force and energy are a sum of different surface and intermolecular interactions—primarily electrostatic and non-electrostatic components [24,60]. The force contributions can be identified using AFM force spectroscopy as we have reported previously [43] (see Figure 15). Raw force-displacement (F (Zpiezo)) graphs may be used to qualitatively identify different intermolecular forces. On the other hand, quantitative analyses usually require force-distance (F (D)) curves and models that typically demand other experimentally derived parameters such as interfacial zeta potential values, dielectric constants, refractive index, absorption frequencies and surface charge densities [16,22,59].
Van der Waals (vdW) forces and electrostatic repulsion (Figure 15a,b) may be sensed in the approach portion of the AFM force curve while non-electrostatic adhesion and structural forces can be detected in the retraction portion (Figure 15c–e) of the force-displacement curve [25]. Van der Waal forces (attractive or repulsive) apply to all discrete bodies [24] in the absence of long-range interactions, in a similar manner as gravitational forces apply to earthly bodies, and are indicated by a notable well (circled red in Figure 15a) in the force-displacement approach curve. The vdW forces are largely unresponsive to pH and electrolyte concentration [60] and although it is difficult to resolve it from electrostatic interactions (attractive, repulsive or both), a zero frequency of vdW usually implies a complete electric double layer effect [24]. Removal of critical divalent ions from brine creates a net repulsion between hydrophobic oil compounds and a negatively charged mica surface since the isoelectric point (IEP) is less than the solution pH. Consequently, the electric double layer expands to promote a decrease in adhesion energy; growth of imbibing water films; and a change of surface wettability to a less oil-wet state. Hydrophilic silica nanoparticle dispersions also tend to promote double layer repulsion by creating more negative charges on mica and repelling polar and non-polar species. The smaller the particle size, the larger the surface coverage which translates to larger electrostatic repulsion and a higher decrease in adhesion.
In the retracted portion of the curve, a high non-electrostatic adhesion (attractive; circled blue in Figure 15c) may exist when hydrophobic groups interact with mineral substrates under high salinity conditions, as in the case of mica with CH3, C6H5 and COOH “greased” AFM tips in 1 wt% NaCl or AFB. The introduction of dispersed nanoparticles even in high salinity solution then creates a chemical potential gradient that significantly lowers adhesion (circled blue in Figure 15d) as the nanoparticles adsorb onto mica, and appears to be mainly responsible for the decrease in total adhesion force at or below optimal low salinity and nanofluid concentrations. Another non-electrostatic and non-DLVO component known as structural force (Figure 15e) may arise when particles of similar sizes are confined in the nanometer range so that they are discretely ordered in multiple layers. This force contribution may be attractive, repulsive or oscillatory in nature and is not yet well understood [60]. We cross-examined thousands of force curves and it was observed that the increase in total adhesion force (and energy) beyond an optimal nanofluid concentration of 0.5 wt% HNP for mica/CH3 and mica/C6H5 systems is due to the prominence of structural interactions. A stepwise deflection of the cantilever to a zero baseline on the retract force curve is due to the structural component of the adhesion force, which may be indicative of the number of particle layers formed at the solid/liquid interface (asterisk in Figure 15e) [43]. We did not detect any wettability reversal in the case of mica interacting with COOH in nanofluids which might be attributed to the functional group polarity which can prevent complete displacement of carboxylic acid components by silica particles and subsequent ordering at the solid/liquid boundary. Although structural forces were not identified during the low salinity experiments, they have been recognized in previous studies as the main driver of wettability alteration for mica substrates in the presence of CH3, C6H5 and COOH and NH2 [16]. Early studies of nanofluids also showed that structural forces enhance spreading of nanoparticles and creates a positive disjoining pressure [62] which further confirms the complex role of surface forces on nanoscopic wettability.
It has been proposed that, at nanoscale (typically less than 100 nm), it is important to evaluate the total interactive force for a three-phase system (adhesion force) per unit area of separation between two approaching bodies—known as disjoining pressure—in the context of surface wettability [24,60]. A negative disjoining pressure indicates an attractive force while positive disjoining pressure implies a repulsive force [16]. Correspondingly, a decrease in the adhesion force due to repulsive effects between a CH3, C6H5 or COOH tip and mica will follow a change in disjoining pressure towards positive and increasing thickness of the wetting film. An increase in adhesion force due to attraction will tend to create a negative disjoining pressure and wetting film collapse. Therefore it can be said that adhesion force and energy reduction via low salinity and nanofluid EOR observed in this study translates to creation of positive disjoining pressure which also results from non-electrostatic and electrostatic intermolecular interactions.
Finally, AFM results provide fundamental information that should be complemented with other analytical techniques for comprehensive EOR screening. For instance, the pore size distribution in rocks will influence what size and concentration of nanoparticles can be injected, to curb permeability impairment. This might not be of great concern, however, when these nanofluids are used in fracturing treatments to improve wettability. The force spectroscopy experiments performed in this work were at ambient conditions, and although adhesion is typically not a pressure-dependent property, theories of surface forces and ionic interactions have shown that temperature is an influencing factor [22]. Conducting EOR investigations using high-pressure-high-temperature imbibition tests remain a litmus test of microscopic displacement potential and the results obtained from surface characterization experiments such as those performed in this study can be used for optimization and uncertainty analyses. It may also be worthwhile to probe initially oil-wet and water-wet surfaces under AFM and compare results with IFT and contact angle measurements to establish a rule of thumb for nanoscale wettability states in terms of adhesion force, energy and disjoining pressure.

5. Conclusions

Using AFM force spectroscopy, we have provided novel insights into nanoscale wetting effects of ionically tuned brine and hydrophilic nanosilica dispersions when model clay substrates interact with non-polar CH3 and C6H5 and polar COOH groups. This study concludes with the following main highlights:

5.1. Low Salinity EOR

  • Reducing salinity of injected water from ~73,000 ppm to 5000 ppm by dilution significantly reduces adhesion force (55–80%) and energy (90%) between clay surfaces and molecules containing non-polar alkane and aromatic compounds to promote nanoscale wettability improvement
  • Magnesium and calcium divalent cation bridging have been identified as a prominent mechanism of low salinity EOR in clay-rich systems containing predominantly alkane and aromatic compounds
  • The advantage of Mg2+ and Ca2+ ion removal over brine dilution in releasing oil from clays depends on the surface chemical hydrocarbon groups present
  • Nanoscopic wettability improvement via ionically tuned brine is mediated by intermolecular contributions such as electrostatic and non-electrostatic adhesion

5.2. Nanofluid EOR

  • Hydrophilic silicon dioxide nanoparticles substantially decrease the adhesion force (>90%) and energy (98–99%) required to spontaneously detach both polar and non-polar crude oil components from clay-rich formations, thus improving wettability and potentially increasing ultimate recovery
  • Nanosilica materials promote electrostatic repulsion between hydrophobic groups and mica by coating the mica surface and creating more negative charges
  • Wettability alteration using nanofluid EOR is driven by surface forces such as electrostatic repulsion, non-electrostatic adhesion and structural interactions

5.3. Adhesion Force, Energy and Wettability

  • Adhesion force and energy are fundamental wettability indicators which can be used to screen EOR techniques for petroleum reservoir applications
  • Adhesion energy derived from AFM are in excellent agreement with JKR and DMT theories
  • Decrease in adhesion force and energy translates to creation of positive disjoining pressure required to repel oil molecules from rock surfaces and stimulate growth of water wetting films
  • Structural forces are complex and require more in-depth research in the context of surface wettability in rock/oil/fluid systems

Author Contributions

Conceptualization, D.A., D.R.; methodology, D.A., D.R., J.C.G.; validation, D.A., D.R., J.C.G.; formal analysis, D.A.; investigation, D.A.; resources, D.R., J.C.G.; data curation, D.A.; writing—original draft preparation, D.A.; writing—review and editing, D.A., J.C.G., D.R.; visualization, D.A.; supervision J.C.G., D.R.; project administration, J.C.G., D.R.; funding acquisition, D.R. All authors have read and agreed to the published version of the manuscript.

Funding

This research was funded by the Louisiana State Board of Regents under the Economic Development Assistantship program, PG001174.

Acknowledgments

The authors thank Craft & Hawkins Department of Petroleum Engineering at Louisiana State University for providing computing and infrastructural resources for this work. We would like to also express our sincere gratitude to the anonymous reviewers who have helped to substantially improve the technical quality of this paper.

Conflicts of Interest

The authors declare no conflict of interest.

References

  1. Lake, L.W.; Johns, R.; Bossen, B.; Pope, G. Fundamentals of Enhanced Oil Recovery, 2nd ed.; Society of Petroleum Engineers: Richardson, TX, USA, 2014; 479 p. [Google Scholar]
  2. Falode, O.; Manuel, E. Wettability Effects on Capillary Pressure, Relative Permeability, and Irredcucible Saturation Using Porous Plate. J. Pet. Eng. 2014, 2014, 465418. [Google Scholar] [CrossRef] [Green Version]
  3. Heshmati, M.; Piri, M. Interfacial boundary conditions and residual trapping: A pore-scale investigation of the effects of wetting phase flow rate and viscosity using micro-particle image velocimetry. Fuel 2018, 224, 560–578. [Google Scholar] [CrossRef]
  4. Abdallah, W.; Buckley, J.; Carnegie, A.; Edwards, J.; Fordham, E. Fundamentals of Wettability. OilField Rev. 2007, 19, 44–45. [Google Scholar]
  5. Sadeghinezhad, E.; Siddiqui, M.A.Q.; Roshan, H.; Regenauer-Lieb, K. On the interpretation of contact angle for geomaterial wettability: Contact area versus three-phase contact line. J. Pet. Sci. Eng. 2020, 195, 107579. [Google Scholar] [CrossRef]
  6. Kafili Kasmaei, A.; Rao, D.N. Is Wettability Alteration the Main Cause for Enhanced Recovery in Low-Salinity Waterflooding? In Proceedings of the SPE Improved Oil Recovery Symposium, Tulsa, OK, USA, 12 April 2014. [Google Scholar]
  7. Li, S.; Genys, M.; Wang, K.; Torsæter, O. Experimental Study of Wettability Alteration during Nanofluid Enhanced Oil Recovery Process and Its Effect on Oil Recovery. In Proceedings of the SPE Reservoir Characterisation and Simulation Conference and Exhibition, Abu Dhabi, UAE, 14 September 2015; p. 11. [Google Scholar]
  8. Carpenter, C. A Study of Wettability-Alteration Methods With Nanomaterials Application. J. Pet. Technol. 2015, 67, 74–75. [Google Scholar] [CrossRef]
  9. Haeri, F.; Rao, D.N. Precise Wettability Characterization of Carbonate Rocks To Evaluate Oil Recovery Using Surfactant-Based Nanofluids. Energy Fuels 2019, 33, 8289–8301. [Google Scholar] [CrossRef]
  10. Dickinson, W.W.; Aravind, S.S.J.; Higgins, S.R.; Berg, S.; Suijkerbuijk, B.M.J.M.; Schniepp, H.C. Using atomic force spectroscopy to study oil/mineral interactions at reservoir temperatures and pressures. Fuel 2020, 259, 116194. [Google Scholar] [CrossRef]
  11. Li, L.; Sheng, J.J. Nanopore confinement effects on phase behavior and capillary pressure in a Wolfcamp shale reservoir. J. Taiwan Inst. Chem. Eng. 2017, 78, 317–328. [Google Scholar] [CrossRef]
  12. Alfarge, D.; Wei, M.; Bai, B. A Parametric Study on the Applicability of Miscible Gases Based EOR Techniques in Unconventional Liquids Rich Reservoirs. In Proceedings of the SPE Canada Unconventional Resources Conference, Calgary, AB, Canada, 13 March 2018. [Google Scholar]
  13. Pathak, M. Storage Mechanisms of Oil and Gas in Shales. In Encyclopedia of Petroleum Geoscience; Sorkhabi, R., Ed.; Springer International Publishing: Cham, Switzerland, 2018; pp. 1–6. [Google Scholar]
  14. Jin, Z.; Firoozabadi, A. Thermodynamic Modeling of Phase Behavior in Shale Media. SPE-124884-PA 2016, 21, 190–207. [Google Scholar] [CrossRef] [Green Version]
  15. Deng, Y.; Xu, L.; Lu, H.; Wang, H.; Shi, Y. Direct measurement of the contact angle of water droplet on quartz in a reservoir rock with atomic force microscopy. Chem. Eng. Sci. 2018, 177, 445–454. [Google Scholar] [CrossRef]
  16. Wu, J.; Liu, F.; Yang, H.; Xu, S.; Xie, Q.; Zhang, M.; Chen, T.; Hu, G.; Wang, J. Effect of specific functional groups on oil adhesion from mica substrate: Implications for low salinity effect. J. Ind. Eng. Chem. 2017, 56, 342–349. [Google Scholar] [CrossRef]
  17. Kumar, K.; Dao, E.K.; Mohanty, K.K. Atomic Force Microscopy Study of Wettability Alteration. In Proceedings of the SPE International Symposium on Oilfield Chemistry, The Woodlands, TX, USA, 1 January 2005; p. 11. [Google Scholar]
  18. Drelich, J.; Long, J.; Yeung, A. Determining Surface Potential of the Bitumen-Water Interface at Nanoscale Resolution using Atomic Force Microscopy. Can. J. Chem. Eng. 2007, 85, 625–634. [Google Scholar] [CrossRef]
  19. Hoo, C.M.; Starostin, N.; West, P.; Mecartney, M.L. A comparison of atomic force microscopy (AFM) and dynamic light scattering (DLS) methods to characterize nanoparticle size distributions. J. Nanoparticle Res. 2008, 10, 89–96. [Google Scholar] [CrossRef]
  20. Javadpour, F.; Moravvej Farshi, M.; Amrein, M. Atomic-Force Microscopy: A New Tool for Gas-Shale Characterization. SPE-134247-PA 2012, 51, 236–243. [Google Scholar] [CrossRef]
  21. Liu, K.; Ostadhassan, M.; Jabbari, H.; Bubach, B. Potential Application of Atomic Force Microscopy in Characterization of Nano-pore Structures of Bakken Formation. In Proceedings of the SPE Low Perm Symposium, Denver, CO, USA, 5 May 2016; p. 10. [Google Scholar]
  22. Hilner, E.; Andersson, M.P.; Hassenkam, T.; Matthiesen, J.; Salino, P.A.; Stipp, S.L.S. The effect of Ionic strength on oil adhesion in sandstone—the search for the low salinity mechanism. Sci. Rep. 2016, 5. [Google Scholar] [CrossRef] [Green Version]
  23. Chandrasekhar, S.; Mohanty, K.K. Effect of brine composition on oil-rock interaction by atomic force microscopy. J. Pet. Sci. Eng. 2018, 164, 289–301. [Google Scholar] [CrossRef]
  24. Leite, F.L.; Bueno, C.C.; Da Róz, A.L.; Ziemath, E.C.; Oliveira, O.N. Theoretical Models for Surface Forces and Adhesion and Their Measurement Using Atomic Force Microscopy. Int. J. Mol. Sci. 2012, 13, 12773–12856. [Google Scholar] [CrossRef]
  25. Heinz, W.F.; Hoh, J.H. Spatially resolved force spectroscopy of biological surfaces using the atomic force microscope. Nanotechnology 1999, 17, 143–150. [Google Scholar] [CrossRef]
  26. Butt, H.-J.; Cappella, B.; Kappl, M. Force measurements with the atomic force microscope: Technique, interpretation and applications. Surf. Sci. Rep. 2005, 59, 1–152. [Google Scholar] [CrossRef] [Green Version]
  27. Mahani, H.; Sorop, T.; Ligthelm, D.J.; Brooks, D.; Vledder, P.; Mozahem, F.; Ali, Y. Analysis of field responses to low-salinity waterflooding in secondary and tertiary mode in Syria. In Proceedings of the SPE EUROPEC/EAGE Annual Conference and Exhibition, Vienna, Austria, 23–26 May 2011. [Google Scholar]
  28. Torsater, O.; Engeset, B.; Hendraningrat, L.; Suwarno, S. Improved Oil Recovery by Nanofluids Flooding: An Experimental Study. In Proceedings of the SPE Kuwait International Petroleum Conference and Exhibition, Kuwait City, Kuwait, 1 January 2012; p. 9. [Google Scholar]
  29. Bennetzen, M.V.; Mogensen, K. Novel Applications of Nanoparticles for Future Enhanced Oil Recovery. In Proceedings of the International Petroleum Technology Conference, Kuala Lumpur, Malaysia, 10 December 2014; p. 14. [Google Scholar]
  30. Afekare, D.A.; Radonjic, M. From Mineral Surfaces and Coreflood Experiments to Reservoir Implementations: Comprehensive Review of Low-Salinity Water Flooding (LSWF). Energy Fuels 2017, 31, 13043–13062. [Google Scholar] [CrossRef]
  31. Tetteh, J.T.; Alimoradi, S.; Brady, P.V.; Barati Ghahfarokhi, R. Electrokinetics at calcite-rich limestone surface: Understanding the role of ions in modified salinity waterflooding. J. Mol. Liq. 2019, 297, 111868. [Google Scholar] [CrossRef]
  32. Hanushevych, K.; Srivastava, V. Coalbed Methane: Places Of Origin, Perspectives Of Extraction, Alternative Methods Of Transportation With The Use Of Gas Hydrate And Nanotechnologies. Min. Miner. Depos. 2017, 11, 23–33. [Google Scholar] [CrossRef]
  33. Negin, C.; Ali, S.; Xie, Q. Application of nanotechnology for enhancing oil recovery—A review. Petroleum 2016, 2, 324–333. [Google Scholar] [CrossRef]
  34. Sheng, J.J. Critical review of low-salinity waterflooding. J. Pet. Sci. Eng. 2014, 120, 216–224. [Google Scholar] [CrossRef]
  35. Sheshdeh, M.J. A Review Study of Wettability Alteration Methods with Regard to Nano-Materials Application. In Proceedings of the SPE Bergen One Day Seminar, Bergen, Norway, 22 April 2015; p. 12. [Google Scholar]
  36. Fjelde, I.; Omekeh, A.V.; Sokama-Neuyam, Y.A. Low Salinity Water Flooding: Effect Of Crude Oil Composition. In Proceedings of the SPE Improved Oil Recovery Symposium, Tulsa, OK, USA, 12–16 April 2014. [Google Scholar]
  37. McMillan, M.D.; Rahnema, H.; Romiluy, J.; Kitty, F.J. Effect of exposure time and crude oil composition on low-salinity water flooding. Fuel 2016, 185, 263–272. [Google Scholar] [CrossRef]
  38. Shahrabadi, A.; Bagherzadeh, H.; Roostaie, A.; Golghanddashti, H. Experimental Investigation of HLP Nanofluid Potential to Enhance Oil Recovery: A Mechanistic Approach. In Proceedings of the SPE International Oilfield Nanotechnology Conference and Exhibition, Noordwijk, The Netherlands, 1 January 2012; p. 9. [Google Scholar]
  39. Hendraningrat, L.; Li, S.; Torsater, O. A Coreflood Investigation of Nanofluid Enhanced Oil Recovery in Low-Medium Permeability Berea Sandstone. In Proceedings of the SPE International Symposium on Oilfield Chemistry, The Woodlands, TX, USA, 8 April 2013; p. 14. [Google Scholar]
  40. Ali, J.A.; Kolo, K.; Manshad, A.K.; Mohammadi, A.H. Recent advances in application of nanotechnology in chemical enhanced oil recovery: Effects of nanoparticles on wettability alteration, interfacial tension reduction, and flooding. Egypt. J. Pet. 2018, 27, 1371–1383. [Google Scholar] [CrossRef]
  41. Syfan, F.E.; Holcomb, D.L.; Lowrey, T.A.; Nickerson, R.L.; Sam, A.B.; Ahmad, Y. Enhancing Delaware Basin Stimulation Results Using Nanoparticle Dispersion Technology. In Proceedings of the SPE Hydraulic Fracturing Technology Conference and Exhibition, The Woodlands, TX, USA, 23 January 2018; p. 24. [Google Scholar]
  42. Afekare, D.A.; Garno, J.C.; Rao, D.N. Application of Force Spectroscopy to Evaluate Rock-Fluid Interactions at the Nanoscale. In Proceedings of the SPE/AAPG/SEG Unconventional Resources Technology Conference, Virtual, 20–22 July 2020; p. 20. [Google Scholar]
  43. Afekare, D.; Gupta, I.; Rao, D. Nanoscale investigation of silicon dioxide nanofluids and implications for enhanced oil recovery—An atomic force microscope study. J. Pet. Sci. Eng. 2020, 191, 107165. [Google Scholar] [CrossRef]
  44. Hassenkam, T.; Mathiesen, J.; Pedersen, C.; Dalby, K.; Stipp, S.; Collins, I.R. Observation of the Low Salinity Effect by Atomic Force Adhesion Mapping on Reservoir Sandstones. In Proceedings of the SPE Improved Oil Recovery Symposium, Tulsa, OK, USA, 1 January 2012; p. 14. [Google Scholar]
  45. Hackley, P.C.; Dennen, K.O.; Garza, D.; Lohr, C.D.; Valentine, B.J.; Hatcherian, J.J.; Enomoto, C.B.; Dulong, F.T. Oil-source rock correlation studies in the unconventional Upper Cretaceous Tuscaloosa marine shale (TMS) petroleum system, Mississippi and Louisiana, USA. J. Pet. Sci. Eng. 2020, 190, 107015. [Google Scholar] [CrossRef]
  46. Hendraningrat, L.; Li, S.; Torsæter, O. A coreflood investigation of nanofluid enhanced oil recovery. J. Pet. Sci. Eng. 2013, 111, 128–138. [Google Scholar] [CrossRef]
  47. Mascle, M.; Youssef, S.; Deschamps, H.; Vizika, O. In-Situ Investigation of Aging Protocol Effect on Relative Permeability Measurements Using High-Throughput Experimentation Methods. Petrophysics 2019, 60, 514–524. [Google Scholar] [CrossRef]
  48. Hendraningrat, L.; Torsæter, O. Metal oxide-based nanoparticles: Revealing their potential to enhance oil recovery in different wettability systems. Appl. Nanosci. 2015, 5, 181–199. [Google Scholar] [CrossRef] [Green Version]
  49. Li, S.; Torsæter, O. The Impact of Nanoparticles Adsorption and Transport on Wettability Alteration of Water Wet Berea Sandstone. In Proceedings of the SPE/IATMI Asia Pacific Oil & Gas Conference and Exhibition, Nusa Dua, Bali, Indonesia, 20 October 2015; p. 11. [Google Scholar]
  50. Nečas, D.; Klapetek, P. Gwyddion: An open-source software for SPM data analysis. Cent. Eur. J. Phys. 2012, 10, 181–188. [Google Scholar] [CrossRef]
  51. Xie, Q.; Chen, Y.; You, L.; Hossain, M.M.; Saeedi, A. Drivers of Wettability Alteration for Oil/Brine/Kaolinite System: Implications for Hydraulic Fracturing Fluids Uptake in Shale Rocks. Energies 2018, 11, 1666. [Google Scholar] [CrossRef] [Green Version]
  52. Lashkarbolooki, M.; Ayatollahi, S. Investigating injection of low salinity brine in carbonate rock with the assist of works of cohesion and adhesion and spreading coefficient calculations. J. Pet. Sci. Eng. 2018, 161, 381–389. [Google Scholar] [CrossRef]
  53. Nguyen, D.; Phan, T.; Hsu, T.-P.; Phan, J. Adhesion and surface energy of shale rocks. Colloids Surf. A Physicochem. Eng. Asp. 2017, 520, 712–721. [Google Scholar] [CrossRef]
  54. Andersen, S.I.; Chandra, M.S.; Chen, J.; Zeng, B.Y.; Zou, F.; Mapolelo, M.; Abdallah, W.; Buiting, J.J. Detection and Impact of Carboxylic Acids at the Crude Oil-Water Interface. Energy Fuels 2016, 30, 4475–4485. [Google Scholar] [CrossRef]
  55. Zhang, J. Work of Adhesion and Work of Cohesion. In Encyclopedia of Tribology; Wang, Q.J., Chung, Y.-W., Eds.; Springer US: Boston, MA, USA, 2013; pp. 4127–4132. [Google Scholar]
  56. Chengara, A.; Nikolov, A.D.; Wasan, D.T.; Trokhymchuk, A.; Henderson, D. Spreading of nanofluids driven by the structural disjoining pressure gradient. J. Colloid Interface Sci. 2004, 280, 192–201. [Google Scholar] [CrossRef]
  57. Johnson, K.L.; Kendall, K.; Roberts, A.D. Surface Energy and the Contact of Elastic Solids. Proc. R. Soc. Lond. Ser. A 1971, 324, 301–313. [Google Scholar] [CrossRef] [Green Version]
  58. Derjaguin, B.V.; Muller, V.M.; Toporov, Y.P. Effect of contact deformations on the adhesion of particles. J. Colloid Interface Sci. 1975, 53, 314–326. [Google Scholar] [CrossRef]
  59. Lorenz, B.; Ceccato, M.; Andersson, M.P.; Dobberschütz, S.; Rodriguez-Blanco, J.D.; Dalby, K.N.; Hassenkam, T.; Stipp, S.L.S. Salinity-Dependent Adhesion Response Properties of Aluminosilicate (K-Feldspar) Surfaces. Energy Fuels 2017, 31, 4670–4680. [Google Scholar] [CrossRef]
  60. Israelachvili, J.N. Intermolecular and Surface Forces; Elsevier: Amsterdam, The Netherlands, 2009. [Google Scholar]
  61. Lee, S.Y.; Webb, K.J.; Collins, I.; Lager, A.; Clarke, S.; O'Sullivan, M.; Routh, A.; Wang, X. Low Salinity Oil Recovery: Increasing Understanding of the Underlying Mechanisms. In Proceedings of the SPE Improved Oil Recovery Symposium, Tulsa, OK, USA, 1 January 2010. [Google Scholar]
  62. Wasan, D.; Nikolov, A.; Kondiparty, K. The wetting and spreading of nanofluids on solids: Role of the structural disjoining pressure. Curr. Opin. Colloid Interface Sci. 2011, 16, 344–349. [Google Scholar] [CrossRef]
Figure 1. Nanoparticles characterized under Transmission Electron Microscope.
Energies 13 04443 g001
Figure 2. Scanning Electron Microscope (SEM) micrograph of an AFM probe and conceptual schematic of functionalized tips. (a) A Pyrex PNP-TR-Au probe with gold coated cantilever and tip; the functionalization procedure is completed with the tip-thiol bond on one end, a long hydrocarbon chain, and (b) -CH3, (c) -C6H5 and (d) -COOH groups on the extreme end which contacts the mineral substrates.
Energies 13 04443 g002
Figure 3. Schematic of the AFM setup. As the functionalized tip approaches the surface, it senses surface properties and causes the cantilever to bend. The position of the laser spot reflected from the cantilever onto the photodiode detector changes in response and the resulting deflection is recorded by the detector. Depending on the tip-sample distance, the feedback controller either allows the piezoelectric scanner to adjust the position of the tip, or the data is transmitted through topography images and/or force maps.
Energies 13 04443 g003
Figure 4. AFM liquid cell design: (a) an image of the cell containing a test solution (brine or nanofluids) pinned with the substrate to a magnetic plate; and (b) graphic of the overall setup as the tip scans the substrate area after equilibration. This is an open cell design: the liquid level is open to air so the liquid can evaporate over time.
Energies 13 04443 g004
Figure 5. Graph of adhesion force as a function of time between a -CH3 terminated tip and mica in five test solutions: de-ionized water (DIW); artificial formation brine (AFB); 10,000 ppm sodium chloride (1 wt% NaCl) and solutions of 0.05 wt% and 0.5 wt% silica nanoparticles dispersed in 1 wt% NaCl (0.05 wt% HNP and 0.5 wt% HNP respectively) solutions. Minor discrepancies observed in the case of 1 wt% NaCl and 0.5 wt% HNP are mostly due to evaporation effects which become significant over a long period of time. Each data point is an average of 256 force curve measurements.
Energies 13 04443 g005
Figure 6. Force volume maps collected over a 5 μm × 5 μm scan area characterizing the adhesion of non-polar -CH3 group to mica substrates in (a) HS, (b) LS and (c) LSWOMC brine solutions. The mean adhesion force beneath the 16 × 16-pixel maps was based on 256 force curve measurements. A reduction in the salt concentration from HS to LS led to a decrease in the adhesion force (left to right). Reducing the concentration of Ca2+ and Mg2+ to zero while maintaining same amount of TDS as LS (LSWOMC) also lowered adhesion force significantly.
Energies 13 04443 g006
Figure 7. Force volume maps collected over a 5 μm × 5 μm scan area characterizing adhesion of non-polar C6H5 groups to mica substrates in (a) HS, (b) LS, and (c) LSWOMC brine solutions. The mean adhesion force beneath the 16 × 16-pixel maps was based on 256 force curve measurements. A reduction in salt concentration from HS to LS led to a decrease in adhesion force (left to right). However, reducing the concentration of Ca2+ and Mg2+ to zero while maintaining same amount of TDS as LS (LSWOMC) did not yield a substantial decrease in adhesion force.
Energies 13 04443 g007
Figure 8. Force volume maps collected over a 5 μm × 5 μm scan area characterizing adhesion of non-polar -CH3 groups to mica substrates in brine solutions. (a) AFB and (b) 1 wt% NaCl (a,b) and nanofluid solutions; (c) 0.05 wt%; (d) 0.1 wt%; (e) 0.5 wt%; (f) 1 wt% HNP. AFB is a formation brine formulation while 1 wt% NaCl is dispersant for the nanoparticles. The average adhesion force beneath the 16 × 16 pixel maps is based on 256 force curve measurements. An increase in nanoparticle concentration led to a decrease in adhesion force, although it appears that there is an optimum concentration of nanofluids for nanoscale wettability alteration, which in this case might be 0.5 wt% HNP.
Energies 13 04443 g008
Figure 9. Force volume maps collected over a 5 μm × 5 μm scan area characterizing the adhesion of non-polar C6H5 groups to mica in brine solutions—(a) AFB and (b) 1 wt% NaCl—and nanofluid solutions—(c) 0.05 wt%; (d) 0.1 wt%; (e) 0.5 wt%; (f) 1 wt% HNP. AFB is a formation brine formulation while 1 wt% NaCl is a dispersant for the nanoparticles. The mean average adhesion force beneath the 16 × 16-pixel maps is based on 256 force curve measurements. An increase in nanoparticle concentration led to a decrease in adhesion force, although it appears that there is an optimum concentration of nanofluids for nanoscale wettability alteration, which in this case was determined to be 0.5 wt% HNP.
Energies 13 04443 g009
Figure 10. Force volume maps collected over a 5 μm × 5 μm scan area characterizing adhesion of non-polar COOH groups to mica substrates in brine solutions. (a) AFB and (b) 1 wt% NaCl (a,b) and nanofluid solutions; (c) 0.05 wt%; (d) 0.1 wt%; (e) 0.5 wt%; (f) 1 wt% HNP. AFB is a formation brine formulation while 1 wt% NaCl is dispersant for the nanoparticles. The mean average adhesion force beneath the 16 × 16-pixel maps was based on 256 force curve measurements. Silica nanoparticle dispersions decreased the adhesion force between mica and COOH terminated tips and the nanoscale wettability changes appear to be a function of the nanofluid concentration: at higher concentration, the “pull-off” force was reduced, indicating improvement in wettability (towards water-wet) and a potential reduction in residual oil saturation.
Energies 13 04443 g010
Figure 11. Typical force-displacement curve using AFM force spectroscopy.
Energies 13 04443 g011
Figure 12. SEM micrograph of a gold-coated silicon nitride tip (in dark grey) used for AFM experiments. The area in the micrograph containing the tip apex was magnified (white box on the top right) to obtain a radius of ≈28 nm.
Energies 13 04443 g012
Figure 13. The maximum reduction in the work of adhesion from high salinity (HS) to low salinity conditions with ionic tuning (LSWOMC). (a) Maximum decrease obtained in this study for a CH3 tip on mica was 97%, compared to 81% based on JKR [57] and DMT [58] models. (b) Maximum decrease obtained in this study for a C6H5 tip on mica was 81%, compared to 55% based on JKR [57] and DMT [58] models.
Energies 13 04443 g013
Figure 14. Maximum reduction in the work of adhesion between mica and functional groups using hydrophilic silica nanofluids (HNP) in place of artificial formation brine (AFB). Maximum decrease obtained in this study for (a) -CH3 tip on mica was 99%, compared to 98% based on JKR [57] and DMT [58] models respectively, (b) for -C6H5 tip on mica it was 99%, compared to 98% based on JKR [57] and DMT [58] models, and (c) for -COOH tip on mica, it was 98%, compared to 97% based on JKR [57] and DMT [58] models.
Energies 13 04443 g014
Figure 15. Force-displacement curves as the AFM tip approaches (a,b) and is retracted (ce) from a surface. Van der Waals (VDW) forces and electrostatic repulsion (Figure 15a,b) may be sensed in the approach portion of the AFM force curve while non-electrostatic adhesion and structural force can be detected in the retraction portion (Figure 15c–e).
Energies 13 04443 g015
Table 1. Brine solutions used for low salinity experiments, salts and concentrations (in ppm).
Brine SolutionsSaltsConcentrations (ppm)Total Dissolved Solids (ppm)
Formation brine (HS)NaCl60,00072,800
CaCl210,000
KCl2650
MgCl2150
Low salinity water at 5000 ppm (LS)NaCl41205000
CaCl2690
KCl180
MgCl210
Low salinity water at 5000 ppm, without divalent cations (LSWOMC)NaCl41205000
KCl880
Table 2. Hydrophilic Silicon dioxide Nanoparticle dispersions, concentrations (wt%), pH and purity level.
NanofluidsConcentrations
(wt% in 1 wt% NaCl)
pHPurity (%)
Hydrophilic silicon dioxide nanoparticles (HNP)0.057.6699.99
0.18.6699.99
0.58.2899.99
18.5299.99
Table 3. Thiol solutions used to functionalize AFM probes, and key properties.
Non-Polar Thiol SolutionsFunctional GroupMolecular Wt. (g/gmol)Density (g/mL)Purity (%)Boiling Point (°C)
1-Undecanethiol—CH3(CH2)9CH2SHAlkyl188.370.84198103–104
2-Phenylethanethiol—C6H5CH2CH2SHAromatics138.231.03298217–218
Polar Thiol PowderFunctional GroupMolecular Wt. (g/gmol)Flash point (°C)Purity (%)Melting point (°C)
11-Mercaptoundecanoic acid—COOH(CH2)9CH2SHCarboxyl218.36>1109546–50
Table 4. Work of adhesion (aJ) in the presence of -CH3 and -C6H5 coated tips on mica immersed in brine at high and low salinity conditions.
InteractionHS (Reference)LSLSWOMCMaximum Reduction (%)Maximum Reduction in Fadh (%)
-CH3 tip on mica17.580.697%81%
-C6H5 tip on mica0.35.9 × 10−25.8 × 10−281%55%
Table 5. Work of adhesion (aJ) in the presence of -CH3, -C6H5 and -COOH coated tips on mica immersed in silica nanofluid dispersions and control solutions (AFB and 1 wt% NaCl).
InteractionAFB
(Reference)
1 wt%
NaCl
0.05 wt%
HNP
0.1 wt%
HNP
0.5 wt%
HNP
1 wt%
HNP
Maximum Reduction (%)Maximum Reduction in Fadh (%)
-CH3 tip on mica 11.24.4 × 10−23.7 × 10−25.3 × 10−39.6 × 10−299%93%
-C6H5 tip on mica 1.93.46.1 × 10−23.1 × 10−21.7 × 10−23.2 × 10−299%90%
-COOH tip on mica5.567.22.71.51.00.198%89%

