Abstract
The shift in consumer preferences for large-sized cars has increased the energy intensity (EI) of passenger cars, while growth in battery electric vehicle (BEV) sales has decreased EI in recent years in South Korea. In order to lower passenger cars’ EI, the South Korean government has implemented the Corporate Average Fuel Economy (CAFE) standards with a credit system, in which the sale of one energy-efficient car (for example, a BEV) can get multiple credits. This study analyzes CAFE standards in terms of both the EI improvement sensitivity scenarios and the degree of credits for BEVs and fuel cell electric vehicles (FCEVs) by using the Global Change Assessment Model (GCAM). In this study, passenger cars include small, medium, and large sedans, sport utility vehicles (SUVs) of internal combustion engine vehicles (ICEVs), BEVs, and FCEVs. The findings of this study are as follows: First, from the policy design perspective, a proper setting of the credit system for BEVs and FCEVs is a very important variable for automakers to achieve CAFE standards. Second, from the technology promotion perspective, active promotion of fuel efficiency improvements through CAFE standards are important since Better-EI and Best-EI scenarios are found to achieve CAFE standards even when a BEV or a FCEV receives a credit of one car sale in 2030.
1. Introduction
In 2017, the transportation sector accounted for 28.9% of the total energy consumption in South Korea [1]. Due to a heavy reliance on petroleum products, the transportation sector was the most CO2-emitting sector among all end-use sectors in the country [2]. The South Korean government has implemented various policies for reducing energy consumption and greenhouse gas emissions in the transportation sector. Since the road sector accounted for 79.7% of the total transportation energy consumption in 2017, excluding that of bunkering [3], many policies focus on the road sector in South Korea. As many countries have adopted the Corporate Average Fuel Economy (CAFE) standards, South Korea also implemented CAFE standards in 2008. However, CAFE standards only deal with a tank-to-wheels analysis which is a part of a comprehensive analysis of vehicle energy use and emissions [4], thus restricting the annual average fuel economy (km/L) or greenhouse gas (GHG) emissions (g/km) of automobiles for automakers. To facilitate automakers in selling fuel-efficient cars and satisfying CAFE standards, there is a credit system in the CAFE standards in South Korea. According to this credit system, a sale of one fuel-efficient car can earn multiple credits. For example, the sale of one battery electric vehicle (BEV) is counted as three car sales by calculating the annual average fuel efficiency performance and annual average GHG emission performance. Even the sale of one gasoline vehicle which has a fuel efficiency of more than 23.4 km/L is counted as two car sales. It is worth introducing the U.S. CAFE standards here in which automakers are able to trade credits [5]. For instance, an automaker with a CAFE performance lower than what is required can opt to buy some credits in the credit market (that is, from other automakers). This flexibility in the U.S. CAFE standards allows automakers to lower costs for achieving CAFE standards. U.S. CAFE standards are calculated based on the wheelbase (length) and footprint (area) [6], causing larger cars to be less affected than smaller cars, while the South Korea CAFE standards consider a vehicle’s curb weight.
Fuels emit GHG emissions through their life cycle—well-to-wheels process (WtW)—which can be disaggregated into well-to-tank (WtT) (extraction, refining, and transportation) and tank-to-wheels (TtW) (combustion). CAFE standards regulate only TtW emissions. The results of Khan et al.’s [7] WtW study in Pakistan show that TtW emissions accounted for 73–86% of the life cycle of GHG emissions for internal combustion vehicles (ICEVs). Song et al.’s [8] WtW study in Macau showed that for a gasoline vehicle, TtW emissions accounted for 87% of its life-cycle GHG emissions. Jang and Song’s [9] WtW study in South Korea showed that TtW emissions accounted for 82.8% and 83.4% of the life cycle GHG emissions for gasoline and diesel vehicles, respectively. Previous studies have found that TtW GHG emissions are a major contributor to life-cycle GHG emissions. Hence, this study focuses on an analysis of TtW GHG emissions and assesses CAFE standards in South Korea using the Global Change Assessment Model (GCAM) with a sensitivity analysis.
2. Current Status of Passenger Cars in South Korea
As shown in Figure 1, the total number of cars in South Korea has increased rapidly. This increase has primarily been led by sales of passenger cars. Over the last ten years, the number of passenger cars and trucks has increased by 47.2% and 13.5%, with a current total of 19.17 million passenger cars and 3.59 million trucks, while vans sales decreased by 24.9% with a total of 0.81 million vans in 2019. That is, passenger cars will be a crucial target for reducing transportation energy consumption and GHG emissions in the road sector.
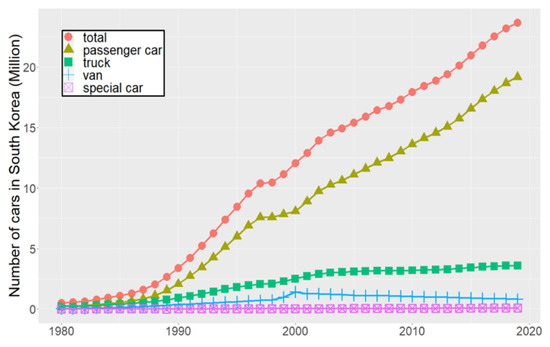
Figure 1.
Number of cars in South Korea.
Figure 2 shows historical trends of the share of passenger cars by engine size and average energy intensity (EI). During 2000–2019, the share of large-sized passenger cars (more than 2000 cc) noticeably increased from 8.6% to 28.5%, while the percentage of small-sized passenger cars (1000 cc~1600 cc) sharply decreased from 49.3% to 21.2%. Considering that the energy intensity of large-sized cars is usually higher than that of small-sized cars [10], this shift in consumer preferences for large-sized cars must have had a negative impact on the overall energy intensity of passenger cars. The increase in average energy intensity from 2.71 MJ/km to 3.37 MJ/km during 2001–2016 (Figure 2) provides empirical evidence of such an impact.
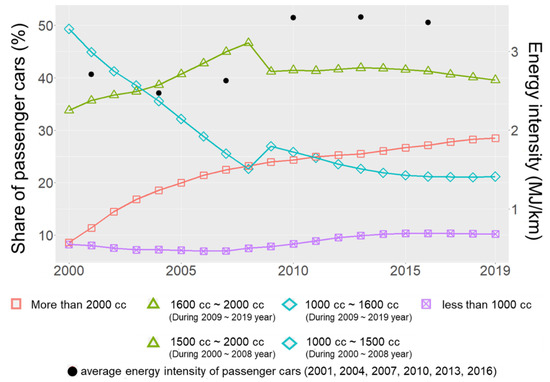
Figure 2.
Share of passenger cars by engine size and weighted average energy intensity (EI) (source: Ministry of Land, Infrastructure and Transport [11], Korea Transport Institute [12], Korea Energy Economics Institute [13]). Note: MOLIT [11] changed the statistical classification of passenger cars in 2009.
While the shift in consumer preferences for large-sized passenger cars tends to increase energy intensity, the promotion of energy-efficient cars such as BEVs and fuel cell electric vehicles (FCEVs) could lower passenger cars’ energy intensity. South Korea has implemented various policies for promoting BEVs, for example, providing a subsidy for buying a BEV. As a result of this policy, for the transportation sector, BEVs’ market share in South Korea increased from 0.05% to 1.95% during 2013–2018 (Figure 3). Even though the number of BEVs in 2018 was small, it is expected that BEVs can be a primary technology for improving energy intensity in the transportation sector in the near future.
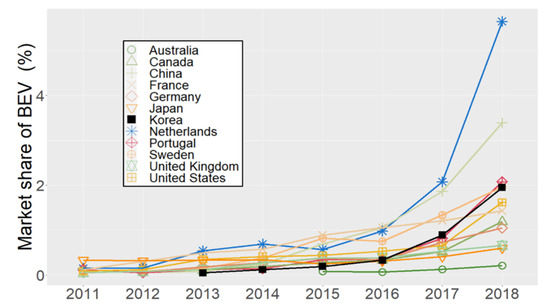
Figure 3.
Market share of battery electric vehicles (BEVs) (source: International Energy Agency [14]). Note: Market share means share of new BEV registrations as a percentage of total new passenger car registrations.
3. CAFE Standards in South Korea and the Objective of this Study
In South Korea, the implementation of CAFE standards is based on the Energy Use Rationalization Act [15]. During the initial period of the implementation of the standards (2008–2011), the target was to achieve 12.4 km/L for mini and small-sized cars and 9.6 km/L for medium and large cars by 2011. During the second period (2012–2015), no specific targets for the types of cars were given and the overall target was to achieve 17 km/L or 140 g/km by 2015. During the current period (2016–2020), the target is to achieve 24.3 km/L or 97 g/km by 2020. A new target of achieving 28.1 km/L or 84 g/km by 2030 [16] has also been announced. Under the current CAFE standards, the performance and standards of annual average fuel efficiency are calculated as [17] (see Supplementary Materials).
where
- : average fuel efficiency performance,
- : average fuel efficiency standard,
- : total sales of cars,
- : car model ,
- : sales of car model ,
- : fuel efficiency performance of car model i,
- : fuel efficiency standard of car model .
- , , and : given parameters,
- : the curb weight of car model .
Fuel efficiency standard of car model is directly given as regardless of its curb weight if the curb weight of model is less than 1070 kg and the performance and standard of annual average GHG emissions is calculated as
where is average GHG emission performance, is the average GHG emission standard, denotes the GHG emission performance of car model , and denotes the GHG emission standard of car model , which is calculated as
where is an additionally given parameter compared to the calculation of fuel efficiency standards. Until 2011, fuel efficiency was regulated by Federal Test Procedure-75 (FTP-75), a driving test known as the city driving test. Since 2012, fuel efficiency is regulated in a combined mode considering both city driving and highway driving tests. Under current CAFE standards, the sale of one BEV or one FCEV is counted as three car sales by calculating the annual average fuel efficiency performance and annual average GHG emission performance. For calculating the average GHG emission performance of BEVs or FCEVs, is counted as zero.
Figure 4 shows historical fuel efficiency and carbon emissions by passenger cars with their CAFE standards. In Figure 4, neither fuel efficiency nor carbon emissions show much improvement during 2013–2018. Considering these unfavorable historical trends in passenger cars’ fuel efficiency and carbon emissions, it would be meaningful to assess CAFE standards.
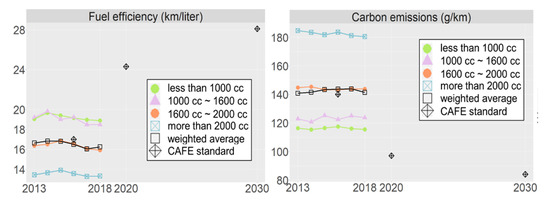
Figure 4.
Observed versus Corporate Average Fuel Economy (CAFE) standards in terms of fuel efficiency and carbon emissions in the passenger car sector (source: Korea Energy Agency [17]).
4. Methodology and Data
4.1. Global Change Assessment Model
GCAM was chosen as an integrated assessment model for creating representative concentration pathways for the Intergovernmental Panel on Climate Change (IPCC)’s Fifth Assessment Report (AR5) [18]. GCAM represents various sectors including energy systems, agriculture, land use, land use change and forestry (LULUCF), economy, water, and climate for an analysis of their interactions. GCAM runs in five-year time steps, solving for market equilibrium. At the equilibrium, supply equals demand in all markets. The transportation sector is one of the end-use sectors in GCAM’s energy system. One of the advantages of using GCAM is a well-represented hierarchical structure of the sector (for example, passenger road sector), mode (for example, small, medium, large car, and sport utility vehicle (SUV)), and technology (for example, ICEV, BEV, and FCEV) [19]. Mishra et al. [20] explain the methodological details of the GCAM transportation module. Kyle and Kim [21] and Yin et al. [22] can also be used as reference studies for an analysis of the transportation sector using GCAM.
The passenger transportation service demand at time is given as
where
- : Passenger transportation demand (passenger kilometers travelled or PKT),
- : Per capita income ($),
- : Price of transportation service ($/PKT),
- : Population,
- : Income elasticity,
- : Price elasticity,
- : Year in five-year time steps (for example, 2010 for calibration, 2015, 2020).
The price of transportation services () is calculated from the weighted average cost of sector, mode, and technology as
where
- : Sector (for example, passenger road sector, passenger rail sector),
- : Mode (for example, small car, medium car),
- : Technology (for example, ICEV, BEV),
- : Hourly wage ($/h),
- : Speed of mode (km/h),
- : A parameter for the calculation of value of time,
- : Fuel price ($/joule),
- : Energy intensity (joule/VKT),
- : Non-fuel price ($/VKT),
- : Load factor (PKT/VKT),
- : Market share.
For example, the share of technology in mode is determined as
where means share-weight as a parameter for calibration and denotes the logit exponent.
Figure 5 shows the structure of the transportation sector used in this study. The passenger car sector includes four different modes—small sedan, medium sedan, large sedan, and SUV. Each mode has three technology options—ICEV, BEV and FCEV. The input data for modeling the transportation sector are based on Jeon and Kim [23], Jeon et al. [24], Korea Energy Economics Institute [3], Korea Transport Institute [12], Korea Energy Agency [17], and Korea Transportation Safety Authority [25].
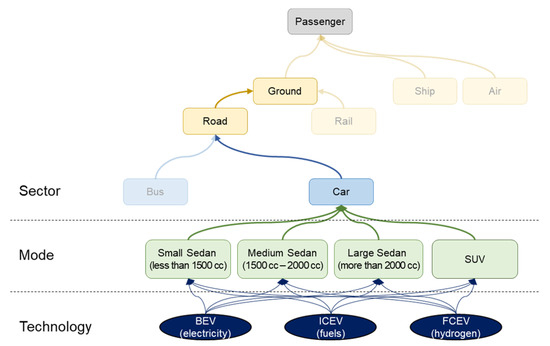
Figure 5.
Representation of the transportation sector’s structure used in this study.
4.2. Vehicle Cost Assumptions
This study uses the default data in GCAM [26] only for the composition ratio of technology costs. For the assumption of the year of cost parity (ICEV versus BEV), previous studies are referred to. Lutsey and Nicholas [27] expect that 2025 is the earliest when BEVs will reach cost parity with ICEVs. This study points out that mass production of BEVs could lower their costs, especially because of their lower battery costs. Likewise, Soulopoulos et al. [28] expect substantial cost reductions in BEVs because of improvements in battery technology and economies of scale. In their study, the cost parity of ICEVs and BEVs will be realized around 2022–2026, depending on vehicle size and a BEV’s range (for example, smaller cars will reach cost parity earlier). As shown in Figure 6, this study assumes that ICEV costs are constant over all periods, while BEV costs are assumed to reach cost parity with ICEV costs in 2025, as referred to in references [27,28,29]. Then, BEV costs will be 85% of ICEV costs from 2030.
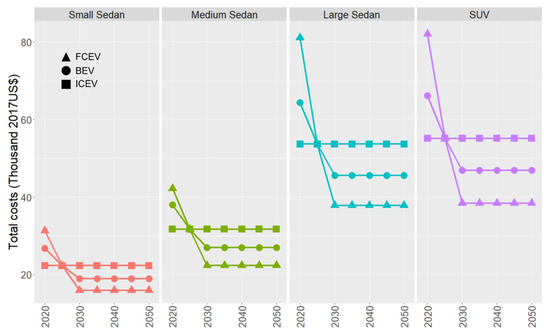
Figure 6.
Assumption of total costs (see Supplementary Materials).
We refer to Morrison et al.’s [30] research on cost competitiveness between BEVs and FCEVs for the assumption of the year of cost parity (BEV versus FCEV). In particular, it is found that a BEV with a 150-mile range will reach cost parity with a FCEV around 2025, and after 2025 a FCEV’s costs will be lower than a BEV’s costs (for more details and numerical values, please refer to the tables in the Supplementary Materials).
4.3. Scenario Description
First, this study adopts Shared Socioeconomic Pathway 2 (SSP2) for socioeconomic assumptions (see Supplementary Materials). Table 1 gives the scenario settings in terms of the relative energy intensity of cars based on the reference case. Three additional scenarios are analyzed in this study, depending on the degree of improvements in energy intensity in all passenger cars (Figure 5). The reference assumes no improvement in energy intensity in the future. The ‘Mod-EI’ scenario is based on the energy intensity improvement rate applied by Ruffini and Wei [29]. The ‘Better-EI’ and the ‘Best-EI’ scenarios have an additional 10 and 20 percentage points of energy intensity improvement compared to the ‘Mod-EI’ scenario in 2050, respectively.

Table 1.
Energy intensity improvement scenarios (unit: normalized).
Since GCAM does not account for the number of vehicles explicitly, a conversion of transportation service demand into the number of cars is required. As shown in Equation (13), the number of vehicles () can be calculated from transportation demand () multiplied by the inverse of the load factor () and the inverse of the VKT per vehicle (). The load factor () and VKT per vehicle () are assumed to refer to references [12,25], respectively, for all technologies in this study.
5. Results
Figure 7 shows the simulation results of service demand by passenger cars along with historical trends in demand in selected OECD countries in conjunction with GDP per capita. In Figure 7, the simulation results are from the reference case. It is found that the simulation results of service demand by passenger cars are consistent across all scenarios. At maximum across all scenarios and periods, the Best-EI scenario increases service demand for passenger cars 0.16% more than the reference in 2050. That is, all the scenarios do not have a tangible impact on total service demand by passenger cars. It should be noted that all the scenarios assume income elasticity of passenger transportation demand ( in Equation (7)) as 1.1 for all periods. For example, Dunkerley et al. show that the income elasticity of passenger transportation demand is in the range 0.5 to 1.4 [31].
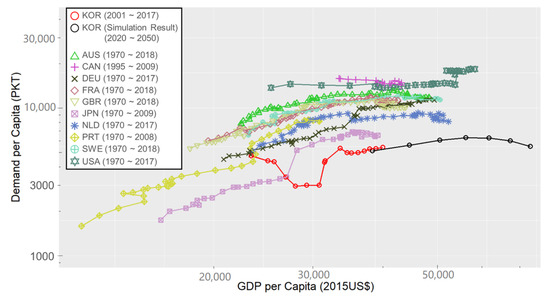
Figure 7.
GDP per capita versus demand per capita for passenger cars (source: OECD [32,33]).
Figure 8, which is used for calculating CAFE’s performance, shows the market share of ICEVs, BEVs, and FCEVs in the reference case. Since all scenarios do not have a big impact on the overall trend in market share, only the reference results are given in Figure 8. At maximum across all scenarios and periods, market share in 2050 is as follows: Reference (ICEV 9.6%; BEV 26.4%; FCEV 64.0%), Best-EI (ICEV 11.1%; BEV 22.5%; FCEV 66.4%). After the cost parity point (2025), ICEVs’ market share is expected to decline rapidly from 70.2% to 21.1% during 2025–2030. Over the same period, FCEVs’ market share will grow sharply from 9.8% to 52.1%. A slight increase of BEVs’ market share, from 20.0% to 26.8%, will also contribute to shrinking ICEVs’ market share.
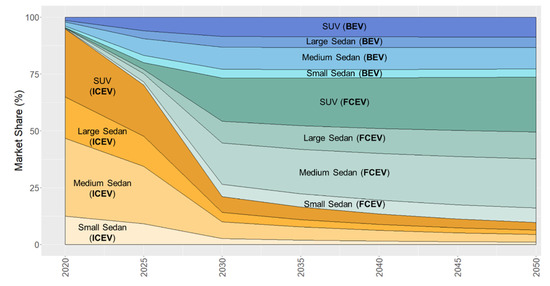
Figure 8.
Market share of ICEVs, BEVs and FCEVs; new car penetrations as a percentage of total new passenger car penetrations.
Using their mix scenario, Krause et al. [34] expect that the market share of conventional vehicles will be below 20% in 2050 in the European Union road transportation sector. Bloomberg New Energy Finance [35] foresees South Korea achieving a high level of electric vehicle adoption, representing around 60% of the market share in 2040.
The credit system in South Korea’s CAFE standards provides incentives for selling BEVs and FCEVs. However, the credit system can change depending on market circumstances. For example, a sale of one FCEV was counted as five car sales by calculating CAFE’s performance until 2017. Now, the credit for one FCEV sale has decreased to three car sales. This means the credit system could be an important variable in assessing CAFE standards. Figure 9 assesses CAFE standards in terms of the energy intensity sensitivity scenarios and also the degree of BEV and FCEV credits. In 2025, if the credit for a BEV or a FCEV sale is one car sale, only the Best-EI scenario will achieve CAFE standards. If the credit for a BEV or an FCEV sale is two car sales, only the reference will not achieve CAFE standards. If the credit for a BEV or a FCEV sale is three car sales, all scenarios will achieve CAFE standards. In 2030, if the credit for one BEV or FCEV sale is one car sale, Better-EI and Best-EI scenarios will achieve CAFE standards. However, if the credit for a BEV or a FCEV is more than two car sales, all scenarios will achieve CAFE standards.
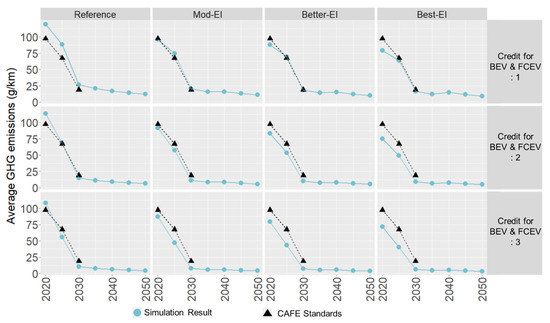
Figure 9.
Average greenhouse gas (GHG) emissions by scenarios and the degree of credit for BEVs and FCEVs.
6. Conclusions
Energy intensity is one of the important factors that influence CO2 emissions [36,37]. In this respect, this study introduced the current status of South Korea’s passenger cars from two perspectives. First, the shift in consumer preferences towards large-sized cars is deteriorating the overall energy intensity of passenger cars. Second, the increasing promotion of BEVs could improve the energy intensity of passenger cars. CAFE standards were implemented for improving the energy intensity of passenger cars in South Korea. This study assessed CAFE standards by doing a sensitivity analysis of energy intensity improvement scenarios using GCAM. In addition to an analysis of the scenarios the study also assessed the credit system of CAFE standards.
The results are summarized as follows. First, all scenarios have a negligible impact on total service demand by passenger cars and on the overall trends of market share among ICEVs, BEVs, and FCEVs. According to the CAFE performance analysis, all scenarios will achieve CAFE standards in 2030 if the current credit system of three credits for one BEV or FCEV sale or at least two credits for one BEV or FCEV sale is kept. However, in the case of no additional credits for one BEV or FCEV sale (that is, one credit for a BEV or an FCEV sale), the reference and the Mod-EI scenario will not achieve CAFE standards in 2030.
Some other findings of this study are as follows: First, from the policy design perspective, a proper setting of the credit system for BEVs and FCEVs will be a very important variable for automakers to achieve CAFE standards. Second, from the technology promotion perspective, active promotion of fuel efficiency improvements through CAFE standards is important since the Mod-EI scenario does not achieve CAFE standards when the credit for a BEV is one car sale in 2030.
The current study can be extended to include the following issues: First, various types of hybrid electric vehicles can be explicitly considered by extending this study. Second, various types of costs not included in vehicle costs, such as user costs, inconvenience costs, and time costs of refueling, can be modeled by applying this study if additional information becomes available.
Supplementary Materials
The following are available online at https://www.mdpi.com/1996-1073/13/17/4533/s1.
Author Contributions
Conceptualization, S.J. and M.R.; methodology, S.J. and M.R.; software, S.J. and M.R.; data curation, S.J.; visualization, S.J. and M.R.; writing—original draft preparation, S.J.; writing—review and editing, S.K.; and A.H.; supervision, S.K.; funding acquisition, S.K. All authors have read and agreed to the published version of the manuscript.
Funding
This work was supported by the Technology Development Program to Solve Climate Changes of the National Research Foundation (NRF) funded by the Ministry of Science, ICT and Future Planning (NRF-2017M1A2A2081253), and the Korea Ministry of Environment (MOE) as Graduate School specialized in Climate Change.
Acknowledgments
The authors are indebted to Jaeick Oh for his valuable comments and advice. Two anonymous referees’ comments and suggestions on an earlier version of this paper are gratefully acknowledged.
Conflicts of Interest
The authors declare no conflict of interest.
References
- International Energy Agency (IEA). World Energy Balances. 2019. Available online: https://www.iea.org/subscribe-to-data-services/world-energy-balances-and-statistics (accessed on 23 June 2020).
- International Energy Agency (IEA). CO2 Emissions from Fuel Combustion. Available online: https://www.iea.org/subscribe-to-data-services/co2-emissions-statistics (accessed on 23 June 2020).
- Korea Energy Economics Institute (KEEI). 2018 Yearbook of Energy Statistics; Korea Energy Economics Institute: Ulsan, Korea, 2018; Available online: http://www.keei.re.kr/keei/download/YES2018.pdf (accessed on 18 February 2020).
- Curran, S.J.; Wagner, R.M.; Graves, R.L.; Keller, M.; Green, J.B., Jr. Well-to-wheel analysis of direct and indirect use of natural gas in passenger vehicles. Energy 2014, 75, 194–203. [Google Scholar] [CrossRef]
- Durrmeyer, I.; Samano, M. To rebate or not to rebate: Fuel economy standards versus feebates. Econ. J. 2018, 128, 3076–3116. [Google Scholar] [CrossRef]
- National Highway Traffic Safety Administration (NHTSA). Corporate Average Fuel Economy. Available online: https://www.nhtsa.gov/laws-regulations/corporate-average-fuel-economy (accessed on 19 July 2019).
- Khan, M.I.; Shahrestani, M.; Hayat, T.; Shakoor, A.; Vahdati, M. Life cycle (well-to-wheel) energy and environmental assessment of natural gas as transportation fuel in Pakistan. Appl. Energy 2019, 242, 1738–1752. [Google Scholar] [CrossRef]
- Song, Q.; Wu, Y.; Li, J.; Wang, Z.; Yu, D.; Duan, H. Well-to-wheel GHG emissions and mitigation potential from light-duty vehicles in Macau. Int. J. Life Cycle Assess. 2018, 23, 1916–1927. [Google Scholar] [CrossRef]
- Jang, J.J.; Song, H.H. Well-to-wheel analysis on greenhouse gas emission and energy use with petroleum-based fuels in Korea: Gasoline and diesel. Int. J. Life Cycle Assess. 2015, 20, 1102–1116. [Google Scholar] [CrossRef]
- Yanni, T.; Paul, J. Impact and sensitivity of vehicle design parameters on fuel economy estimates. No. 2010-01-0734. SAE Tech. Pap. 2010. [Google Scholar] [CrossRef]
- Ministry of Land, Infrastructure and Transport (MOLIT). Total Registered Motor Vehicles. Available online: https://stat.molit.go.kr/portal/main/portalMain.do (accessed on 24 June 2020).
- Korea Transport Institute (KOTI). Korea Transportation Statistics (Various Years), Korea Transport Institute. Available online: https://www.ktdb.go.kr/www/index.do (accessed on 23 June 2020).
- Korea Energy Economics Institute (KEEI). Energy Consumption Survey (Various Years), Korea Energy Economics Institute. Available online: http://www.kesis.net/sub/sub_0002.jsp?M_MENU_ID=M_M_002&S_MENU_ID=S_M_010 (accessed on 24 June 2020).
- International Energy Agency (IEA). Global EV Outlook 2019; International Energy Agency: Paris, France, 2019; Available online: https://webstore.iea.org/global-ev-outlook-2019 (accessed on 24 June 2020).
- International Energy Agency (IEA). Energy Use Rationalization Act. Available online: https://www.iea.org/policies/392-energy-use-rationalization-act (accessed on 28 August 2020).
- Ministry of Trade, Industry and Energy. Energy Efficiency Innovation Strategy, South Korea. 2019. Available online: http://www.motie.go.kr/motie/ne/presse/press2/bbs/bbsView.do?bbs_cd_n=81&bbs_seq_n=161993 (accessed on 28 June 2020).
- Korea Energy Agency (KEA). Vehicle Fuel Economy and CO2 Emissions: Data and Analyses (Various Years), Korea Energy Agency. Available online: http://bpms.kemco.or.kr/transport_2012/pds/month_pds.aspx (accessed on 24 June 2020).
- Van Vuuren, D.P.; Edmonds, J.; Kainuma, M.; Riahi, K.; Thomson, A.; Hibbard, K.; Hurtt, G.; Kram, T.; Krey, V.; Lamarque, J.-F.; et al. The representative concentration pathways: An overview. Clim. Chang. 2011, 109, 5. [Google Scholar] [CrossRef]
- Kim, S.H.; Edmonds, J.; Lurz, J.; Smith, S.J.; Wise, M. The ObjECTS framework for integrated assessment: Hybrid modeling of transportation. Energy J. 2006. [Google Scholar] [CrossRef]
- Mishra, G.S.; Kyle, P.; Teter, J.; Morrison, G.M.; Kim, S.; Yeh, S. Transportation module of Global Change Assessment Model (GCAM): Model Documentation; Institute of Transportation Studies, University of California: Davis, CA, USA, 2013; Available online: https://trid.trb.org/view.aspx?id=1262949 (accessed on 28 August 2020).
- Kyle, P.; Kim, S.H. Long-term implications of alternative light-duty vehicle technologies for global greenhouse gas emissions and primary energy demands. Energy Policy 2011, 39, 3012–3024. [Google Scholar] [CrossRef]
- Yin, X.; Chen, W.; Eom, J.; Clarke, L.E.; Kim, S.H.; Patel, P.L.; Yu, S.; Kyle, G.P. China’s transportation energy consumption and CO2 emissions from a global perspective. Energy Policy 2015, 82, 233–248. [Google Scholar] [CrossRef]
- Jeon, S.; Kim, S. Modeling Domestic Transportation Sector Using Global Change Assessment Model. J. Korean Soc. Transp. 2017, 35, 91–104. [Google Scholar] [CrossRef][Green Version]
- Jeon, S.; Roh, M.; Oh, J.; Kim, S. Development of an Integrated Assessment Model at Provincial Level: GCAM-Korea. Energies 2020, 13, 2565. [Google Scholar] [CrossRef]
- Korea Transportation Safety Authority (TS). Automobile Mileage Analysis (Various Years), Korea Transportation Safety Authority. Available online: https://www.kotems.or.kr/app/kotems/forward?pageUrl=/kotems/ptl/bbs/KotemsPtlBbsStatsLs&topmenu1=06&topmenu2=03&topmenu3=03 (accessed on 25 June 2020).
- Joint Global Change Research Institute (JGCRI). GCAM v5.1 Documentation: Global Change Assessment Model (GCAM). Available online: http://jgcri.github.io/gcam-doc (accessed on 14 April 2020).
- Lutsey, N.; Nicholas, M. Update on Electric Vehicle Costs in the United States through 2030. Int. Counc. Clean Transp. 2019, 1–12. Available online: https://theicct.org/sites/default/files/publications/EV_cost_2020_2030_20190401.pdf (accessed on 19 July 2020).
- Soulopoulos, N. When will electric vehicles be cheaper than conventional vehicles. Bloom. New Energy Financ. 2017, 12. Available online: https://www.blogmotori.com/wp-content/uploads/2017/07/EV-Price-Parity-Report_BlogMotori_COM_MobilitaSostenibile_IT.pdf (accessed on 19 July 2020).
- Ruffini, E.; Wei, M. Future costs of fuel cell electric vehicles in California using a learning rate approach. Energy 2018, 150, 329–341. [Google Scholar] [CrossRef]
- Morrison, G.; Stevens, J.; Joseck, F. Relative economic competitiveness of light-duty battery electric and fuel cell electric vehicles. Transp. Res. Part C Emerg. Technol. 2018, 87, 183–196. [Google Scholar] [CrossRef]
- Dunkerley, F.; Rohr, C.; Daly, A. Road Traffic Demand Elasticities: A Rapid Evidence Assessment. 2014. Available online: https://www.rand.org/pubs/research_reports/RR888.html (accessed on 28 June 2020).
- Organization for Economic Co-operation and Development (OECD). Road Passenger Transport by Passenger Cars. Available online: https://data.oecd.org/transport/passenger-transport.htm (accessed on 27 June 2020).
- Organization for Economic Co-Operation and Development (OECD). Level of GDP per Capita and Productivity. Available online: https://stats.oecd.org/Index.aspx?DataSetCode=PDB_LV (accessed on 27 June 2020).
- Krause, J.; Thiel, C.; Tsokolis, D.; Samaras, Z.; Rota, C.; Ward, A.; Prenninger, P.; Coosemans, T.; Neugebauer, S.; Verhoeve, W. EU road vehicle energy consumption and CO2 emissions by 2050–Expert-based scenarios. Energy Policy 2020, 138, 111224. [Google Scholar] [CrossRef]
- Bloomberg New Energy Finance (BNEF). Electric Vehicle Outlook 2020. Bloomberg Finance Limited Partnership. 2020. Available online: https://about.bnef.com/electric-vehicle-outlook/ (accessed on 20 July 2020).
- Parker, S.; Bhatti, M.I. Dynamics and drivers of per capita CO2 emissions in Asia. Energy Econ. 2020, 104798. [Google Scholar] [CrossRef]
- World Bank. CO2 Emissions (Metric Tons per Capita). Available online: https://data.worldbank.org/indicator/EN.ATM.CO2E.PC (accessed on 25 August 2020).


© 2020 by the authors. Licensee MDPI, Basel, Switzerland. This article is an open access article distributed under the terms and conditions of the Creative Commons Attribution (CC BY) license (http://creativecommons.org/licenses/by/4.0/).