Article

Modelling of Distributed Resource Aggregation for the Provision of Ancillary Services

Institute of Electrical Power Engineering, Lodz University of Technology, Stefanowskiego Str. 18/22, PL 90-924 Lodz, Poland
*
Author to whom correspondence should be addressed.
Energies 2020, 13(18), 4598; https://doi.org/10.3390/en13184598
Submission received: 26 July 2020 / Revised: 30 August 2020 / Accepted: 1 September 2020 / Published: 4 September 2020
(This article belongs to the Special Issue Power System Simulation, Control and Optimization)

Abstract

:
Nowadays, ancillary services (ASs) are usually provided by large power generating units located in transmission networks, while smaller assets connected to distribution systems remain passive. It is expected that active distribution systems will start to play an important role due to numerous issues related to power system operation caused mainly by developing renewable generation and restrictions imposed on conventional power generating units by climate policies. The future development of the power system management will also lead to the establishment of new market agents such as distributed resource aggregators (DRAs). The article presents the concept of the DRA as part of an active distribution system enabling small resources to participate in wholesale markets, provide ASs and indicates the functions of the DRA coordinator in the modern power system. The proposed method of the DRA structure modelling with the use of the mixed-integer linear programming (MILP) is aimed at evaluating the optimal operation pattern of participating resources, the desired shape of the load profile at the point of common coupling (PCC) and the AS provision. The performed simulations of the DRA’s operation show that various types of aggregated resources located in distribution networks are able to provide different services effectively to support the power system in terms of load–generation balancing and allow for further development of renewables.

1. Introduction

A structure of the current power systems is based on active transmission systems where centrally dispatched generating units (CDGUs) provide different services such as balancing, frequency regulation and operating reserves for maintaining proper power system operation. However, the existing distribution systems from the point of view of the transmission system operator (TSO) still remain passive with fixed demand profiles—the left side of Figure 1.
Distributed energy resources (DERs) located in distribution networks are developing rapidly at present. Many of them, such as gas and biogas power plants and energy storages (ESs), might be controllable in order to perform services similar to those provided by CDGUs. Furthermore, active loads (ALs) and curtailment of renewable energy resources (RESs) can be employed to support the management of the power system.
The above-mentioned entities by being financially attractive or forced by legal obligation could be aggregated into the distributed resource aggregator (DRA) structure to be controlled by the DRA coordinator for the provision of ancillary services (ASs). The scope of those potentially provided ASs should be therefore identified for a given DRA.
The small size of distributed assets is a problem causing a lack of ability to participate in wholesale markets such as balancing markets and AS markets; moreover, legal obligations constitute a barrier for some entities. Therefore, an additional agent, that is, an aggregator, is required [1,2,3,4]. Figure 1 depicts the DRA coordinator as an entity responsible for distributed asset coordination and control enabling active participation of DERs in the management of power system operation. Nowadays, distribution system operators (DSOs) have passive operation profiles which in the near future could be modified by the DRA operation depending on the current system needs to provide different services—an active demand profile.
The concept of active distribution networks is widely discussed in the literature. For example, [5,6,7,8] propose the use of active distribution for the provision of services such as balancing and congestion management. Possible relations and details of cooperation between different markets and technical entities, including aggregators, are indicated, thus forming a good foundation for future research in the field of active distribution networks.
Other publications state that the development of power systems and increasing level of energy source diversification are mainly driven by the growth of renewables which are installed mostly in the distribution networks; hence, the electrical energy supply’s security and the proper power system operation is harder to be maintained [9,10]. In order to keep the balance between demand and generation, the corresponding level of the power system’s flexibility is required [11]. Subsequently, to ensure this appropriate level of flexibility, it is necessary to coordinate the operation of distributed resources [12]. Such an operation, provided by aggregators located inside distribution networks, creates an opportunity to reinforce the power system’s ability to react to the rapid changes of the demand and supply [13,14]. In order to obtain the desired results, next to DERs and ESSs, the demand-side coordination was employed to provide chosen ASs at the point of common coupling (PCC). The provided ASs cover i.e., load profile shaping, load levelling and congestion management [15,16,17,18,19].
The possibility for the participation of distributed resources coordinated by an aggregator in competitive energy markets and their positive impact on the power system’s operation were also considered. Small ESSs for household application, due to their growing number, can be aggregated for long-term cooperation in order to maximize aggregators’ profit and the system welfare [3]. Another study describes demand-side resources utilized for load scheduling to minimize the total cost of electricity procurement [20]. The high potential of aggregated flexibility, especially loads located in the residential sector, should be developed as a replacement for fossil fuel power plants’ contribution in the continuous demand and supply balancing [4,21]. The need for peak-to-average demand reduction is addressed in [22], where the authors by the use of demand-side response reduce electricity charges for end-users and improve the shape of the load profile.
Nevertheless, the majority of the above-presented studies contain an optimized aggregation of one type of a distributed resource, mainly the demand-side entities and storages. It should be underlined that in modern distribution networks, different types of resources, including small generators and renewables, are installed and may be properly utilized—not only for cost reduction but also for AS provision. The described articles focused mostly on market aspects of the aggregation, analyzing the offering strategies and the competitiveness between different agents modelled in particular by game theories.
In order to propose remedies for the challenges presented, the purpose of this article is to introduce a new DRA structure and its management as a development of formerly proposed concepts of the active distribution system and aggregation approaches. The functions of the DRA coordinator in the modern power system and relations with other entities are also defined. The novel methodology proposes the modelling of the DRA structure with the use of the mixed-integer linear programming (MILP) which aims at the evaluation of the optimal operation pattern of different types of participating resources, the desired shape of the load profile at the PCC and AS provision. The performed research examines whether the proposed solution could be a step toward improvements in power system operation, and by the use of its flexibility, whether it can facilitate load-generation balancing and maintain a system’s proper operation during continuous RES development.
The article is organized as follows: The second section describes services which can be provided by assets located in distribution networks. Section 3 presents a proposed structure of a DRA and a way to implement its operation into the MILP optimization model. Section 4 shows the main assumptions. Section 5 discusses the results of simulations as examples of ASs provided by the DRA, while the last section concludes the article.

2. Background: Ancillary Services Portfolio

The AS portfolio comprises services which may be provided by the aggregated resources, taking into account their distinctive features and the composition of the DRA structure. These services are described thoroughly below.

2.1. Peak Shaving and Valley Filling

Peak shaving and valley filling, also known as load levelling, is an AS comprising increased consumption of electrical energy during periods of low demand, storing it and then returning it to the grid when high demand occurs. During the later periods, the energy injected back to the power system reduces peaks of demand to be covered by conventional power plants and therefore decreases overall system operation costs, as production from more expensive peak-generating power units may be limited. Therefore, it is clear that load levelling can be provided mainly by ESSs but also by ALs, as consumption, during peak demand, can be limited or shifted to lower consumption periods [23].
Load levelling may be desirable not only because the reduction of overall system operation costs but also due to an opportunity to limit investments in new power generating units and grid upgrades (load levelling can extend the set of tools for the congestion management) [5]. Units providing this type of services could be additionally remunerated; however, shifting from low demand to high demand periods is inherent in price arbitrage which generates a basic income. A visualization of peak shaving and valley filling services is presented in Figure 2.

2.2. Load Profile Smoothing

Due to the growing share of RESs and their variable generation, the power system operation can be disturbed. It could happen especially for power systems with a significant share of renewables where difficulties in the balancing of demand and supply occur. Therefore, smoothing, which embraces reduction of rapid changes in the load profile, is another example of the AS that can be provided by the DRAs to assist the power system operation [24].
At the PCC, the load profile can be shaped by controlled operation of active resources incorporated into the DRA structure. The load profile smoothing could improve balancing, currently provided by the transmission system connected CDGUs because the smoothed profile is characterized by a smaller variability and milder up and down ramps. A visualization of load profile smoothing is presented in Figure 3.

2.3. Balancing and Reserves

Electrical energy consumption must be equal to its generation at all times. The frequency of the grid is the best indicator of this balance. DERs managed by an aggregator are able to support the maintenance of the frequency within acceptable limits by quickly responding to its deviations. Such services are currently provided mainly by large CDGUs located in transmission networks, but properly aggregated structures may also be present on the balancing markets [25].
The balancing services may be also provided by compensation of balance deviations inside an aggregated structure in order to obtain a determined generation/load profile for the whole cluster. Some resources may be able to respond to other entities’ deviations caused, for example, by variable weather conditions or rapidly changing demand.
The reserves are required to maintain the power system’s balance in both the short and the long term. In this context, DRAs may additionally share a part of its capacity to cover TSOs’ needs and be remunerated for the willingness to provide reserve services and for their activation.

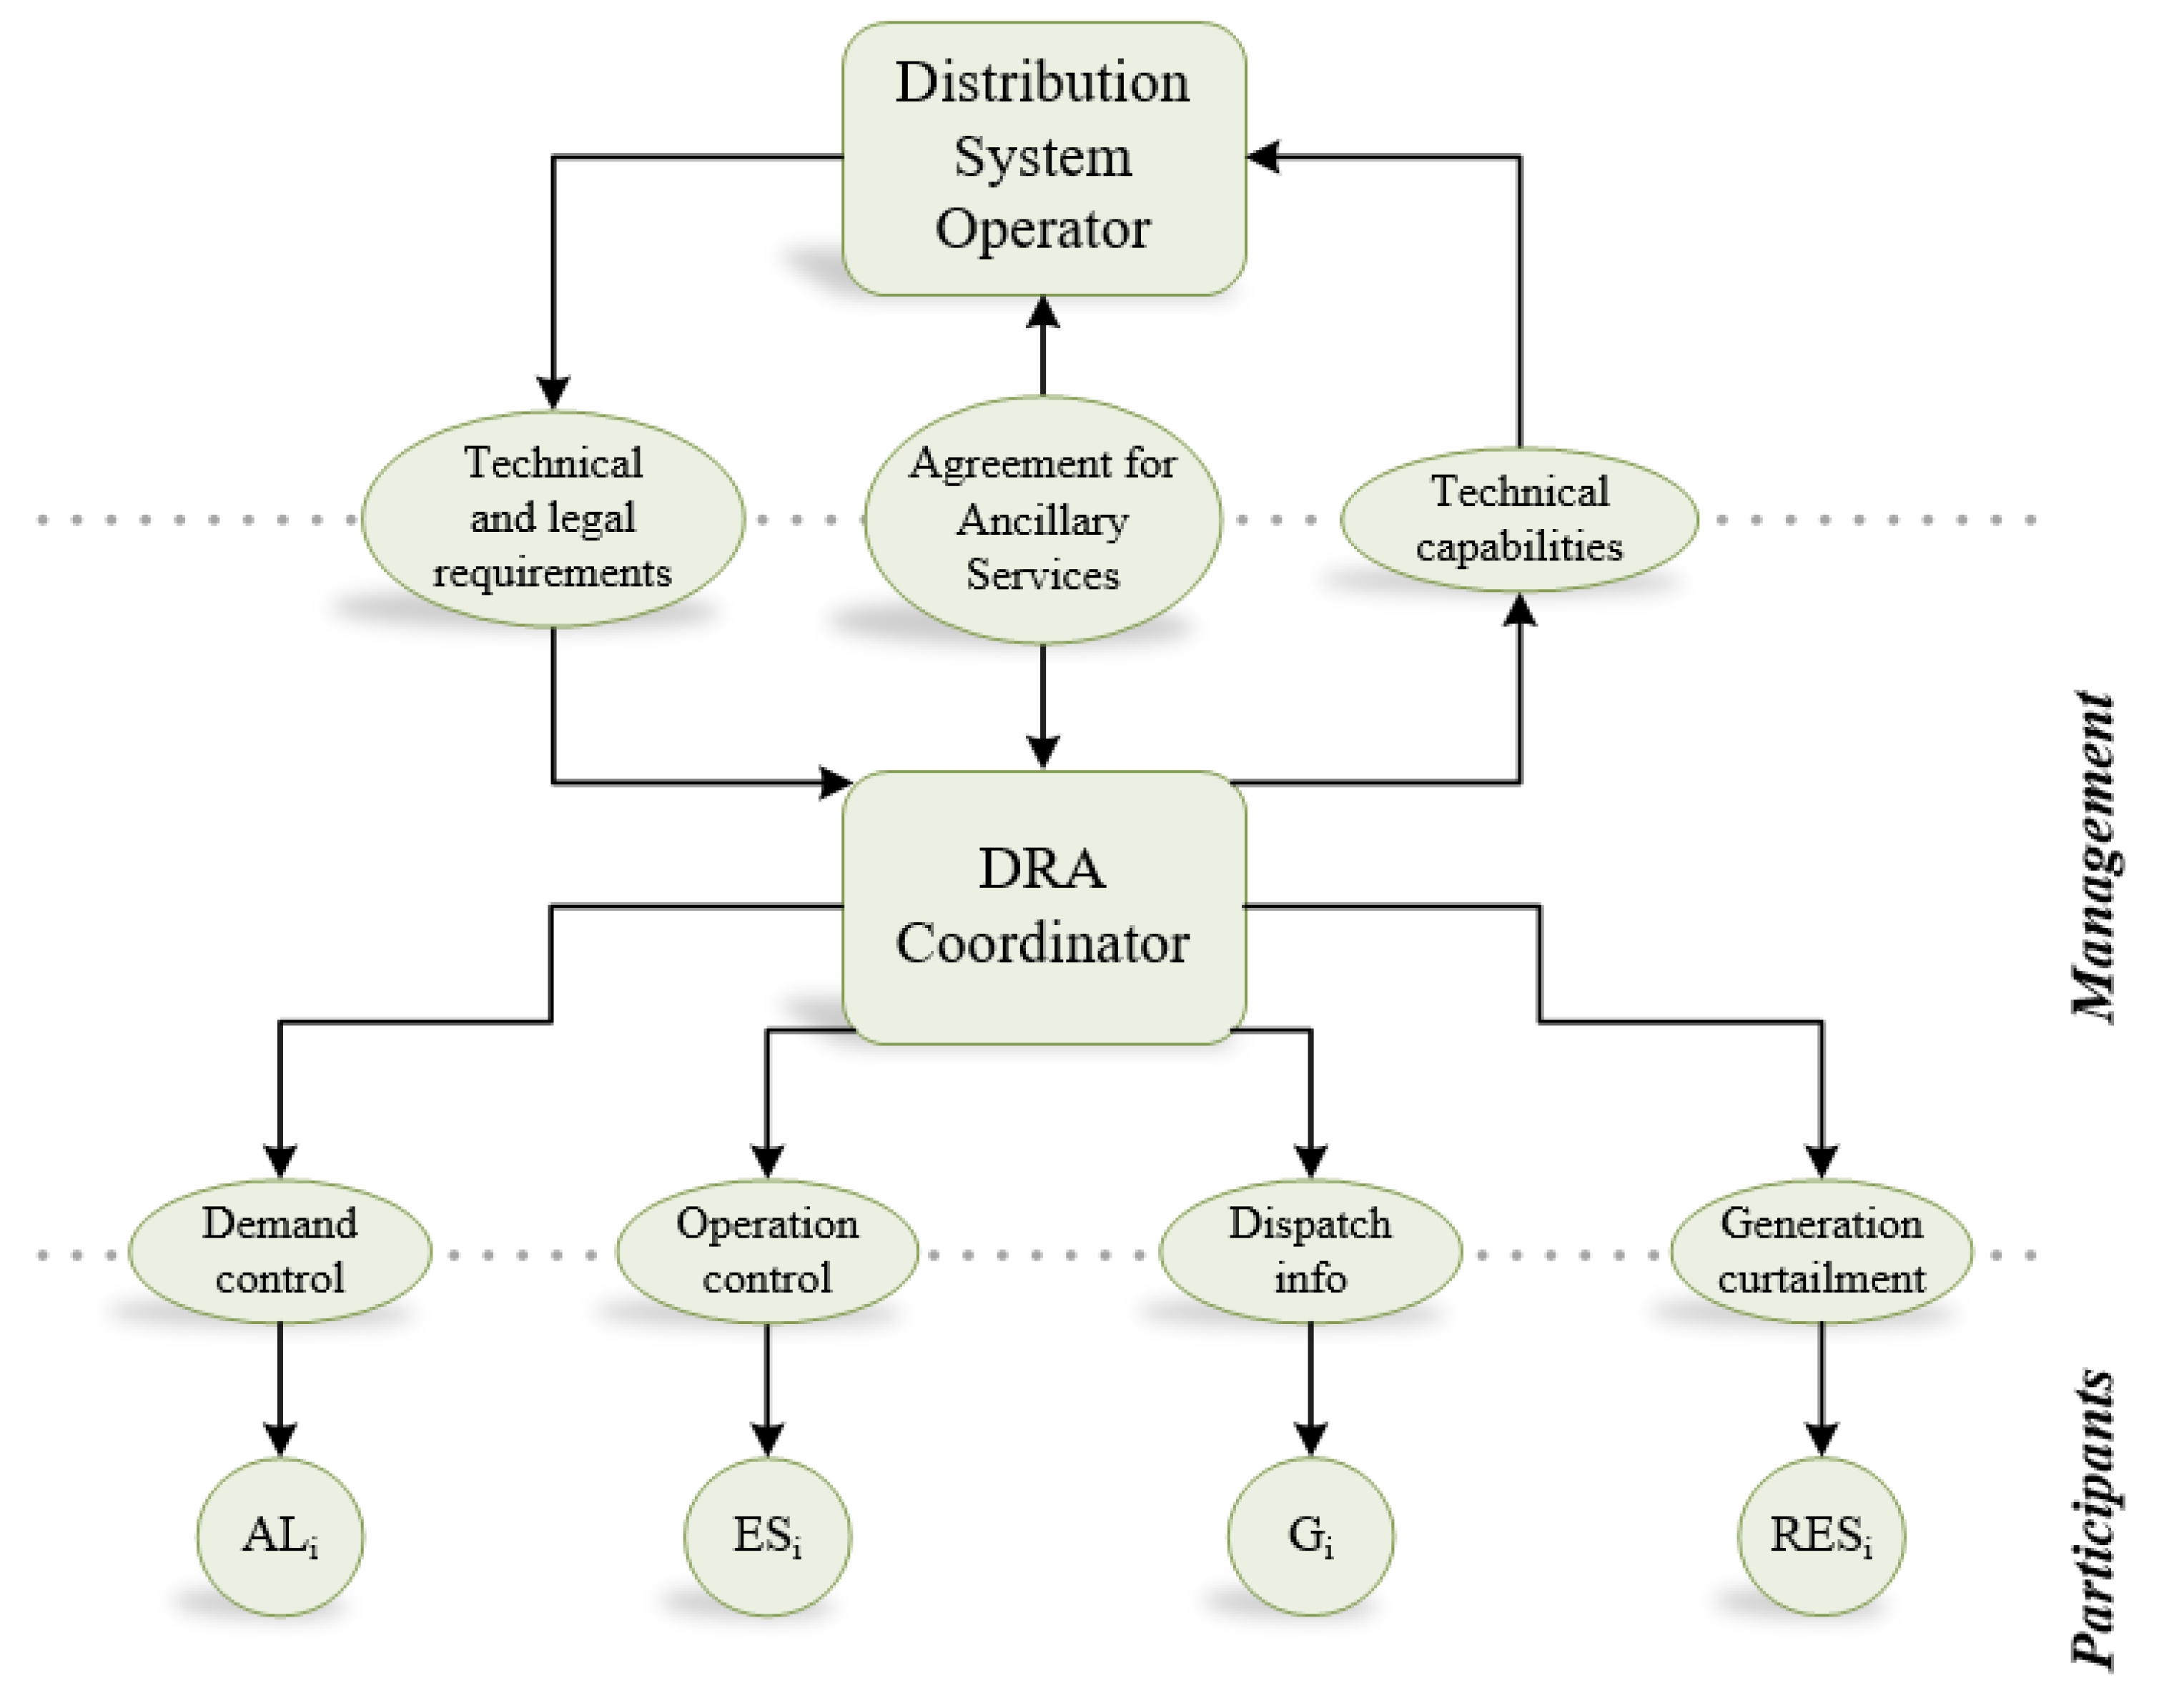
3. Structure of the Distributed Resource Aggregator

3.1. Roles and Structure of an Aggregator

The main roles of the DRA coordinator are to select suitable assets located in distribution networks and to group them into a cluster in order to strengthen the significance of resources distributed on a small scale and thereby allow them to participate in wholesale markets, such as the balancing and AS markets. The operation of the aggregated assets is managed by the DRA coordinator in order to optimize the overall profit of the whole cluster. The structure of the DRA comprises assets located in the distribution level: passive loads, ALs, ESs, controllable and noncontrollable power generating resources. Figure 4 presents the proposed structure of the DRA and its cooperation with other entities located in the distribution level.
New technical and legal requirements should be introduced to allow the DRA to operate in the power system. These requirements should consist of basic technical parameters (power, response time, regulatory range, etc.) and legal conditions relating to inter alia, resource ownership, aggregation areas and financial settlements. After defining the aggregated structure, the DRA coordinator submits its technical capabilities to the DSO and makes agreements for the provision of the ASs due to the power system conditions and demands.
The DRA coordinator is responsible for supervision, coordination and control of the operation of resources. The coordinator has the ability to select suitable resources and create an optimal structure oriented towards the desired operation pattern which aims at a maximum profit while assisting the power system’s operator.
In order to improve the power system flexibility, the DRA operation may prevent the negative impact of intermittent RES generation (left side of Figure 5) and stabilize operation of base load and combined heat and power (CHP) generation units (right side of Figure 5). The DRA can adjust output power from PMIN to PMAX to provide ASs and indirectly assist the TSO in the balancing of demand and supply.

3.2. Modelling of Distributed Resources

In the presented concept, four groups of distributed assets were modelled and can be incorporated into the aggregator’s structure: intermittent RESs, dispatchable generating units, ESs, ALs. The proposed model is based on mixed integer linear programming (MILP). For further simulation purposes, 15 min intervals of a 24 h time span were assumed.

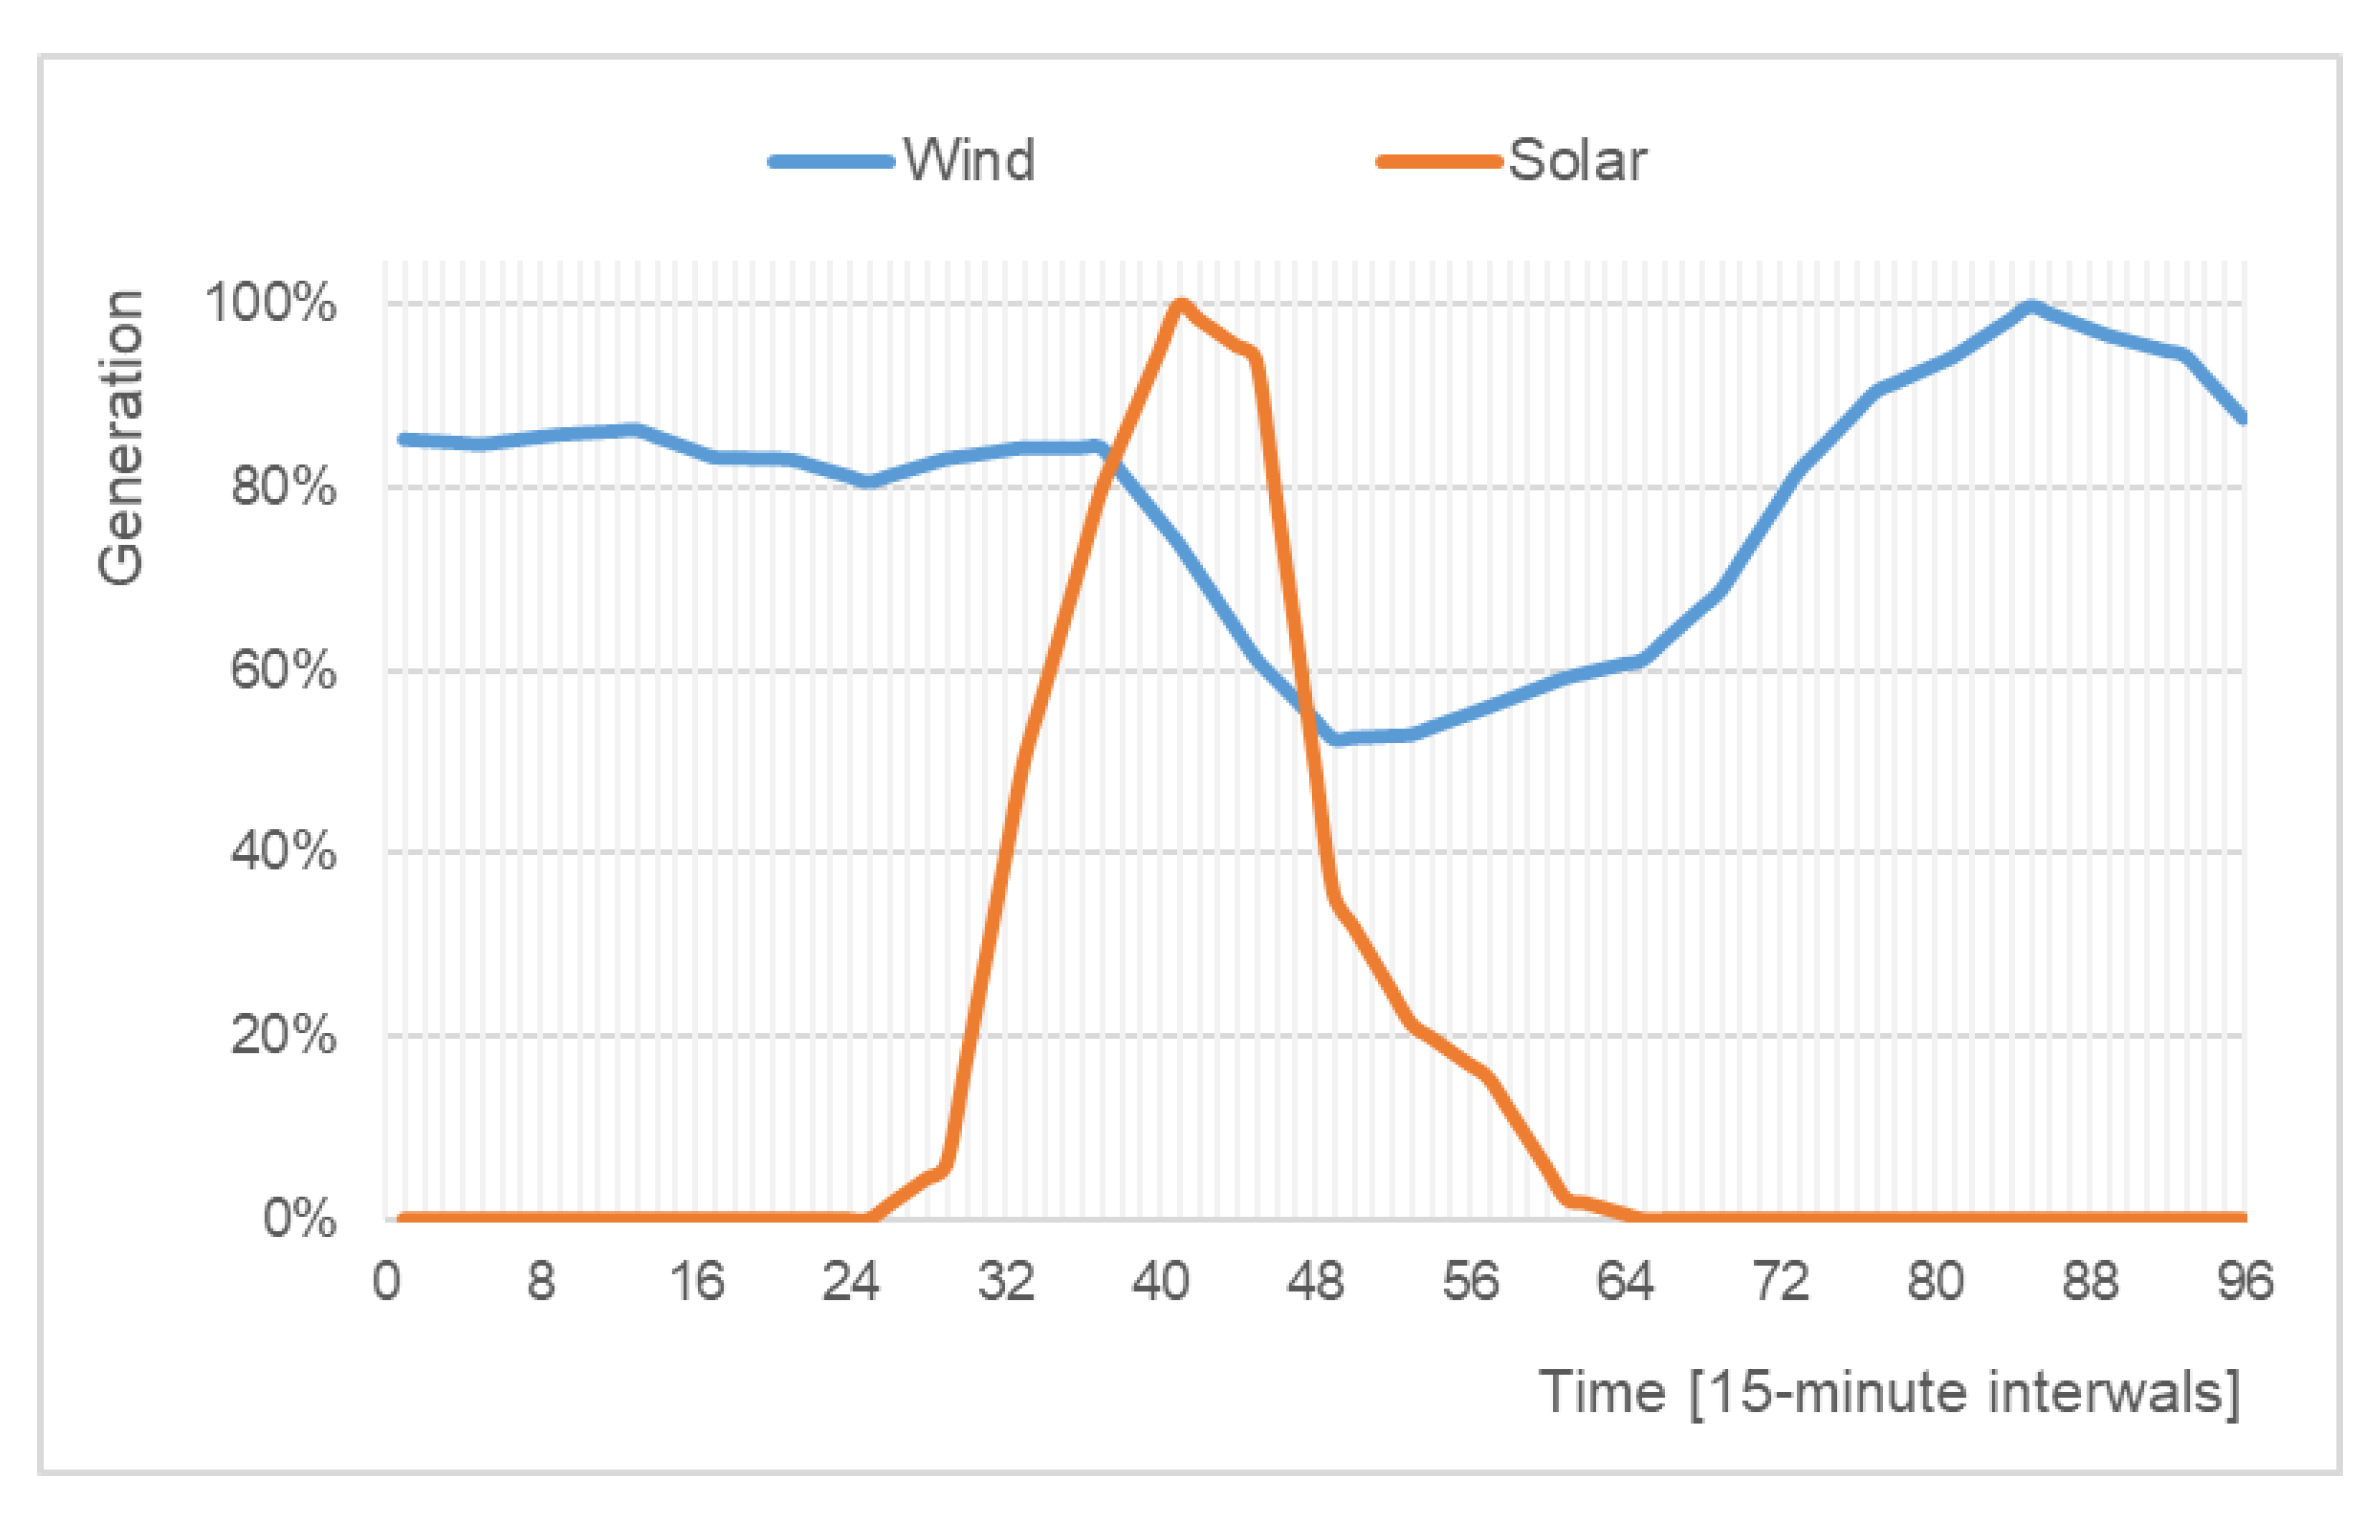
3.2.1. Renewable Energy Resources

RESs represent a group of noncontrollable generating units whose production is dependent only on weather conditions. For the purpose of further simulations, wind and solar generators were implemented in the simulation model. Figure 6 depicts adopted generation profiles for those RESs.
The possibility of RES generation curtailment was also assumed, and is expressed by Equation (1).
r R ,   t T : P min r P c u r   r t P r t

3.2.2. Dispatchable Generating Units

The electricity production from units like gas, biogas, biomass, etc., is dependent on the amount of provided fuel; therefore, their output power can be controlled within their operational limits (Equation (2)).
g G ,   t T : P min g P g t P max g

3.2.3. Energy Storages

The adopted model of energy storage allows for the implementation of any type of ESS by defining appropriate parameters. Equation (3) reflects capacity limits.
s S ,   t T : E min s E s t E max s
A given ESS charges and discharges taking into account actual capacity and storage efficiency—Equation (4).
s S ,   t 2 ,   ,   96 : E s t = E s t 1 + E imp s t · η s E exp s t η s
Operational constraints given by Equations (5)–(7) contain binary variables to ensure switching between charging, discharging and idle mode of a given ESS.
s S ,   t T : P i m p   s t s i m p   s t · P max s
s S ,   t T : P e x p   s t s exp s t · P max s
s S ,   t T :   s i m p   s t + s e x p   s t 1

3.2.4. Active Loads

Due to a significant impact on the network’s load profile, heavy industrial loads can also be a member of the DRA. Optimized operation of these resources allows them to provide a load levelling service. The peak demand can be shifted to the valley within the set limits (Equation (8)). The assumed constraint (Equation (9)) states that the sum of energy imported by the active load (AL) during the day period has to be equal to the daily electricity consumption, while the load remains passive.
a A ,   t T : 0.8 · E L   a t   E A L   a t 1.1 · E L   a t
a A : t = 1 T E A L   a t = t = 1 T E L   a t

3.3. Optimization

The aim of the proposed model is the maximization of the aggregator’s total profit which consists of income obtained from the operation of renewable resources (wind and solar), DERs, ALs and ESSs, all managed by the aggregator. The total income is divided among the DRA participants due to their contribution.
For the purposes of the simulations, only the market price of electrical energy was taken under consideration. Income resulting from RES subsidies were neglected, as they are the topic of separate research.
The resulting objective function is given by Equation (10).
o b j = m a x { t = 1 T [ r = 1 R ( E R E S   r t · p t ) + g = 1 G ( E g t · p t ) a = 1 A ( E A L   a t · p t ) + s = 1 S ( ( E exp s t · p t ) ( E i m p   s t · p t ) ) ] }
The provision of the ASs is enforced by the DRA through proper constraints. The proposed model comprises three types of services: load profile shaping, load levelling and a combined service (simultaneous smoothing and load levelling). Changes in operational points for the provision of ASs may be formulated by the DRA coordinator as an offer submitted to the market. Previously described balancing and reserves remain outside the scope of this article.
Both Equations (11) and (12) describe constraints that correspond to maximum ramps (load profile smoothing) when Equation (13) results in the provision of peak shaving and valley filling (load levelling service).
Δ P C C % = P C C t 1 P C C t P C C max r e f · 100 %
P C C % P C C d e s % P C C %
P C C d e s   m i n P C C t P C C d e s   m a x
All parameters with the indication des have to be treated as values desired by the system operator as a part of the provision of ASs.
The demand change at the PCC is given by Equation (14) and described as the percentage ratio of the difference between the maximum and the minimum load regarding the maximum load during the simulations’ time horizon.
D e m = P C C m a x P C C m i n P C C m a x · 100 %

4. Simulations

4.1. Assumptions

4.1.1. Parameters of the Simulation Model

Table 1 and Table 2 present the assumed parameters of the simulation model expressed as a percentage of the peak demand.

4.1.2. Passive Load Patterns

Beyond the DRA participants, the passive loads are also located inside the modelled distribution network. The information of their demand is gathered by the DSO in order to set the desired operation points for the DRA to shape the profile at the PCC. The presented concept assumed three types of passive loads: commercial, residential and industrial, which were modelled by the fixed demand profiles presented in Figure 7.

4.1.3. Market Price Pattern

The market price of electricity is implemented as the pattern presented in Figure 8. The assumed profile is based on real market data and is treated as predictions of market price used by the aggregator.

4.2. Scenarios

In order to examine the impact of the DRA on the operation of the active distribution system, seven simulation scenarios were proposed (Table 3). Each scenario presents different services provided by the maximum utilization of the resources coordinated by the DRA depending on various assumptions.

5. Results and Discussion

The reference scenario assumes a lack of influence of the DRA on the operation of subordinate resources such as RESs, DERs, ESs and ALs. All the resources aim for maximum profit without performing any ASs. The simulation output describes power flow at the PCC formed by all entities located inside the distribution network and is presented as PCC_%_ref in Figure 9. The results of this scenario form a basis for comparisons with further scenarios.
The obtained value resulting from the objective function in the reference scenario is denoted as 100% for the purpose of future comparisons. The maximum percentage change in the power flow at the PCC between two adjacent hours is 19%/h when the demand change (Equation (14)) stands at 46.7%. The shape of the profile results from the assumptions presented earlier in Table 1 and Table 2 and from the uncontrolled operation of distributed resources.
The shapes of the load profiles at the PCC for Scenarios 1–6 compared with reference simulation are presented in Figure 10.
The presented results are characterized by the different impact on the shape of the load profile at the PCC. The first column of Figure 10 (Scenarios 1, 3 and 5) corresponds to services provided without renewable curtailment, while in the second column (Scenarios 2, 4 and 6), curtailment is allowed. PCC_%_ref denotes reference load profile, while PCC_%_S1-6 correspond to modified profiles according to the simulation scenarios.
In Scenarios 1, 3 and 5, ASs are provided mainly through ESs, ALs and non-renewable DERs; hence, the modifications of the load profile are visibly lower than in Scenarios 2, 4 and 6 where the services are provided also by wind and solar renewables. The analyzed differences are related also to the assumed share of different resources presented previously in Table 1 and Table 2. Following the assumptions, the share of generating units to be curtailed (wind and solar) corresponds to 25% of the peak demand.
From the scenarios assuming a lack of renewable curtailment, the best results are visible in Scenario 5. The load profile is significantly smoother, resulting in milder up and down ramps. Nevertheless, the impact of the RES curtailment and the combination of both services (smoothing of the load profile and load levelling) gives the best results: the profile is smooth, peak demand is slightly reduced and night valleys of the demand are visibly filled (Scenario 6). The slight reduction of the peak demand in all scenarios is associated with a relatively low share of entities that are able to shift the demand from night valleys to the peaks: ESSs and ALs.
Table 4 presents a summary of the obtained results, where:
  • Objective function denotes the value of the objective function (profit) obtained in a given scenario expressed as a percentage of profit obtained in the reference scenario as given by Equation (10);
  • Maximum ramp denotes a maximum percentage change in the power flow at the PCC between two adjacent hours included in the simulations’ time horizon as given by Equation (11);
  • Demand change denotes the percentage ratio of the difference between the maximum and the minimum demand regarding the maximum demand during the simulations’ time horizon (Equation (14)).
The provision of the ASs caused deviation from the reference operation points of aggregated resources, hence, the values of the objective function for all scenarios were lower compared to the reference case. The difference between the obtained value of the objective function (for Scenarios 1–6) and reference value should be treated as the minimum price of the offer for AS provision (Figure 11). The lowest profits were obtained in Scenarios 2, 4 and 6 in which RES curtailment was allowed, and a significant decrease in incomes due to lost generation occurred. For this reason, the AS provision has to be properly valued in order to ensure the desired income for DRAs and therefore encourage them to participate in different markets.
In summary, Scenarios 2, 4 and 6 were characterized by the best technical performance. RES curtailment caused significant smoothing of the load profile at the PCC and visibly reduced the difference between the maximum and the minimum demand. Such actions can have a positive impact on the operation of the whole power system, as load levelling and smoothing of the demand profile facilitate the real-time balancing of the load and generation due to the reduction of the profile’s variability, and they may allow further RES development.
In Scenarios 1, 3 and 5 where RES curtailment was not allowed, ASs were provided mainly by active resources like ESs and ALs. The assumed share of such entities (Table 1 and Table 2) was lower than the share of RESs; therefore, the quality of the services’ provision was strongly dependent on the contribution of different distributed resources inside the aggregator’s structure.

6. Conclusions

The implemented model of the DRA and the performed simulations showed that distributed resources aggregated into the DRA structure are able to provide ASs together with CDGUs and therefore contribute to the improvement of the power system’s operation. The establishment of the DRA structures, as part of the modern power system, enables small resources to participate in wholesale markets. The flexibility of the DRA resources facilitates load-generation balancing and allows for further RES development due to the mitigation of their intermittent operation. The variety of the provided services is strictly dependent on the DRA composition and legal regulations (e.g., the possibility of renewables curtailment).
The performed studies indicate that further research should consider how to determine the optimal set of DRA participants. The effectiveness of the service provided has an impact on the reduction of the volume of produced electricity and therefore reduces the basic market income for the aggregated resources’ owners. The properly designated revenues for participants should encourage them to share their capabilities for the AS provision. Additionally, other types of services, e.g., operating reserves, could be considered.
The MILP formulation of the optimization model resulted in a short computation time.

Author Contributions

All authors developed the initial idea of providing ancillary services (ASs) by the distributed resource aggregator (DRA). A.L. and D.C. designed the DRA structure, relations with other entities and the optimization model. R.D. provided critical comments and research suggestions. All authors have read and agreed to the published version of the manuscript.

Funding

This research received no external funding.

Acknowledgments

The authors would like to express the gratitude to the FICO® corporation for programming support and provision of academic licenses for Xpress Optimization Suite to Institute of Electrical Power Engineering at Lodz University of Technology.

Conflicts of Interest

The authors declare no conflict of interest.

Nomenclature

Indices and Sets
t T Time span (24 h with 15-min intervals)
g G Dispatchable generating unit
r R Renewable Energy Source (wind and solar)
s S Energy Storage System
a A Active Load
Parameters
p t Market price of electricity in time period t
P min g Minimum output power of dispatchable generating unit g
P max g Maximum output power of dispatchable generating unit g
P min r Minimum required output power of Renewable Energy Source r in time period t during generation curtailment
P r t Output power of Renewable Energy Source r in time period t without generation curtailment
E R E S   r t Energy generated by Renewable Energy Source r in time period t
E min s Minimum capacity of Energy Storage System s
E max s Maximum capacity of Energy Storage System s
η s Efficiency of Energy Storage System s
P max s Maximum charge/discharge power of Energy Storage System s
E L   a t Energy consumed by Load a in time period t
P C C d e s % Percentage change of the demand at the Point of Common Coupling between two adjacent hours desired by the system operator
P C C max r e f Maximum demand at the Point of Common Coupling in reference scenario
P C C d e s   m i n Minimum demand at the Point of Common Coupling desired by the system operator
P C C d e s   m a x Maximum demand at the Point of Common Coupling desired by the system operator
Variables
P g t Output power of dispatchable generating unit g in time period t
P c u r   r t Output power of Renewable Energy Source r in time period t during generation curtailment
E g t Energy generated by dispatchable generating unit g in time period t
E s t Capacity of Energy Storage System s in time period t
E imp s t Energy imported (charged) by Energy Storage System s in time period t
E exp s t Energy exported (discharged) by Energy Storage System s in time period t
P imp s t Charge power of Energy Storage System s in time period t
P exp s t Discharge power of Energy Storage System s in time period t
E A L   a t Energy consumed by Active Load a in time period t
P C C % Percentage change of the demand at the Point of Common Coupling between two adjacent hours
P C C t Demand at the Point of Common Coupling in time period t
D e m Maximum demand change at the Point of Common Coupling during simulation period
P C C m a x Maximum demand at the Point of Common Coupling during simulation period
P C C m i n Minimum demand at the Point of Common Coupling during simulation period
Binary Variables
s i m p   s t Charging status of Energy Storage System s in time period t
s e x p   s t Discharging status of Energy Storage System s in time period t

References

  1. Calvillo, C.F.; Sánchez-Miralles, A.; Villar, J.; Martín, F. Optimal planning and operation of aggregated distributed energy resources with market participation. Appl. Energy 2016, 182, 340–357. [Google Scholar] [CrossRef] [Green Version]
  2. Poplavskaya, K.; Vries, L. Distributed energy resources and the organized balancing market: A symbiosis yet? Case of three European balancing markets. Energy Policy 2019, 126, 264–276. [Google Scholar] [CrossRef]
  3. Contreras-Ocana, J.; Ortega-Vazquez, M.; Zhang, B. Participation of and Energy Storage Aggregator in Electricity Markets. In Proceedings of the 2018 IEEE Power & Energy Society General Meeting (PESGM), Portland, OR, USA, 5–9 August 2018. [Google Scholar] [CrossRef] [Green Version]
  4. Bruninx, K.; Pandžić, H.; Le Cadre, H.; Delarue, E. On the Interaction between Aggregators, Electricity Markets and Residential Demand Response Providers. IEEE Trans. Power Syst. 2020, 35, 840–853. [Google Scholar] [CrossRef]
  5. TSO-DSO REPORT. An Integrated Approach to Active System Management with the Focus on TSO-DSO Coordination in Congestion Management and Balancing. April 2019. Available online: https://eepublicdownloads.blob.core.windows.net/public-cdn-container/clean-documents/Publications/Position%20papers%20and%20reports/TSO-DSO_ASM_2019_190416.pdf (accessed on 18 June 2020).
  6. EURELECTRIC. Active Distribution System Management: A Key Tool for the Smooth Integration of Distributed Generation, The Union of the Electricity Industry. February 2013. Available online: https://www.eurelectric.org/media/1781/asm_full_report_discussion_paper_final-2013-030-0117-01-e.pdf (accessed on 1 July 2020).
  7. Trebolle, D.; Hallberg, P.; Lorenz, G.; Mandatova, P.; Guijarro, J.T. Active distribution system management. In Proceedings of the 22nd International Conference and Exhibition on Electricity Distribution (CIRED 2013), Stockholm, Sweden, 10–13 June 2013. [Google Scholar] [CrossRef]
  8. Li, R.; Wang, W.; Chen, Z.; Jiang, J.; Zhang, W. A Review of Optimal Planning Active Distribution System: Models, Methods, and Future Researches. Energies 2017, 10, 1715. [Google Scholar] [CrossRef] [Green Version]
  9. Chalvatzis, K.J.; Ioannidis, A. Energy supply security in the EU: Benchmarking diversity and dependence of primary energy. Appl. Energy 2017, 207, 465–476. [Google Scholar] [CrossRef]
  10. European Union. Energy Research Knowledge Centre Report. In Research Challenges to Increase the Flexibility of Power Systems; European Union: Brussels, Belgium, 2014; pp. 1–38. [Google Scholar]
  11. Danish Energy Agency. Flexibility in the Power System-Danish and European Experiences. October 2015. Available online: https://ens.dk/sites/ens.dk/files/Globalcooperation/flexibility_in_the_power_system_v23-lri.pdf (accessed on 10 July 2020).
  12. Ulbig, A.; Goran, A. Role of Power System Flexibility. In Renewable Energy Integration: Practical Management of Variability, Uncertainty and Flexibility in Power Grids; Elsevier: San Diego, CA, USA, 2014; pp. 227–238. [Google Scholar]
  13. National Renewable Energy Laboratory. Flexibility in 21st Century Power Systems. May 2014. Available online: https://www.nrel.gov/docs/fy14osti/61721.pdf (accessed on 4 June 2020).
  14. Electric Power Research Institute (EPRI). Electric Power System Flexibility: Challenges and Opportunities. February 2016. Available online: https://www.naseo.org/Data/Sites/1/flexibility-white-paper.pdf (accessed on 6 June 2020).
  15. Rosso, A.; Ma, J.; Kirschen, D.S.; Ochoa, L.F. Assessing the Contribution of Demand Side Management to Power System Flexibility. In Proceedings of the 50th IEEE Conference on Decision and Control and European Control Conference (CDC-ECC), Orlando, FL, USA, 12–15 December 2011. [Google Scholar] [CrossRef] [Green Version]
  16. Nursimulu, A.; Florin, M.-V.; Vuille, F. Demand-Side Flexibility for Energy Transitions: Policy Recommendations for Developing Demand Response, Lausanne, International Risk Governance Council (IRGC). Switzerland, 2016. Available online: https://irgc.org/wp-content/uploads/2018/09/Demand-side-Flexibility-for-Energy-Transitions-Policy-Brief-2016.pdf (accessed on 1 July 2020).
  17. Lesniak, A. Optimization of the Flexible Virtual Power Plant Operation in Modern Power System. In Proceedings of the 15th International Conference on the European Energy Market (EEM18), Łódź, Poland, 27–29 June 2018. [Google Scholar] [CrossRef]
  18. Mielczarski, W. HANDBOOK: Energy Systems & Markets, Edition I—June 2018. Available online: http://www.eem18.eu/gfx/eem-network/userfiles/_public/handbook_energy_systems___markets.pdf (accessed on 6 June 2020).
  19. Ni, L.; Wen, F.; Liu, W.; Meng, J.; Lin, G.; Dang, S. Congestion management with demand response considering uncertainties of distributed generation outputs and market prices. MPCE J. Mod. Power Syst. Clean Energy 2016, 5, 66–78. [Google Scholar] [CrossRef] [Green Version]
  20. Kumar Panwar, L.; Reddy Konda, S.; Verma, A.K.; Panigrahi, B.; Kumar, R. Demand response aggregator coordinated two-stage responsive load scheduling in distribution system considering customer behaviour. IET Gener. Transm. Distrib. 2016, 11, 1023–1032. [Google Scholar] [CrossRef]
  21. Lucas, A.; Jansen, L.; Andreadou, N.; Kotsakis, E.; Masera, M. Load Flexibility Forecast for DR Using Non-Intrusive Load Monitoring in the Residential Sector. Energies 2019, 12, 2725. [Google Scholar] [CrossRef] [Green Version]
  22. Mohsenian-Rad, A.-H.; Wong, V.W.; Jatskevich, J.; Schober, R.; Leon-Garcia, A. Autonomous Demand-Side Management Based on Game-Theoretic Energy Consumption Scheduling for the Future Smart Grid. IEEE Trans. Smart Grid 2010, 1, 320–331. [Google Scholar] [CrossRef] [Green Version]
  23. DSO Committee on Flexibility Markets. Flexibility in the Energy Transition—A Tool for Electricity DSOs, Belgium. February 2018. Available online: https://www.edsoforsmartgrids.eu/wp-content/uploads/Flexibility-in-the-energy-transition-A-tool-for-electricity-DSOs-2018-HD.pdf (accessed on 8 June 2020).
  24. Wang, M.; Mu, Y.; Jiang, T.; Jia, H.; Li, X.; Hou, K.; Wang, T. Load curve smoothing strategy based on unified state model of different demand side resources. MPCE J. Mod. Power Syst. Clean Energy 2018, 6, 540–554. [Google Scholar] [CrossRef] [Green Version]
  25. Flex4RES Flexible Nordic Energy Systems. Framework Conditions for Flexibility in the Electricity Sector in the Nordic and Baltic Countries. December 2016. Available online: https://backend.orbit.dtu.dk/ws/portalfiles/portal/128130121/Flex4RES_Electricity_Report_final.pdf (accessed on 2 July 2020).
  26. Polish Power System Operator—PSE S.A. Polish Power System Operation—Generation of Wind Farms and Solar Farms. Available online: https://www.pse.pl/web/pse-eng/data/polish-power-system-operation/generation-in-wind-farms (accessed on 2 July 2020).
  27. Olek, B. Optimization of Energy Balancing and Ancillary Services in Low Voltage Networks. Ph.D. Thesis, Lodz University of Technology, Lodz, Poland, June 2013. [Google Scholar]
  28. ENEA Operator, Sp. z o.o. Instrukcja Ruchu i Eksploatacji Sieci Dystrybucyjnej - IRiESD, January 2014. Available online: https://www.enea.pl/operator/dla-firmy/iriesd/iriesd_enea-operator_tj_od-20160201.pdf (accessed on 10 June 2020).
  29. Polish Power Exchange—TGE S.A. Statistical Data. Available online: https://tge.pl/statistic-data (accessed on 24 August 2020).
Figure 1. The development of modern power systems and relations between their entities.
Energies 13 04598 g001
Figure 2. Peak shaving and valley filling services.
Energies 13 04598 g002
Figure 3. Load profile smoothing.
Energies 13 04598 g003
Figure 4. The proposed structure of the distributed resource aggregator (DRA) and its cooperation with other entities.
Energies 13 04598 g004
Figure 5. The proposed position of the DRA operation in the power system.
Energies 13 04598 g005
Figure 6. Generation profiles for wind and solar sources assumed for the simulation purposes (own development based on [26,27]).
Energies 13 04598 g006
Figure 7. Demand profiles for commercial, residential and industrial passive loads (own development based on [28]).
Energies 13 04598 g007
Figure 8. Market price pattern (own development based on [29]).
Energies 13 04598 g008
Figure 9. Results of the reference scenario—power flow at the point of common coupling (PCC).
Energies 13 04598 g009
Figure 10. Results of Scenarios 1–6—power flow at the PCC.
Energies 13 04598 g010
Figure 11. Minimum required revenues from the ancillary service (AS) provision for each scenario.
Energies 13 04598 g011
Table 1. Parameters of the model—demand.
ParameterDescription
Share of commercial loads31 2 3 % of the peak demand
Share of residential loads31 2 3 % of the peak demand
Share of industrial loads31 2 3 % of the peak demand
Share of ALs5% of the peak demand
Table 2. Parameters of the model—generation and storage.
ParameterDescription
Wind resource power15% of the peak demand
Solar resource power 10% of the peak demand
Non-renewable DER power8% of the peak demand
Storage maximum charge/discharge power5% of the peak demand
Storage maximum capacity4 h · maximum charge power
Storage efficiency90%
Table 3. Description of the simulation scenarios.
ScenarioDescription
Reference ScenarioNo DRA influence
Scenario 1Smoothing of the load profile; RES curtailment not allowed
Scenario 2Smoothing of the load profile; RES curtailment allowed
Scenario 3Load levelling; RES curtailment not allowed
Scenario 4Load levelling; RES curtailment allowed
Scenario 5Combined service (simultaneous smoothing and load levelling); RES curtailment not allowed
Scenario 6Combined service (simultaneous smoothing and load levelling); RES curtailment allowed
Table 4. Summary of the results.
ScenarioObjective FunctionMaximum RampDemand Change
Reference Scenario100%19.3%/h46.7%
Scenario 199.1%4.9%/h45.7%
Scenario 278.5%1.9%/h35.4%
Scenario 399.8%13.5%/h40.0%
Scenario 483.4%7.1%/h22.1%
Scenario 598.6%4.6%/h40.0%
Scenario 671.9%1.6%/h21.9%

