Abstract
Due to the new green energy policies, district heating companies are being increasingly encouraged to exploit power-to-heat assets, e.g., heat pumps and electric boilers, in their distribution networks besides the traditional central combined heat and power units. The increased utilization of these assets will generate a more complex interaction between power distribution grids and district heating networks including markets for provision of ancillary services. Enabling the participation of power-to-heat units in the ancillary service markets, e.g., frequency reserves, may increase the revenue streams for assets’ owners. However, some technical challenges must first be addressed, including optimization of portfolios of assets that accounts for ancillary service markets, new coordination and operational schemes for portfolio of assets, increase data exchange and interactions with transmission system operators, and new local control schemes for units. This paper proposes a systematic model based design approach for assessment of provision of frequency regulation by power-to-heat assets using the smart grid architecture model. The proposed approach is demonstrated in a Real-Time Control Hardware-in-the-Loop laboratory environment.
1. Introduction
The role of district heating (DH) networks to provide hot water as well as space heating is essential in many regions across the globe, especially in Scandinavian countries such as Denmark [1]. DH networks are centralized by their nature and include a few hierarchical layers such as production, transmission, distribution, and consumption chains. Each layer consists of different infrastructures e.g., heat exchangers, pumps, and pipe networks. Centralized production by combined heat and power (CHP) units has been the dominant paradigm within the DH systems during the last decade [2].
Nonetheless, the conventional paradigm is challenged by new green energy policies. For instance, requirements such as heat production commitments to CHP plants or the fuel commitment to natural gas for small district heating areas will be terminated according to new Danish energy policies. Also, the base subsidy for electricity produced by CHP plants is eliminated. On the other hand, the electricity heating tax is reduced from 307 to 155 DKK/MWh to persuade DH companies as well as the heat end-users to choose green solutions such as heat pumps [3]. On the other hand according to [4], it is expected that the power-to-heat (P2H) assets will contribute substantially in the frequency regulation reserve (FRR) markets in Denmark and technical requirements for qualification and participation of these units are already issued [5,6]. Other countries like Germany are pursuing similar policies [7], while countries like UK are still considering their potential [8]. Moreover, the potential of district heating worldwide is recognized in [9]. Thus, shifting to large-scale power-to-heat (LSP2H) assets such as electric boilers (EBs) and heat pumps (HPs) is a new trend among DH companies. Instead of resorting to heat produced by conventional CHP unites, recently the utilities are tending to meet the increased heat demand in newly developed areas, which require substantial investments in infrastructures such as transmission lines, new pipes, and other elements, by exploiting LSP2H in their DH network. Moreover, enabling participation of these units in ancillary service markets will increase revenue streams for assets’ owners and operators while minimizing the levelized cost of energy. However, the electricity and heat market mechanisms have different dead-lines and, the bidding processes may have different targets, and constraints for each player and/or asset. Moreover, a reliable forecast for the heat demand is essential for accessing the ancillary service markets. It is also recognized that large scale deployment of P2H assets will increase the renewable energy integration into the energy system [10].
A few recent researches have studied the new paradigm from long-term economic viewpoint. In [11], the influence of increasing the share of HP production in DH networks is discussed while the production costs are optimized. In [12], the capital as well as operational costs of incorporating large-scale EBs and HPs in the DH networks are discussed within a one-year prediction horizon and then the results are compared with the conventional centralized approach. In [13], the effects of a sizable increase in large-scale heat-pumps (LSHPs) by DH networks on the whole electricity market is analyzed within a one-year prediction horizon.
While a lot of research focuses on economic and long-term impacts of incorporating P2H assets into DH networks [11,12,13,14], much less attention is being paid to the short-term and real-time interaction of DH networks with the electricity markets concerning the new paradigm. The classical operational strategy for P2H units is to deliver heat and the electricity as a by-product while provision of grid support capabilities is beyond consideration. In the new framework, the focus will be shifted to provide more flexibility to the power system in terms of ancillary services while still satisfying the heat demand on a longer time scale. Thus, by integrating LSP2H assets on all hierarchical control levels related to power system including regulation markets, an additional flexibility for DH networks to interact with the electricity market is provided.
Following this line of thought, in [15] it is claimed that the reaction times of the P2H assets are fast enough to participate in the tertiary and even secondary reserve markets. However, technical constraints related to thermal and hydraulic process may limit the ability to participate in the primary reserve market. In [16], it is observed that the dynamic behavior of large-scale heat-pumps (LSHPs) is strongly influenced by the controller design. Consequently, under the proposed control strategy in [16], the LSHP response is too slow for providing primary frequency regulation, but it is fast enough to provide secondary frequency regulation. In [17], exploiting the capability of LSHPs to participate in primary frequency regulation is investigated, and it is found that an ammonia-based LSHP, which is the most common type used in Danish DH, can supply primary frequency regulation by manipulating consumed power directly instead of controlling the source outlet temperature.
While the capability of individual LSP2H assets for participation in different frequency regulation markets is being studied in the literature, there are several gaps not only in demonstrating the actual capabilities but also the limitations. Coordination of portfolio and integration of P2H assets in the control schemes at transmission operator level that takes into account the update rate for the exchanged signals is not considered in previous studies. The impact of providing ancillary services in the distribution grid point of connection for the P2H units as well as on the overall operation of DH networks including customers has not been addressed. Most of the existing studies are typically focusing on long term hourly based off-line simulations looking into techno-economic benefits of using P2H units, e.g., EB and HP. A few studies, e.g., [16,17], have analyzed the intra-hour response of an individual LSHP focusing on technical capabilities of the assets to provide frequency control using a power reference setpoint. However, these studies are not accounting for the hierarchical control structures that involves the aggregator of services and the runtime dispatcher to portfolio of units, the Transmission System Operator (TSO) and its system control schemes, power distribution grid where the units are connected, as well as the frequency control including realistic grid frequency profiles. Moreover, based on the literature survey Real-Time Control Hardware-in-the-Loop (RT-CHIL) studies have not been reported in literature yet either.
This paper proposes a model based design approach for assessment of frequency regulation schemes using P2H assets. Section 2 is mapping the frequency regulation use case on the Smart Grid Architecture Model (SGAM) with focus on provision of frequency containment reserves (FCR) and frequency restoration reserves (FRR). The interoperability of various systems, components and actors involved when providing different frequency regulation schemes are defined. Then, the existing electricity and heat market mechanisms are briefly introduced. Technical requirements for participation in Danish FCR and FRR markets are summarized as a basis for deriving the modelling requirements for all the subsystems involved. Considerations about opportunities and barriers of P2H units to participate in ancillary service markets are given as well. A realistic scenario based on a Danish site in East Jutland is presented in Section 3. Large EBs and HPs are connected to a representative Danish medium voltage distribution feeder with significant penetration of renewable energy, i.e., solar photovoltaics and wind power. A realistic synthetic frequency profile including large frequency excursions induced by imbalances between generation and production is also developed for testing the performance of FCR and FRR control schemes as specified by Danish requirements. The models of P2H assets i.e., EB and HP are described. A generic local control scheme for P2H units that allows participation into frequency regulation schemes without affecting the committed heat plans is also proposed. P2H Aggregator and TSO controls are also introduced. Considerations on RT implementation of the entire model are made in Section 4. This model is implemented in a RT-CHIL setup. Guidelines about discretization and selection of sampling times for various subsystems and components are also given. Section 5 is presenting the test cases covering qualification of P2H units and their performance when simultaneously participating in FCR and automatic FRR. Finally, Section 6 provides a summary and the outlook.
2. Frequency Regulation Use Case
2.1. Smart Grid Aarchitecture Model Mapping
One of the key enablers in smart grid/energy applications is related to interoperability of various systems and components involved for a set of specific functionalities. Consisting of the five interoperability layers the Smart Grid Architecture Model (SGAM) framework [18] allows the representation of entities and their relationships in the context of smart grid domains, information management, hierarchies and in consideration of interoperability aspects. This framework can be applied not only to smart grid but also to any smart energy system if a proper mapping on main functionalities and entities is considered. According to [18], this framework is suitable for: (i) mapping of use cases in order to validate the support by standards, (ii) identifying gaps in respect to standards, (iii) mapping of existing architectures into a general view, and (iv) developing smart grid/energy architectures.
The SGAM architecture can be used to properly design and define the frequency regulation use case as many entities, players and a strong cross coupling of two energy domains are involved. An interpretation of this mapping is shown in Figure 1 for a generic power system with high penetration of wind power such as the Danish one. The typical cross sector coupling using P2H assets is also presented.
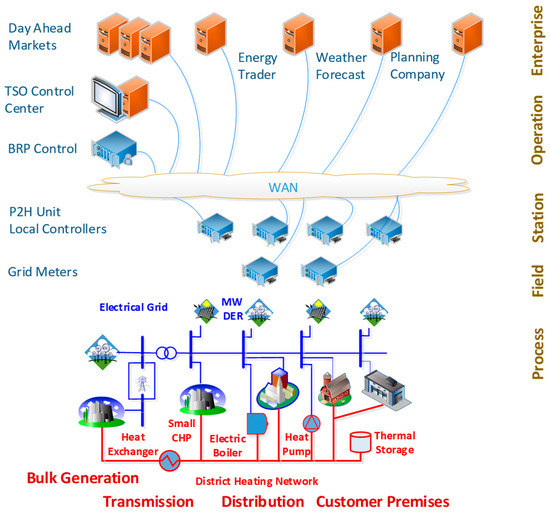
Figure 1.
Mapping of Frequency Regulation Use Case in SGAM Framework.
Bulk Generation includes all generation units both thermal, e.g., large CHPs and electrical (e.g., Wind Power Plants), connected to the transmission electrical grid and heating network, respectively. Transmission includes the electrical infrastructure related to High Voltage (HV) transmission grid as well as the infrastructure related to the district heating transmission network. The distribution domain includes the electrical infrastructure related to Medium Voltage (MV) distribution grid as well as the infrastructure related to the DH distribution network. Distributed Energy Resources (DER) comprises of local distributed production units connected to distribution grids and networks e.g., small wind power plants, solar PV plants, EBs, HPs, etc. It is assumed that all these units have an electrical installed capacity of maximum 25 MW in order to comply with technical requirements for connection to electrical grid. Customer Premises include the end users of both electricity and heat. The premises may include industrial, commercial, agricultural and local communities, homes, etc.
According to [18], the SGAM zones represent the hierarchical levels of power/energy system management. These zones reflect a hierarchical model that considers the concept of aggregation and functional separation in power/energy system management. Data aggregation considers that the data from the field zone can be aggregated or concentrated in the station zone in order to reduce the amount of data to be communicated and processed in the operation zone. A wind power plant for example has a plant controller that coordinates the operation of individual wind turbines. This controller is getting all signals from wind turbines, based on which it communicates the availability and status to a higher control level, such as a Transmission System Operator (TSO) control center. The same principle is applied for P2H assets where a plant control will coordinate and dispatch setpoints to participating units. Spatial aggregation takes the aggregation of assets from a distinct location to wider area into account. As an example, the electrical power system equipment is usually arranged in switchboards, several switchboards form a substation. Multiple DERs form a plant station and meters in customer premises are aggregated by data concentrators typically placed at secondary substation level. Similarly, the district heating system is arranged around heat-exchangers, several P2H units will form a plant, while heat meters at customer premises are located behind a data concentrator that collects heat consumption.
The zones relevant for Frequency Regulation Use Case are presented in the next paragraphs.
Process—includes the physical equipment directly involved in transforming energy from one for to another [18]. For electrical system this includes: generators, transformers, circuit breakers, overhead lines, cables, electrical loads any kind of sensors and actuators which are part or directly connected to the process. For thermal system this includes: heat exchangers, HPs, EBs, thermal loads, sensors and actuators directly connected to heat generation, consumption, etc.
Field—includes the equipment to protect, control, and monitor the electrical and/or thermal processes, e.g., protection relays, bay controller, any kind of intelligent electronic devices which acquire and use process data from electrical grid and/or district heating networks. In the case of frequency regulation, grid meters are used to measure voltages and currents in the point of connection of units, e.g., EB. It also computes the active and reactive power using the measurements and estimates the grid frequency.
Station—represents the area aggregation level for field level, e.g., for data concentration, functional aggregation, substation automation, local Supervisory Control and Data Acquisition (SCADA) systems, and plant supervision [18]. In this case, the local control of thermal units is placed at station level. These controls are not only responsible for ensuring the heat production according to Day Ahead Heat Plans, but also to provide the additional electrical power contribution as requested by the system frequency regulation control schemes.
Operation—is hosting power/energy system control operation in the respective domain [18]. In the case of frequency regulation, two players are involved namely TSO and Aggregator. The TSO is hosting the load frequency control (LFC) scheme that provides setpoints to the Balance Responsible Parties (BRPs) according to system frequency deviations. The TSO also generates activation signals for P2H units participating in particular frequency control schemes. The TSO is receiving feedback signals from BRPs, such as status of units, availability, etc. as defined in technical requirements [5,6]. The Aggregator is a BRP participating in frequency control schemes with a portfolio of assets e.g., EBs and HPs. The Aggregator control hosts a Run-Time dispatcher for individual setpoints to P2H units received from TSO according to particular services. The local frequency control is also implemented at this level. The Aggregator is receiving frequency measurement from grid meters as well as feedback signals from each P2H unit involved. It shall be noted that currently wind power generation is not allowed to participate in frequency response reserve due to complex mechanisms for service qualification as well as bidding process that will be explained in Section 2.2.1. However, P2H assets may be qualified and participate in this market. Opportunities and barriers for P2H assets will be discussed in Section 2.4.
Enterprise—includes several players such as the electricity and heat markets, energy traders, forecast providers, planning companies, and plant/assets owners.
In the following subsections, an overview of the main entities involved in the zones defined above is given. This overview focuses on the Danish case in particular the provision of frequency regulation for the Western power system called DK1.
2.2. Market Overview
2.2.1. Electricity Markets
Various electricity markets, e.g., day-ahead, intra-day, settlements, and other services, are operated by Nord Pool AS. All Danish players are using this platform in their daily operation. The following reserves types are defined in [4] for DK1: (i) Primary—Frequency Containment Reserves (FCR), (ii) Secondary—Load Frequency Control (LFC) or Secondary Reserves (aFRR), and (iii) Tertiary—Manual Reserves (mFRR). The Danish Transmission System Operator (Energinet) procures these reserves from Nord Pool markets via several auctions held one day before the operational day as shown in Figure 2.
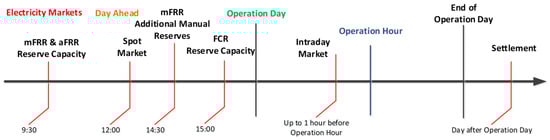
Figure 2.
Overview of Nordpool’s auctions (based on [4,5]).
Typically at 10:00 Central European Time (CET) the available capacities on interconnectors and in the grid are published as a results of Reserve Capacity Market. Electricity traders have until 12:00 CET to submit their final bids to Nord Pool for the auction in the Spot Market for delivery hours the next day.
The Intraday Market has several products, e.g., 15-min, 30-min, hourly, and block products, that provides flexibility to meet the needs of different market areas. The mechanism for this market is out of scope of this paper and will not be detailed further.
2.2.2. Heat Markets
Heating markets in Denmark are local, e.g., small cities and villages or regional, e.g., large cities including suburbs, and involve specific players around the heating utilities, e.g., transmission operators, distribution operators, heat producers, energy traders, etc. These markets are built around different time sequences, from forecast of thermal loads to generation of heat plans according to specific players and their workflow.
One example of the bidding processes is briefly captured in Figure 3, based on a planning company operating in Sjælland, Denmark [19]. The Final Heat Plan must be available for heat producers latest at 10:30 one day before the actual operation day to allow their bidding process in the Spot Market. During the operation day the heat plans are updated as specified in Figure 2. According to [19] the detailed process to obtain the Day-Ahead Heat Plans for producers involves the Planning Company and the actual Heat Producers such as Hofor, Ørsted, etc. This process takes about 3 h from the moment of having the heat demand forecast available until the Final Heating Plans for the next Operation Day are ready. The heat producers requires to have the Heat Plans latest 10:30 to start the process of generating bids for Spot market that should be submitted on NordPool latest at 12:00.
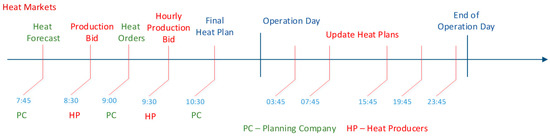
Figure 3.
Typical generation process of heat plans in district heating based on [19].
Thus, generating Heat Plans for Operation Day for P2H assets involves multiple players i.e., Energy Trader, Plant Owner, Forecast Provider, etc. that exchange information in several stages with fixed deadlines imposed mainly by participation in the electricity Spot Market. Each player may have different targets and operational constraints and limitations. However, all of them are interested in minimizing operational costs (OPEX) and maximizing revenue while providing security and reliability of heat supply. Participation of P2H units in ancillary service markets (electric power supply) may increase the revenue streams. However, it may also add additional degrees of complexity when optimizing a portfolio of assets due to bidding constraints.
2.3. Technical Requirements for Qualification and Provision of Services
2.3.1. Frequency Containment Reserve
Primary reserve regulation (FCR) is automatic and provided by production or consumption units that, responds to grid frequency deviations. The Western Danish grid (DK1) is synchronous with the much larger Union for the Co-ordination of Transmission of Electricity (UCTE) grid. In this context, the need for FCR is determined by European Network of Transmission System Operators (ENTSO-E) as proportional to the share of electricity generation in DK1 compared to the rest of the UCTE grid. Of the total volume of around 3000 MW of FCR capacity in the UCTE grid, the Danish TSO Energinet currently supplies around 20 MW, half (10 MW) of which is purchased through a reservation on Skagerrak 4 and the remaining half purchased at daily auctions [4]. For this reason, the volume of FCR market in DK1 is fairly small and with little prospect of increase, however the P2H assets may participate as part of the other frequency regulation schemes i.e., aFRR. The technical requirements for provision of FCR are very demanding [5]. The units must be qualified for delivery of this service and must fulfill specific requirements such as accuracy of frequency measurements, update rate for signal exchange, response time, duration of delivery, etc. [5]. Specific rules for bidding processes and bids are also given in [5]. Different requirements are available for Eastern Danish Grid (DK2), as this is connected to the Swedish grid. These are not considered in this paper.
2.3.2. Automatic and Manual Reserves
The aFRR reserves are used to indirectly restore frequency following the stabilization of the frequency by means of power frequency control in case of major system disturbances. One purpose of aFRR is to release the activated primary reserve. The other purpose is to restore any imbalances at the interconnections to follow the agreed plan. Secondary reserve regulation is automatic and provided by production or consumption units that are responding to control signals received from Energinet. The conditions for a supplier of automatic balancing, also called LFC or aFRR, are specified in [5,6]. These conditions are valid for market for the capability contracts, capacity market and automatic activation market. The suppliers of this service shall document and comply with a wide range of requirements regarding BRP’s obligations, day ahead bidding process including bid sizes, communication signals with Energinet including update rates, response time and delays for injected power during contingencies, settlements and penalties [5,6]. Different configurations for inclusion of assets in the general LFC/aFRR schemes are also given in [6] according to the BRP’s control schemes.
The manual reserve mFRR relieves the aFRR and the frequency-controlled normal operation reserve in the event of minor imbalances in the systems. It also ensures the balance in the event of outages or restrictions affecting production facilities and interconnections. The participation in manual reserve schemes is less demanding in terms of signal exchange as just an activation signal is provided by Energinet’s control center. However, the participating units shall provide their availability for service. Again different requirements are applicable for assets or portfolio of assets connected in the Eastern Danish grid (DK2).
2.3.3. Overview of Requirements
A summary of technical requirements for participation in frequency regulation markets is given in Table 1 based on [5].

Table 1.
Summary of technical requirements for ancillary services in DK1 based on [5].
The list of aFRR signals exchanged via SCADA is including: unit status: in/out; online measurements for production and/or consumption [MW]; actual possible reserve for up regulation [MW]; actual maximum gradient for up regulation [MW/min]; actual time constant for up regulation [s]; actual possible reserve for down regulation [MW]; actual maximum gradient for down regulation [MW/min], and actual time constant for down regulation [s]. The mFRR signals exchanged via SCADA are unit status [in/out]; net production or consumption of units in the point of connection and net production of BRP.
2.4. P2H Opportunities and Barriers
Participation of P2H assets or portfolio of assets in Reserve Capacity Markets, i.e., automatic FRR (aFRR) and manual FRR (mFRR) is currently not possible due to the multi-stage/multi-player process for generating the day ahead heat plans as explained in the previous sections. Typically, these heat plans should be available to heat producers latest at 10:30. These plans are then used to generate the bids for the Spot Market [16]. On the other hand, the bids for Reserve Capacities must be submitted by BRPs by at the latest 9:30. Additionally, all units participating in aFFR must be qualified and then provision of service granted by monthly auctions. The conditions for qualifications implies connection of units or portfolio of units to TSO Control Center, a fast data exchange and specific response time and delays in providing the committed contribution [6]. The participation in mFRR is less complicated however, it needs an activation signal provided by TSO Control Center. Both markets are requiring as part of the bid estimation of the price for the provided service.
One solution to enable the participation in both Reserve Capacity and Spot Markets is to utilize an optimization and bidding strategy that targets simultaneously both markets. This strategy should provide the required bids in due time for Reserve Capacity market i.e., 9:30 and also the energy bids to Spot market. The responsibility for implementing this algorithm may fall under the existing energy traders or BRPs. However, this may expand the business cases for each of these players, i.e., energy trader to be qualified as BRP or a BRP taking the responsibility of energy trade. Alternatively, a new player that has the capability to perform both roles, i.e., energy trader and BRP with a wide range of assets in portfolio may be considered.
Participation in FCR requires hard technical requirements such as dedicated local controllers including fast measurements of grid frequency, a runtime dispatcher for asset portfolios and fast communication between P2H units and local controller as explained in Table 1. Moreover, the portfolio of assets must be able to respond fast when frequency deviations are occurring in the power system.
Most of the existing P2H units today were installed and commissioned according to requirements imposed by the thermal supply, whereas the fast electrical control, performance and data exchange with TSO was not taken into consideration. Thus, enabling the existing P2H units to enter the ancillary service markets will require additional costs for retrofitting, i.e., modifications in local control to meet both the thermal demand but also the fast response in electrical power output. However, the new installations may account for all these aspects from the planning and design phase.
3. System Overview
3.1. District Heating Network and Distribution Grid Topologies
The system considered in this paper is based on a DH network in Århus area, Denmark. The entire network was aggregated and an equivalent representation is provided in Figure 4. This distribution network is connected to the larger transmission system (DHTN) through a heat exchanger (HE). There are three groups of customers aggregated in each of the main nodes as residential areas (RA). A 3 MWe electric boiler (EB), a 12 MWt heat-pump (HP) and 100 MWt thermal storage (TS) are connected to Node3. A pipe line of 2.3 Km is present between Node 1 and Node 2 while a shorter one (300 m) is supplying heat to the last group of customers (RA3).
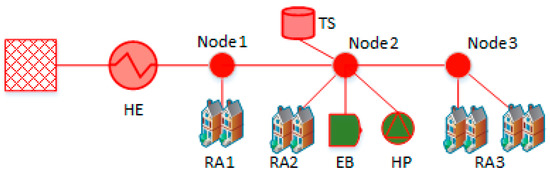
Figure 4.
Equivalent district heating distribution network near Århus, Denmark.
The sizes of P2H units were determined by a techno-economic analysis accounting for existing thermal loads, weather forecast and electricity prices over a typical one-year horizon. This sizing algorithm is not in scope of this paper.
The considered district heating topology is then mapped on a typical electrical distribution grid representative for the selected area. The Single Line Diagram of this grid is shown in Figure 5 based on [20,21].
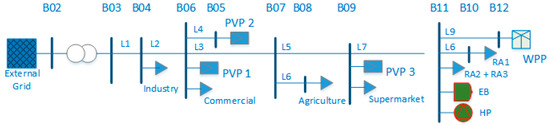
Figure 5.
Single Line Diagram of representative distribution Medium Voltage (MV) feeder.
The consumers in this MV grid are represented as aggregated loads and are of the following types [20,21]: one supermarket, two industrial consumers representing small industry, commercial buildings, several agricultural loads, e.g., farms and three residential areas. The electric boiler and heat pump are connected on bus 11. In order to account for realistic scenarios regarding the current and future penetration of renewables in Danish distribution grids, this distribution grid includes the following renewable plants, i.e., one small Wind Power Plant (WPP) and three Photovoltaic Plants (PVP). One WPP (18 MW) representing six WTs of 3 MW each is connected to bus 12. One solar PV system PVP 1 (10 MW) representing remotely located ground-mounted system is connected to bus 5. Two PV systems PVP 2 and 3 (2.5 MW each) representing typical rooftop systems mounted on top of large industrial plants and shopping centers are connected to bus 6 and bus 9, respectively. It is believed that similar sizes and locations are representative for future scenarios in MV distribution grids [20,21]. The external grid captures an equivalent up stream high voltage system characterized by short-circuit and impedance ratios using a Thevenin equivalent representation. Electrical load profiles are generated using aggregated real measurements from each type of customers.
3.2. Model Architecture and Requirements
In order to investigate the suitability of P2H units for participation frequency regulation a suitable model that accounts for realistic frequency variations and excursions as well as the impact of units in point of connection should be used. Power output of P2H units is determined by the frequency deviation and their consumption pattern may affect the neighboring electrical consumers. Thus, a generic model architecture for this type of studies is proposed as shown in Figure 6.
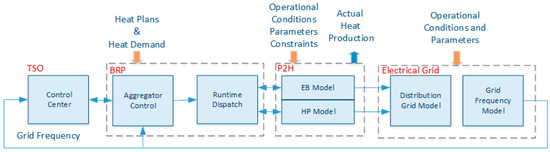
Figure 6.
Generic model architecture for frequency regulation studies.
The TSO block represents control actions from the control center, e.g., generic LFC control scheme that will generate active power setpoints (aFRR) or activation signals (mFRR) to each BRP. The BRP block comprises of an Aggregator Control and the RunTime Dispatch algorithm. The Aggregator Control and the RunTime Dispatcher shall accommodate three operation modes: (i) mFRR Mode—the block shall receive the activation signal from TSO and shall activate specific units from portfolio to provide the committed reserve capacity for mFRR according to their availability; (ii) aFRR Mode—the block shall receive the active power setpoint from TSO and it shall distribute it to P2H units according to their availability to provide aFRR, and (iii) FCR Mode—the block shall implement a local frequency control scheme for participation in FCR. The grid frequency is measured locally and used to generate the total power reference for portfolio. Then, the RunTime Dispatcher then distributes this reference to the P2H units based on their availability.
The BRP block shall also translate the Heat Plans for Operational Day into individual references for P2H units according to participation in a given frequency regulation mode. A thermal storage may be used to compensate the deficit in heat production from EB and HP in order to meet the heat demand. However, this unit is not considered in the overall model as being part of the district heating network.
The P2H block includes the performance models for HP and EB. These performance models shall be able to estimate the electrical output according to received Heat Plan and account for specific thermal constraints, e.g., ramp rates in delivering the additional contributions from FCR and FRR, operational temperatures, mass flows, etc. The performance models shall also be able to receive active power setpoints according to FR scheme, i.e., mFRR, aFRR, and FCR Operation Modes. Each type of model shall be able to provide two types of responses as specified in Table 1: (i) FRR Response according to requirements for qualification in aFRR and mFRR and (ii) FCR Response according to requirements for qualification in FCR. The output for each model shall consists of total electrical active power demand calculated as a sum from power demand computed based on heat plans and the active power demand required by specific FR scheme, i.e., aFRR, mFRR, or FCR. Typical values for power factor and hence reactive power are assumed for the considered P2H units.
The actual heat production from each unit is computed based on the total electrical power including participation in a given frequency control mode.
The Electrical Grid subsystem is comprised of two blocks, namely electrical distribution grid model (DGM) and a generic grid frequency model (GFM). The DGM Block will have the Points of Common Coupling (PCC) for each P2H unit located in a medium voltage (MV) feeder as explained in Figure 5. The GFM block models a grid frequency profile dynamically, as shown in Figure 7. The measured frequency will be used in TSO and/or BRP subsystems to generate the specific power contributions from P2H units according to frequency deviation.
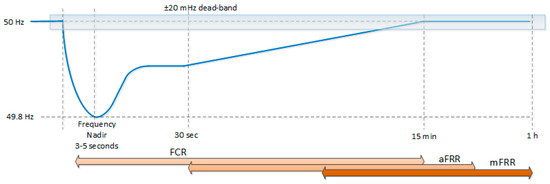
Figure 7.
Generic frequency profile in normal operation due to a sudden increase in electrical demand.
The FCR contribution should start as soon as the grid frequency is outside the dead-band and it shall be delivered within 30 s for typically up to 15 min. The aFRR shall start to react about 30 s after the imbalance and delivering the full contribution in maximum 15 min. The Transmission System Operator will activate mFRR according to the evolution of system grid frequency. Additionally the update rates for signals between each block shall comply with the requirements given in Table 1.
In the following sections, detailed descriptions regarding these models will be given.
3.3. Electrical Grid
3.3.1. Grid Frequency Model
The Grid Frequency Model is based on a small yet realistic test grid with high penetration of wind power that is described in [22,23,24]. This test grid is relatively weak and close to the stability limits in order to capture high wind penetration scenarios. However, it is stable and operable under normal conditions. This model was developed primarily for frequency control studies, e.g., Fast Frequency Response, Frequency Containment Reserves, automatic/manual Frequency Restoration Reserve, etc. Therefore, it uses a different mix of Conventional Generation Units with realistic settings for governors as well as load variations. A 50% wind penetration corresponding to large aggregated offshore plants is taken into account as defined in [22,23,24]. Each CGU implements a generic model that is capturing the main dynamics related to the Governor, Prime Mover, and Electrical Generator, with their parameters provided in [25]. The power imbalance from generation and consumption is fed into a system inertia model to obtain the overall grid frequency response.
A probabilistic frequency deviation superimposed on the system frequency signal captures the fast power imbalances present in any grid. This probabilistic frequency deviation is determined based on a time series of measurements from a site located in Western Denmark. The measurements incorporate the effects of fast load variations, wind variability as well as the frequency control actions for DK1. This signal is used to derive a realistic frequency deviation signal using the Distribution Fitting Toolbox from MATLAB®. It is found that a Gamma distribution fits the frequency deviation measurements with very good results, as shown in Figure 8.
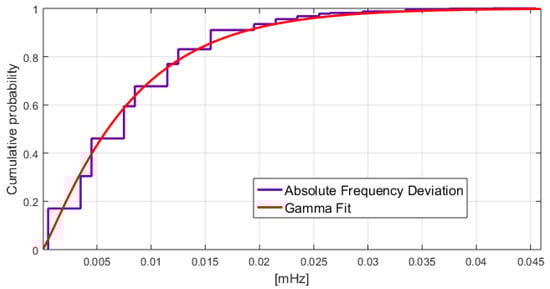
Figure 8.
Cumulative probability for Gamma distribution.
By combining the two frequency signals, i.e., system frequency and the probabilistic frequency deviations an overall grid frequency profile is obtained. The combined response of both models is shown in Figure 9 for a large increase in load that is resulting in a frequency drop down to around 49.8 Hz. This event shall trigger both FCR and aFRR response actions from the P2H units. The average grid frequency over 200 ms as provided by a grid meter is also presented in Figure 9 in green color.
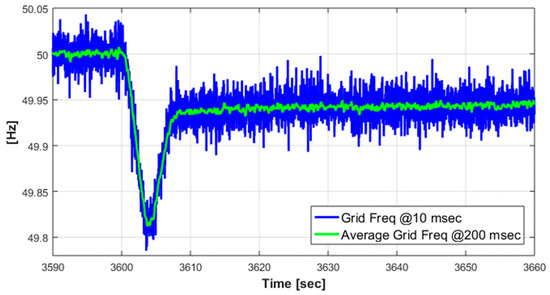
Figure 9.
Realistic large frequency excursion provided by the grid frequency model.
3.3.2. Distribution Grid
The distribution grid including electrical aggregated loads, renewable generation, i.e., wind and solar PV presented in Figure 5 is modelled using complex phasor representation of all electrical variables. The renewable generation units are modelled as described in [20,21,26] as well as the aggregated electrical loads. A grid meter model is placed in Point-of-Connection (PoC) of the P2H units i.e., bus 11. This model is providing electrical power consumption in the PoC every 10 ms. It also measures the grid frequency using a moving average filter over 200 ms as in commercial installations.
3.4. Power-To-Heat Units
3.4.1. Electric Boiler
Large scale electric boilers are usually composed of several immersion heaters. It is assumed that a 3 MW electric boiler consists of three parallel units of 1 MW each. Each unit consist of 25 immersion heaters with 40 kW capacity That are connected in a cascade structure. It is assumed that the dynamics of immersion heaters as well as the pump, which is responsible to control the flow rate of water, are fast enough to be modeled as a constant gain and a delay. The thermal response of the ith layer of EB’s tank is modeled as [27]:
where is the mass of the water inside the ith layer of the EB’s tank; is the specific heat of water; is the temperature of water getting out from the ith layer; is the rate of produced heat by the ith immersion heater; is the mass flow rate of water; is the temperature of water getting into the ith layer; is the heat transfer coefficient of the ith layer, and is the ambient temperature. The boiler model is receiving the electrical power consumptions, the overall mass flow and temperature of water as well as the ambient temperature as inputs. The output of the model is forward temperature to the DH network.
3.4.2. Heat Pump
Typically LSHP are comprised of compound smaller units. It is assumed that a 12 MW thermal air source HP consists of six units with 2 MW thermal capacity each. Two parallel chains with three units in series are considered here. A block diagram of each unit is presented in Figure 10.
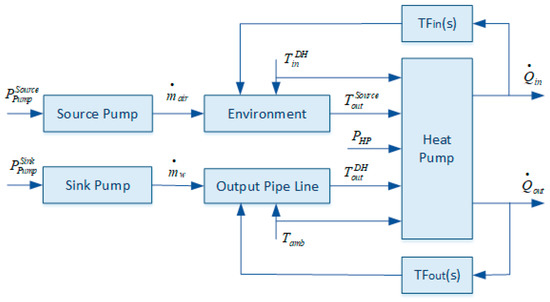
Figure 10.
Detailed block diagram of the considered heat pump (HP) unit.
The sink and source pumps as well as the environment blocks are modeled as first order systems. The environment block is governed by the following mathematical expression [28]:
where is the temperature of air exhausted from heat pump, is the mass of air, is the specific heat of air, and is the rate of absorbed heat from environment.
The output pipe line is modelled as a first order system with following dynamics [29]:
where is the temperature of return water from DH network, is the temperature of forwarded water into DH network, and is the rate of delivered heat to DH system.
The HP is assumed to be a static nonlinear function described by [30]:
where is the coefficient of performance according to the Carnot formula [ 30]:
In (5), is a correction factor indicating how close is close to the actual coefficient of performance. It depends on many factors including the losses, refrigerant, etc., but is typically in the range of 0.5–0.7.
In order to reflect the dynamics of HP’s internal subsystems, including the evaporator, compressor, condenser, and expansion valve more realistically, two second order systems are imposed between HP and its source side (e.g., environment) as well as its sink side (e.g., output pipe line). These second order systems are denoted by TFin(s) and TFout(s) respectively in.
3.4.3. Local Control
A generic control structure that is applicable to both EB and HP is proposed as shown in Figure 11. This control scheme has two operation modes namely normal operation and participation in frequency regulation.
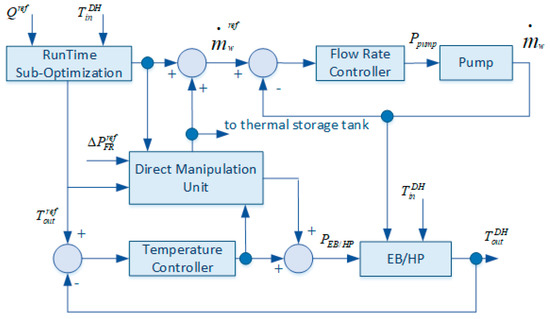
Figure 11.
Local control structure for power-to-heat (P2H) units.
In normal operation mode, two separate controllers are responsible to regulate the output temperature and the flow rate of forwarded water into the district heating network, respectively. Standard PI controllers are used for controlling water flow rate for both EB and HP. A standard PID controller is used for temperature control of EB while a feedback linearization controller is used in case of HP.
When frequency regulation is activated both active power and flow rate are manipulated in such a manner ensuring that the steady state output temperature remains unaffected while the required power contribution by frequency regulation is added or subtracted from the actual electric power consumption of the unit. The P2H asset, i.e., EB or HP, shall capture accurately the main dynamics involved as described in Section 3.3.1 and Section 3.3.2 and the tuning of the local controller rely on these parameters. Assuming perfect knowledge of the unit’s dynamic behavior, the overall response of the P2H asset to a change in electrical power setpoint can be smoothly controlled without any transients. However, in practice, lack of knowledge about the unit’s parameters and its dynamics will result in transients in the unit’s response.
Although the power consumption is manipulated directly as soon as the activation signal is received, the output temperature is always controlled according to the valid heat plans for the unit. It is worth to notice that the proposed generic control scheme for P2H assets cannot be related to any commercial or operational installation, as no references in the public domain were found.
3.5. BRP Control
The BRP control has a Runtime dispatcher that distribute proportionally to availability of units the overall power setpoint for portfolio of assets. A droop-based local FCR controller using the requirements presented in Section 2.3.3 is also implemented.
3.6. TSO Control
The TSO control block generates the activation signal for participation in mFRR or a reference active power contribution for participation in aFRR control scheme. Since developing a LFC/aFRR controller for an entire power grid is out of scope in this paper a synthetic signal derived based on [6] is used. This synthetic signal shown in Figure 12 is capturing the rise-time of 15 min and settling time of 30 min, as specified in [6], for activation of 1 MW reserve participating in aFRR.
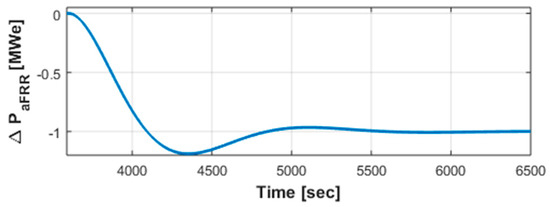
Figure 12.
Example of synthetic aFRR activation signal from Transmission System Operator (TSO) control center based on [6].
4. Considerations on Real-Time Implementation
4.1. Deployment Architecture
The deployment architecture for the Frequency Regulation Use Case presented in Figure 1 is shown in Figure 13. The laboratory Real-Time Control Hardware-In-the-Loop (RT-CHIL) framework utilized is described in detail in [31,32]. This deployment is in-line with the model based design approach described in detail in [33].
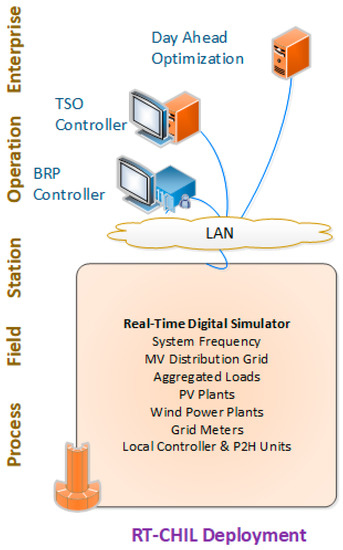
Figure 13.
Laboratory deployment of Frequency Regulation Use Case in a Real-Time Control Hardware-in-the-Loop (RT-CHIL) environment.
All RT models related to Process, Field, and Station zones are hosted by the Real-Time Digital Simulator based on Opal-RT solutions. As the model complexity is not high a single CPU core implementation is sufficient. However, additional CPU cores may be utilized for large and more complex systems, i.e., inclusion of district heating network and thermal loads. The Aggregator Controller (Operation Zone) i.e., Run-Time Dispatcher and FCR controller is implemented on a PC running models in Simulink Desktop RealTimeTM. An additional option for implementation is to use a dedicated industrial PLC that supports automatic code generation. However, no changes in performance of control functions and Runtime dispatcher are expected.
The TSO Controller (Operation Zone) i.e., activation signal or LFC/aFRR setpoint is also hosted on a PC running Simulink Desktop RealTimeTM. Day Ahead Optimization (Enterprise Zone) is hosted by a PC running MATLAB® algorithms. The generated Heat Plans are sent every hour to P2H units in Real-Time.
The Information and Communication Technology (ICT) Infrastructure including delays between different actors is not considered at this stage. Instead an ideal communication is considered, i.e., delays less than 5 ms are present on every communication link.
4.2. Model Discretization
The deployment of the entire model into a RT-CHIL platform requires careful considerations on discretization and selection of sampling times for subsystems and components in order to avoid over-runs [34,35]. All the models are discretized using Backward–Euler method as it gives a stable discrete implementation [33,34,35]. The selection of sampling times for all subsystems and components account mainly for specific model bandwidth and the resolution of data fed into the models. The system frequency model is one of the most demanding models in terms of sampling time. In order to capture the dynamics of prime movers and governors in the CGU’s a 1 ms sampling time is used. The distribution feeder model used a sampling time of 1 s as the renewable generation plants are driven by wind speeds and solar irradiation data with this time resolution. The same 1 s sampling is used for P2H units’ models. Grid meters and estimation of grid frequency used in control are running with 10 ms sampling time while providing the measured frequency in PoC every 200 ms. BRP control is executed every 1 s while the TSO control center is sending the required contribution for aFRR every 4 s as required in [5] (see Table 1).
5. Simulation Results
An extensive off-line testing was performed with individual P2H units i.e., EB and HP then with the entire systems capturing various operation conditions. Then, based on the relevance a selection of test cases that will run in Real-Time was made. Due to space limitations only three relevant Real-Time test cases are presented in the following subsections. Two tests are related to the technical qualification of HPs for provision of mFRR and aFRR. The response of Heat-Pumps under model parameter uncertainties is assessed when different reference profiles are applied. The last test case assess the participation in aFRR control schemes with a combined portfolio of MW scale electric boiler and heat-pump.
5.1. Assets’ Qualification
The qualification of Heat-Pumps for mFRR is evaluated using a reference signal for the additional contribution as shown in Figure 14a.
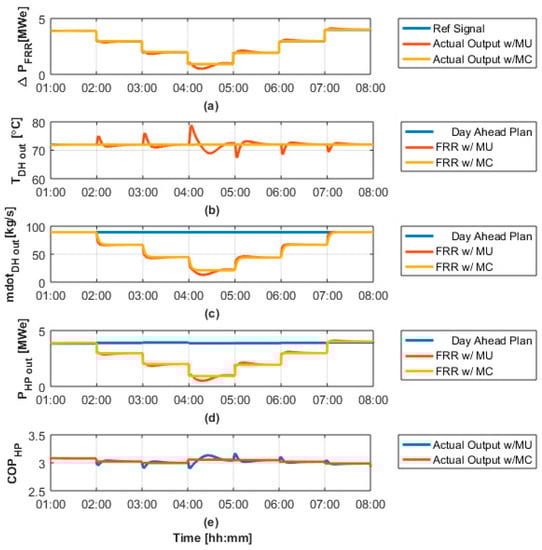
Figure 14.
Heat-Pump response to a synthetic mFRR activation signal from TSO control center: (a) additional power contribution according to FRR response; (b) temperature of forwarded water into DH network; (c) hot water’s mass-flow to DH network; (d) electrical power consumption of HP and (e) HP’s COP.
Each subplot is showing the results in two cases namely with perfect knowledge of HP parameters (w/MC) and then when there are uncertainties related to HP’s parameters and its behavior (w/MU) as explained in Section 3.4.3. The knowledge about HP parameters is required for a proper tuning of local controller has a major impact on the overall response of the unit as seen in Figure 14b–e. Limited knowledge may lead to large overshoots in the step response of the unit, especially when participating in mFRR. This may affect the effectiveness of the unit in terms of provision of these services but may also lead to disqualification for provision of service.
An additional test case is related to response of the HP on a ramp signal as received directly from TSO as explained in Section 3.5. The RT simulation results in this case are shown in Figure 15a–e. The results presented in Figure 15a reveal a delay of about 10 min in electrical power output response compared to the reference signal received from TSO when model uncertainties are included (w/MU).
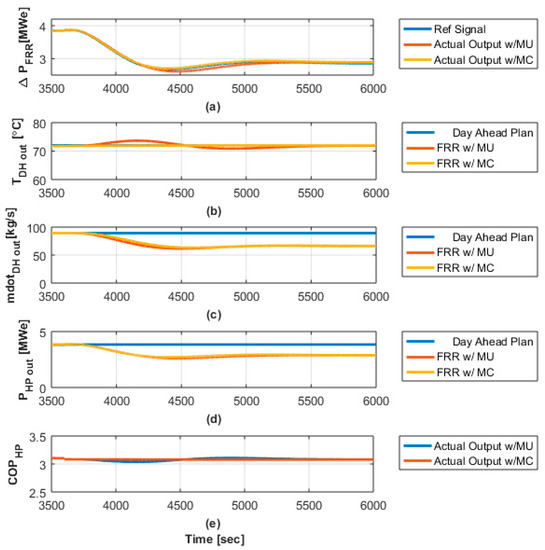
Figure 15.
Heat-Pump response to a synthetic aFRR activation signal from TSO control center: (a) additional power contribution according to FRR response; (b) temperature of forwarded water into DH network; (c) hot water’s mass-flow to DH network; (d) electrical power consumption of HP and (e) HP’s COP.
Based on the RT simulation results it can be concluded that the Heat Pump response is highly dependent on local control tuning, i.e., knowledge of all dynamics involved in the heat-pump. Participation of HPs in FRR will require changes in the typical local control schemes of the units that are designed nowadays only from thermal perspective but also knowledge of all dynamic process involved.
Similar tests were performed with EB. Due to the fast response and relatively well known behavior of these units all the results were showing that EBs can be qualified without major challenges for participation in FRR control schemes. For the sake of simplicity these results are omitted in this paper. Instead the combined participation of EB and HP when a large frequency excursion is occurring in the power system will be presented.
5.2. Response of P2H Units to a Large Frequency Excursion
The second test case focuses on the combined participation of EB and HP during a large frequency excursion in the power grid. This will involve both FCR contribution as well as FRR as the P2H assets are part of the aFRR control schemes as specified in [6]. It is assumed that the dynamic behavior of HP is very well known and captured properly in the local control of the unit. The frequency signal is obtained as explained in Section 3.3 and will not be included in simulation results. The presented RT simulation results will focus on individual response of EBs and HPs as well as their impact in the Point-of-Connection (PoC) in the distribution grid. The global setpoint that combines aFRR request from TSO and the local FCR contribution of both assets at BRP level is shown in Figure 16.
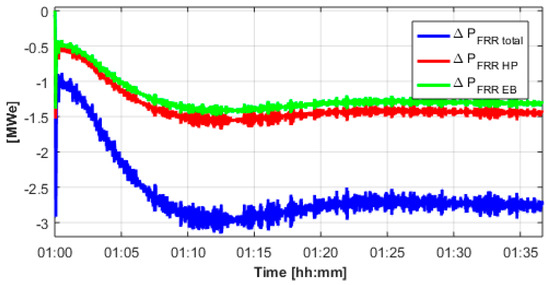
Figure 16.
Setpoints for frequency regulation reserve (FRR) actions at the Balance Responsible Party (BRP) level.
The forward temperature of the HP is not changed compared to the Day Ahead Planed schedule as shown in Figure 17a as a results of the local controller while the HP is providing the expected FRR contribution as shown in Figure 17c mainly by controlling the mass flow (Figure 17b).
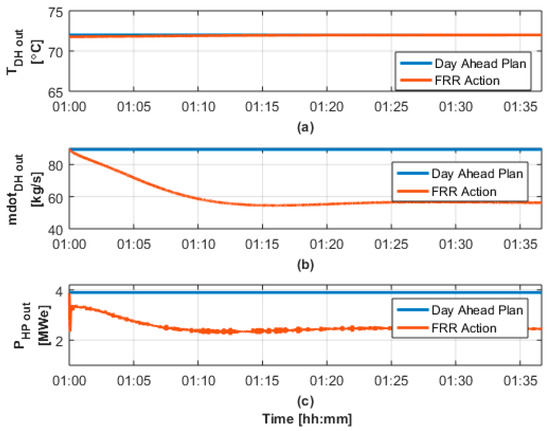
Figure 17.
HP’s main variables during FRR action: (a) temperature of forwarded water into DH network; (b) hot water’s mass-flow to DH network and (c) electrical power consumption of HP.
Similar results are obtained for the EB as shown in Figure 18a–c. Also in this case, the EB is providing the requested contribution without affecting the scheduled heat plans.
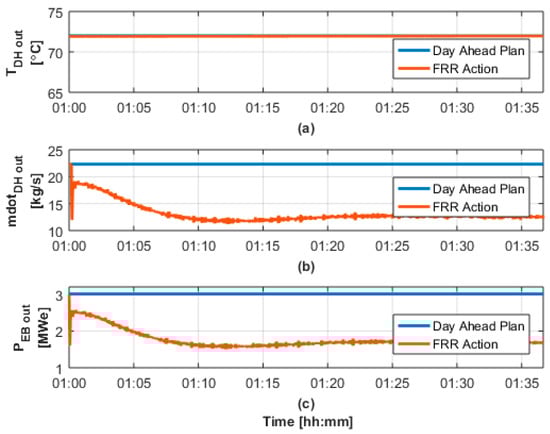
Figure 18.
EB’s main variables during FRR action: (a) temperature of forwarded water into DH network; (b) hot water’s mass-flow to DH network and (c) electrical power consumption of EB.
The voltage profile in PoC of P2H assets (Bus11) is not altered by the FRR actions and follows the trend imposed by the wind power production connected on Bus 12 as shown in Figure 19.
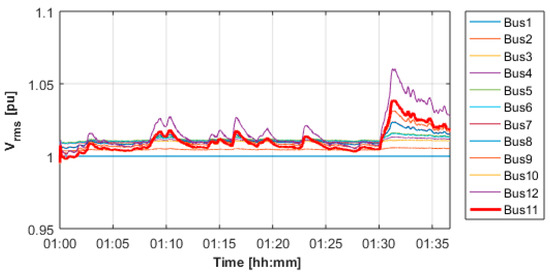
Figure 19.
Voltage profiles along the MV distribution feeder where P2H assets are connected on bus 11 (red).
Overall, EB and HP can participate simultaneously in both frequency regulation schemes namely aFRR and FCR while operating within the technical operational limits. The FCR contribution is clearly seen in the first seconds after the large frequency excursion occur (Figure 17c and Figure 18c). Then the aFRR response is taking over while a smaller contribution from FCR is superimposed (Figure 17c and Figure 18c).
6. Conclusions
Currently, the participation of P2H assets in ancillary service markets, e.g., frequency reserves is not feasible due to the multi-stage/multi-player process for generating the day ahead heat plans and the rules for participating in electricity spot market. However, a one-stage optimization process that generate bids for multiple markets, e.g., aFRR, in addition to the heat plans may not only increase the flexibility, but also the revenue streams for all players. The participation in FCR is also very demanding in terms of technical conditions, e.g., very fast response time and signal exchange with upper control levels but also in terms of local measurements for grid frequency. This paper assesses the technical qualification and performance of P2H assets for participation in aFRR, mFRR, and FCR assuming that the committed bids from this one-stage optimization process are granted and valid for the operational day. In order to get a systematic approach the SGAM framework is used to map the Frequency Regulation Use Case to this case. The main actors are identified and their main functionalities assigned including the specifications for signal exchange and update rates according to existing technical requirements for Danish power system. A relevant system based on a real site test in Western Denmark is described. Performance models for large HPs and EBs including a generic local control of P2H units are proposed. The entire system is implemented in a RT-CHIL laboratory framework and guidelines for discretization of subsystems are given. The RT implementation of the P2H models assumes that the main dynamic processes including local control are well captured with a sampling time of 1 s. Test cases running in Real-Time show that well-performing local controllers and knowledge about the HP’s dynamics are very important to achieve qualification of these units for participation in FRR markets. The proposed local control scheme indicates that the participation in aFRR does not affect the committed heat supply in the operational day. A relevant large frequency excursion profile is then used to demonstrate the capabilities of a combined P2H portfolio, i.e., EB and HP, to provide both FCR and aFRR. Overall, provision of both services does not have any major impact on thermal performance as required by day ahead heating plans. Also, there is no impact on voltage profiles in the Point of Connection of P2H units when providing frequency regulation actions. The proposed approach thus enables a systematic verification and design of operational and control schemes both at asset and aggregator level. Moreover, grid integration studies as required by electric utilities can be performed. Further work will include integration of a RT thermo-hydraulic model for DH network and thermal loads. ICT impact on coordination and control of geographically spread portfolio of P2H assets will also be considered. The proposed approach can be further applied to other type of power-to-X technologies, e.g., fuel cells.
Author Contributions
Conceptualization, F.I.; methodology, F.I.; formal analysis, F.I. and M.K.; investigation, F.I.; writing—original draft preparation, F.I.; writing—review and editing, M.K. and J.D.B.; funding acquisition, F.I. and J.D.B. All authors have read and agreed to the published version of the manuscript.
Funding
This research was funded by PSO/EUDP grant number 12539: “Local Heating Concepts for Power Balancing”.
Conflicts of Interest
The authors declare no conflict of interest.
References
- Mazhar, A.R.; Liu, S.; Shukla, A. A state of art review on the district heating systems. Renew. Sustain. Energy Rev. 2018, 96, 420–439. [Google Scholar] [CrossRef]
- Persson, U.; Werner, S. Heat distribution and the future competitiveness of district heating. Appl. Energy 2011, 88, 568–576. [Google Scholar] [CrossRef]
- Energy Agreement of 29 June 2018. Agreement between the Government and Parties. Available online: https://en.efkm.dk/media/12307/energy-agreement-2018.pdf (accessed on 29 June 2018).
- Energinets Indkøb af Reserver i Elsystemet-Regulering, Markedets Funktionsmåde, Perspektiv og Konkurrence. Available online: https://forsyningstilsynet.dk/media/5443/2018_12_21_rapportfin.pdf (accessed on 19 December 2018).
- Ancillary Services to be Delivered in Denmark—Tender Conditions. Available online: https://en.energinet.dk/-/media/Energinet/El-RGD/Dokumenter/Ancillary-services-to-be-delivered-in-Denmark.pdf (accessed on 15 October 2019).
- Technical Conditions for Participating in Automatic Balancing in Denmark (FRR-A). Available online: https://en.energinet.dk/-/media/396E3C358B664EE4B6518BB59B38D0F5.pdf (accessed on 21 July 2016).
- Laura, M.; Christian, V.; Katharina, B.; Moritz, L.; Dirk, M. Economic assessment of air-to-water heat pumps in the German building stock considering heating system design and dynamic operation. In Proceedings of the ECOS 2019—The 32nd International Conference on Efficiency, Cost, Optimization, Simulation and Environmental Impact of Energy Systems, Wroclaw, Poland, 23–28 June 2019. [Google Scholar]
- Millar, M.A.; Burnside, N.M.; Yu, Z. District Heating Challenges for the UK. Energies 2019, 12, 310. [Google Scholar] [CrossRef]
- IEA. How Can District Heating Help Decarbonise the Heat Sector by 2024? Analysis from Renewables 2019, Article. Available online: https://www.iea.org/articles/how-can-district-heating-help-decarbonise-the-heat-sector-by-2024 (accessed on 21 October 2019).
- Bloessa, A.; Schillb, W.-P.; Zerrahnb, A. Power-to-heat for renewable energy integration: A review of technologies, modeling approaches, and flexibility potentials. Energy 2018, 212, 1611–1626. [Google Scholar] [CrossRef]
- Kontu, K.; Rinne, S.; Junnila, S. Introducing modern heat pumps to existing district heating systems–Global lessons from viable decarbonizing of district heating in Finland. Energy 2019, 166, 862–870. [Google Scholar] [CrossRef]
- Khatibi, M.; Bendtsen, J.D.; Stoustrup, J.; Tougaard, J. Local heating concepts for upgrading district heating networks, a real world case study. In Proceedings of the ECOS 2019—The 32nd International Conference on Efficiency, Cost, Optimization, Simulation and Environmental Impact of Energy Systems, Wroclaw, Poland, 23–28 June 2019. [Google Scholar]
- Helin, K.; Syri, S.; Zakeri, B. Improving district heat sustainability and competitiveness with heat pumps in the future Nordic energy system. Energy Procedia 2018, 149, 455–464. [Google Scholar] [CrossRef]
- David, A.; Mathiesen, B.V.; Averfalk, H.; Werner, S.; Lund, H. Heat roadmap Europe: Large-scale electric heat pumps in district heating systems. Energies 2017, 10, 578. [Google Scholar] [CrossRef]
- Kuprat, M.; Bendig, M.; Pfeiffer, K. Possible role of power-to-heat and power-to-gas as flexible loads in German medium voltage networks. Front. Energy 2017, 11, 135–145. [Google Scholar] [CrossRef]
- Meesenburg, W.; Kofler, R.; Ommen, T.; Markussen, W.B.; Elmegaard, B. Design considerations for dynamically operated large-scale ammonia heat pumps. In 25th IIR International Congress of Refrigeration (ICR 2019); International Institute of Refrigeration: Paris, France, 2019; pp. 2591–2598. [Google Scholar]
- Meesenburg, W.; Markussen, W.B.; Ommen, T.; Elmegaard, B. Optimizing control of two-stage ammonia heat pump for fast regulation of power uptake. Appl. Energy 2020, 271, 115126. [Google Scholar] [CrossRef]
- CEN-CENELEC-ETSI Smart Grid Coordination Group. Smart, Grid Reference Architecture. Available online: https://ec.europa.eu/energy/sites/ener/files/documents/xpert_group1_reference_architecture.pdf (accessed on 2 September 2020).
- Varmelast. Generation of Heat Plans. Available online: https://www.varmelast.dk/da/varmeplaner (accessed on 30 November 2019).
- Petersen, L.; Iov, F.; Shahid, K.; Olsen, R.L.; Altin, M.; Hansen, A.D. Voltage Control Support and Coordination between ReGen Plants in Distribution Systems, Deliverable D2 PSO ForskEl 12347 RePlan. Available online: https://www.replanproject.dk/Publications/Deliverable-reports (accessed on 30 November 2016).
- Petersen, L.; Iov, F. Distributed voltage control coordination between renewable generation plants in MV distribution grids. CIRED Open Access Proc. J. 2017, 1038–1042. [Google Scholar] [CrossRef]
- Adamczyk, A.G.; Altin, M.; Göksu, Ö.; Teodorescu, R.; Iov, F. Generic 12-Bus Test System for Wind Power Integration Studies. In Proceedings of the EPE Joint Wind Energy and T&D Chapters Seminar; EPE Association: Auderghem, Belgium, 2012. [Google Scholar]
- Adamczyk, A.G. Damping of Low Frequency Power System Oscillations with Wind Power Plants. Ph.D. Thesis, Aalborg University, Aalborg, Denmark, 2012. [Google Scholar]
- Altin, M. Dynamic Frequency Response of Wind Power Plants. Ph.D. Thesis, Aalborg University, Aalborg, Denmark, 2012. [Google Scholar]
- Anderson, P.M.; Fouad, A.A. Power System Control and Stability; IEEE Press: Piscataway Township, NJ, USA, 2003; ISBN 0-471-23862-7. [Google Scholar]
- Petersen, L.; Iov, F.; Tarnowski, G.C. Gevorgian, Koralewicz, Stroe: Validating Performance Models for Hybrid Power Plant Control Assessment. Energies 2019, 12, 4330. [Google Scholar] [CrossRef]
- Farooq, A.A.; Afram, A.; Schulz, N.; Janabi-Sharifi, F. Grey-box modeling of a low pressure electric boiler for domestic hot water system. Appl. Therm. Eng. 2015, 84, 257–267. [Google Scholar] [CrossRef]
- Verhelst, C.; Logist, F.; Van Impe, J.; Helsen, L. Study of the optimal control problem formulation for modulating air-to-water heat pumps connected to a residential floor heating system. Energy Build. 2012, 45, 43–53. [Google Scholar] [CrossRef]
- Tahersima, F.; Stoustrup, J.; Rasmussen, H.; Meybodi, S.A. December. Economic COP optimization of a heat pump with hierarchical model predictive control. In 2012 IEEE 51st IEEE Conference on Decision and Control (CDC); IEEE: Piscataway Township, NJ, USA, 2012; pp. 7583–7588. [Google Scholar]
- Reinholdt, L.; Kristófersson, J.; Zühlsdorf, B.; Elmegaard, B.; Jensen, J.; Ommen, T.; Jørgensen, P.H. Heat pump COP, part 1: Generalized method for screening of system integration potentials. In 13th IIR Gustav Lorentzen Conference on Natural Refrigerants (GL2018); International Institute of Refrigeration: Paris, France, 2018; pp. 1097–1104. [Google Scholar]
- Kemal, M.S.; Petersen, L.; Iov, F.; Olsen, R.L. A Real-Time Open Access Platform Towards Proof of Concept for Smart Grid Applications. J. Commun. Navig. Sens. Serv. 2017, 1, 49–74. [Google Scholar]
- Smart Energy Systems Laboratory at Aalborg University. Available online: www.et.aau.dk/laboratories/power-systems-laboratories/smart-energy-systems (accessed on 9 September 2018).
- Petersen, L.; Iov, F.; Tarnowski, G.C. A Model-Based Design Approach for Stability Assessment, Control Tuning and Verification in Off-Grid Hybrid Power Plants. Energies 2019, 13, 49. [Google Scholar] [CrossRef]
- Iov, F.; Petersen, L.; Shahid, K.; Olsen, R.L. Verification of Ancillary Services in Large Scale Power System. Deliverable D5 PSO ForskEl 12347 RePlan. Available online: https://www.replanproject.dk/Publications/Deliverable-reports (accessed on 7 February 2018).
- Petersen, L.; Iov, F. Practical Considerations regarding Implementation of Wind Power Applications into Real-Time Hardware-In-The-Loop Framework. In NEIS Conference 2016: Sustainable Energy Supply and Energy Storage Systems (Nachhaltige Energieversorgung und Integration von Speichern); Schulz, D., Ed.; Springer: Berlin/Heidelberg, Germany, 2017; pp. 61–66. [Google Scholar]


© 2020 by the authors. Licensee MDPI, Basel, Switzerland. This article is an open access article distributed under the terms and conditions of the Creative Commons Attribution (CC BY) license (http://creativecommons.org/licenses/by/4.0/).