1. Introduction
Bioenergy has high potential for reducing greenhouse gas (GHG) emissions and can contribute to the transition of energy systems towards renewable and climate-friendly sources, particularly when the most modern technologies are employed. Investment in a plant for the production of bioenergy is usually contingent upon access to feedstocks produced in a sustainable fashion; this access generally needs to be guaranteed over long periods of time (e.g., 20 years) at a relatively low cost to justify the initial investments. In Canada, boreal forests can potentially provide a long-term biomass supply for bioenergy [
1,
2]. However, the cost of the feedstock remains a key barrier to the large-scale deployment of bioenergy.
There are three potential streams of forest biomass that are available from Canadian forests. The first (and likely most affordable) option is processing residues from wood products, for example chips and sawdust generated during the processing of lumber. The availability of wood processing residues is often low, especially in eastern Canada, since they are already widely used as feedstock for pulp and fiberboard manufacturing or for pellet production [
3]. A second option is post-harvest residues—for example, treetops and branches—which may be left on the forest floor or piled at roadside landings. These materials are widely distributed and tend to be bulky and are sometimes burnt to prevent a build-up of fuel, which can lead to wildfires. A third option for bioenergy production is the “surplus” forest growth. This can include unused biomass of desirable or merchantable species that are part of the annual allowable cut but not harvested due to lack of demand. This category could also include non-merchantable species that have no application for conventional wood products [
4], as well as standing dead trees that would typically not be harvested for solid wood products [
5]. Unused, non-commercial or dead trees are either left standing or are logged and left on site with other post-harvest residues to decay or to be burnt to reduce forest fire hazard.
Among natural disturbances in eastern Canada, spruce budworm, which has cyclical outbreaks every 30–40 years, causes significant damages [
6,
7]. This defoliator primarily affects balsam fir (
Abies balsamifera (L.) Mill) and white spruce (
Picea glauca (Moench) Voss). The current outbreak of this insect, which started in 2006, has already affected more than 7 million hectares as of 2016 [
8], with the damages expected to keep increasing. During the last epidemic, which ended around 1985, a total of 50 million hectares (ha) was affected [
9], with between 140,000 and 240,000 cubic meters (m
3) of roundwood killed by the insect. Conventional forest products (mainly lumber and pulp) are not typically sourced from budworm-damaged fibre. Sawmills select straight, non-degraded stems, whereas the pulp industry, while more tolerant of lower quality inputs, cannot manage very dry wood or large amounts of wood rot, which are typical of trees affected or killed by insects [
10]. Thus, the existing conventional industry is not able to use these trees, resulting in high quantities of fibre that is simply left in the forest.
Bioenergy has different—and somewhat less stringent—requirements than those for sawn timber or pulp and paper. For example, most bioenergy systems can tolerate biomass with degraded physical properties and the presence of rot [
10]. The window to harvest wood affected by natural disturbances is 1–2 years after the disturbance for lumber production and 3–4 years after the disturbance for pulp and paper production. By comparison, the “shelf-life” for bioenergy feedstocks could be much longer depending on the bioenergy product desired [
10]. The bioenergy industry, therefore, has the potential to become a large processing sector for dead or degraded trees to create a whole new range of innovative energy products, from heat and electricity through to wood pellets and liquid biofuels such as bioethanol and biodiesel.
There is a strong imperative to find more cost-effective sources of biomass for bioenergy options. However, at current market conditions, bioenergy is not as profitable as pulp and paper [
11]. Stephen et al. [
12] reported similar findings and also illustrated that using residues from a sawmill was much more profitable than harvesting wood specifically for bioenergy. Nevertheless, there are a few trends that may change the profitability of bioenergy options. Bioenergy prices are expected to rise as environmental policies designed to tackle the climate change problem come into effect. Moreover, bioenergy production costs are expected to go down as the technologies for converting biomass into various bioenergy carriers continually improve [
13]. Thus, bioenergy could become competitive enough to be as profitable as fossil fuels, even when considering the relatively high cost of forest biomass procurement.
Another economic improvement for the bioenergy sector would be the recognition that procuring additional forest biomass for the purpose of bioenergy production could be seen as a silvicultural treatment [
14]. Indeed, harvesting additional biomass for bioenergy from a given harvest area leads to a smaller number of trunks and branches remaining on the cutover, which can improve the microsite quality for the regeneration of the forest [
15,
16] and reduce the cost of site preparation treatments [
17,
18]. Thus, a silvicultural credit could be incorporated into calculations of bioenergy project profitability because the costs of site preparation would be reduced. This is especially true in the context of stands affected by natural disturbances in boreal forests of eastern Canada, where the quantity of remaining (mostly dead) trees on the cutover is high, eventually creating significant volumes of coarse debris on the ground, which can hinder regeneration of the forest [
19].
The costs of harvesting insect-degraded trees have been examined [
20]. Degraded trees have a higher harvesting cost than healthy trees, mainly because they break easily, and they require additional stem analysis for the operator. The profitability of overall forest operations is also essential to consider, since a wide range of wood products (including conventional products such as sawn timber and pulp, as well as emerging products such as bioenergy) would typically be sourced from the same stand. For example, in an undisturbed boreal forest stand the range of tree species and variability of tree sizes lends itself well to supporting this range of products. In a boreal stand impacted by spruce budworm, the amount of defoliation and degradation will influence the ability to deliver conventional products, thus impacting the overall costs and revenues.
Creating a new outlet for severely degraded trees that are unsuitable for sawn timber and pulp (and would, thus, otherwise be left on site) would increase the harvested volume from a given stand. By harvesting more wood, the fixed costs of harvesting operations, such as road and forest camp construction, would be effectively distributed over a larger volume of wood, which in turn would influence the costs and profitability of the whole supply chain and its full range of wood products. Analyzing the profitability of bioenergy as an integral part of the range of wood products will likely more closely reflect the nature of the forest supply chain of eastern Canada, which is characterized by a close integration among products.
The general aim of this study was to understand the factors affecting the profitability of bioenergy from roundwood as part of a range of wood products sourced from stands affected by spruce budworm. The specific objectives were to:
Assess the conditions for profitability of forest operations aimed at harvesting roundwood for bioenergy, along with sawn timber and pulp, in stands with various levels of defoliation or degradation from the spruce budworm epidemic;
Estimate how the distribution of the fixed costs of harvesting over a larger volume, caused by procurement of additional wood for bioenergy, contributes to the profitability of the whole supply chain;
Estimate how revenues from bioenergy can affect the overall profitability of forest operations;
Estimate how silvicultural credits associated with procurement of additional wood for bioenergy can affect the profitability.
2. Materials and Methods
2.1. Study Area
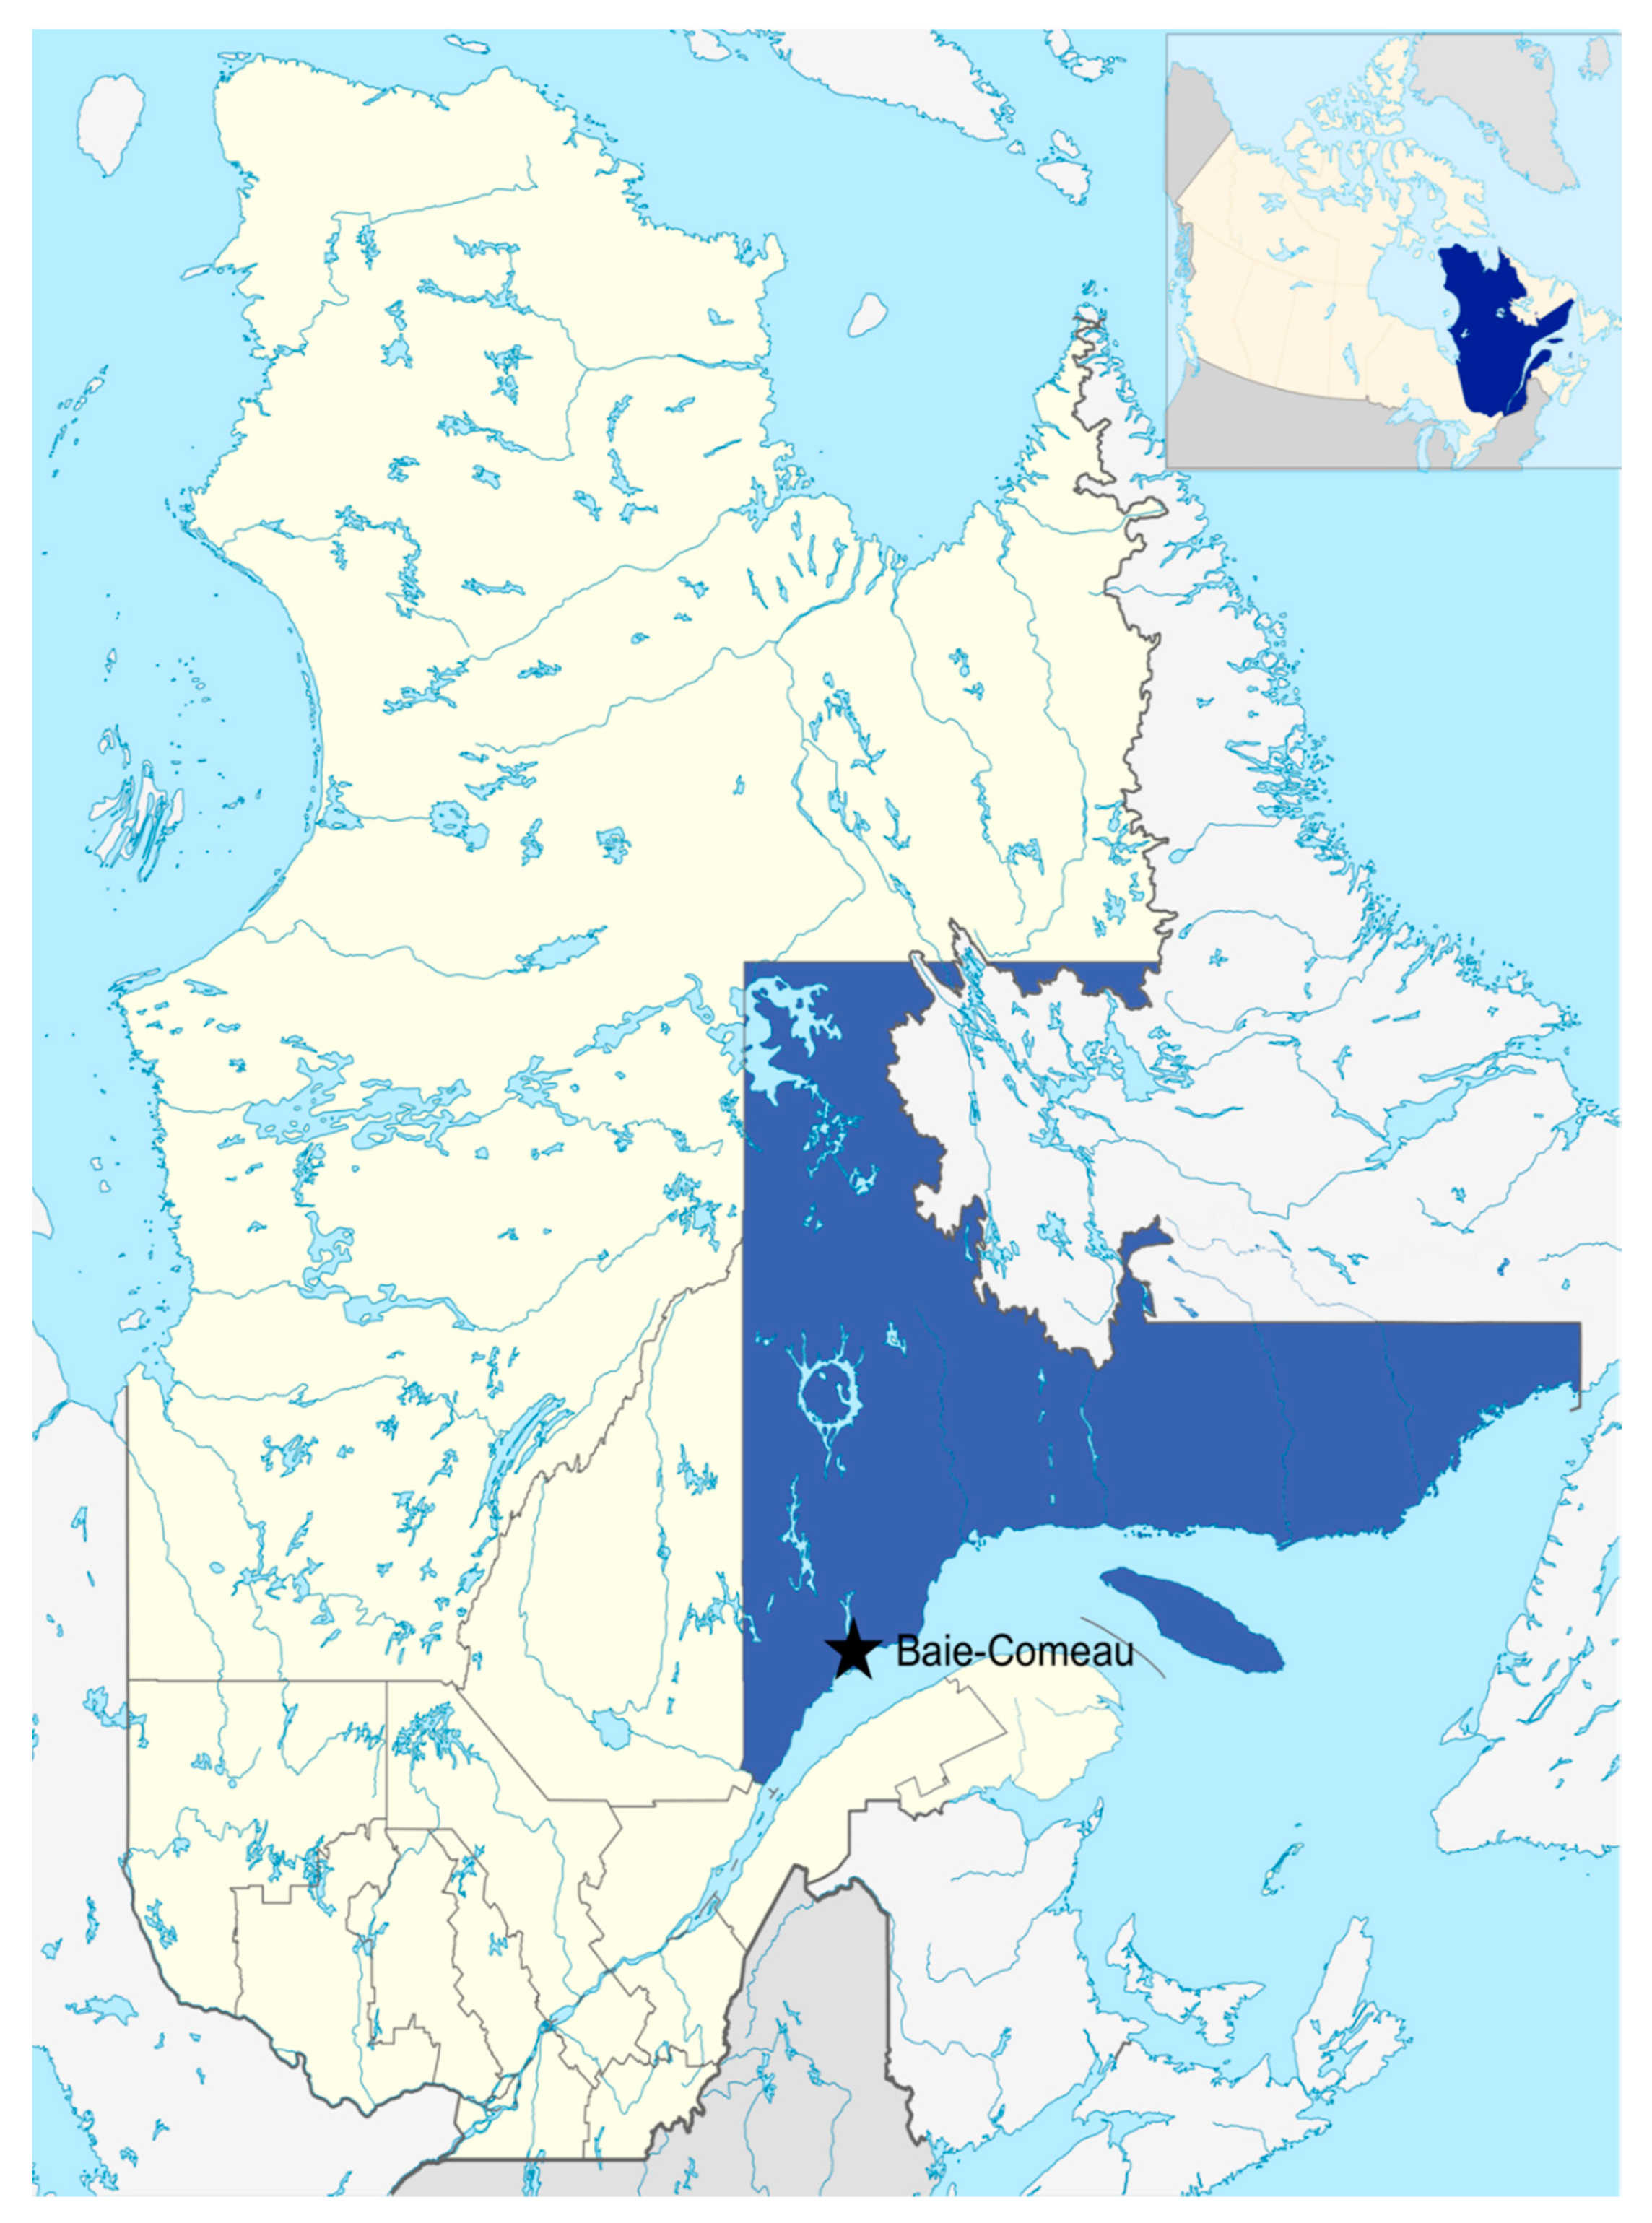
The study area is located in the Côte-Nord region of the province of Quebec, near the city of Baie-Comeau (northeastern Quebec, Canada) (
Figure 1). This region is part of the eastern balsam fir–white birch bioclimatic domain [
21], within the boreal forest biome. The dominant forest management system in the region is designed to produce two main product streams—lumber and pulp and paper.
In this study, the lumbermill and bioenergy plants were assumed to be colocated in Baie-Comeau. The paper mill is located 21 km from the lumbermill and bioenergy plants.
A database containing forest inventory information for 96 stands located across the Côte-Nord region and representing a gradient of stand defoliation and degradation caused by spruce budworm was used.
Table 1 summarizes the average characteristics of the 96 stands.
The volume per ha for the 96 stands summarized in
Table 1 was relatively low when compared to healthy stands across the region (typically around 115 m
3/ha). The stands were selected based on their degradation level and not on their maturity or volume; some of the stands were not yet fully mature (maturity being around 50–70 years old), but they were still included in this analysis.
To quantify the level of tree degradation within stands, classes proposed by Hunter Jr. [
22] and used by Barrette et al. [
11] and Gaudreau et al. [
20] were used, as shown in
Table 2. Hunter decay classes are based on morphological features linked to the presence of bark on a tree and the integrity of wood structure; they are increasingly used both in North America and Europe in studies on wood decomposition dynamics [
23], habitat availability [
24], and wood harvesting and processing [
25]. Although generally used as a categorical variable, it was also expressed here as a continuous variable to represent the average decay level of trees within a stand.
To examine the economics of harvesting forest biomass for bioenergy production in those stands, forest supply chains were simulated, in which harvesting costs, processing costs and revenues from the various products were calculated for each of the 96 stands. In these simulations, two scenarios were tested. The first was a control or “business-as-usual” scenario, in which trees are harvested for conventional products only, without roundwood procurement for bioenergy product. In this scenario, trees with a Hunter class of 4 (i.e., dead trees with peeling bark, and therefore at an advanced stage of decay) are considered unprofitable for processing by sawmills and pulpmills based on the criteria used by Barrette et al. [
25]. These trees are left unharvested within the control scenario. In the second scenario (bioenergy scenario), trees with a Hunter class of 4 are harvested for bioenergy purposes in addition to the trees taken for conventional products.
For each of the two scenarios, all harvested roundwood was first directed to the sawmill (
Figure 2). This sawmill was assumed to be the first point of entry within the forest industrial system, with sawmilling coproducts then being sold to a nearby pulpmill. In the second scenario, trees with a Hunter class of 4 were diverted to bioenergy production upon arrival at the mill site. In this study, it was assumed that the bioenergy plant would be integrated within the sawmill, as suggested by Boukherroub et al. [
26], which eliminates the costs and logistical challenges associated with additional transport.
2.2. Feedstock Costs
Simulations were conducted using the FPInterface software [
27]. This software was developed by FPInnovations and is now widely used across Canada to model forest management and logistics. Using spatially explicit forest information, it simulates harvesting operations and tracks the costs incurred on the cutting block, as well as the costs of delivering wood to the gate at different processing plants. The software uses default values for each step in the harvesting and transporting processes, based on multiple time movement and profitability studies performed across Canada linked to individual stand characteristics, which were compiled by FPInnovations. User-defined values can also be entered manually when required. In this study, user-defined values were entered to allow the simulation of stands affected by spruce budworm epidemic.
2.3. Harvesting Productivity
For both scenarios, the selected machine used in the FPInterface for the cutting operations was a harvester, which is a machine designed for felling, delimbing and bucking trees and is used in cut-to-length forest operations. The presence of degraded trees in a stand has an impact on the harvesting costs of trees. Indeed, dead trees reduce the productivity of harvesters, expressed in harvested cubic meters (m
3) per productive machine hour (PMH) [
20]. There are two reasons for this. First, the operators must spend more time analyzing which sections of each stem being cut may be adequate for processing into conventional products. Second, the degraded stems are more prone to breaking during the cut, reducing the recovered wood volume per tree and the productivity [
25]. To take into account these constraints, the default values for harvesting costs were adjusted in the FPInterface software for both the control and bioenergy scenarios.
According to Gaudreau et al. [
20] and Consultant Forestiers DGR Inc. [
28], another important variable to describe the impact of degraded woods on harvesting productivity is the diameter at breast height, i.e., 1.3 m (DBH). The productivity of a harvester increases as the DBH increases. For the purpose of this study, DBH was classified according to the three classes defined by Gaudreau et al. [
20]: small, i.e., 9.00–14.99 cm; medium, i.e., 15.00–20.99 cm; big, i.e., ≥21.00 cm. An adjustment was made to the available volume per tree based on the Hunter class and DBH class. This adjustment was then applied to every tree of the 96 stands under consideration, and a mean harvester productivity could, thus, be estimated. These values were then used in the modeling exercise for the control scenario. Based on these calculations, the mean productivity of the harvesters in degraded stands affected by the spruce budworm was, thus, lowered by 8% compared to the productivity in healthy stands.
In the bioenergy scenario, the productivity loss was estimated at 4% (as opposed to 8% for the control scenario). Since it was assumed that the operators could harvest all trees within the stand indiscriminately in the bioenergy scenario, this translates into reduced machinery movement per volume of wood relative to the control scenario. Because even rotten sections of the stems are harvested, the operator spends less time on stem analysis and optimization relative to the control, thus improving productivity.
2.4. Transportation Costs
To move the harvested stems from the cut site to the roadside, a forwarder was selected within the FPInterface software. Wood was then simulated as being transported by trucks from the roadside landing to the sawmill gate.
It is possible that dead wood, being drier and lighter, would incur lower transport costs per cubic meter; however, in the absence of detailed data, it was assumed that transport costs would be the same for degraded and sound trees. Thus, the default transport costs from the FPInterface software were used. The mean transport cost for an average distance of 59 km between the cutover and the mill was C$10.72/m3 delivered.
2.5. Stumpage Costs
Since harvesting operations occur on public (i.e., Crown) land within the province of Québec, stumpage fees had to be calculated and added to the harvesting costs. Stumpage fees are published by the Quebec government’s wood marketing bureau (Bureau de Mise en Marché des Bois du Québec) and are listed according to the species, wood quality and management unit. The stumpage costs used in the models are detailed in
Table 3. It was assumed that stumpage was the same for pulp and bioenergy, as the government to date has not yet published a bioenergy stumpage rate for roundwood.
2.6. Fixed Costs of Forest Operations
Fixed costs for forest operations were calculated for both control and bioenergy scenarios. The volume of harvested wood from a given cutover was larger in the bioenergy scenario, thus reducing the fixed costs per each m
3 harvested. The fixed costs identified in this study were for road construction costs and for installation of the forest camp, which were estimated at C
$10.57/m
3 in the control scenario using the FPInterface software. The fixed costs per m
3 in the bioenergy scenario were estimated using the following equation:
where C
B is the fixed cost per volume of wood in the bioenergy scenario, C
C is the fixed cost per volume of wood in the control scenario (10.57
$/m
3), V
C is the total volume of wood in the control scenario (m
3), and V
B is the total volume of wood in the bioenergy scenario (m
3).
While it was assumed that the fixed costs for road construction and installation of the forest camp would stay constant between the scenarios, it was also anticipated that the additional harvested volume in the bioenergy scenario would increase the road maintenance costs relative to the control scenario, due to the higher truck traffic. An additional maintenance cost was, therefore, added to the bioenergy scenario at a rate of C$0.05/km·m3 of additional bioenergy wood harvested.
2.7. Processing Costs and Revenues
The harvested wood volume delivered to the sawmill in Baie-Comeau was assumed to be processed into a range of different products depending on the scenario (
Figure 2). The processing costs and revenues were calculated with data from Barrette et al. [
11] based on the average costs in Eastern Canada for the acquisition, handling and processing of loads of roundwood within the sawmill. In the control scenario, trees with Hunter class of 1, 2 and 3 (
Table 2) were assumed to be brought to the sawmill and processed into sawn timber, with the coproducts sold for pulp. In the bioenergy scenario, trees from all Hunter classes (1, 2, 3 and 4) were assumed to be brought to the sawmill. However, only trees from classes 1, 2 and 3 were assumed to be processed for sawn timber, with coproducts used as feedstock for pulp; trees from Hunter class 4 were shifted to the bioenergy plant and processed for bioenergy only.
For all scenarios, the volume of sawn timber (in thousand board feet—TBF) from black and white spruce (
Picea mariana and
Picea glauca) and from balsam fir (
Abies balsamifera) of Hunter classes 1, 2 and 3 was estimated using the equations from Barrette et al. [
11]. These equations consider the degradation level of each tree based on its Hunter classification.
The difference between the total merchantable volume of the tree (which was calculated using provincial volume tables [
29]) and the calculated sawn timber output provided the remaining volume for coproducts, comprised of sawdust and wood chips [
11]. The sawdust was assumed to represent 5% of the volume of coproducts and the rest was assumed to be wood chips. In the control scenario, the wood chips and the sawdust were sold to pulp and paper operations, with different prices for each product, as shown in
Table 4. In the bioenergy scenario, coproducts from Hunter classes 1, 2 and 3 trees were also used for pulp and paper, whereas the total merchantable volume of Hunter 4 trees was used for bioenergy.
Note that the spruce budworm only impacts the softwood (coniferous) trees in the stand. For the hardwood tree species present, including poplar (Populus tremuloides), white birch (Betula papyrifera) and red maple (Acer rubrum), merchantable volumes were equally divided between pulp and paper and sawn timber. While this might overestimate the sawn timber volume, the 50:50 ratio was used in all scenarios in order to ensure that the bias, if any, was consistent throughout the results.
The main costs of lumber production used in this study are described in
Table 5. The prices shown are in 2017 Canadian dollars (C
$); the conversion rate used to change US
$ currency to C
$ was C
$1.33/US
$1, based on currency conversions published by the Bank of Canada. The main lumber processing costs consist of sawing, drying and planing. The combined costs for these three operations were estimated at C
$88.56/m
3 [
11]. Delivery costs between the sawmill and the retailer were estimated at C
$29.24/m
3 for an average distance of 1000 km [
11]. Revenues were estimated using the equation in Barrette et al. [
25] after adjusting for differences in lumber market prices between 2012 and 2017. Since revenues vary according to the stem degradation level and size, they were calculated for each individual tree.
We used a chip value for the pulp and paper industry of C
$58.50/m
3 and a value for shavings and sawdust of C
$32.18/m
3 [
11].
For bioenergy products, calculations were made to estimate processing costs and revenues on a unit basis, using wood pellets as a starting point. Since this product is already produced and sold at an industrial scale, data are already available on the production costs and selling prices on international markets. Using these data as a baseline, the effect of higher revenues from bioenergy (obtained either through higher market prices or through a lowering of production and transport costs) was tested. This was done to simulate a variety of different bioenergy products (e.g., cellulosic ethanol, biogas, renewable diesel, etc.), which could have very different market prices and production or transport costs.
The main production costs for wood pellet production are debarking, grinding, drying and pelletizing. Based on [
11] and assuming conversion factors of 0.491 tonnes per m
3 of wood (10% moisture content) and 1.37 tonne of wood (10% moisture content) per tonne of pellets produced, the cost for these operations was estimated at C
$14.50/m
3 of pellets. This is similar to the costs reported by [
26] for a plant with a capacity of 100,000 tonnes of pellets per year. The reported values for transport costs from the simulated pellet plant to the harbor of Baie-Comeau (20 km) vary between C
$0.16/m
3 [
26] and C
$0.18/m
3 [
11]; an average value of C
$0.17/m
3 was used. The shipping cost (including handling) from the Baie-Comeau harbor to Rotterdam in the Netherlands was estimated at C
$11.40/m
3, free on board (FOB) [
11]. The selling price for wood pellets was assumed to be C
$32.58/m
3 [
11] based on the hypothesis that all of the pellets produced are exported in bulk to Rotterdam for European distribution. Thus, bioenergy revenues (i.e., selling price less processing and transport costs) were estimated to be C
$6.51/m
3. In order to simulate alternative bioenergy conditions, two higher selling prices were also tested, effectively yielding higher net revenues for bioenergy products. The anticipated higher selling prices were arbitrarily set at C
$62.58/m
3 and C
$72.58/m
3, which would generate net revenues of C
$36.51/m
3 and C
$46.51/m
3, respectively. In practice, these higher revenues could be generated through lower processing or transport costs and higher selling prices.
2.8. Cost Savings Associated with Reduced Silviculture
In order to estimate the cost savings associated with the reduced needs for silvicultural treatments generated by additional biomass procurement explored in the bioenergy scenario, the default Québec value for silvicultural site preparation treatments of boreal coniferous stands following clearcut harvesting [
30] was used. Under the Québec system, credits of C
$747/ha are given for windrowing (i.e., removal, combing and piling of coarse debris), while C
$380/ha credits are provided for soil tillage operations. In the control scenario, windrowing is sometimes required to remove trees that are knocked down during harvesting operations, as well as for standing trees in order to improve soil mixing and minimize tillage costs. In the bioenergy scenario, it was assumed that only soil tillage was required for site preparation, since the additional biomass procurement already reduced the amount of debris on the cutover.
Since windrowing is required (and thus credits are paid) in the control scenario only in the cases where natural regeneration would otherwise be significantly hindered by debris, the probability of a stand needing windrowing needed to be estimated for the control scenario. The requirement for windrowing was assumed to be a function of a stand degradation level, since the probability of a stand requiring additional site preparation is linked to the number of pieces of debris with a diameter greater than 5.0 cm, which is much higher in degraded stands [
31]. To estimate the probability for windrowing treatment being required, the mean Hunter class of each stand was multiplied by a factor of 0.25. Thus, in the control scenario, stands with a mean Hunter class of 1 (i.e., low level of degradation) would have a 25% chance of needing a windrowing operation, while a stand with a mean Hunter class of 3 would have a 75% chance of requiring a windrowing operation and a stand with a mean Hunter class of 4 (i.e., high level of degradation) would always receive windrowing treatment.
Another important aspect of the silvicultural savings is the gain in productive forest area. In scenarios without biomass procurement for bioenergy purposes, considering a distance of 20 m [
32] between the windrows and assuming a windrows width of 2 m, around 10% of every cutover area is lost to windrows for the next rotation. Assuming this area will not be productive for the next decades, 10% of the revenue from the next rotation will be lost in business-as-usual scenarios. By harvesting additional wood for bioenergy, this area reduction could be minimized or even avoided, considering that the windrows will be almost inexistent because of the additional harvested biomass. To estimate the value in
$C (as of 2017) of the financial gain in productive area associated with biomass procurement, and assuming that profits of the next rotation are the same as the profits of this rotation, a discount equation was used:
where Pv represents the present value, Fv represents the expected value of money at year n (C
$2750/ha), i represents the discount rate (assumed to be 4%), and n represents the time in years before the cash flow (90 years).
2.9. Data Analysis
Estimates of costs and revenues were then used in a statistical linear regression, with the
lm function of the
Stats package in
R software [
33]. The model was fitted using multiple linear regression, with the mean Hunter class of a stand, its mean volume per stem and the distance (km) between the stand and the processing plant are expressed as continuous variables; and the use of bioenergy or not is expressed as a categorical variable represented by dummy variables, whereby 0 = no bioenergy or control and 1 = bioenergy are independent variables and the profit (C
$ per m
3 of feedstock harvested) is the dependent variable. Thus, using this model it was possible to estimate which variables had the biggest influence on the profitability of the whole bioenergy scenario.
3. Results
3.1. Harvesting Productivity and Costs
The mean harvested volume per stand was 64 m3/ha in the control scenario. This assumes that trees with a Hunter class of 4 (i.e., dead trees at an advanced stage of decay) were not harvested. In the bioenergy scenario, the mean harvested volume was 91.64 m3/ha, since every tree was harvested. Overall these values are somewhat low, which could be explained by the fact that stands included in this study were selected based on their degradation level and not on their maturity or volume; some of the stands included in the analysis were not yet fully mature (a spruce stand is considered mature around 50–70 years old, depending on the site fertility). Nevertheless, in forest operations, stands that have not yet reached the age of maturity are often harvested when they are located within large cutblocks of mature forests.
A relationship was established between the volume per stem, averaged per stand, and the Hunter class, with larger stems being more degraded and more likely to be harvested in the bioenergy scenario (
Figure 3). The total volume harvested from the 96 simulated stands was 64.971 m
3 in the control scenario and 91.418 m
3 in the bioenergy scenario, thus allowing the harvesting of almost 30% additional wood in the bioenergy scenario.
Accounting for differences in harvesting productivity, harvested stand volume and stem volume between the two scenarios, the harvesting costs per m3, including roundwood for all products and averaged over all simulated stands, were C$58.57/m3 for the control scenario and C$45.25/m3 for the bioenergy scenario.
Figure 4 shows the volume distribution among the different products. The figure suggests that when the mean Hunter class of a stand increases, the pulp and paper volume of the stand stays at a similar level. However, the sawn timber volume generally decreases, while the bioenergy volume increases.
3.2. Fixed Costs
The construction and maintenance of forest roads in the control scenario was estimated to cost C$10.57/m3 based on FPInterface. The distribution of the fixed costs over a larger volume of harvested wood had an impact on the costs of the road construction in the bioenergy scenario. Even considering the additional road maintenance costs of C$0.05/km caused by the increased truck circulation (equivalent to C$0.29/m3, given an average distance of 59 km between the mill and the stands), the average road construction and maintenance cost was only C$7.74/m3 in the bioenergy scenario. Accessing additional feedstocks in the bioenergy scenario, therefore, had the effect of saving approximately C$2.83/m3 in unit costs for all products, including lumber; this represents relative savings of 27% compared to the standard fixed costs per unit in the control scenario.
3.3. Silvicultural Savings
Savings of C$367/ha were estimated in instances for which the additional harvesting of biomass for bioenergy allowed windrowing operations to be avoided for stands in which high amounts of debris would otherwise hinder establishment of regeneration. These savings represent the difference between the price of windrowing (C$747/ha) and the price of soil tillage (C$380/ha).
The average present value of the savings made by minimizing the area lost to windrows was estimated at C$63.87/ha (in 2017 dollars, calculated over a 90-year horizon at an interest rate of 4%), which could be added as a revenue today in the bioenergy scenario.
Overall, the savings would vary between C$0.90/ha and C$499/ha. As an example, for a stand with a volume of 92 m3/ha, C$3.99/m3 could be accounted for as additional benefits from procuring degraded trees for bioenergy by saving on silvicultural treatments, and C$0.69/m3 could be accounted for as additional benefits from reducing the loss of productive forest area relative to a business-as-usual scenario. Taken together, the silvicultural savings for the bioenergy scenario for such a stand would be C$4.68/m3. Across all 96 stands, the average return from using bioenergy as a site preparation treatment was C$2.31/m3.
3.4. Tree Degradation Level
The results of the regression analysis showed that the variable with the most significant influence on profitability was the interaction between the Hunter variable and the bioenergy variables (
Table 6). Thus, a stand with a high Hunter class (i.e., high level of degradation) is likely to cause unprofitable operations in the bioenergy scenario compared with the same stand in the control scenario. An example of this is shown in
Table 7, which is the application of the model in
Table 6, showing the profitability of stands according to the mean Hunter class per stand with or without bioenergy (bioenergy vs. control), with the other variables being kept constant at the average values found in
Table 1. The volume per stem and distance to the mill were also found to have significant effects (positive and negative, respectively) on profitability (
Table 6).
3.5. Bioenergy Revenues
Figure 5 shows the influence of increasing revenues (the difference between the selling price and processing and transport costs) from bioenergy products on the overall profitability of the operation. The control scenario (where no additional harvest takes place and no bioenergy values are realized) is shown in red, while the green, blue and purple bands represent increasing revenue rates. Revenue rates can be influenced by the selling price for bioenergy products, but also by changes to production costs. The independent variable is profit in C
$/m
3 (i.e., revenues minus harvesting, processing and transport and shipping costs for all products). The dependent variable is the mean Hunter class of the stand. The figure includes the fixed costs and silvicultural savings found earlier. The shaded areas represent the confidence interval of each scenario (if the shaded areas of the two scenarios overlap, there is no significant difference between them). Positive values on the y-axis indicate profit, while negative values indicate loss.
The results suggest that the scenario where the bioenergy product generates revenues of C$6.51/m3 (corresponding to the current market price for wood pellets of C$32.58/m3, with processing and transport costs of C$26.07/m3) is not as profitable as the control scenario. Thus, at current market prices and costs, procuring additional biomass for wood pellets and production of conventional wood products incur losses relative to a scenario without additional biomass procurement. Indeed, stand profitability with bioenergy procurement at current wood pellet costs and prices stays under the confidence interval of the control scenario for almost all of the stands considered in the study. Even with bioenergy revenues of C$36.51/m3, the stand profitability with bioenergy feedstock removal is lower than the control scenario, although the difference between the control and the bioenergy scenarios is less significant. With bioenergy revenues of C$46.51/m3, the bioenergy scenario is similar in profitability to the control scenario.
4. Discussion
The results show that procuring biomass for bioenergy in the form of degraded trees, along with roundwood for conventional wood products, at current market prices for basic bioenergy products (i.e., wood pellets) is not profitable in highly degraded stands; when the mean Hunter class of a stand is above 2 (i.e., most trees are dead), the bioenergy selling price does not cover the overall costs of harvesting the additional wood. On the other hand, in healthy or lightly degraded stands (i.e., trees are defoliated or dying but not yet dead), the profitability per m3 of including biomass for bioenergy in the supply chain is similar to that of a business-as-usual scenario, where only fibre is procured for conventional wood products. This is probably caused by the very limited number of degraded trees in healthy stands, which creates a low production of biomass for bioenergy.
One important finding is that when bioenergy revenue reaches approximately C
$46.51/m
3—for wood pellets, this would mean a selling price more than C
$40/m
3 above current market value—forest operations in the bioenergy scenario show a profitability profile similar to that of the control scenario. This suggests that as the value of bioenergy products increases or processing and transport costs decrease, it will become more feasible to profitably process degraded wood. However, whether bioenergy products can ever generate such high revenues might be unlikely given the current and projected energy prices [
34]. The results also suggest that due to high harvesting costs, high-quality products are always needed in combination with lower-quality products to make forest operations profitable. Bioenergy from degraded trees is not profitable on its own and products with low market value cannot be relied on to pull it along. Ambitious policies or market changes need to drastically influence and effectively raise the prices of heat and electricity from wood pellets, high-value bio-based products would need to be sourced from forest biomass and remarkable innovation needs to ensure low bioenergy production costs.
Nevertheless, several opportunities for cost savings for the whole forest supply chain have been identified in the scenario that includes biomass procurement for bioenergy. The first opportunity relates to increased harvester activity in the cutblock. In instances without biomass procurement, the harvester productivity is lower in stands heavily affected by insect epidemics, mainly because degraded stems are more prone to breaking and because the operators need to spend more time analyzing each stem to only collect roundwood sections that can be processed into high-quality products [
28,
35]. In the bioenergy scenario, it was assumed that less time for analysis and sorting was required from the operator since all stems would be harvested irrespective of their degradation level. This increases the harvester productivity for all forest products, allowing the whole forest value chain to benefit from the addition of bioenergy as a product.
Related to harvester productivity is the cost of harvest. Considering that harvesting costs typically represent more than half of the total operational costs, it is an important factor to consider when planning forest operations in sectors affected by insect epidemics. Indeed, harvester productivity was predicted to be 92% in the control scenario and 96% in the bioenergy scenario, based on Gaudreau et al. [
20]. This difference translated into a 23% margin in harvesting costs per m
3, with harvesting operations in the bioenergy scenario costing C
$13.32/m
3 less than the control scenario. This is likely due to the fact that trees of Hunter class 4 (i.e., dead trees at an advanced stage of decay), which were left on site in the control scenario but harvested in the bioenergy scenario, were bigger on average than less degraded trees, leading to a higher average volume per stem in the bioenergy scenario. This makes sense, as it is expected that the older and often bigger trees might have reached maturity and would be declining irrespective of the epidemic; older trees might also have a lower capacity to survive severe defoliation and would, therefore, reach a high level of degradation (Hunter class 4). Harvesters are more productive (in harvested m
3 per hour) with bigger trees, which contributed to the average harvesting cost per m
3 being significantly lower in the bioenergy scenario. It is noted that the assumptions of harvester productivity would need to be validated on the field to confirm their impact on harvesting costs. Additionally, other harvesting methods and systems than the one assumed here could be tested and could turn out to be more efficient in the context of degraded stands. Moreover, on-site biomass processing and densification steps could also be added to the supply chain, which have been shown in some contexts to increase profitability [
36].
One important modeling parameter used in the present study is that trees of Hunter class 4 (i.e., dead trees at an advanced stage of decay) were considered too degraded to be harvested for conventional products [
25]. Although this should hold true in most operating conditions in eastern Canada, sawmill specifications might vary, with some sawmills not processing sections or whole trees of Hunter classes as low as 2 (live but declining trees), with others being able to profitably process sections or whole trees of Hunter class 3 (dead trees at an early stage of decay). Moreover, even in the absence of biomass procurement, it needs to be recognized that harvester operators may need to cut down degraded trees to make space for machinery movements or to reduce safety hazards to workers posed by standing snags. These degraded trees would typically be left on the ground in the cutblock. In these instances, the harvesting costs of the control scenario would be even higher than were estimated here, impacting profitability.
The additional harvesting of forest biomass for bioenergy has the effect of spreading the fixed costs (i.e., the road construction and forest camp construction) across a greater volume of wood, thus reducing the fixed cost for each m3 of wood, irrespective of its end use. This relative reduction of fixed costs was estimated at 27%. However, this is still a very small proportion of the total operational costs. Given that the mean operational costs were estimated at C$89.33/m3, the average savings of C$2.83/m3 related to the fixed costs remain small. In typical forest operations, the fixed costs are usually charged unequally among volumes dedicated to the different products—the distribution is calculated as a function of the value of the end product, with products with higher values (i.e., lumber) covering a larger share of fixed costs than products with lower values. In this simulation, the fixed costs were equally distributed among all harvested volumes and not prorated based on the value of end products. This means that the profitability calculated here should be examined only at the stand level, not at the product level.
On average, among stands where biomass procurement for bioenergy could help avoid the windrowing operation, C
$2.31/m
3 could be added as revenue due to the harvesting of additional biomass for bioenergy acting as a site preparation method. Across the 96 stands, this represents an average of C
$162.70/ha to be expected as silvicultural credits. This result is lower than that published by Gan and Smith [
17], who found savings of around C
$400/ha, as well as those published by Wrobel-Tobiszewska et al. [
37], whose model predicted savings ranging from C
$0/ha to C
$532/ha, depending on the quantity of biomass harvested. This could be because the assumptions used in our model might be different in real-case situations. For example, some stands in the control scenario might need both windrowing and soil tillage operations, while in the model only windrowing was assumed for those stands. Since the decision for site preparation is usually taken based on a field inventory of microsite availability and regeneration stocking in the years following harvest, it is hard to estimate the needs for site preparation based on the available information. Nevertheless, these findings underscore the need for further analysis of degraded stands, since in some stands the benefits could reach almost C
$500/ha with the model used. More comprehensive studies based on field trials should be conducted to increase the understanding of these savings. Moreover, as the study is located in an area prone to natural disturbances (e.g., cyclical spruce budworm outbreaks but also wildfires), the impact of such disturbances on the economics of silvicultural operations would need to be taken into account.
Together, the silvicultural benefits and fixed cost reduction yielded a C$5.14/m3 reduction for an average overall biomass procurement cost of C$89.33/m3. It is, therefore, unclear whether this could significantly influence management and business decisions at a regional scale, whereas at a stand management level knowing where this will make a difference would be of first importance. Regardless, the findings underscore the need for a more detailed analysis of the opportunities—including forest productivity, regeneration establishment and growth, future stand productivity, carbon sequestration and emissions—associated with procuring degraded trees that would otherwise be left on site, and how these opportunities could be translated into economic gains.
The volume distribution among the different wood products is also important. Indeed, since the sawn timber volume decreased as the level of tree decay increased, the revenues from sawn timber significantly decreased. Since the profitability of forest operations reaches 0 around a Hunter class of 2.25 (i.e., in which most trees are dead), this could be linked to the low volume of sawn timber that can be procured in such stands. Thus, a proportion of 40% of sawn timber is probably necessary to maintain the profitability in forest operations aimed at the procurement of wood for conventional wood products and bioenergy feedstock. More research should, however, be conducted to further understand how the proportion of sawn timber versus bioenergy feedstock in a stand influences the profitability of forest operations.


