Article

Experimental Study on the Solids Residence Time Distribution in Multiple Square-Based Spouted Beds

1
Faculty of Science and Technology, Free University of Bozen-Bolzano, 39100 Bozen-Bolzano, Italy
2
Department of Civil, Chemical and Environmental Engineering, University of Genova, 16126 Genova, Italy
*
Author to whom correspondence should be addressed.
Energies 2020, 13(18), 4694; https://doi.org/10.3390/en13184694
Submission received: 10 August 2020 / Revised: 3 September 2020 / Accepted: 5 September 2020 / Published: 9 September 2020
(This article belongs to the Special Issue Fluid Flow Analysis of Spouted Beds)

Abstract

:
The present work aims at investigating the residence time distribution (RTD) of a multiple spouted bed reactor, which will be applied for the pyrolysis and gasification of residual biomass. The unit is composed of square-based spouted beds, placed in series and at descending heights, and communicating with each other through an opening in the lateral wall. The gas is fed evenly in parallel. The experimental analysis is based on tracer experiments in cold-flow units, assessing the influence of the number of units and the bed height. The tests proved the good mixing properties of the spouted beds, which create a stable fluidization regime and do not feature dead zones. Each spouted bed can generally be well assimilated to an ideal continuous stirred tank reactor (CSTR). The RTD of the device seems adequate for the application, and also seems to be well tuneable through the selection of the bed height and number of units. Given the good similarity with ideal reactor networks, these represent a valid tool to estimate the final behavior in terms of RTD.

Graphical Abstract

1. Introduction

The spouted bed (SB) stands out as a reliable technology to process coarse and irregular solid particles. Since their first application for the drying of seeds [1], SBs have been proposed as suitable devices for many applications, including the coating of solids [2,3], polymerization [4], chemical vapor deposition [5] and feeding operations [6]. Thermo-chemical conversions have also been proved to be effectively carried out by SB using different types of feedstock. The pyrolysis of biomass [7,8,9,10], waste plastics [11,12], scrap tires [13] and sludge [14] has been tested and validated at the laboratory and pilot scales. Moreover, the combustion of wood charcoal [15], biomass [16], sludge from the paper industry [17] or even toxic wastes [18] has been the object of several studies, as well as the gasification of coal [19], biomass [20], sewage sludge [21], flame retardants textile products [22] or mixtures of biomass with plastics [23].
SBs present a complex gas–solid fluid dynamic behavior. In the traditional configuration, the fluid flow enters into the SB through a single central inlet creating three well differentiated zones: the central core of the reactor through which air flows (the spout), the surrounding packed annular region (the annulus) and the solids above the bed surface entrained by the spout and going down the annulus (the fountain). Alternative configurations, such as prismatic and slot-rectangular SBs [24,25], have also been proposed to achieve similar fluid dynamics regimes. Several batch fluid dynamic studies have been performed at the lab scale to test and validate this technology [26,27,28,29]. However, few works deal with the continuous processing of solids in SB where particles need a well-defined residence time to ensure the quality of the final product.
Despite their potential, not many reliable scaled-up SB units have been developed yet, preventing their application at the industrial scale [30]. Recently, a few fully developed pilot plants have been tested [31,32]: An industrial-scale prototype has been applied for the continuous drying of paddy and it was able to handle 3500 kg/h and temperatures up to 160 °C [33]. Another one [34] has been studied for drying purposes. Moreover, the German company Glatt produces commercial prismatic SBs [35]. Several configurations have been proposed to foster this necessary up-scaling. As an example, slot-rectangular and prismatic SBs permit an easier scalability of the device as the circular inlet is replaced by a slit along the horizontal direction. Additionally, square-based SB provide a compact and scalable solution compared to traditional circular sections [36]. Multiple communicating units can be placed together increasing the total processed volume [37,38].
To achieve this configuration, the units cannot work in batch mode, but need to exchange solids with one another. Particles are fed to the first one, travel through the communicating units and leave from the final outlet. In this framework, the study of the residence time distribution (RTD) of solids becomes crucial. The study of RTD is a classic activity in chemical engineering, which is practically realized by injecting tracers into a reactor and monitoring their outlet concentration as a function of time [39]. The RDT function, E(t), defines the expected time for a fraction of the tracer to go from the inlet to the outlet of the reactor. An accurate assessment of the RTD permits inferring information about the dispersion and mixing inside the device and the identification of dead zones or by-pass flows [40]. While at first the study of RTD was only carried out experimentally, in recent years computational fluid dynamics (CFD) was proved to be a valid instrument as well [41,42,43], thanks to its high accuracy and great detail in results. However, for systems involving a multitude of coarse solid particles, such as SBs, CFD still needs to become more powerful and reliable before it can completely remove the need for experimental activities [44,45]. Few works have calculated RDTs for SB applications, and all of them did it through experiments. Berghel et al. [46] measured RTDs using sawdust in a SB dryer and showed that particle mixing was very similar to the complete mixing occurring in an ideal continuous stirred tank reactor. Recently, radioactive particle tracking has been used to characterize the solids RDT in the different regions of the SB [47]. In a detailed experimental study, Pietsch and colleagues [48] analyzed the RTD of a prismatic SB, assessing the influence of some geometrical features.
A comprehensive understanding of the fluid dynamics of multiple-unit SBs is still lacking, which limits their application in industrial processes. In this context, the aim of this work is to study the solids residence time distribution of a novel multiple square-based SB unit. We designed and constructed a square-based SB reactor made of a cascade of multiple modules. The description of the device and its fluid dynamics in dynamic conditions are described in this work. A cold-flow replica has been used to study the RTD function for a single unit and for a two-module system. Moreover, the influence of the bed height in a single unit in dynamic conditions has been evaluated. RTDs have been calculated and compared with theoretical expressions of ideal reactors.
The analyzed unit is the basis of the reactor design in the framework of the ‘Biochar’ project. Equivalent units will define an innovative prototype of a multiple double stage SB reactor to carry out the pyrolysis and gasification of agricultural residues and textile bio-products [49].

2. Materials and Methods

2.1. Experimental Set-Up

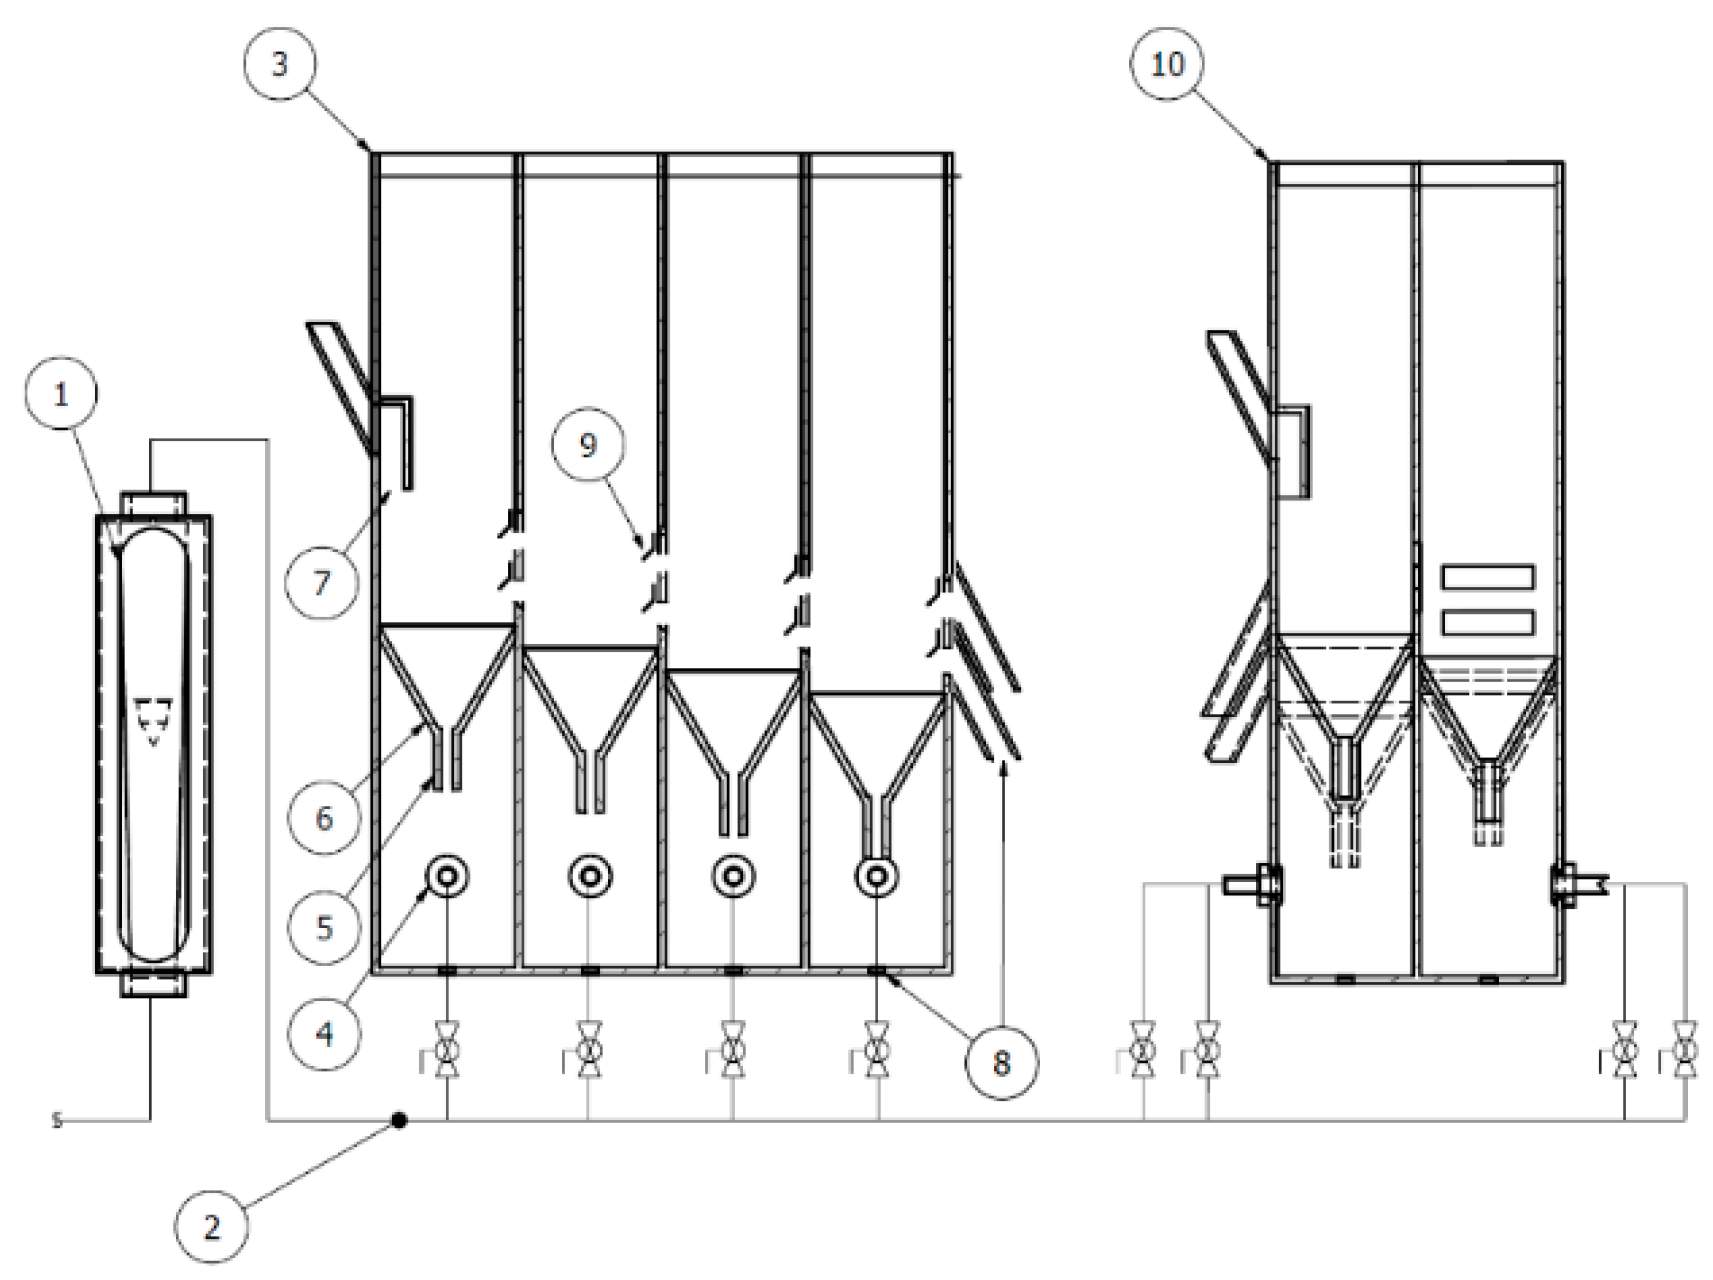
The two experimental systems (shown in Figure 1) are made of a cascade of four adjacent SB modules with dimensions of 0.3 × 0.3 × 1.8 m3. Each unit is made of wood and has a front transparent wall of polycarbonate that allows observing the motion of particles, the fountain height, and the solid crossflow. Each module has a metallic net at its top to avoid any kind of solid loss, especially during the start-up or in case of excessive gas flow rate. To ease the start-up, minimize the back flow and guarantee a fluid dynamic independency between adjacent modules, each module is placed 0.05 m lower than the prior one. There are two closable slits for solid discharge, respectively placed at 0.28 and 0.42 m from the bottom of each unit. The devices can work independently with one or more SBs. Table 1 summarizes the dimensions of the experimental units.
Solid particles are continuously fed into the upper section of the first module through a stochastic distributor box (visible in Figure 1). Particles are spread homogeneously through the bottom side and fall into the annulus. Gradually, they travel through a small opening (50 × 200 mm) and reach the adjacent module. Finally, particles are discharged from the last unit and can be collected for sampling operations. In order to avoid a direct discharge from the fountain to the adjacent module (by-pass), each lateral slit is provided with a small metal plate above the clearance, thus only allowing particles to flow by spillway.
Two different configurations have been constructed, as shown in Figure 2. The modules are horizontally aligned (1 × 4) or placed in a square pitch (2 × 2). All modules are equivalent in terms of hold-up and height gap between units. The first arrangement (1 × 4) presents advantages in terms of simplicity in construction, regularity, and management during operation. However, if used for industrial thermal applications, it may show disadvantages in terms of thermal dissipation and space usage. The second configuration (2 × 2) should overcome these disadvantages but may lead to by-pass phenomena.
For the purpose of this work, RTD functions for 1 and 2 modules will be experimentally evaluated. Theoretical descriptions will be then validated and used for the assessment of the dynamic behavior of the unit working with 3 or 4 modules. This will represent a tool to evaluate and set the main operational parameters for the successive experimental campaign using multiple units and geometries.

2.2. Particle Properties

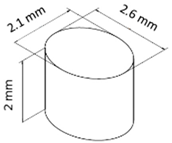
White PET (polyethylene terephthalate) particles are used as the main bed material and black ferromagnetic PET particles are used as the tracer material. Both types of particles have analogous physical properties as they were obtained through the same machine: they have the same size, while the tracer material is less than 4% heavier than the bulk material. Hence, the tracer does not affect the fluidization behavior. Table 2 shows the main particle properties as an average of several measurements. The bulk density and the void fraction were obtained by pycnometric analyses.

2.3. The RTD Functions

The fluid dynamic performance of the experimental multi-spout unit is evaluated through the RTD functions, obtained via stimulus-response analyses. This allows determining the average residence time and the absence of dead or stagnant zones and verifying a good solid crossflow from a module to the adjacent one. These analyses are a powerful tool to describe the behavior during continuous feeding from single to multiple modules. They are usually based on the E(t) function, which describes the RTD of the pulse in the reactor. Its integral is the function F(t). E(t) is directly linked to the tracer concentration in the outgoing stream C(t), while F(t) is a cumulative curve that tends asymptotically to 1. The two functions are defined as follows:
E ( t ) = C ( t ) 0 C ( t ) d t
F ( t ) = 0 t E ( t ) d t
A SB reactor can be assimilated to an ideal continuous stirred tank reactor (CSTR) unit [50,51] and the theoretical behavior of a cascade of in-series reactors can be calculated accordingly. When such a reactor receives an ideal pulse (assimilable to a δ-Dirac function) through its inlet, it produces a well-known response in its outlet [52]. The following equations respectively represent the E(t) functions for an ideal CSTR and a series of n CSTRs [52]:
E ( t ) = e t / τ τ
E ( t ) = τ i n 1 ( n 1 ) ! · t i e t / τ
where τ is the average residence time of a single unit and τi the average residence time of the i-th unit. It is worth pointing out that assimilating a SB to a CSTR is a simplification; in a previous work, we employed CFD-DEM simulations to show that the internal behavior of this SB is more comparable to a more complex network of ideal reactors [45].
The mean experimental residence time can be calculated considering the first momentum of the RTD:
τ m = 0 t a · E ( t ) d t

2.4. The Experimental Procedure

For tests using one module, white PET particles are fed continuously through the distributor box; at the same time air flow rate is adjusted to maintain a stable fountain. The distributor box is fed through a funnel with a calibrated slit, which is always kept full by the operator. This ensures a constant mass flow rate of particles. When the system reaches a stationary state, black ferromagnet particles (about 1.5% w/w of the total hold-up) are injected, simulating a δ-Dirac function (i.e., a pulse). While it was obviously impossible to achieve a perfect pulse feeding, the injection time was never observed to be more than 10 s. This interval is much lower than the duration of the experiments (about 2000 s), making the injection assimilable to a pulse.
For tests using two modules, air flow rate is adjusted to maintain a stable fountain while white particles are continuously fed. When the desired bed height is reached, particles start to fill the adjacent module by overflow, in which a second fountain is generated due to the flow of air. When the system is in stationary state and fountains are at equal height, black ferromagnet particles are injected. Samples are collected every 30 s for all tests. The experiments are considered finished when, according to the theoretical RTD curves of the equivalent CSTR, 95% of the tracer has left the device. This was chosen to avoid running the experiments for an excessive time: due to the asymptotic behavior of the RTD curves, a very long time might be needed for all the tracer particle to escape. At the same time, at the end of the experiments the RTD curves were clearly developed and making the experiments last more would have been of no practical utility. The tracer particles are separated by a magnetic rod and the exit function E(t) is calculated from the amount of tracer in a sample with respect to the initial injected quantity (Equation (7)).
C i = M t r , i M t o t ρ r e l
E ( t ) = C i · m ˙ M t r , i · ρ r e l
where:
  • Ci: concentration of black tracer in the i-th sample (kg/m3);
  • Mtr,i: mass of black tracer in the i-th sample (kg);
  • Mtot: mass of black tracer introduced in the reactor (kg);
  • ρrel: bulk density (kg/m3);
  • m ˙ : mass flow rate of white PET (kg/s).
The experimental E(t) points from Equation (7) can be compared with the theoretical E(t) curve for CSTR vessels (Equations (3) and (4)). These theoretical curves are obtained from Equations (3) and (4), calculating τ as the ratio between the unit’s mass hold-up and the mass flow rate. There was thus no fitting of the model to the experimental data: the curves just show the behavior of a CSTR with equal hold-up and feeding conditions.
The behavior of the SBs is evaluated in terms of bed depth (i.e., Hb = 0.28 and 0.42 m) and number of adjacent unit (1 or 2). Experimental E(t) data and the curves obtained from the equations of ideal CSTRs are presented. Each experimental point represents the average value between t ± 15 s, as the sampling time is 30 s. The ideal curves are obtained from Equation (3) for a single module and from Equation (4) for two modules. In both cases, the actual residence time τ is calculated as an average considering the ration between the solid mass introduced in the reactor and the whole time of the test, since non accumulation has been observed. Table 3 summarizes the experimental conditions. The identification of the proper air flow rate is addressed in Section 3.4.

3. Results and Discussion

3.1. Preliminary Fluid Dynamic Tests

Preliminary tests were performed to assess the correct functioning and operative requirements. As there is no backflow between adjacent modules, these considerations are only presented for a single module operating in batch. The goal was to evaluate the air velocity required for stable spouting as a function of the initial bed depth (Hb). This variable was studied up to a value of 0.42 m, which corresponds to the height of the upper outlet in all modules.
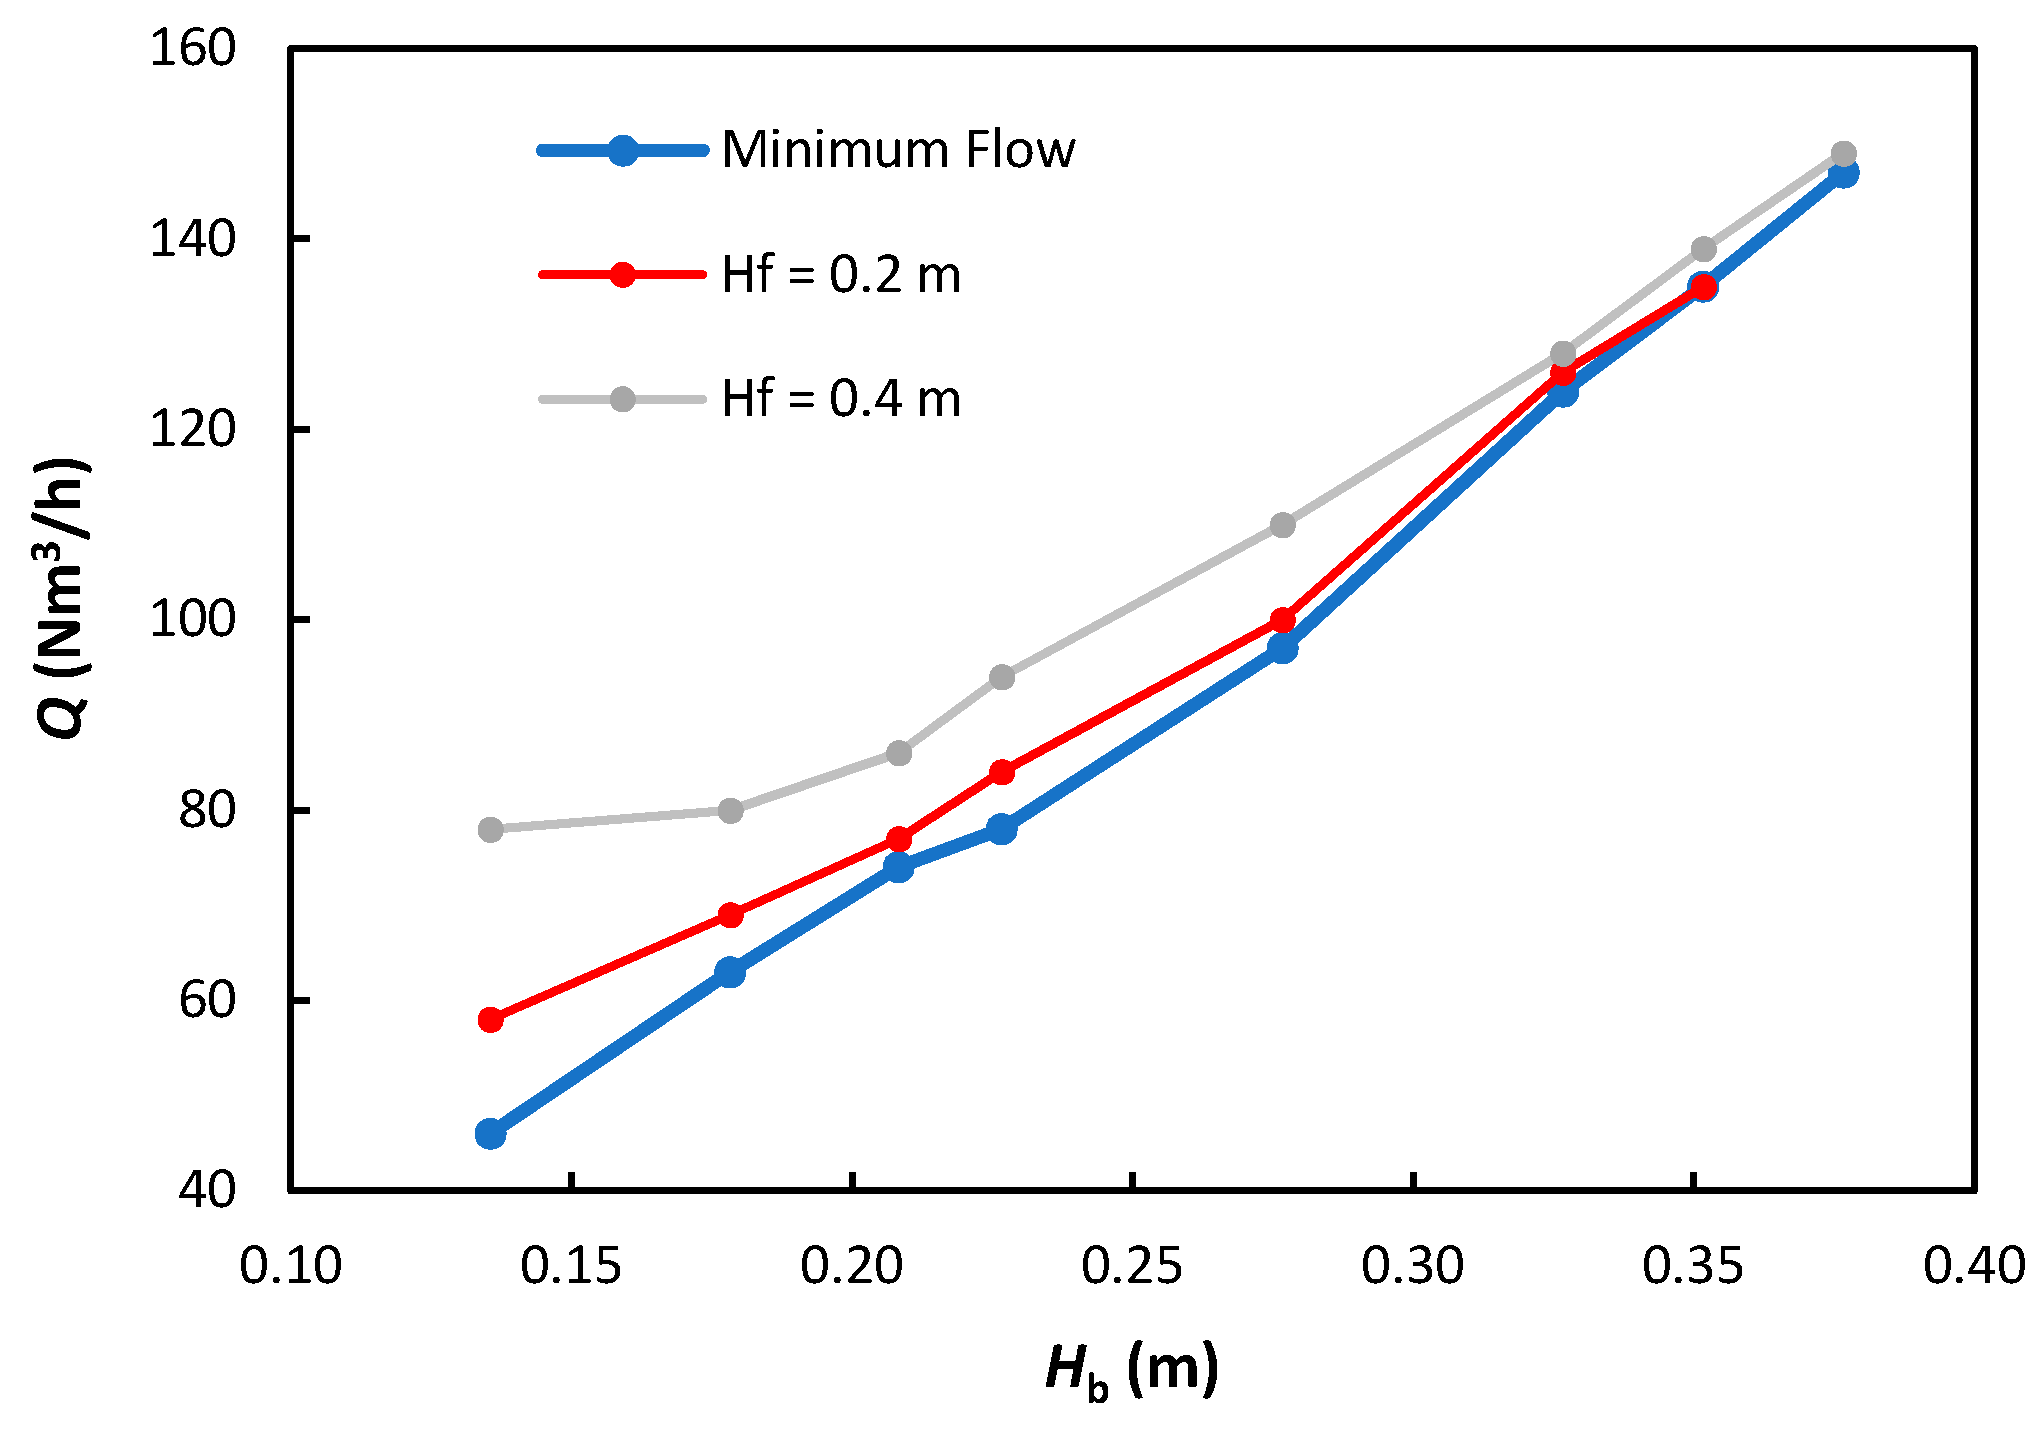
The in-line flow-meter measures the air flow rate (Q) introduced in the reactor. We focused on identifying three gas flow rate values, namely Qms, Q0.2 and Q0.4. The flow rate of minimum fluidization, Qms, represents the strictly minimum amount of air that prevents the fountain from collapsing. To guarantee stability during the operation, two other flow rates have been considered: the first one (Q0.2) guarantees a stable fountain height (Hf) of about 0.2 m, whilst the second one (Q0.4) guarantees a stable fountain height of about 0.4 m. The latter value was then employed in the experiments, as a well-developed fountain is a key requirement for good and intense mixing. Figure 3 depicts the obtained gas flow rate values.
The numbers are reasonable and show an overall linear trend for the gas flow rate. Interestingly, when working with higher initial beds, the gas flows required to achieve fountain heights of 0.2 or 0.4 m become much more similar, pointing out that the unit is less stable and may be close to reach the maximum limit of bed height.

3.2. Influence of Bed Height on a Single Dynamic Unit

The first batch of simulations was aimed at identifying the influence of the initial bed height. Figure 4 shows the obtained RTD curves for Test 1, i.e., at the lower bed height. The data show that mixing in the SB is excellent and fast, as the peak in the outlet concentration of tracer is reached very soon after the beginning. The short delay, estimated in about 60 s, proves that tracer particles do not immediately reach the outlet zone, but first undergo at least a full cycle in the annulus, which has a marked plug-flow behavior. Only from the second cycle the high mixing degree of the fountain prevails on the plug flow effect. This proves the absence of by-pass effects.
The experimental data fit quite well the theoretical curves, even though obviously the theoretical E(t) curve does not feature the delay observed in the experimental one. While the theoretical F(t) curve tends to 1, the experimental one lies slightly lower. Even though the formation of dead zones is not expected, particles may travel more slowly in some zones, such as near the edges. This can increase the residence time of some particles, which will thus leave the device later than expected. In a previous work, we confirmed through CFD-DEM simulations of this SB that this effect takes place and some particles require more time to undergo the whole cycle [45]. However, in standard operating conditions, no particle takes more than 15 s to do a whole cycle, and the SB features no dead zones. Overall resemblance between the theoretical and experimental curves is very good, indicating that this SB has mixing capabilities comparable to those of an ideal CSTR.
The mean residence time for experimental and theoretical data can be calculated from Equation (5), where the upper limit of the integral corresponds to the last sample. From the experimental data, Test 1 showed a residence time τexp = 411 s, whereas the theoretical value is τth = 445 s. Hence, the actual residence time is slightly lower than the theoretical one. This may be due to the fact that the distributor box, placed at 0.55 m from the base (as per Table 2), is not able to introduce all the particles in the annulus, and a few of them bounce out from the first unit in a sort of by-pass.
With regard to the greater bed height, Figure 5 shows the RTD curves for Test 2. While the F(t) curve appears rather unaffected, the peak in the E(t) curve happens slightly later in time and with a lower value. This is coherent with the fact that the larger bed height increases the plug-flow component of the particles’ behavior: with an H/L ratio of 1.5, the main volume of solid is in the parallelepipedal upper section of the annulus. Particles must travel downwards for a longer distance before they are captured in the spout: this leads to an increase of their average cycle time. Conversely from the previous case, the bypass phenomenon is absent: the experimental residence time (τexp = 731 s) is 9.43% greater than the theoretical one (τth = 668 s) for an equivalent in volume CSTR reactor. This effect is very likely ascribable to the larger plug-flow effect that arises with higher bed heights. Increasing the bed heights makes particles travel a longer distance in the parallelepipedal section of the SB, where mixing is minimal, and particles just descend vertically in a plug-flow manner. This is valuable information if the goal is to tune the overall residence time in the device.

3.3. Influence of the Number of Units

After the analyses on the single unit, we extended the set-up to also include a second spouted unit. Figure 6 depicts the obtained E(t) and F(t) curves. The differences with the Test 1 are evident and coherent with the expected behavior. Adding a second unit causes particles to reside in the device for a longer time, and the E(t) peak is only reached after more than 400 s. This is beneficial, as it strongly hinders the particle by-pass. While in the previous case more than 80% of particles managed to escape the device within 1000 s, roughly a double amount of time is now required to achieve the same result.
By a comparison with the theoretical curves, obtained for a series of two identical CSTRs, we can gather some considerations. There is a perfect superposition of the experimental and theoretical curves in the initial period. This could not be achieved in the previous case, where the experimental curve had a visible delay. After this initial part, the two curves reach their respective peaks, even though the experimental one does so in a shorter time. This may be explained considering how particles enter the two units. In the first one, they fall vertically from the box that is shown in Figure 1, and hence immediately start their trajectories in the annulus. Conversely, when they travel from the first to the second module, their velocity can also have a non-null horizontal component. Hence, they can possibly directly enter the fountain, creating a small by-pass effect. Finally, the difference between the final values of the two F(t) curves is like the previous case, proving that the addition of the second module does not create further dead-zone effects.
From Equation (5), using the same procedure presented before, is now possible to calculate both residence times: τexp = 815 s and τth = 861 s. As in Test 1, the experimental value is slightly lower than the theoretical one, obtained with two ideal CSTRs in series. This may again be ascribable to a moderate by-pass effect, resulting in some particles to leave the device sooner than expected. The difference is however not very marked, confirming both the good mixing properties of this square-based unit and its assimilability to a series of CSTRs.

3.4. Final Comments

The previous paragraphs have highlighted that the SBs composing this device can be well compared to ideal CSTRs, as they yield very similar RTDs. Visual observations proved that black particles get evenly mixed throughout the volume, and there is no dead zone. Some black particles remain attached to the transparent wall due to electrostatic forces, but their amount is negligible. Table 4 sums up the experimental and theoretical residence times τ that were obtained for the three analyzed configurations. It is interesting to observe that the by-pass effect decreases in intensity when employing a second unit. This confirms that the previously-described design of the slits makes particle travel from one unit to another by spillway, as intended. This way, particles reaching the following unit tend to fall onto the annulus, and have to go through at least a whole cycle before reaching the opposite side of the SB.
In a previous work [45], we employed CFD-DEM simulations to evaluate the RTD of the present SB. Because of the computational complexity of these simulations, the RTD function could not be directly obtained, but we showed three alternative methods that achieve the same results taking advantage of the simulation approach. In particular, we observed that the SB can be well assimilated to a rather complex network of CSTRs and PFRs. With such a network, we estimated an average residence time of 396 s for Test 1, only approximately 4% less than the experimental value and hence closer to it than the theoretical value.
An aspect worth pointing out is the functioning of the squared configuration: while it guarantees a greater thermal stability, it may feature some solids by-pass flows. This is because particles need to travel a lower distance to move from one unit to the other, thus decreasing the overall residence time. On the one hand, the effect should be damped by the flow regime: particles should fall onto the bed and be immediately captured in the annulus, and then equally scattered in all directions by the stochastic action of the fountain. Nonetheless, preliminary experiments have shown that the squared configuration experiences a very moderate reduction in the residence time distribution. This matter will be addressed in greater detail in future works.
To sum up, both ideal CSTRs or a more complex CFD-based network can be valid tools to estimate the RTD of this multiple SB device. The latter seems more accurate and physically based but also more complex to handle. The proposed procedure, expanded to the cases of three and four units, will be addressed in future works. When dealing with the pyrolysis of biomass, the final application of this reactor, these approaches can become key tools to choose the operative conditions and tune the output. Indeed, the average residence time is a key variable in slow pyrolysis, and its value strongly affects the properties of the produced biochar [53,54]. Reacting biomass particles actually behave quite differently from PET: their initial properties are more irregular, and their size and density change over time due to chemical reactions [55]. While this is expected to affect their flow behavior, the good mixing behavior that we observed in these ideal conditions is promising for the pyrolysis experiments.

4. Conclusions

The RTD of a multiple square-based spouted bed reactor was evaluated in this work. An experimental cold flow wood reactor has been conceived and built: it is composed of a cascade of four units. A preliminary study of residence times for one and two modules and for two different bed heights has been experimentally performed and compared with theoretical descriptions of RTD curves.
The experiments highlighted that each spouted bed unit can be well assimilated to an ideal CSTR, as it yields a very similar RTD function, except for some entrance and wall effects. The average residence time is slightly lower than that of an ideal reactor, possibly proving the presence of a small by-pass effect. The opposite happens when working with a higher bed, as the flow regime is affected by a more relevant plug flow zone. When employing two spouted beds, the by-pass effect becomes less pronounced; this is ascribable to the proper design of the slits connecting the units.
The results and the knowledge acquired from these tests at room temperature will be used for the construction of a prototype reactor for pyrolysis and gasification. The number of units and the bed height are the tuning variable through which it is possible to modify the overall residence time of biomass. While choosing these, the two theoretical approaches described in the last Section will provide a significant contribution, as we will show in future works.

Author Contributions

Conceptualization, M.C. and G.R.; methodology, M.C. and M.T.; validation, F.M., M.C. and C.M.; formal analysis, F.M., M.C., M.T. and C.M.; investigation, M.C. and M.T.; resources, M.C. and G.R.; writing—original draft preparation, F.M., M.C., M.T. and C.M.; writing—review and editing, G.R., E.A. and B.B.; visualization, F.M.; supervision, G.R., E.A. and B.B.; project administration, B.B.; funding acquisition, G.R., E.A. and B.B. All authors have read and agreed to the published version of the manuscript.

Funding

This research was funded by Regione Piemonte, grant number CUP J97H17000740009, through the ‘Biochar’ project (“Valorizzazione di scarti di origine agroalimentare e di industria tessile per la produzione di char”).

Conflicts of Interest

The authors declare no conflict of interest. The funders had no role in the design of the study; in the collection, analyses, or interpretation of data; in the writing of the manuscript, or in the decision to publish the results.

References

  1. Epstein, N.; Grace, J.R. Spouted and Spout-Fluid Beds; Epstein, N., Grace, J.R., Eds.; Cambridge University Press: Cambridge, UK, 2010; ISBN 9780511777936. [Google Scholar]
  2. Marshall, D.W. Spouted bed design considerations for coated nuclear fuel particles. Powder Technol. 2017. [Google Scholar] [CrossRef]
  3. de Freitas, L.A.P. Pharmaceutical applications of spouted beds: A review on solid dosage forms. Particuology 2018. [Google Scholar] [CrossRef]
  4. Olazar, M.; San José, M.J.; Zabala, G.; Bilbao, J. New reactor in jet spouted bed regime for catalytic polymerizations. Chem. Eng. Sci. 1994, 49, 4579–4588. [Google Scholar] [CrossRef]
  5. Mollick, P.K.; Venugopalan, R.; Roy, M.; Rao, P.T.; Sathiyamoorthy, D.; Sengupta, P.; Sharma, G.; Basak, C.B.; Chakravartty, J.K. Deposition of diversely textured buffer pyrolytic carbon layer in TRISO coated particle by controlled manipulation of spouted bed hydrodynamics. Chem. Eng. Sci. 2015, 128, 44–53. [Google Scholar] [CrossRef]
  6. Massaro Sousa, L.; Ferreira, M.C. On the performance of a spouted bed type device for feeding spent coffee grounds to a circulating fluidized bed reactor. Chem. Eng. Res. Des. 2020, 160, 31–38. [Google Scholar] [CrossRef]
  7. Cundall, P.A.; Strack, O.D.L. A discrete numerical model for granular assemblies. Géotechnique 1979, 29, 47–65. [Google Scholar] [CrossRef]
  8. Du, S.; Sun, Y.; Gamliel, D.P.; Valla, J.A.; Bollas, G.M. Catalytic pyrolysis of miscanthus giganteus in a spouted bed reactor. Bioresour. Technol. 2014, 169, 188–197. [Google Scholar] [CrossRef]
  9. Amutio, M.; Lopez, G.; Alvarez, J.; Olazar, M.; Bilbao, J. Fast pyrolysis of eucalyptus waste in a conical spouted bed reactor. Bioresour. Technol. 2015, 194, 225–232. [Google Scholar] [CrossRef]
  10. Arregi, A.; Amutio, M.; Lopez, G.; Artetxe, M.; Alvarez, J.; Bilbao, J.; Olazar, M. Hydrogen-rich gas production by continuous pyrolysis and in-line catalytic reforming of pine wood waste and HDPE mixtures. Energy Convers. Manag. 2017, 136, 192–201. [Google Scholar] [CrossRef]
  11. Elordi, G.; Olazar, M.; Lopez, G.; Amutio, M.; Artetxe, M.; Aguado, R.; Bilbao, J. Catalytic pyrolysis of HDPE in continuous mode over zeolite catalysts in a conical spouted bed reactor. J. Anal. Appl. Pyrolysis 2009, 85, 345–351. [Google Scholar] [CrossRef]
  12. Aguado, R.; Prieto, R.; José, M.J.S.; Alvarez, S.; Olazar, M.; Bilbao, J. Defluidization modelling of pyrolysis of plastics in a conical spouted bed reactor. Chem. Eng. Process. Process Intensif. 2005, 44, 231–235. [Google Scholar] [CrossRef]
  13. López, G.; Olazar, M.; Aguado, R.; Bilbao, J. Continuous pyrolysis of waste tyres in a conical spouted bed reactor. Fuel 2010, 89, 1946–1952. [Google Scholar] [CrossRef]
  14. Alvarez, J.; Lopez, G.; Amutio, M.; Artetxe, M.; Barbarias, I.; Arregi, A.; Bilbao, J.; Olazar, M. Characterization of the bio-oil obtained by fast pyrolysis of sewage sludge in a conical spouted bed reactor. Fuel Process. Technol. 2016, 149, 169–175. [Google Scholar] [CrossRef]
  15. Rasul, M.G. Spouted bed combustion of wood charcoal: Performance comparison of three different designs. Fuel 2001, 80, 2189–2191. [Google Scholar] [CrossRef]
  16. San José, M.J.; Alvarez, S.; Peñas, F.J.; García, I. Thermal exploitation of fruit tree pruning wastes in a novel conical spouted bed combustor. Chem. Eng. J. 2014, 238, 227–233. [Google Scholar] [CrossRef]
  17. San José, M.J.; Alvarez, S.; García, I.; Peñas, F.J. Conical spouted bed combustor for clean valorization of sludge wastes from paper industry to generate energy. Chem. Eng. Res. Des. 2014, 92, 672–678. [Google Scholar] [CrossRef]
  18. Konduri, R.K.; Altwicker, E.R.; Morgan, M.H. Design and scale-up of a spouted-bed combustor. Chem. Eng. Sci. 1999, 54, 185–204. [Google Scholar] [CrossRef]
  19. Uemaki, O.; Tsuji, T. Gasification of a sub-bituminous coal in a two-stage jet spouted bed reactor. In Fluidization; Engineering Foundation: New York, NY, USA, 1986; pp. 497–504. [Google Scholar]
  20. Bove, D.; Moliner, C.; Curti, M.; Baratieri, M.; Bosio, B.; Rovero, G.; Arato, E. Preliminary tests for the thermo-chemical conversion of biomass in a spouted bed pilot plant. Can. J. Chem. Eng. 2018. [Google Scholar] [CrossRef] [Green Version]
  21. Paterson, N.; Reed, G.P.; Dugwell, D.R.; Kandiyoti, R. Gasification tests with sewage sludge and coal/sewage sludge mixtures in a pilot scale, air blown, spouted bed gasifier. In Proceedings of the Volume 1: Turbo Expo 2002, ASME, Amsterdam, The Netherlands, 3–6 June 2002; pp. 197–202. [Google Scholar]
  22. Yasin, S.; Curti, M.; Rovero, G.; Behary, N.; Perwuelz, A.; Giraud, S.; Migliavacca, G.; Chen, G.; Guan, J. An alternative for the end-of-life phase of flame retardant textile products: Degradation of flame retardant and preliminary settings of energy valorization by gasification. BioResources 2017, 12, 5196–5211. [Google Scholar] [CrossRef]
  23. Alvarez, J.; Lopez, G.; Cortazar, M.; Santamaria, L.; Fernandez, E.; Olazar, M. Development of the conical spouted bed technology for biomass and waste plastic gasification. In Sustainable Alternative Syngas Fuel [Working Title]; IntechOpen: London, UK, 2019. [Google Scholar]
  24. Pietsch, S.; Heinrich, S.; Karpinski, K.; Müller, M.; Schönherr, M.; Kleine Jäger, F. CFD-DEM modeling of a three-dimensional prismatic spouted bed. Powder Technol. 2016. [Google Scholar] [CrossRef]
  25. Wang, Z.; Lim, C.J.; Grace, J.R. Solids mixing in a dual-column slot-rectangular spouted bed. Powder Technol. 2016, 301, 1264–1269. [Google Scholar] [CrossRef]
  26. Alvarez, J.; Lopez, G.; Amutio, M.; Mkhize, N.M.; Danon, B.; van der Gryp, P.; Görgens, J.F.; Bilbao, J.; Olazar, M. Evaluation of the properties of tyre pyrolysis oils obtained in a conical spouted bed reactor. Energy 2017, 128, 463–474. [Google Scholar] [CrossRef]
  27. Darwish, A.S.; Zewail, T.M.; Yousef, N.S.; El-Tawail, Y.A. Investigation of the performance of a batch air spouting bed in conducting ion exchange reactions involving heavy metal removal. J. Taiwan Inst. Chem. Eng. 2015, 47, 171–176. [Google Scholar] [CrossRef]
  28. Cortazar, M.; Alvarez, J.; Lopez, G.; Amutio, M.; Santamaria, L.; Bilbao, J.; Olazar, M. Role of temperature on gasification performance and tar composition in a fountain enhanced conical spouted bed reactor. Energy Convers. Manag. 2018, 171, 1589–1597. [Google Scholar] [CrossRef]
  29. Moliner, C.; Marchelli, F.; Curti, M.; Bosio, B.; Rovero, G.; Arato, E. Spouting behaviour of binary mixtures in square-based spouted beds. Particuology 2019, 43, 193–201. [Google Scholar] [CrossRef]
  30. Moliner, C.; Marchelli, F.; Bosio, B.; Arato, E. Modelling of spouted and spout-fluid beds: Key for their successful scale up. Energies 2017, 10, 1729. [Google Scholar] [CrossRef] [Green Version]
  31. Bove, D.; Moliner, C.; Curti, M.; Rovero, G.; Baratieri, M.; Bosio, B.; Arato, E.; Garbarino, G.; Marchelli, F. Experimental studies on the gasification of the residues from prune of apple trees with a spouted bed reactor. In Proceedings of the European Biomass Conference and Exhibition Proceedings, Amsterdam, The Netherlands, 6–9 June 2016; Volume 2016, pp. 858–862. [Google Scholar]
  32. Makibar, J.; Fernandez-Akarregi, A.R.; Amutio, M.; Lopez, G.; Olazar, M. Performance of a conical spouted bed pilot plant for bio-oil production by poplar flash pyrolysis. Fuel Process. Technol. 2015, 137, 283–289. [Google Scholar] [CrossRef]
  33. Madhiyanon, T.; Soponronnarit, S.; Tia, W. Industrial-scale prototype of continuous spouted bed paddy dryer. Dry. Technol. 2001, 19, 207–216. [Google Scholar] [CrossRef]
  34. Liu, X.; Zhong, W.; Yu, A.; Xu, B.; Lu, J. Mixing behaviors in an industrial-scale spout-fluid mixer by 3D CFD-TFM. Powder Technol. 2016. [Google Scholar] [CrossRef]
  35. Jacob, M. ProCell technology: Modelling and application. Powder Technol. 2009, 189, 332–342. [Google Scholar] [CrossRef]
  36. Rovero, G.; Curti, M.; Cavaglià, G. Optimization of Spouted bed scale-up by square-based multiple unit design. Adv. Chem. Eng. 2012. [Google Scholar] [CrossRef]
  37. Saidutta, M.B.; Murthy, D.V.R. Mixing behaviour of solids in multiple spouted beds. Can. J. Chem. Eng. 2000, 78, 382–385. [Google Scholar] [CrossRef]
  38. Albina, D.O. Combustion of rice husk in a multiple-spouted fluidized bed. Energy Sources 2003, 25, 893–904. [Google Scholar] [CrossRef]
  39. Wolf, D.; Resnick, W. Residence time distribution in real systems. Ind. Eng. Chem. Fundam. 1963, 2, 287–293. [Google Scholar] [CrossRef]
  40. Danckwerts, P.V. Continuous flow systems: Distribution of residence times. Chem. Eng. Sci. 1953, 2, 1–13. [Google Scholar] [CrossRef]
  41. Choi, B.S.; Wan, B.; Philyaw, S.; Dhanasekharan, K.; Ring, T.A. Residence time distributions in a stirred tank: Comparison of CFD predictions with experiment. Ind. Eng. Chem. Res. 2004, 43, 6548–6556. [Google Scholar] [CrossRef]
  42. Zhang, L.; Pan, Q.; Rempel, G.L. Residence time distribution in a multistage agitated contactor with newtonian fluids: CFD prediction and experimental validation. Ind. Eng. Chem. Res. 2007, 46, 3538–3546. [Google Scholar] [CrossRef]
  43. Chen, K.; Bachmann, P.; Bück, A.; Jacob, M.; Tsotsas, E. CFD simulation of particle residence time distribution in industrial scale horizontal fluidized bed. Powder Technol. 2019, 345, 129–139. [Google Scholar] [CrossRef]
  44. Lan, B.; Xu, J.; Zhao, P.; Zou, Z.; Zhu, Q.; Wang, J. Long-time coarse-grained CFD-DEM simulation of residence time distribution of polydisperse particles in a continuously operated multiple-chamber fluidized bed. Chem. Eng. Sci. 2020, 219, 115599. [Google Scholar] [CrossRef]
  45. Marchelli, F.; Moliner, C.; Curti, M.; Bosio, B.; Arato, E. CFD-DEM simulations of a continuous square-based spouted bed and evaluation of the solids residence time distribution. Powder Technol. 2020, 366, 840–858. [Google Scholar] [CrossRef]
  46. Berghel, J.; Nilsson, L.; Renström, R. Particle mixing and residence time when drying sawdust in a continuous spouted bed. Chem. Eng. Process. Process Intensif. 2008, 47, 1246–1251. [Google Scholar] [CrossRef]
  47. Al-Juwaya, T.; Ali, N.; Al-Dahhan, M. Investigation of hydrodynamics of binary solids mixture spouted beds using radioactive particle tracking (RPT) technique. Chem. Eng. Res. Des. 2019, 148, 21–44. [Google Scholar] [CrossRef]
  48. Pietsch, S.; Schönherr, M.; Kleine Jäger, F.; Heinrich, S. Measurement of residence time distributions in a continuously operated spouted bed. Chem. Eng. Technol. 2020, 43, 804–812. [Google Scholar] [CrossRef] [Green Version]
  49. Moliner, C.; Curti, M.; Bosio, B.; Arato, E.; Marchelli, F.; Rovero, G. A new flexible process to obtain fertilisers from lignocellulosic and wool residues. Rivista di Studi sulla Sostenibilità 2020, in press. [Google Scholar]
  50. Mathur, K.B.; Epstein, N. Developments in spouted bed technology. Can. J. Chem. Eng. 1974, 52, 129–144. [Google Scholar] [CrossRef]
  51. Becker, H.A.; Sallans, H.R. Drying wheat in a spouted bed: On the continuous, moisture diffusion controlled drying of solid particles in a well-mixed, isothermal bed. Chem. Eng. Sci. 1961, 13, 97–112. [Google Scholar] [CrossRef]
  52. Fogler, H.S. Elements of Chemical Reaction Engineering (5th Edition) (Prentice Hall International Series in the Physical and Chemical Engineering Sciences); Prentice Hall: Upper Saddle River, NJ, USA, 2016; ISBN 978-0-13-388751-8. [Google Scholar]
  53. Tripathi, M.; Sahu, J.N.; Ganesan, P. Effect of process parameters on production of biochar from biomass waste through pyrolysis: A review. Renew. Sustain. Energy Rev. 2016, 55, 467–481. [Google Scholar] [CrossRef]
  54. Kan, T.; Strezov, V.; Evans, T.J. Lignocellulosic biomass pyrolysis: A review of product properties and effects of pyrolysis parameters. Renew. Sustain. Energy Rev. 2016, 57, 1126–1140. [Google Scholar] [CrossRef]
  55. Patuzzi, F.; Ciuta, S.; Castaldi, M.J.; Baratieri, M. Intraparticle gas sampling during wood particle pyrolysis: Methodology assessment by means of thermofluidynamic modeling. J. Anal. Appl. Pyrolysis 2015, 113, 638–645. [Google Scholar] [CrossRef]
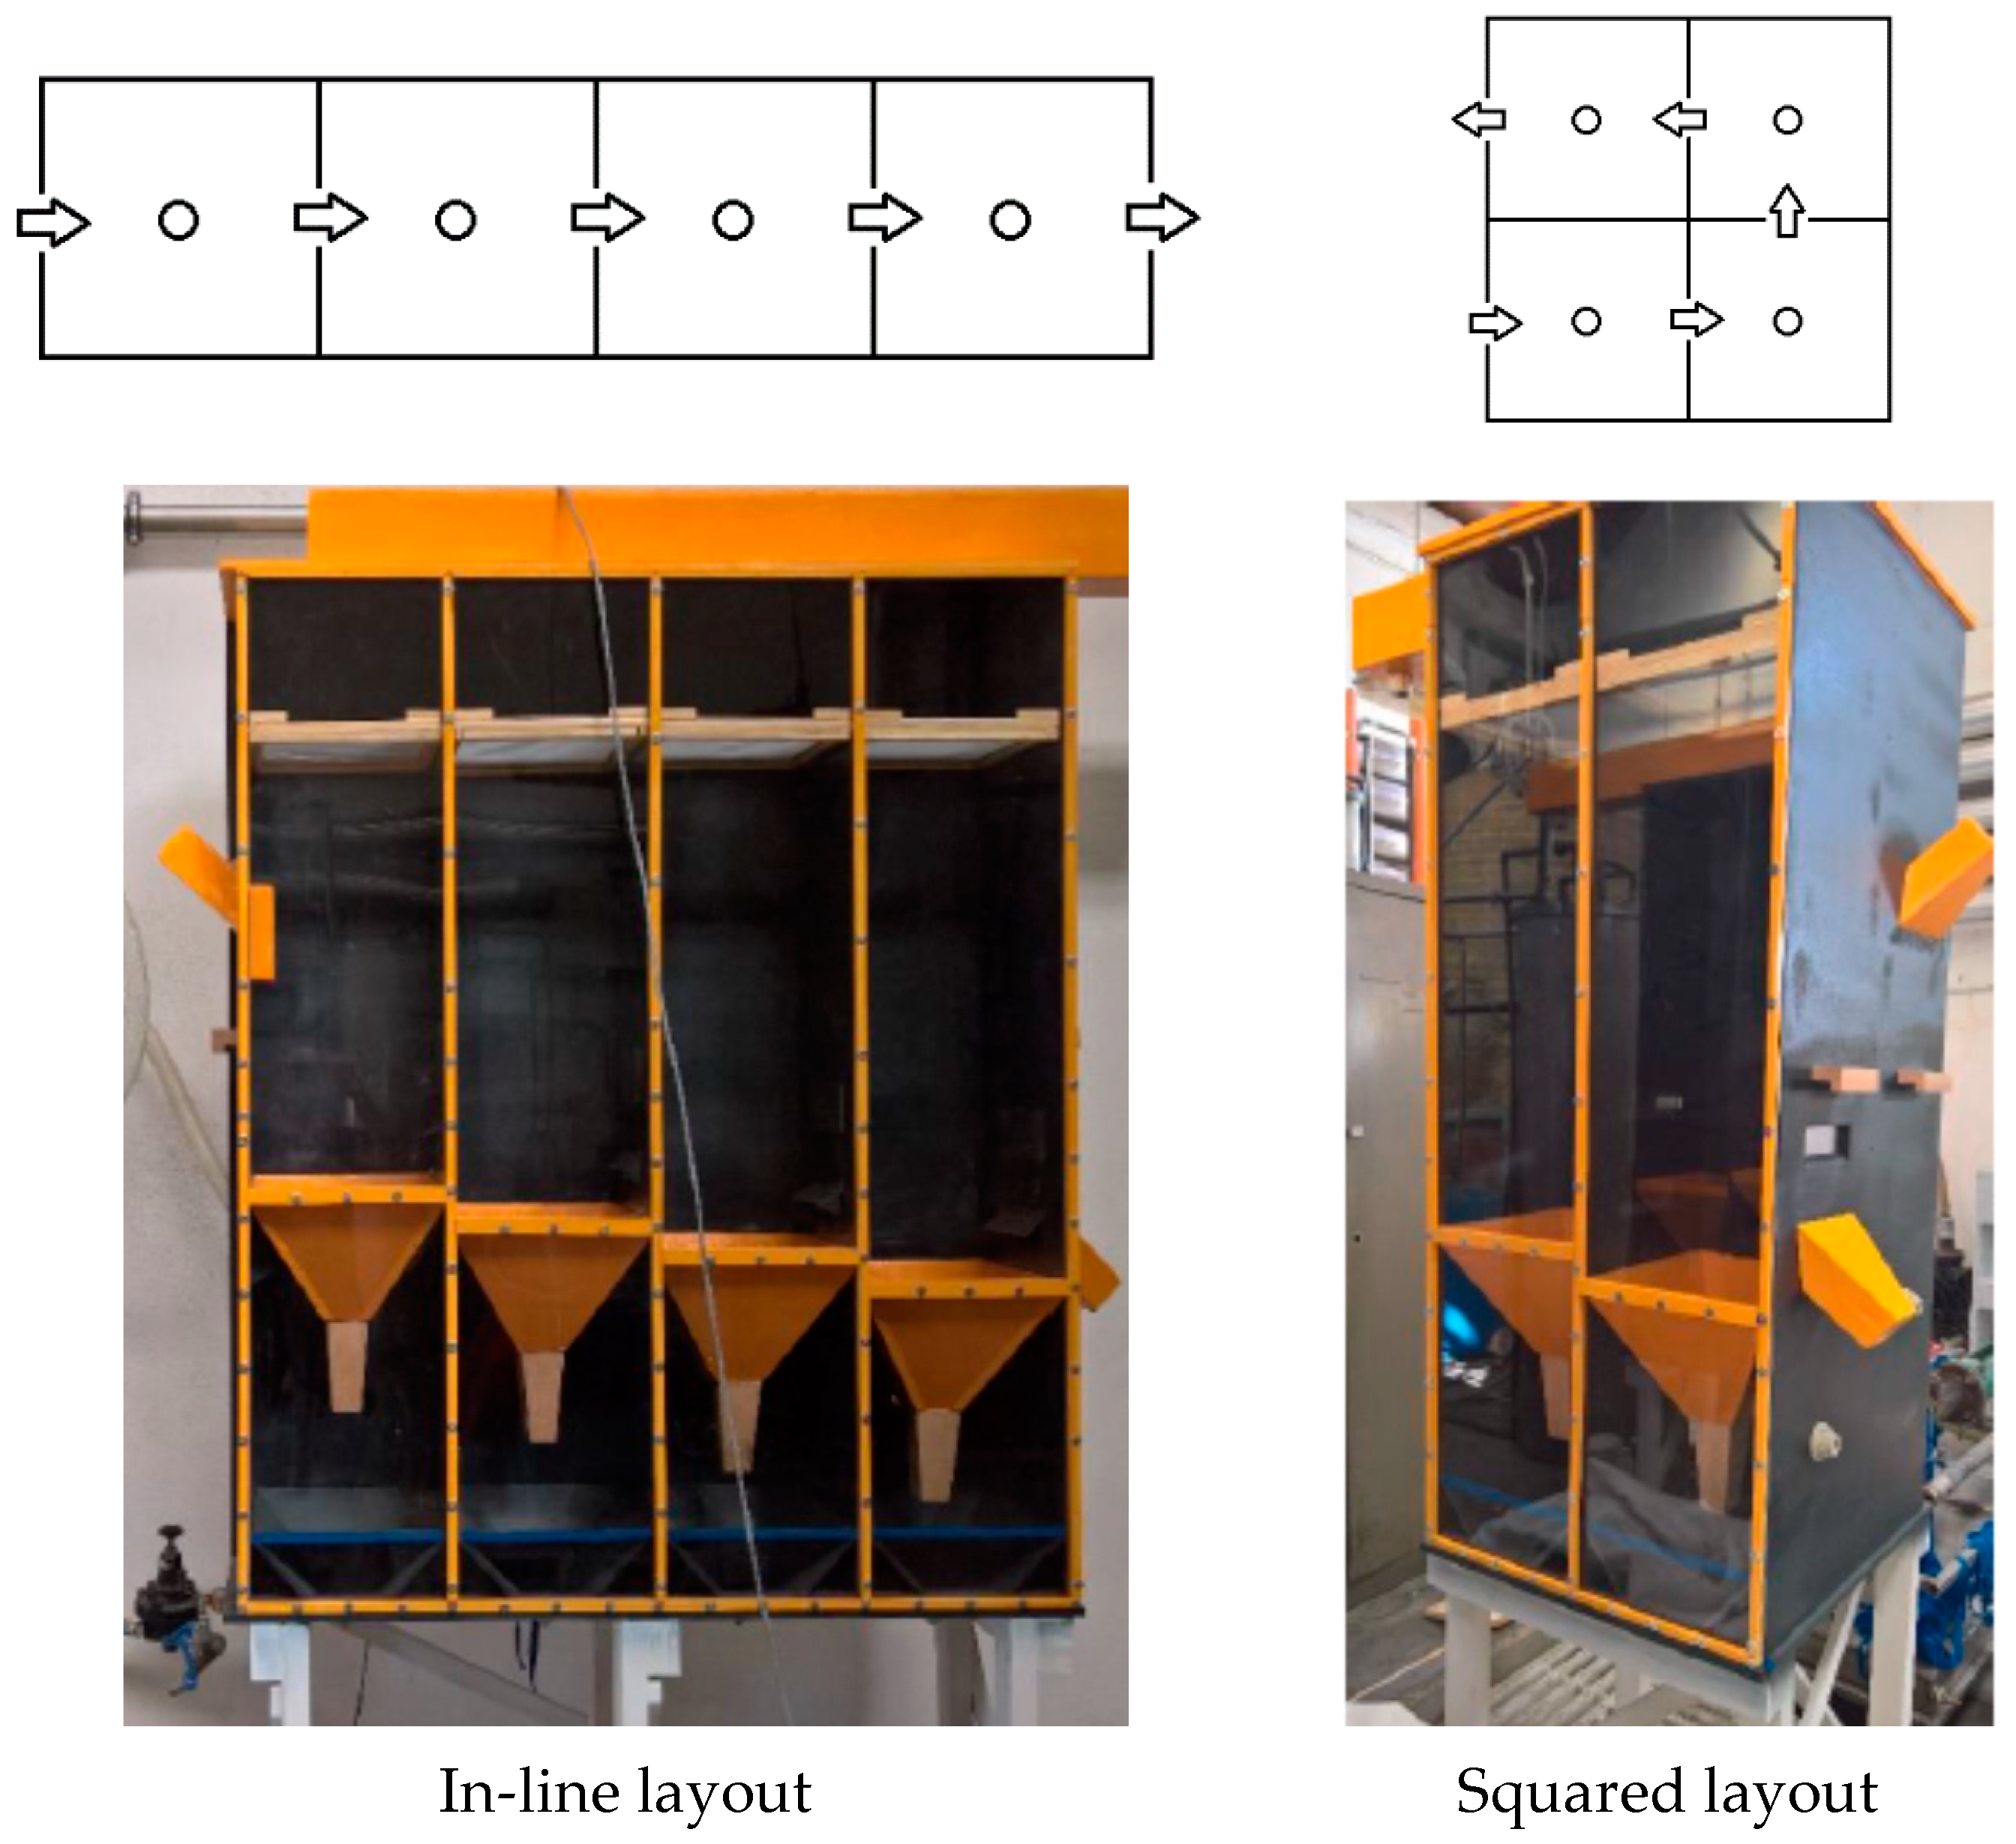
Figure 1. The two multi-spouted fluidization units.
Energies 13 04694 g001
Figure 2. The layouts of the two multi-spouted units: 1—flowmeter; 2—air line and regulation valves; 3—experimental unit 1 × 4; 4—lower air inlet; 5—upper air inlet; 6—pyramid frustum; 7—solid inlet and distributor box; 8—solid outlet; 9—overflow plate; 10—experimental unit 2 × 2.
Energies 13 04694 g002
Figure 3. Operational gas flow rates at different bed depths.
Energies 13 04694 g003
Figure 4. Experimental and theoretical E(t) (left) and F(t) (right) curves for Test 1.
Energies 13 04694 g004
Figure 5. Experimental and theoretical E(t) (left) F(t) (right) curves for Test 2.
Energies 13 04694 g005
Figure 6. Experimental and simulated E(t) (left) F(t) (right) curves for Test 3.
Energies 13 04694 g006
Table 1. Geometrical parameters of a single module.
DimensionValue
Base side (L)0.3 m Energies 13 04694 i001
Bottom side (Lb)0.035 m
Lower section height (Hi)0.40 to 0.55 m
Upper section height (Hs)1.25 to 1.40 m
Total height (H)1.8 m
Pyramid slope (θ)60°
Pyramid height (Hp)0.23 m
Gas inlet length (Hg)0.15 m
Gas inlet diameter (Dg)0.03 m
Solids outlet height (Ho)0.05 or 0.19 m
Solids outlet clearance size (Hc × Wc 1)0.2 × 0.05 m2
Solids distributor box dimensions (Ls × Hs × Ws 1)0.05 × 0.15 × 0.2 m3
Solids distributor height (Hd)0.22 m
1 Wc and Ws do not appear in the image due to its bi-dimensional nature; they represent widths.
Table 2. Properties of the PET particles.
DimensionValue
Length0.002 m Energies 13 04694 i002
Major axis0.0026 m
Minor axis0.0021 m
White PET density1338 kg/m3
Black PET density1389 kg/m3
Void fraction0.39
White PET bulk density816 kg/m3
Table 3. Conditions of the experimental tests.
Test IDN of UnitsBed Depth (m)Solid Flow Rate (g/s)Air Flow Rate per Unit (Nm3/h)
110.281.52110
210.421.52160
320.281.41110
Table 4. Experimental and theoretical average residence times for the studied configurations.
Test IDτexp (s)τth (s) τ th τ exp τ exp · 100
14114458.27%
2731668−8.62%
38158615.64%