Abstract
The common use of electric lighting in interiors has led to the need to search for user- and environmentally-friendly solutions. In this research, the impact of the luminaires and room parameters on the selected parameters of general lighting in interiors was assessed. To achieve the objective of this work, a computer simulation and statistical analysis of results were conducted. The illuminance uniformity on work plane, ceiling and wall relative illuminances, utilance, and normalized power density of lighting installations for 432 situations were analyzed in detail. The scenarios were varied in terms of room size, reflectance, lighting class, luminaire downward luminous intensity distribution, and layout. The lighting class was a factor having the highest impact on ceiling and wall illumination, utilance, and power. It was also shown that the impact of lighting class on ceiling illumination, utilance and power, was different in interiors of various sizes. The impact of reflectances and luminaire layouts on the analyzed parameters was significantly lower. The results also demonstrated that the use of different lighting classes gave the possibility of reducing the power of general lighting in interiors at a level of 30% on average. Based on the results, a classification of energy efficiency in general lighting in interiors was also proposed. Understanding the correlations between the lighting system used and the effects achieved is helpful in obtaining comfortable and efficient lighting solutions in interiors.
1. Introduction
Lighting is an essential topic in any debate on a building’s environment. It is an important element of smart cities and buildings [1]. The significance of electric lighting arises from the wide range of its use and the large number of people’s needs to be met [2].
The use of electric lighting in the modern world is common. With ongoing urbanization and societies growing wealthier and more active, the demand for lighting systems is increasing. The large scale use of artificial lighting forces us to search for the solutions that are energy-efficient [3,4,5], environmentally friendly [6,7], and economically rational [8,9]. These three aspects are very important while evaluating any lighting solution. However, they cannot obscure the pursuit of the fundamental lighting function which is the need to create a luminous environment enabling people to work and stay in private and public spaces efficiently, comfortably and, as a consequence, safely [10,11].
Creating a good luminous environment has an impact on the human body and psyche. Lighting determines the efficiency of visual activities [12,13] and regulates circadian-featured life processes [14,15]. It can also affect the perception of lit spaces and objects [16,17], and determine feelings, emotions, moods, and behavior [18,19]. It is also associated with the aesthetic reception of illuminated places [20,21].
Investigating lighting quality is a fundamental scientific topic in contemporary illuminating engineering [22,23,24], including the issues of smart cities and buildings [25]. Studying relationships between the quality of luminous environment and energy efficiency of lighting solution in interiors has been an important research issue for a long time and is demonstrated in this paper.
The luminous environment and energy efficiency of lighting solutions in interiors are subject to assessment. The basic evaluation criteria include, as follows [26,27]:
- The level of illuminance and uniformity on the work plane;
- The level of illuminance and uniformity on the ceiling,
- The level of illuminance and uniformity on walls;
- The level of cylindrical illuminance and uniformity on the reference plane;
- The distribution of modeling index on the reference plane;
- The level of glare and luminaire luminance;
- The light color and fidelity of color rendering;
- The level of power and energy consumption of lighting.
Illuminance distribution on work planes, ceiling, and walls, in conjunction with the reflectances of these planes, significantly affects luminance distribution in interiors. The luminance distribution determines a degree of visual adaptation, performance, and comfort. The interior perception and general satisfaction associated with staying in the illuminated spaces is connected with the luminance distribution. Considering the possibilities of creating the different illuminance distributions that affect the luminance distribution in interiors is an interesting research issue.
The practical evaluation of the work plane, ceiling, and wall illumination in interiors consists of checking compliance with normative criteria. These requirements in the European Union countries are specified in the standard [26]. As for illuminating the work plane, they apply to checking the average illuminance and uniformity levels. These requirements are specified, among others, depending on a type of the room and visual activities performed. In terms of the ceiling and wall illumination, the requirements also apply to checking the average illuminance and uniformity levels, as well as the reflectances of the ceiling, walls, floor, and large objects in the interior.
The practical assessment of lighting energy efficiency involves checking its compliance with normative requirements either. These criteria in the EU countries are specified in the standard [27]. Formally, the requirements apply to the assessment of entire buildings based on lighting power or energy density. Development of LED technology and a significant improvement in the luminous efficacy of LED light sources force us to verify power and energy density levels to evaluate the energy efficiency of lighting solutions.
Searching for the most satisfactory lighting solution in a room is a challenging task [28,29]. Apart from the demand for meeting a large number of requirements, it also arises from a multitude of other factors that should be taken into account in this process. These factors apply to rooms, lighting systems, and ways to use them for illumination. The difficulty in searching for a good solution also results from a multitude of connections between the lighting systems used and the effects achieved.
One of the scientific topics undertaken in this area is an attempt to determine a degree of impact of the parameters characterizing rooms, luminaires, and their layouts on the parameters characterizing the luminous environment and energy efficiency of interior lighting. The research in this area is carried out by Makaremi et al. and the results are presented in two publications [30,31].
In their first paper [30], the impact of interior reflectances on the levels of three photometric parameters, average illuminance and uniformity on the work plane and discomfort glare index, was assessed. In a small room illuminated with one luminaire centrally located on the ceiling, the photometric parameters for 64 lighting scenarios were calculated. The situations were varied in ceiling, wall, and floor reflectances. It was found that the wall reflectance had the highest impact, and the floor reflectance had a negligible effect on the analyzed photometric parameters.
In their second paper [31], the impact of interior reflectances, luminaire type, number of luminaires, and luminaire suspension height on the levels of the same three photometric parameters and lighting power was assessed. In the same small room, the analyzed parameters were calculated for 135 lighting scenarios. They were differentiated by the interior reflectances, luminaire type, and the number and suspension height of the luminaires. It was found that the luminaire type had a decisive impact on the analyzed photometric parameters. The significant impact of reflectances on the photometric parameters was confirmed and their effect on the lighting power was also noticed. It was estimated that as a result of using high reflectance in the interior, a reduction of 45% in electricity consumption could be expected. The need to integrate various lighting strategies in the quest of providing low energy demand and high lighting quality in interiors was also recognized.
The gained results have high cognitive values, however, they refer to the narrowed cases, including the room size. It is also worth paying attention to the supposition presented in the conclusions that in the larger rooms, “the influence of different lighting strategies and surface properties on energy consumption and visual comfort might be significantly higher” [31].
Bearing in mind the importance and complexity of this issue, it is purposeful to conduct research in this area and to take into account the impact of other parameters characterizing the room and the way of illumination, as well as other lighting parameters in interiors. That is why this task was undertaken and the results gained are presented in this paper.
The main objectives of this research were as follows:
- To determine the levels of uniformity on the work plane, ceiling and wall relative illuminances, lighting installation utilance, and normalized power density for general lighting in interiors;
- To evaluate the impact of room characteristics, luminaires, and their layouts on the uniformity of the work plane, ceiling and wall relative illuminances, lighting installation utilance, and normalized power density for general lighting in interiors;
- To present the proposal for the energy efficiency classification for general lighting in interiors.
The original contributions of this research were as follows:
- To extend the scope of research in the undertaken topic in terms of room sizes, lighting classes, luminous intensity distributions, and layouts of general lighting luminaires;
- To extend the scope of research in the undertaken topic in terms of the interior lighting parameters—uniformity on work plane, ceiling and wall relative illuminances, lighting installation utilance, and normalized power density—for general lighting in interiors,
- To propose a classification, for the assessment of the energy efficiency of interior lighting, based on the normalized power density.
2. Methods
To achieve the objective of this work, the results of the computer simulations and their statistical analysis were used. The calculations of the parameters characterizing the quality of luminous environment in interiors were made using the DIALux 4.13 software. It is a tool verified [32] and used in research on interior lighting [30,31,33,34]. The Statistica package [35] was applied to calculate the lighting power and to analyze the results. Before starting the computer simulation, it was necessary to make some assumptions about the rooms, luminaires, their layouts, and calculations.
2.1. Luminaires
For this research, 16 types of luminaires with different theoretical and rotationally symmetrical luminous intensity distributions were selected. The luminaires representing 4 lighting classes and 4 widths of luminaire downward luminous intensity distribution were investigated. The CIE (International Commission on Illumination) luminous flux indices [36] were selected to describe the luminaire lighting class and width of downward luminous intensity distribution.
The use of different lighting classes is associated with the distribution of luminous flux of luminaires in the range of lower and upper hemisphere. The CIE luminous flux index N4 of a luminaire was accepted as the parameter describing the lighting class. The lighting classes were labeled with Roman numerals (I—direct lighting: N4 = 1.00, II—semi direct lighting: N4 = 0.75, III—direct-indirect lighting: N4 = 0.50, IV—semi indirect lighting: N4 = 0.25).
Four widths of luminaire downward luminous intensity distribution were considered for each lighting class. The CIE luminous flux index N1 of a luminaire was accepted as the parameter describing the distribution width. The luminaire downward luminous intensity distributions were labeled with Arabic numerals (1—the widest distribution: N1 = 0.44, 2—the relatively wide distribution: N1 = 0.58, 3—the relatively narrow distribution: N1 = 0.69, 4—the narrowest distribution: N1 = 0.77).
The luminous flux value of luminaires was individually adjusted in each lighting situation. The luminous efficacy (LE) of luminaires equal to 100 lm/W and light output ratio (LOR) of luminaires equal to 0.80 were also assumed to calculate the lighting power. The luminous intensity distributions, markings, and percentage values of the CIE luminous flux indices of the luminaires for the research are presented in Figure 1.
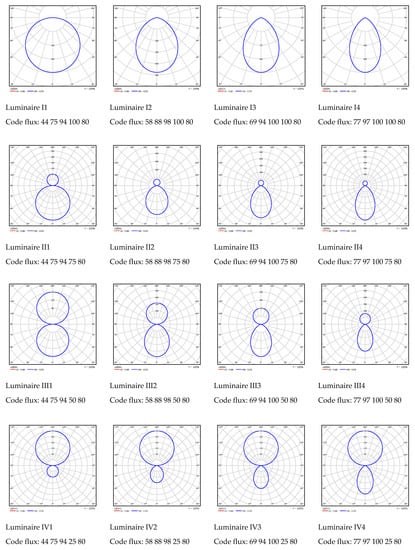
Figure 1.
Characteristics of the luminaires for the study.
2.2. Rooms and Luminaire Layouts
In order to investigate the impact of room characteristics and luminaire layouts on the photometric parameters and lighting power, it was necessary to make some assumptions regarding the room size, reflectances, and luminaire layouts. The following assumptions were made:
- The empty rooms with a square base (floor) were considered;
- The height of work plane was assumed at the height of 0.75 m above the floor;
- The luminaires of class i were located on the ceiling, and the ones of class ii, iii, and iv were suspended by 0.5 m from the ceiling;
- The spacing (s) between the centers of the adjacent luminaires in the lines was twice as large as the spacing between the centers of the outermost luminaires from the nearest wall;
- The lengths of rooms (l) and the number of luminaires (n) resulted from the accepted room indices (ri), the height of suspension of the luminaires above the work plane (h), and the spacing between the centers of the adjacent luminaires related to the suspension height above the work plane (SH).
There were 27 situations analyzed resulting from the combination of:
- RI indices: RI = 1.5 (relatively small rooms), RI = 3.0 (rooms of moderate size), RI = 4.5 (relatively large rooms);
- SH indices: SH = 1.5 (large spacing relative to suspension height), SH = 1.0 (moderate spacing relative to suspension height), SH = 0.5 (small spacing relative to suspension height);
- RE reflectances: RE: 752 (0.7 for the ceiling, 0.5 for the walls, 0.2 for the floor), RE: 753 (0.7 for the ceiling, 0.5 for the walls, 0.3 for the floor) and RE: 772 (0.7 for the ceiling, 0.7 for the walls, 0.2 for the floor).
The list of parameters characterizing the rooms and luminaire layouts are presented in Table 1 and Figure 2. There were 432 lighting situations analyzed in total.

Table 1.
The rooms and luminaire layouts parameters for the study.
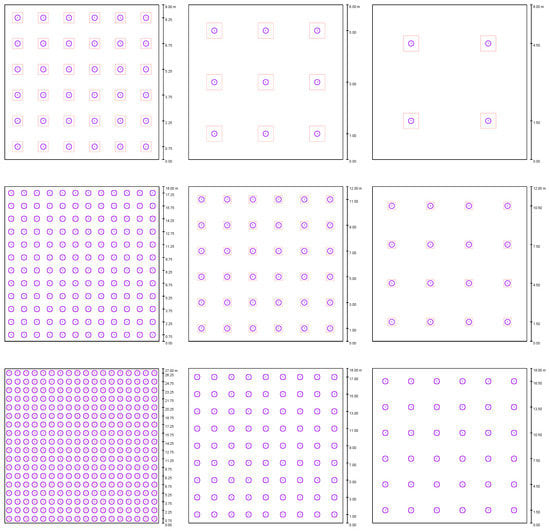
Figure 2.
The luminaire layouts for the study. Top row, left: RI = 1.5, SH = 0.5; Top row, middle: RI = 1.5, SH = 1; Top row, right: RI = 1.5, SH = 1.5; Middle row, left: RI = 3, SH = 0.5; Middle row, middle: RI = 3, SH = 1; Middle row, right: RI = 3, SH = 1.5; Bottom row, left: RI = 4.5, SH = 0.5; Bottom row, middle: RI = 4.5, SH = 1; Bottom row, right: RI = 4.5, SH = 1.5.
2.3. Calculations
In the study, the following parameters characterizing the luminous environment and energy efficiency of the interior lighting were examined in detail:
- The illuminance uniformity on work plane: UN [-];
- The ceiling relative illuminance: EC/EN [-];
- The wall relative illuminance: EW/EN [-];
- The lighting installation utilance: UT [-];
- The lighting installation normalized power density: PN [W/m2 per 100 lx].
The illuminance distribution on work plane was calculated by adjusting the luminaire luminous flux (FLU) in each situation individually in order to obtain the average maintained illuminance on the work plane (EN) exactly equal to 500 lx. The uniformities on the work plane (UN) were calculated based on the illuminance distributions on the work plane. Based on the results of illuminance distributions on ceiling, first the average maintained ceiling illuminances (EC) were calculated and then the ceiling ratios (EC/EN). Based on the results of illuminance distributions on walls, first the average maintained wall illuminances (EW) were calculated, and then the wall ratios (EW/EN). To calculate the illuminance distributions, the grid density was accepted in accordance with the recommendations [26]. The calculations were made for the luminous efficacy (LE) of luminaires equal to 100 lm/W, light output ratio (LOR) of luminaires equal to 0.80, and maintenance factor (MF) equal to 0.8.
The lighting installation utilance (UT) was calculated using the following equation:
The lighting installation normalized power density (PN) was calculated using the equation:
3. Results and Discussion
3.1. General Results
At the first stage of the research, the basic calculation results of the analyzed parameters were set for all the cases in total. Table 2 presents the list of the mean (Mean), minimum (Min), maximum (Max), range (R), and standard deviations of mean (SD). The histograms are presented in Figure 3 for UN, in Figure 4 for EC/EN and EW/EN, and in Figure 5 for UT and PN100. PN100 indicates lighting installation normalized power density with LE = 100 lm/W, LOR = 0.80, and MF = 0.8.
Table 2.
The mean, minimum, maximum, range, and standard deviation values for illuminance uniformity UN, EC/EN, EW/EN, UT, and PN100.
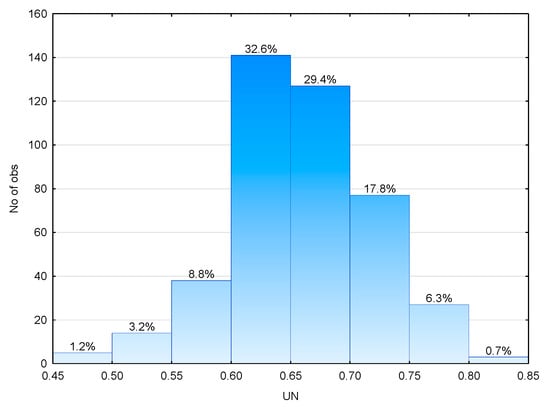
Figure 3.
Histogram of uniformity UN for the analyzed cases.
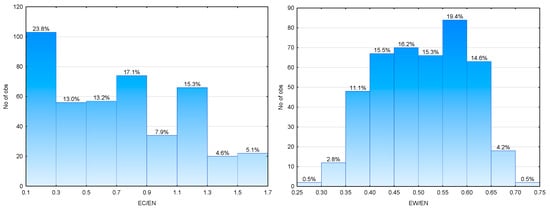
Figure 4.
Histograms of EC/EN and EW/EN for the analyzed cases.
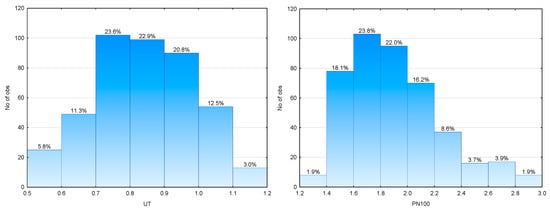
Figure 5.
Histograms of UT and PN100 for the analyzed cases.
It is worth noting that the illuminance uniformity (UN) was below the level of 0.6 for only about 13% of cases, the ceiling ratio (EC/EN) was below the level of 0.3 for about 24% of the cases, and the wall ratio (EW/EN) was below the level of 0.5 as for about 46% of the cases. The utilance (UT) was always higher than the level of 0.5, and for 15.5% of the cases, it was higher than 1.0. In contrast, the normalized power density (PN100) was below the level of 3 W/m2 per 100 lx in any case, and for about 65% of cases, it was even below the level of 2 W/m2 per 100 lx.
The analyzed solutions for general lighting in interiors enabled us to widely create the luminous flux distribution and illuminances, as well as to achieve the low normalized power density levels.
3.2. Impact of Room and Luminaire Parameters
At the next stage of this research, the impact of the room and luminaire parameters on the analyzed parameters was considered. The degree of impact was assessed on the basis of changes in the mean values of each of the analyzed parameters.
3.2.1. Impact of Room Size (RI)
To determine the impact of room size, the calculation results were divided into three groups corresponding to the levels of the analyzed RI indices. Table 3 presents the mean (Mean), minimum (Min), maximum (Max), range (R), and standard deviations of the mean (SD) values for the analyzed parameters. The uniformity (UN) increased with the growth in RI level. When comparing the solutions for RI = 1.5 and RI = 3.0, this growth was 5.1%, whereas while comparing the solutions for RI = 3.0 and RI = 4.5, the increase was 8.3%. When comparing the edge solutions (RI = 1.5 and RI = 4.5), the growth was 14%. The EC/EN ceiling ratio increased with the fall in RI level. When comparing the solutions for RI = 4.5 and RI = 3.0, this growth was 6.2%, however, while comparing the solutions for RI = 3.0 and RI = 1.5, the increase was 17%. When comparing the edge solutions (RI = 4.5 and RI = 1.5), the growth was 24%. The EW/EN wall ratio also increased with the fall in RI level. Nevertheless, this growth was small and while comparing the edge solutions (RI = 4.5 and RI = 1.5), it was 6.3%. The utilance (UT) went up with the growth in RI level. When comparing the solutions for RI = 1.5 and RI = 3.0, this increase was 18%, whereas while comparing the solutions for RI = 3.0 and RI = 4.5, the growth was 6.8%. When comparing the edge solutions (RI = 1.5 and RI = 4.5), the increase was 26%. The normalized power density (PN100) fell with the growth in RI level. When comparing the solutions for RI = 1.5 and RI = 3.0, this decrease was 16%, whereas while comparing the solutions for RI = 3.0 and RI = 4.5, the fall was 6.4%. When comparing the edge solutions (RI = 1.5 and RI = 4.5), the decrease was 21%. The changes in RI had a significant impact on changes in UT, EC/EN, PN100 and UN.
Table 3.
Variation of lighting parameters for each room index (RI).
3.2.2. Impact of Reflectances (RE)
In order to determine the impact of reflectances, the calculation results were divided into three groups corresponding to the levels of the analyzed reflectance sets (RE). Table 4 presents the mean (Mean), minimum (Min), maximum (Max), range (R), and standard deviations of the mean (SD) values for the analyzed parameters.
Table 4.
Variation of lighting parameters for each set of reflectances (RE).
The uniformity (UN) did not practically change with increasing the floor reflectance and increased by 8.5% with raising the wall reflectance. The EC/EN ceiling ratio went up by 6.0% with raising the floor reflectance and did not practically change when increasing the wall reflectance. The EW/EN wall ratio went up by 7.8% with raising the floor reflectance and increased by 5.1% with raising the wall reflectance. The utilance (UT) increased by 5.1% with growing the floor reflectance and went up by 7.7% with the increase in wall reflectance. The normalized power density (PN100) fell by 4.8% with the increase in floor reflectance and went down by 7.1% with the growth in the wall reflectance. All changes in average values due to the increase in floor or wall reflectance were negligible (lower than 10%).
3.2.3. Impact of Lighting Class (N4)
In order to determine the impact of the lighting class, the calculation results were divided into four groups corresponding to the levels of the analyzed N4 indices. Table 5 presents the mean (Mean), minimum (Min), maximum (Max), range (R), and standard deviations of the mean (SD) values for the analyzed parameters.
Table 5.
Variation of lighting parameters for each lighting class (N4 index).
The illuminance uniformity (UN) went up with the fall in N4 level. However, this increase was low and amounted to 4.5% when comparing the edge solutions for N4 = 1.00 and N4 = 0.25. The EC/EN ceiling ratio also grew with the fall in N4 level. When comparing the solutions for N4 = 1.00 and N4 = 0.75, this increase was 116%, and while comparing the solutions for N4 = 0.50 and N4 = 0.25, this increase was 53%. When comparing the edge solutions (N4 = 1.00 and N4 = 0.25), this growth exceeded 450%. The EW/EN wall ratio also went up with the decrease in N4 level. However, when comparing the solutions for N4 = 1.00 and N4 = 0.75, the changes were negligible, and when comparing the solutions for N4 = 0.50 and N4 = 0.25, the growth in EW/EN was 13%. When comparing the edge solutions (N4 = 1.00 and N4 = 0.25), this growth was 24%. The utilance (UT) went up with the increase in N4 level. While comparing the solutions for N4 = 0.25 and N4 = 0.50, this increase amounted to 14%, whereas when comparing the solutions for N4 = 0.75 and N4 = 1.00, this increase was 12%. When comparing the edge solutions (N4 = 0.25 and N4 = 1.00), the growth was 42%. The normalized power density (PN100) went down with the growth in N4 level. When comparing the solutions for N4 = 0.25 and N4 = 0.50, this fall was 12%, whereas while comparing the solutions for N4 = 0.75 and N4 = 1.00, the fall was 11%. When comparing the edge solutions (N4 = 0.25 and N4 = 1.00), the decrease was 30%. The changes in N4 level had the highest impact on the change in EC/EN. They also significantly affected the changes in UT, PN and EW/EN.
3.2.4. Impact of Downward Luminous Intensity Distribution (N1)
In order to determine the impact of the width of downward luminous intensity distribution, the calculation results were divided into four groups corresponding to the levels of the analyzed N1 indices. Table 6 presents the mean (Mean), minimum (Min), maximum (Max), range (R), and standard deviation of the mean (SD) values for the analyzed parameters.
Table 6.
Variation of lighting parameters for each luminaire downward luminous intensity distribution (N1 index).
The illuminance uniformity (UN) went up with the decrease in N1 level. However, this increase was low and amounted to 3.4% when comparing the edge solutions for N1 = 0.77 and N1 = 0.44. The EC/EN ceiling ratio also grew with the fall in N1 level. When comparing the solutions for N1 = 0.77 and N1 = 0.69, this increase was low, just 1.6%, and when comparing the solutions for N1 = 0.58 and N1 = 0.44, the growth was 5.3%. When comparing the edge solutions (N1 = 0.77 and N1 = 0.44), the increase was 10%. The EW/EN wall ratio also grew with the fall in N1 level. When comparing the solutions for N1 = 0.77 and N1 = 0.69, this increase was 7.3%, and when comparing the solutions for N1 = 0.58 and N1 = 0.44, the growth was 19%. When comparing the edge solutions (N1 = 0.77 and N1 = 0.44), the increase amounted to 41%. The room utilance (UT) grew up with the increase in N1 level. When comparing the edge solutions (N1 = 0.44 and N1 = 0.77), this increase was 8.7%. The normalized power density (PN100) fell down with the increase in N1 level. When comparing the edge solutions (N1 = 0.44 and N1 = 0.77), this decrease was 8.0%. The changes in N1 level had the highest impact on the change in EW/EN.
3.2.5. Impact of Luminaire Layout (SH)
In order to determine the impact of luminaire layout, the calculation results were divided into three groups corresponding to the levels of the analyzed SH indices. Table 7 presents the mean (Mean), minimum (Min), maximum (Max), range (R), and standard deviations of the mean (SD) values for the analyzed parameters.
Table 7.
Variation of lighting parameters for each luminaire layout (SH index).
The illuminance uniformity (UN) gained the highest value for SH = 1.0. When comparing the solutions for SH = 1.5 and SH = 1.0, the increase in UN was 6.5%, and when comparing the solutions for SH = 1.0 and SH = 0.5, the decrease in UN was 5.4%. The changes in UN levels were negligible. The EC/EN ceiling ratio went up with the fall in SH level. When comparing the edge solutions (SH = 1.5 and SH = 0.5), this increase was 3.2%. The EW/EN wall ratio also grew with the fall in SH level. When comparing the edge solutions (SH = 1.5 and SH = 0.5), this increase was 10%. The utilance (UT) went up with the growth in SH level. When comparing the edge solutions (SH = 1.5 and SH = 0.5), this increase was only 2.2%. The normalized power density (PN100) fell down with the increase in SH level. When comparing the edge solutions (SH = 1.5 and SH = 0.5), this decrease was only 2.2%. The changes in SH level had a low impact on the changes in average values of the analyzed photometric parameters.
3.2.6. Summary 1
The results summarizing the analysis of the impact of individual parameters characterizing rooms, luminaires, and their layout on the average values of the analyzed parameters are presented in Table 8.
Table 8.
Average changes of UN, EC/EN, EW/EN, UT, PN100 due to changes of RI, RE, N4, N1, SH.
The most significant changes in the average values of the analyzed parameters are marked in red. These changes were obtained while comparing the edge values of RI, RE, N4, N1, and SH. At the next stage, these cases were analyzed in detail.
3.3. Impact of N4 and RI on Changes in EC/EN
The N4 index was the parameter having the highest impact on the level of the ceiling ratio EC/EN. Regardless of the room size, reducing the N4 level led to a very significant growth in EC/EN level (Figure 6a). A lower impact of the changes in N4 index on the EC/EN ceiling ratio level could be observed in the rooms with a higher RI index. When comparing the edge solutions (N4 = 1.00 and N4 = 0.25) in the room with RI = 1.5, reducing the N4 level caused an increase in EC/EN ceiling ratio of 523%. However, when comparing the edge solutions in the room with RI = 4.5, the EC/EN ceiling ratio grew by 407%.
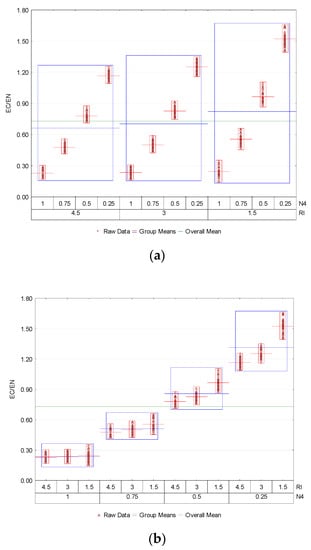
Figure 6.
Variability plots of EC/EN illustrating: (a) N4 impact for various RI; (b) RI impact for various N4.
The RI index was also a parameter having a quite significant impact on the EC/EN ceiling ratio level. As a result of the changes in RI index, the changes in EC/EN ceiling ratio level were of a similar nature for the various N4 indices (Figure 6b). When comparing the edge solutions (RI = 4.5 and RI = 1.5) for N4 = 1.00, lowering the RI level caused an increase in EC/EN ceiling ratio of only 6.3%. On the other hand, when comparing the edge solutions for N4 = 0.25, the EC/EN ceiling ratio grew by 31%.
3.4. Impact of N4 and N1 on Changes in EW/EN
The N4 index was a parameter having the highest impact on the EW/EN wall ratio level. However, this impact had a different nature depending on the N1 index level (Figure 7a). A lower impact of N4 index on the EW/EN wall ratio level could be observed for the luminaires with a lower N1 index. When comparing the solutions for the luminaires with N1 = 0.44, the changes in EW/EN wall ratio level for the various N4 indexes did not exceed 10%. When comparing the edge solutions (N4 = 1.00 and N4 = 0.25) for the luminaires with N1 = 0.58, reducing the N4 index level already caused an increase in EW/EN wall ratio of 21%. Nevertheless, when comparing the edge solutions for the luminaires with N1 = 0.77, lowering the N4 index level caused a growth in the EW/EN wall ratio of up to 52%.
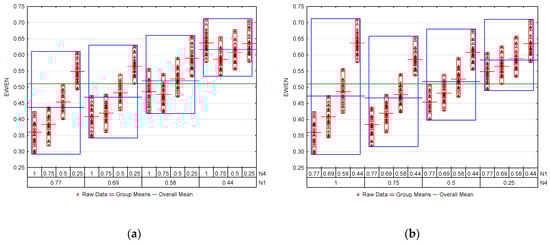
Figure 7.
Variability plots of EW/EN illustrating: (a) N4 impact for various N1; (b) N1 impact for various N4.
The N1 index was also a parameter having an impact on the EW/EN wall ratio level. Regardless of the value of N4 index, the change in N1 index level of the luminaires led to increasing the EW/EN wall ratio (Figure 7b). The increase in EW/EN wall ratio level was, however, much higher as for the luminaires with a higher N4 index. When comparing the edge solutions (N1 = 0.77 and N1 = 0.44) for the luminaires with N4 = 0.25, reducing the N1 index level caused a growth in the EW/EN wall ratio of 16%. On the other hand, when comparing the edge solutions for the luminaires with N4 = 1.00, lowering the N1 index level caused a growth in the EW/EN wall ratio of up to 77%.
3.5. Impact of N4 and RI on Changes in UT
The N4 index was the parameter having the highest impact on the UT level. Regardless of the room size, the increase in N4 index level led to a significant increase in the UT level (Figure 8a). A lower impact of N4 index on the UT level occurred in the rooms with a higher RI index. When comparing the edge solutions (N4 = 1.00 and N4 = 0.25) in the room with RI = 4.5, increasing the N4 index level caused a growth in UT level of 39%. However, when comparing the edge solutions in the room with RI = 1.5, the increase in UT level was 50%.
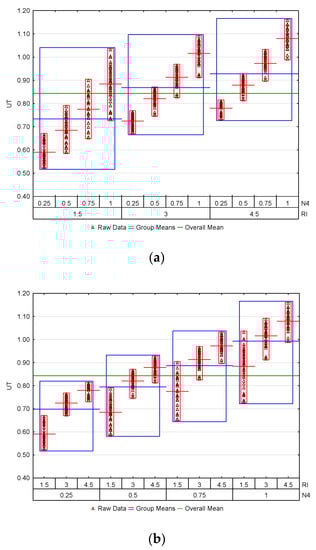
Figure 8.
Variability plots of UT illustrating: (a) N4 impact for various RI; (b) RI impact for various N4.
The RI index was also a parameter having a significant impact on the UT level. Regardless of the value of N4 index, the increase in RI level led to an increase in the UT index (Figure 8b). A lower impact of RI index on the UT index level occurred in the rooms with a higher N4 index. When comparing the edge solutions (RI = 4.5 and RI = 1.5) for N4 = 1.00, increasing the RI index level caused an increase in UT level of 22%. However, when comparing the edge/outermost solutions for N4 = 0.25, the UT index grew by 32%.
3.6. Impact of N4 and RI on Changes in PN100
The N4 index was the parameter having the highest impact on the PN100 level. Regardless of the room size, the increase in N4 level led to a significant decrease in PN100 level (Figure 9a). A lower impact of N4 index on the PN100 level occurred in the rooms with a higher RI index. When comparing the edge solutions (N4 = 1.00 and N4 = 0.25) in the room with RI = 4.5, increasing the N4 index level caused a fall in PN100 level of 28%. On the other hand, when comparing the edge solutions in the room with RI = 1.5, the PN level fell down by 33%.
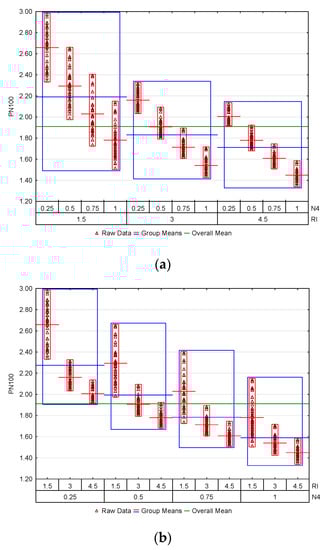
Figure 9.
Variability plots of PN100 illustrating: (a) N4 impact for various RI; (b) RI impact for various N4.
The RI index was also a parameter having a significant impact on the PN100 level. Regardless of the value of N4 index, the increase in RI level led to a fall in PN100 level (Figure 9b). A lower impact of RI index on the PN100 level occurred in the rooms with a higher N4 index. When comparing the edge solutions (RI = 4.5 and RI = 1.5) for N4 = 1.00, increasing the RI index level caused a decrease in PN100 of 18%. On the other hand, when comparing the edge solutions for N4 = 0.25, the PN level fell down by 24%.
3.7. Summary 2
The impact of lighting class (N4 index) on the EC/EN ceiling ratio level was very high, but it was higher in the smaller rooms. The lighting class (N4 index) had a significantly higher impact on the EW/EN wall ratio level when using the luminaires with narrower luminaire downward luminous intensity distributions. The luminaire downward luminous intensity distribution (N1 index) had a significantly higher impact on the EW/EN wall ratio level for direct lighting than for higher lighting classes. In the larger rooms, the impact of lighting class (N4 index) on the level of the increase in utilance (UT) and the decrease in normalized power density (PN100) was lower than in the smaller rooms.
The scope of conducted research is much broader than the investigations conducted so far in [30,31,38]. This mainly applies to the room size, types of luminaires and their layouts. The results obtained show a significant impact of lighting class on ceiling and wall illumination, lighting installation utilance, and normalized power density. The results also demonstrate that in larger rooms, the impact of lighting class on the ceiling illumination level, lighting installation utilance, and normalized power density is lower than in smaller rooms. Therefore, the obtained results verify the thesis presented in [31].
3.8. Power of General Lighting in Interiors
At the final stage of the research, the normalized power density levels (PN) were determined for different levels of the luminous efficacies and light output ratios of luminaires, and the maintenance factors. The calculations were carried out for the range of the obtained levels of lighting installation utilance (UT) (Table 2). Figure 10 shows the normalized power densities for the following parameter levels:
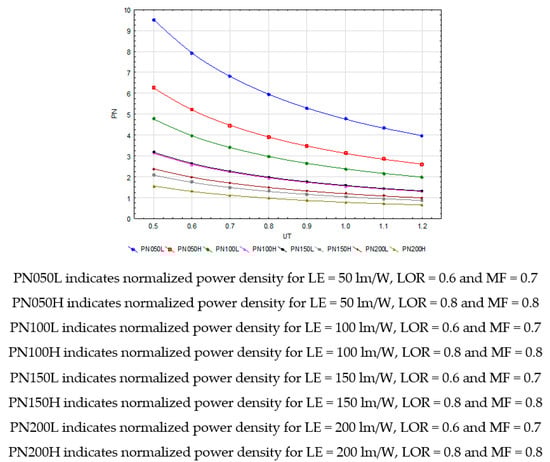
Figure 10.
The normalized power density PN [W/m2 per 100 lx] in interiors for various LE, LOR, and MF levels.
- LE: 50 lm/W (low), 100 lm/W (moderate), 150 lm/W (high), 200 lm/W (very high);
- LOR: 0.8 (relatively high) and 0.6 (relatively low);
- MF: 0.8 (relatively high) and 0.7 (relatively low).
It can be observed that the normalized power density for the low luminous efficacy ranges from approx. 3 W/m2 per 100 lx to approx. 9 W/m2 per 100 lx. The use of light sources with a luminous efficacy LE = 100 lm/W and more allows us to obtain the normalized power density below 2 W/m2 per 100 lx. For very high LE levels, but also for LE = 150 lm/W and very high UT levels, it is possible to gain the normalized power density lower than 1 W/m2 per 100 lx.
On the basis of the obtained results representing a very wide range of the lighting solutions, a classification on the energy efficiency of interior lighting based on the normalized power density was proposed, shown in Table 9.
Table 9.
The energy efficiency classification proposal for interior lighting based on the normalized power density PN [W/m2 per 100 lx].
Looking at the results presented in Figure 10, it is worth noting that a high LE value (at least 100 lm/W) gives a high potential for achieving the high energy efficiency in interior lighting. At the same time, the possibility of gaining the low values of normalized power density (lower than 4 W/m2 per 100 lx) should be recognized even when using the light sources with a luminous efficacy of 50 lm/W. However, it requires obtaining a high efficiency of the lighting installation utilance (UT) while using the luminaires of a high LOR value.
4. Conclusions
For a wide range of the parameters characterizing rooms, luminaires, and their layout, it is possible to obtain:
- uniformity levels on work plane that are high (UN > 0.6 for almost 90% of all solutions) and very high (UN > 0.7 for almost 25% of all solutions);
- a very wide range of ceiling relative illuminaces (EC/EN from 0.15 to 1.65);
- a quite limited range of wall relative illuminaces (EW/EN from 0.30 to 0.71);
- lighting installation utilance levels that are high (UT > 0.7 for almost 85% of all solutions) and very high (UT > 0.9 for over 35% of all solutions).
The lighting class and room size are the key factors determining the levels of ceiling relative illuminance, lighting installation utilance, and normalized power density. The lighting class and the luminaire downward luminous intensity distribution are the key factors determining the level of the wall relative illuminance. The impact of floor and wall reflectances and the luminaire layout, for the ranges of these variables considered in this paper, on all the analyzed parameters is low.
The obtained results and formulated conclusions refer to a wide range of cases, however, they are limited by the adopted assumptions. In order to generalize the results fuller, it is necessary to verify whether the obtained results are also applicable in rooms with other characteristics and for other types and layouts of luminaires. In particular, it is necessary to check the impact of room proportions, other luminaire luminous intensity distributions and layouts, as well as other ceiling, wall, and floor reflectances on lighting parameters in interiors.
The level of normalized power density in interior lighting, apart from the lighting installation utilance, also depends on the luminous efficacy of light sources, the light output ratio of luminaire, and the maintenance factor. The use of general lighting and light sources with a high luminous efficacy (at the level of 150 lm/W) should provide the normalized power density in interior lighting not exceeding a level of 3 W/m2 per 100 lx.
Author Contributions
Conceptualization, P.P.; methodology, P.P.; software, P.P., M.D., P.K.; validation, P.P., M.D., P.K.; formal analysis, P.P.; resources, P.P.; data curation, P.P.; writing—original draft preparation, P.P.; writing—review and editing, P.P., M.D., P.K.; visualization, P.P.; supervision. All authors have read and agreed to the published version of the manuscript.
Funding
This research received no external funding.
Acknowledgments
Article Preparation Charge was covered by the Electrical Power Engineering Institute at the Warsaw University of Technology and Open Access Charge was covered by IDUB program at the Warsaw University of Technology.
Conflicts of Interest
The authors declare no conflict of interest.
References
- Apanaviciene, R.; Vanagas, A.; Fokaides, P.A. Smart building integration into a smart city (SBISC): Development of a new evaluation framework. Energies 2020, 13, 2190. [Google Scholar] [CrossRef]
- Veitch, J.A. Light, lighting, and health: Issues for consideration. Leukos 2005, 2, 85–96. [Google Scholar] [CrossRef]
- Dikel, E.E.; Veitch, J.A.; Mancini, S.; Xue, H.H.; Valdés, J.J. Lighting-on-Demand: Balancing occupant needs and energy savings. Leukos 2018, 14, 3–11. [Google Scholar] [CrossRef]
- Montoya, F.G.; Peña-García, A.; Juaidi, A.; Manzano-Agugliaro, F. Indoor lighting techniques: An overview of evolution and new trends for energy saving. Energy Build. 2017, 140, 50–60. [Google Scholar] [CrossRef]
- Leśko, M.; Różowicz, A.; Wachta, H.; Różowicz, S. Adaptive luminaire with variable luminous intensity distribution. Energies 2020, 13, 721. [Google Scholar] [CrossRef]
- Leoto, R.; Lizarralde, G. Challenges in evaluating strategies for reducing a building’s environmental impact through integrated design. Build. Environ. 2019, 155, 34–46. [Google Scholar] [CrossRef]
- Pracki, P.; Skarżyński, K. A multi-criteria assessment procedure for outdoor lighting at the design stage. Sustainability 2020, 12, 1330. [Google Scholar] [CrossRef]
- Dillon, H.E.; Ross, C.; Dzombak, R. Environmental and energy improvements of LED lamps over time: A comparative life cycle assessment. Leukos 2020, 16, 229–237. [Google Scholar] [CrossRef]
- Beccali, M.; Bonomolo, M.; Leccese, F.; Lista, D.; Salvadori, G. On the impact of safety requirements, energy prices and investment costs in street lighting refurbishment design. Energy 2018, 16, 739–759. [Google Scholar] [CrossRef]
- Rea, M.S. Lighting simply made better: Providing a full range of benefits without much fuss. Build. Environ. 2018, 144, 57–65. [Google Scholar] [CrossRef]
- Chraibi, S.; Crommentuijn, L.; van Loenen, E.; Rosemann, A. Influence of wall luminance and uniformity on preferred task illuminance. Build. Environ. 2017, 117, 24–35. [Google Scholar] [CrossRef]
- Rea, M.S.; Ouellette, M.J. Relative visual performance: A basis for application. Light. Res. Technol. 1991, 23, 135–144. [Google Scholar] [CrossRef]
- Scheir, G.H.; Hanselaer, P.; Ryckaert, W.R. Pupillary light reflex, receptive field mechanism and correction for retinal position for the assessment of visual discomfort. Light. Res. Technol. 2019, 51, 291–303. [Google Scholar] [CrossRef]
- Berson, D.M. Strange vision: Ganglion cells as circadian photoreceptors. Trends Neurosci. 2003, 26, 283–334. [Google Scholar] [CrossRef]
- Figueiro, M.G. Disruption of circadian rhythms by light during day and night. Curr. Sleep Med. Rep. 2017, 3, 76–84. [Google Scholar] [CrossRef]
- Moscoso, C.; Chamilothori, K.; Wienold, J.; Andersen, M.; Matusiak, B. Window size effects on subjective impressions of daylit spaces: Indoor studies at high latitudes using virtual reality. Leukos 2020. [Google Scholar] [CrossRef]
- Bellia, L.; Fragliasso, F.; Stefanizzi, E. Effects of light source spectrum and background colour on the perception of paintings. Light. Res. Technol. 2020, 52, 36–63. [Google Scholar] [CrossRef]
- Flynn, J.E.; Hendrick, C.; Spencer, T.; Martyniuk, O. A guide to methodology procedures for measuring subjective impressions in lighting. J. Illum. Eng. Soc. 1979, 8, 95–110. [Google Scholar] [CrossRef]
- Ferlazzo, F.; Piccardi, L.; Burattini, C.; Barbalace, M.; Giannini, A.M.; Bisegna, F. Effects of new light sources on task switching and mental rotation performance. J. Environ. Psychol. 2015, 39, 92–100. [Google Scholar] [CrossRef]
- Veitch, J.A.; Stokkermans, M.G.M.; Newsham, G.R. Linking lighting appraisals to work behaviors. Environ. Behav. 2013, 45, 198–214. [Google Scholar] [CrossRef]
- Krupiński, R. Dynamically variable luminance distribution as the method of designing and architectural floodlighting. In Proceedings of the 2016 IEEE Lighting Conference of the Visegrad Countries (Lumen V4), Karpacz, Poland, 13–16 September 2016; pp. 1–4. [Google Scholar]
- Boyce, P.R.; Veitch, J.A.; Newsham, G.R.; Jones, C.C.; Heerwagen, J.; Myer, M.; Hunter, C.M. Lighting quality and office work: Two field simulation experiments. Light. Res. Technol. 2006, 38, 191–223. [Google Scholar] [CrossRef]
- Castilla, N.; Llinares, C.; Bisegna, F.; Blanca-Giménez, B. Emotional evaluation of lighting in university classrooms: A preliminary study. Front. Arch. Res. 2018, 7, 600–609. [Google Scholar] [CrossRef]
- Pracki, P. Impact of direct lighting Luminaires’ luminous intensity distribution on lighting quality in interiors. In Proceedings of the 2018 VII Lighting Conference of the Visegrad Countries (Lumen V4), Trebic, Czech Republic, 18–20 September 2018; pp. 1–6. [Google Scholar]
- Benavente-Peces, C. On the energy efficiency in the next generation of smart buildings—Supporting technologies and techniques. Energies 2019, 12, 4399. [Google Scholar] [CrossRef]
- European Standard EN 12464-1:2011. Light and Lighting—Lighting of Work Places—Part 1: Interior Work Places; CEN: Brussels, Belgium, 2011. [Google Scholar]
- European Standard EN 15193-1:2017. Energy Performance of Buildings—Energy Requirements for Lighting—Part 1: Specifications, Module M9; CEN: Brussels, Belgium, 2017. [Google Scholar]
- Lo Verso, V.R.M.; Pellegrino, A.; Pellerey, F. A multivariate non-linear regression model to predict the energy demand for lighting in rooms with different architectural features and lighting control systems. Energy Build. 2014, 76, 151–163. [Google Scholar] [CrossRef]
- Yoomak, S.; Ngaopitakkul, A. Optimisation of lighting quality and energy efficiency of LED luminaires in roadway lighting systems on different road surfaces. Sustain. Cities Soc. 2018, 38, 333–347. [Google Scholar] [CrossRef]
- Makaremi, N.; Schiavoni, S.; Pisello, A.L.; Asdrubali, F.; Cotana, F. Quantifying the effects of interior surface reflectance on indoor lighting. Energy Procedia 2017, 134, 306–316. [Google Scholar] [CrossRef]
- Makaremi, N.; Schiavoni, S.; Pisello, A.L.; Cotana, F. Effects of surface reflectance and lighting design strategies on energy consumption and visual comfort. Indoor Built Environ. 2019, 28, 552–563. [Google Scholar] [CrossRef]
- Mangkuto, R.A. Validation of DIALux 4.12 and DIALux evo 4.1 against the Analytical Test Cases of CIE 171:2006. Leukos 2016, 12, 139–150. [Google Scholar] [CrossRef]
- Mattoni, B.; Gori, P.; Bisegna, F. A step towards the optimization of the indoor luminous environment by genetic algorithms. Indoor Built Environ. 2015, 26, 590–607. [Google Scholar] [CrossRef]
- Lowry, G. Energy saving claims for lighting controls in commercial buildings. Energy Build. 2016, 133, 489–497. [Google Scholar] [CrossRef]
- Nisbet, R.; Elder, J.; Miner, G. Handbook of Statistical Analysis and Data Mining Applications; Elsevier: Oxford, UK, 2009. [Google Scholar]
- CIE Website. Available online: http://eilv.cie.co.at/term/463 (accessed on 26 August 2020).
- CIE Website. Available online: http://eilv.cie.co.at/term/1121 (accessed on 26 August 2020).
- Pracki, P. The impact of room and luminaire characteristics on general lighting in interiors. Bull. Pol. Acad. Sci. Tech. Sci. 2020, 68, 447–457. [Google Scholar]


© 2020 by the authors. Licensee MDPI, Basel, Switzerland. This article is an open access article distributed under the terms and conditions of the Creative Commons Attribution (CC BY) license (http://creativecommons.org/licenses/by/4.0/).