1. Introduction
Efforts aiming at a decarbonized electricity supply have significantly intensified on a global scale in recent years [
1,
2,
3]. The transition towards increased penetration of renewable energy sources (RES) is deemed pivotal [
4] to boost the emergence of carbon-neutral economies [
5,
6,
7]. In spite of the progress already achieved, more key interventions are required for the further deployment of renewables, the efficient exploitation of their potential and the apt transformation of the electricity systems in the coming decade [
8,
9,
10].
Renewable energy technologies such as offshore wind and solar photovoltaics (PV) comprise two of the most significant alternatives for the generation of low-carbon electricity. Their costs have undergone a significant reduction in recent decades. As a result, the respective market shares have risen [
11,
12,
13,
14,
15]. Nonetheless, they are characterized by a noticeably lower level of flexibility than fossil fuels, due to their variable and intermittent power production [
16]. Hence, raising the share of RES into the grid can be rather challenging—especially in terms of production and demand mismatches, as well as stability of supply [
17,
18,
19,
20,
21]. Consequently, the role of energy storage in boosting the deployment of renewables is vital [
22,
23,
24,
25]. However, energy storage can have a strong influence on the costs of solar and wind electricity, in their effort to meet energy demand in high RES penetration scenarios [
26,
27,
28]. As it is related to the intermittent operation of power plants, the incurrence of such additional costs should not be neglected [
29,
30].
On the contrary, concentrated solar power (CSP) with thermal energy storage (TES) differs significantly from the aforementioned technologies. Its energy production can be shifted over time and presents lower levels of variability, which can be attributed to the utilization of storage and thermal inertia [
31,
32,
33]. Moreover, CSP with TES can provide steady capacity and generate electricity at time intervals of high net demand [
34,
35,
36]. Dispatchability is regarded as a critical advantage that distinguishes CSP with TES from intermittent renewable energy sources in terms of energy quality. Nevertheless, its cost remains higher in comparison to competing technologies and its development remains uncertain [
37,
38].
The above-mentioned renewable energy technologies present a remarkable diversity in relation to costs and stability of electricity generation. No single technology can be identified as optimal in every aspect. As a result, future high-RES-penetration solutions are expected to combine different technological options [
39,
40]. Therefore, the evaluation of comparative assets of each technological option is of utmost importance. Although the existing literature is rich in studies delving into the challenges related to future low-carbon electricity systems, they explore either energy storage per se [
41,
42,
43,
44]—or the characteristics of a single RES technology combined with storage [
45,
46,
47,
48,
49,
50]. As a result, the circumstances, under which each RES technology outperforms their counterparts when energy storage is integrated, remain underexplored.
In an effort to investigate the circumstances under which CSP could have a niche against comparable technologies, this study deals also with this void by means of assessing competitive dispatchable RES technologies. These technologies could be utilized for the implementation of high RES penetration scenarios, especially in the frame of the long-term European decarbonization strategy for 2050. According to IRENA [
51], solar PVs, offshore wind and CSP constitute by far the most cost-intensive RES technological options. The global weighted-average cost of electricity for PV, offshore wind and CSP are 0.085
$/kWh, 0.127
$/kWh and 0.185
$/kWh, respectively. By contrast, onshore wind presents a noticeably lower cost, which is equal to 0.056
$/kWh. Furthermore, another IRENA study states that many onshore wind projects commissioned in 2017 lie within the cost range of fossil-based electricity generation technologies [
43]. However, the deployment of onshore wind is hindered by its high impact on the environment [
52] and limited land availability [
53,
54]. In this context, the transition towards higher levels of RES penetration is expected to enable a case for CSP expansion. The rationale behind this is that when the system becomes highly dependent on variable sources, it requires sources capable of ramping up rapidly. In addition, investments on such dispatchable sources should be initiated when there is time ahead, so as to be available when variable sources have significantly increased their penetration rates [
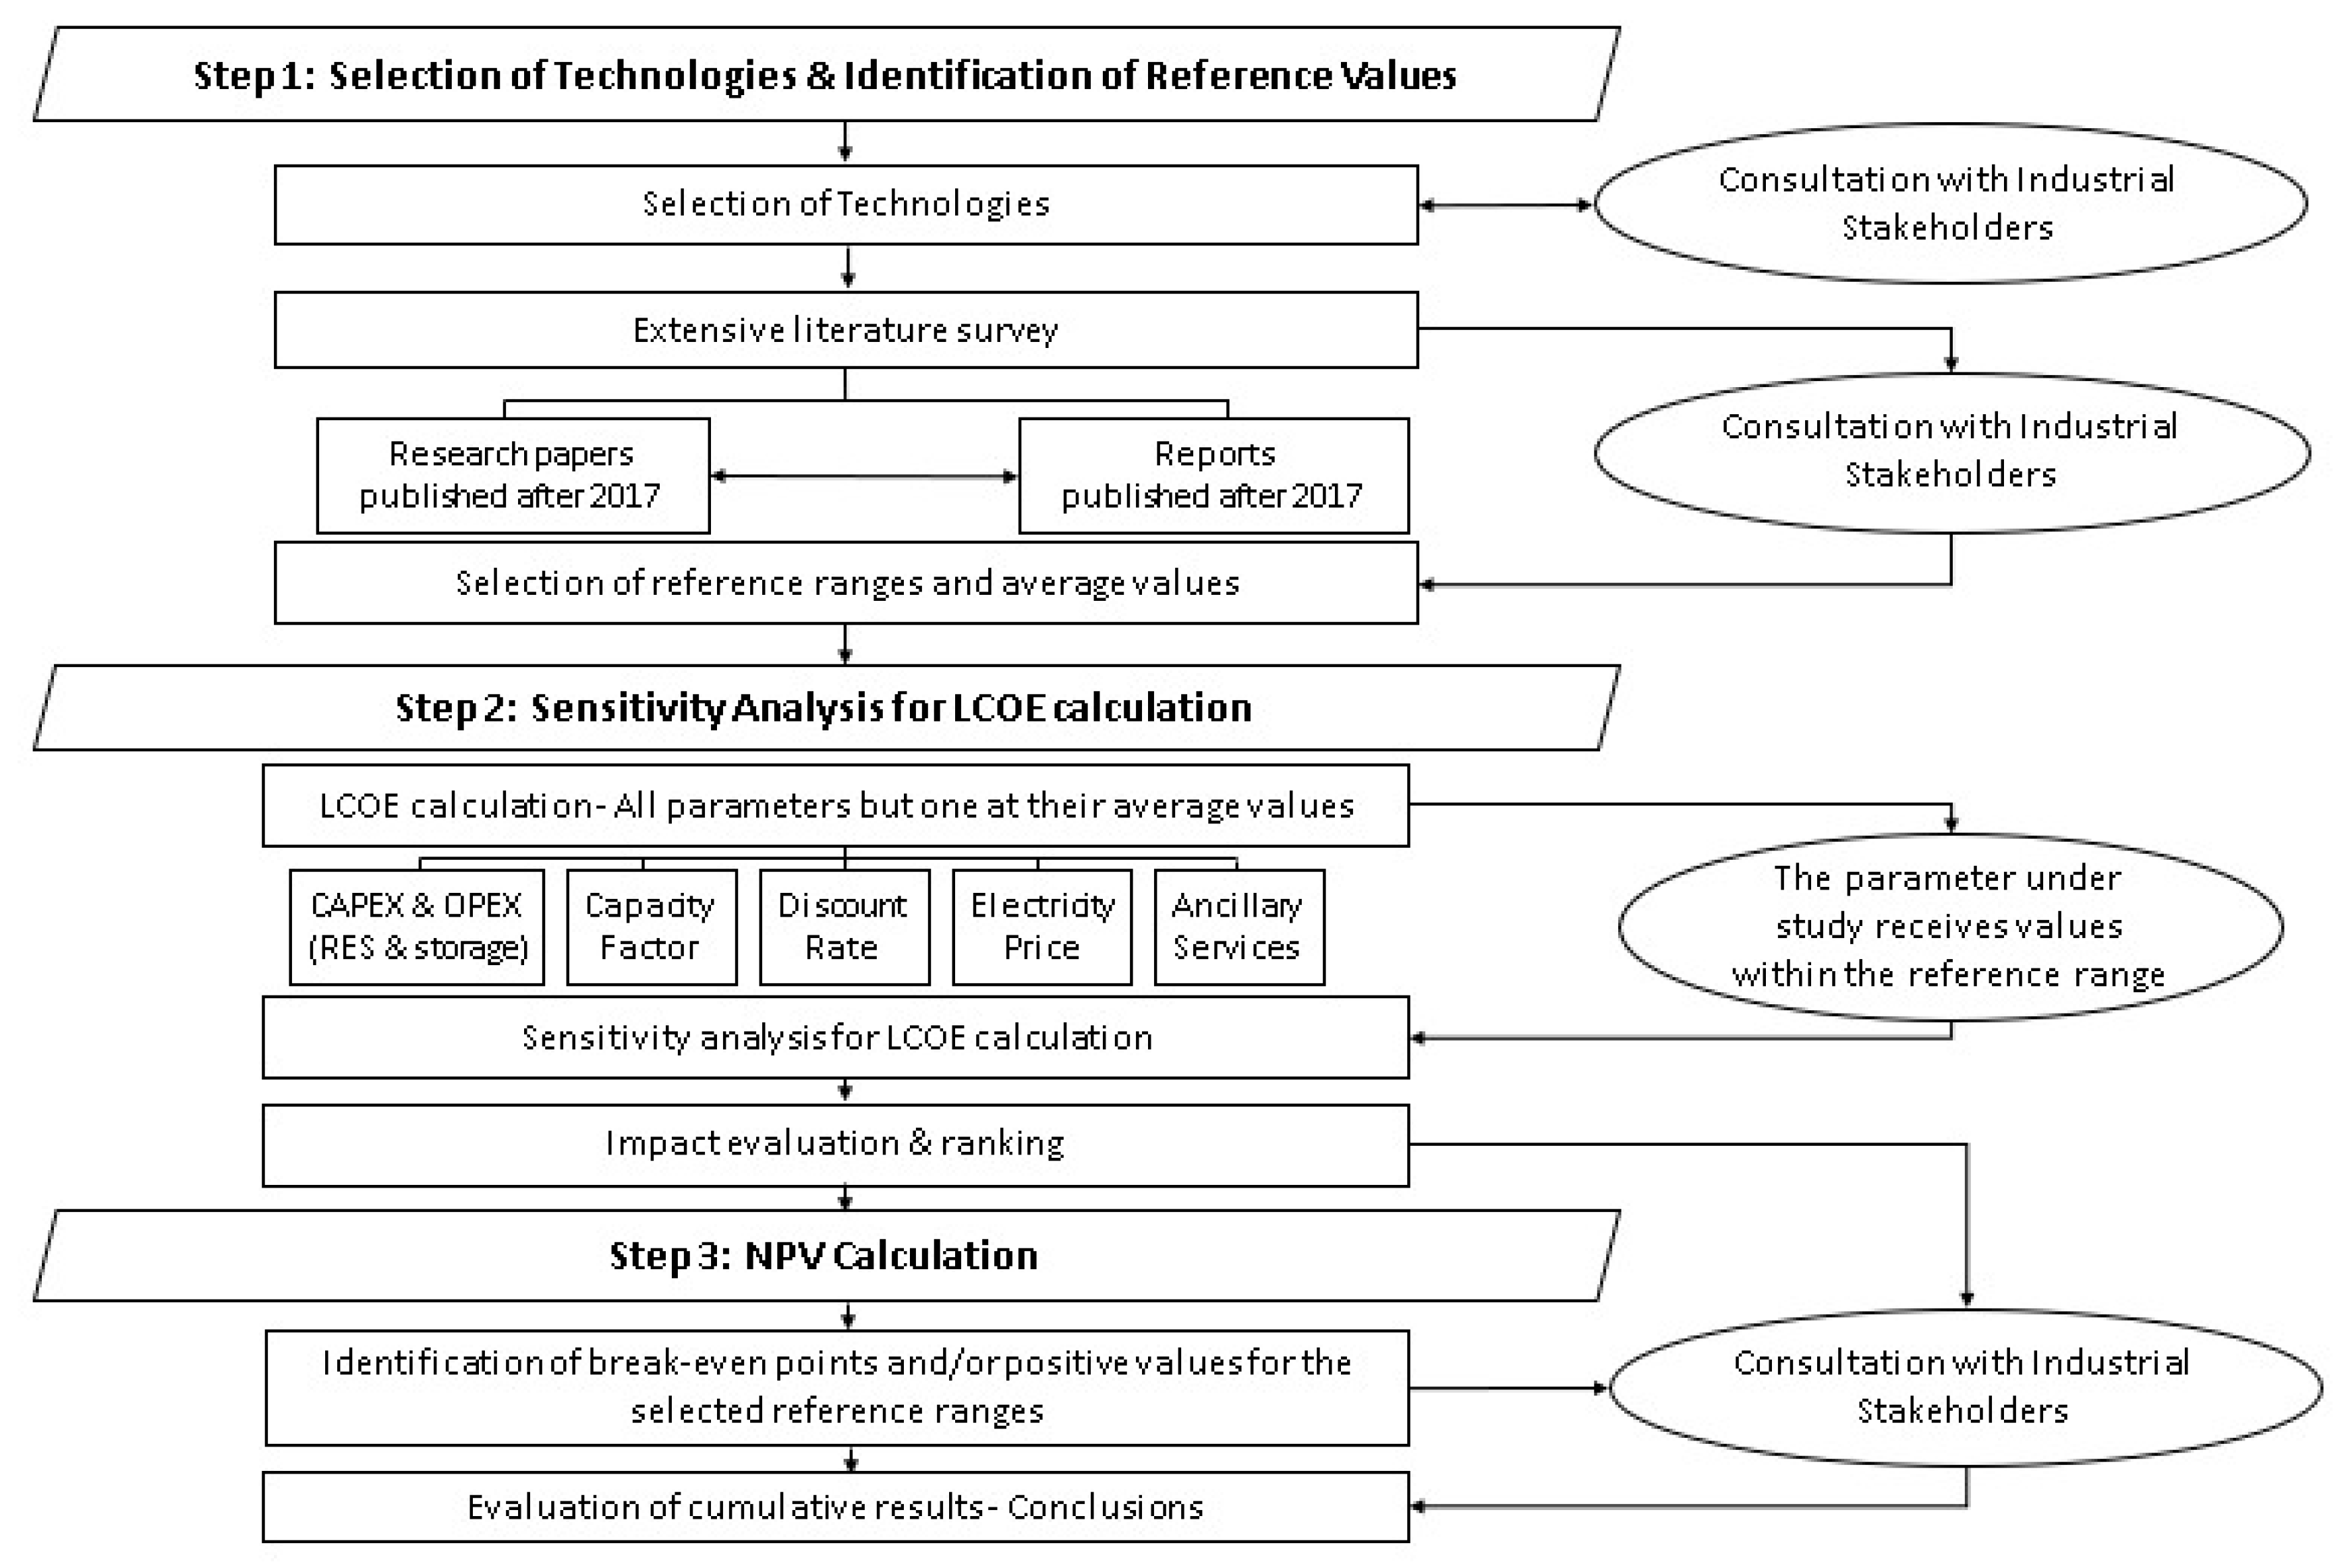
55]. Following consultation with industrial stakeholders, three technological options were selected for the current study—CSP, PV and offshore wind—all three combined with a storage component. More information on the storage component that has been considered is provided under
Section 2.2. A detailed sensitivity analysis was conducted for all the parameters related to the levelized cost of electricity (LCOE) and net present value (NPV) of these technologies. These parameters include the capital investment cost, storage related costs, the capacity factor, the discount rate and the annual fixed and variable operation and maintenance (O&M) costs. Drawing from the above, the main objective of this paper is to address the following question: under which circumstances can CSP have a competitive advantage against comparable technologies, until the rest of the conditions required for its deployment become more favorable?
3. Results
The correlation of the LCOE with the examined parameters, as well as the corresponding sensitivity analyses are presented in the current Section. More specifically, the illustrated results include the sensitivity analysis conducted for CSP with storage, as well as both storage scenarios examined for PV and offshore wind with storage. In each case, the parameter under study receives different values within the adopted range, while the rest of the parameters remain constant, at their average value.
Table 4 summarizes the average values and ranges for all parameters related to the analysis for CSP with storage. The first parameter examined for CSP is the investment cost, including the storage related costs. However, a different approach has been adopted in this case, given the interrelation of the CSP investment cost with the CF. To this end, the overall investment cost has been disaggregated for three specific ranges, each one of them corresponding to different CF values.
More precisely, in line with the CSP guru database [
114] and IRENA [
115], for a storage capacity of less than 6 h, the CF is considered between 30 to 40%. Accordingly, a CF range between 40 to 50% is considered for capacities between 6 and 9 h, while for 9 to 12 h, the CF parameter reaches 50–60%. The LCOE values for investment costs between 2800 and 4000 € and an average CF of 35% are calculated 0.13–0.1589 €/kWh. Assuming costs between 4000–5000 € and a CF of 45%, the LCOE is calculated 0.134–0.152 €/kWh, while for higher CFs (namely 55%) and costs ranging from 5000 € to 6000 €, the LCOE presents a range between 0.1327–0.1513 €/kWh.
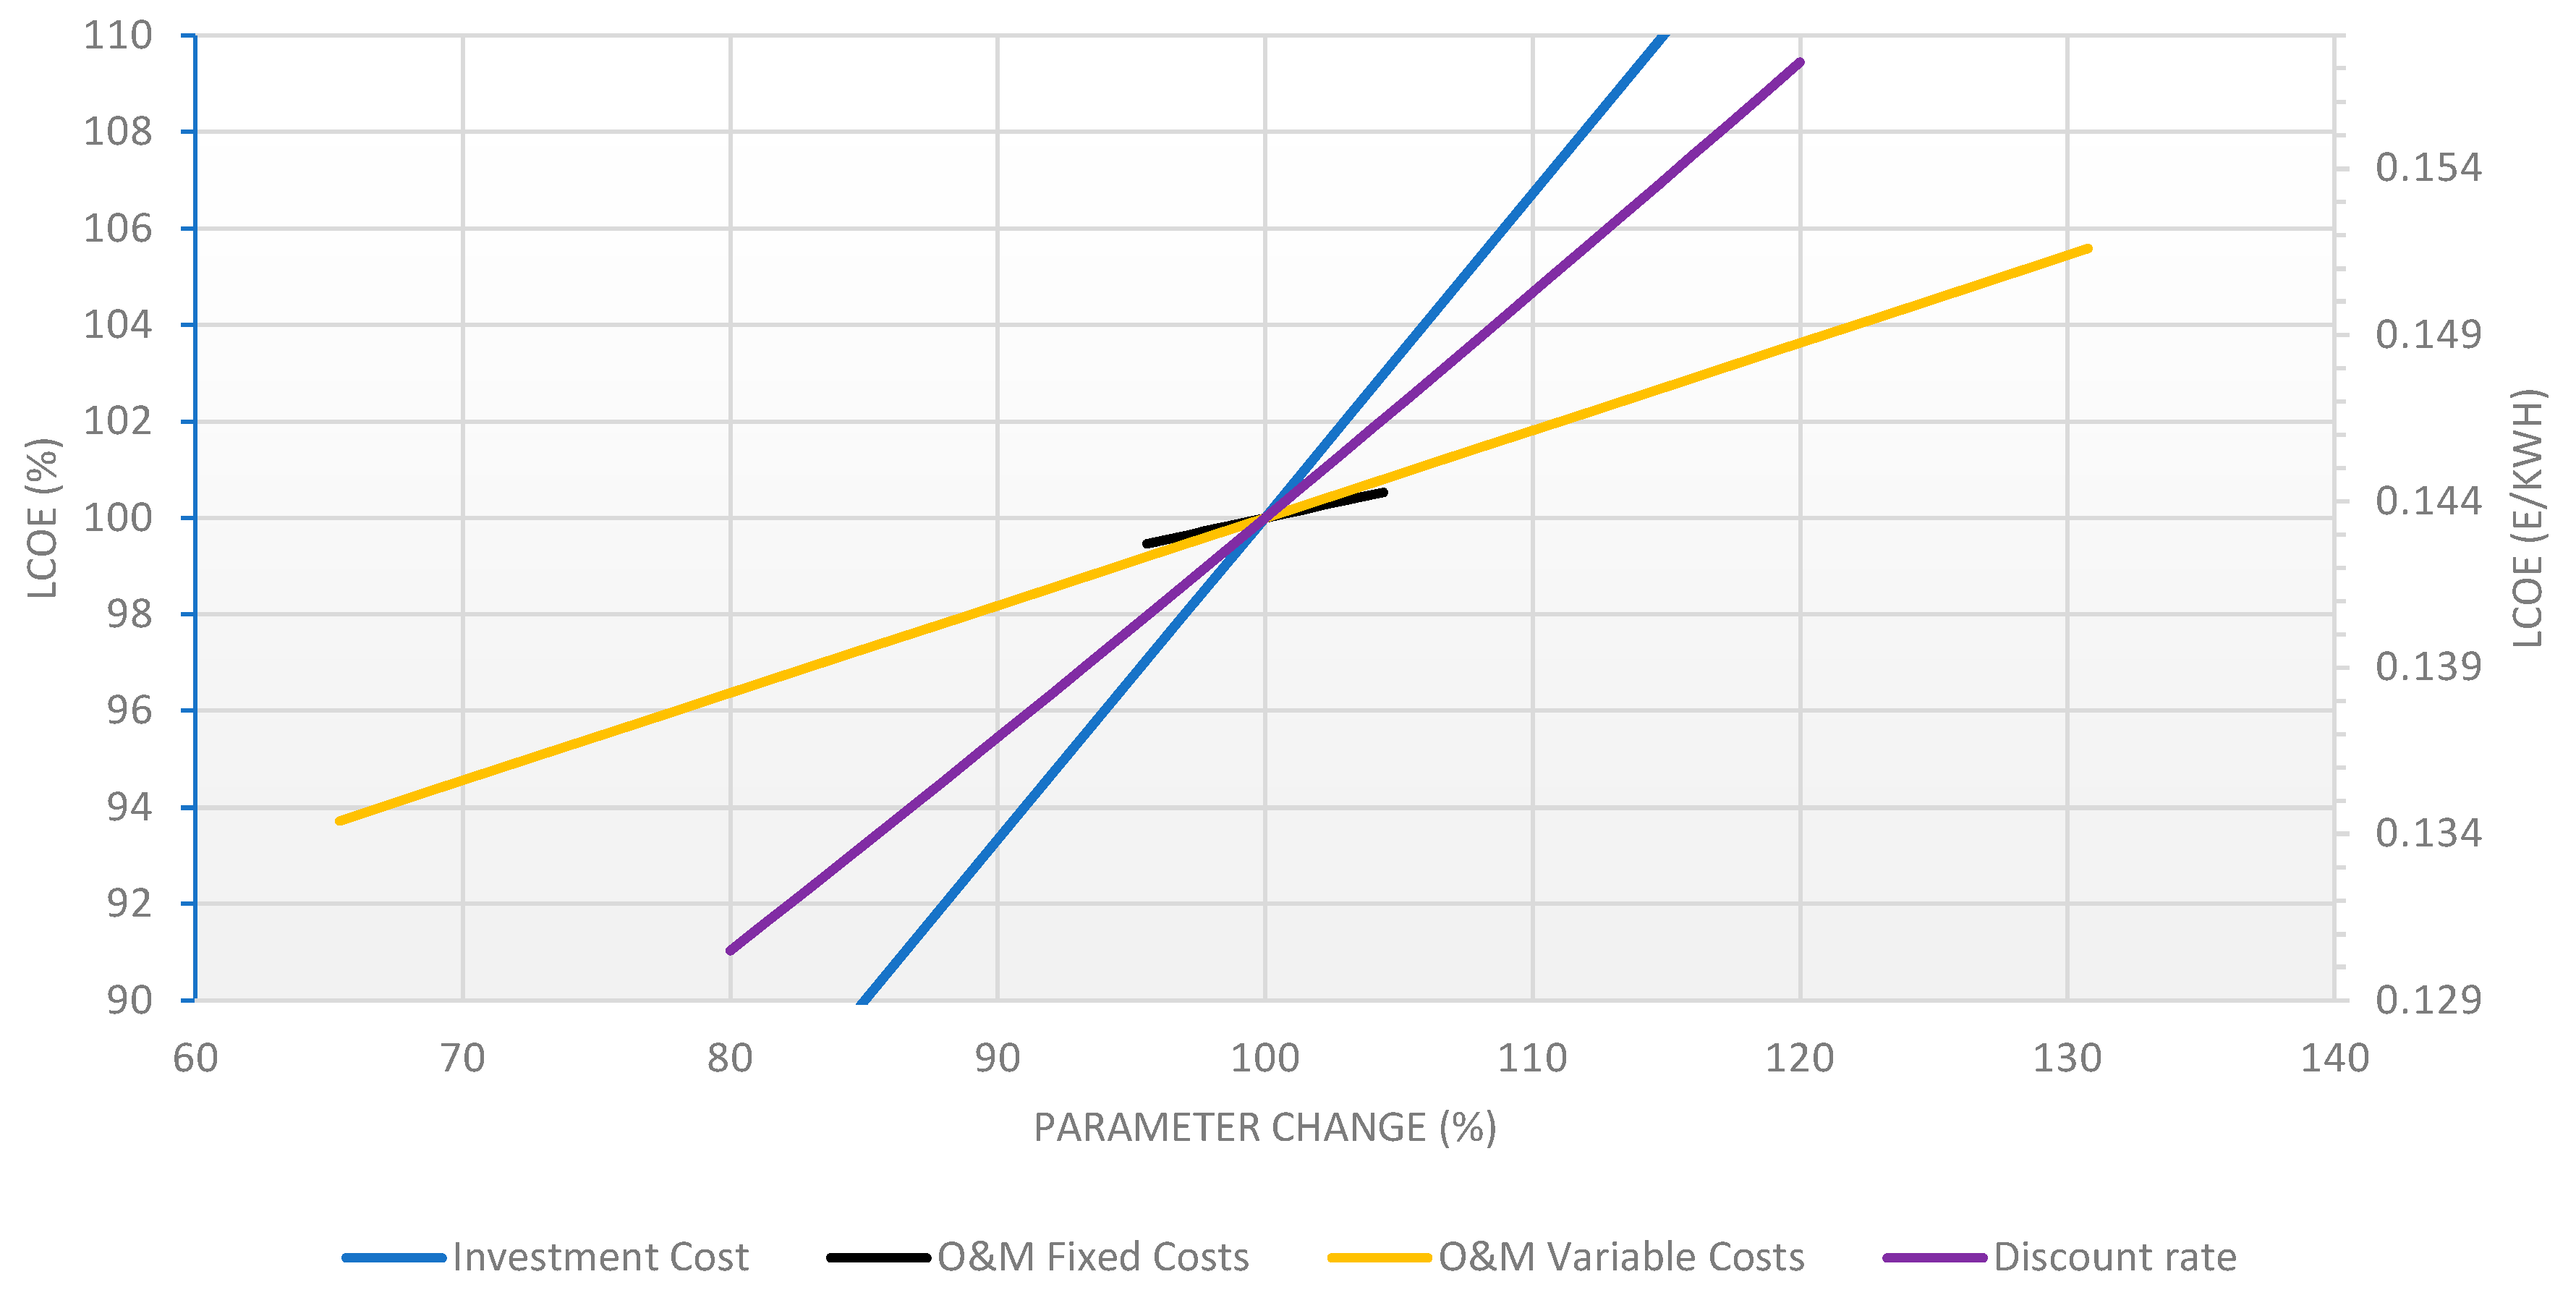
A comparable LCOE plot with the studied CSP parameters is presented under
Figure 2. The LCOE price calculated for an average constant value of the CSP parameters is 0.1429 €/kWh. In regard with the parameters impacting on the LCOE, positive NPV values are achieved only by CSP plants equipped with at least 6 h of storage, when investment costs fall below 1995 €/kW. The impact of two additional parameters on the feasibility of a CSP project, namely of the electricity price and ancillary services, was also studied. More precisely, negative NPV results were attained for an ancillary services cost of 0.025 €/kWh and a wholesale market price ranging between 0.04–0.06 €/kWh, as well as for a wholesale electricity price kept constant at 0.05 €/kWh and ancillary services of 0.01 to 0.04 €/kWh.
The respective values and ranges for PV with storage are presented in
Table 5.
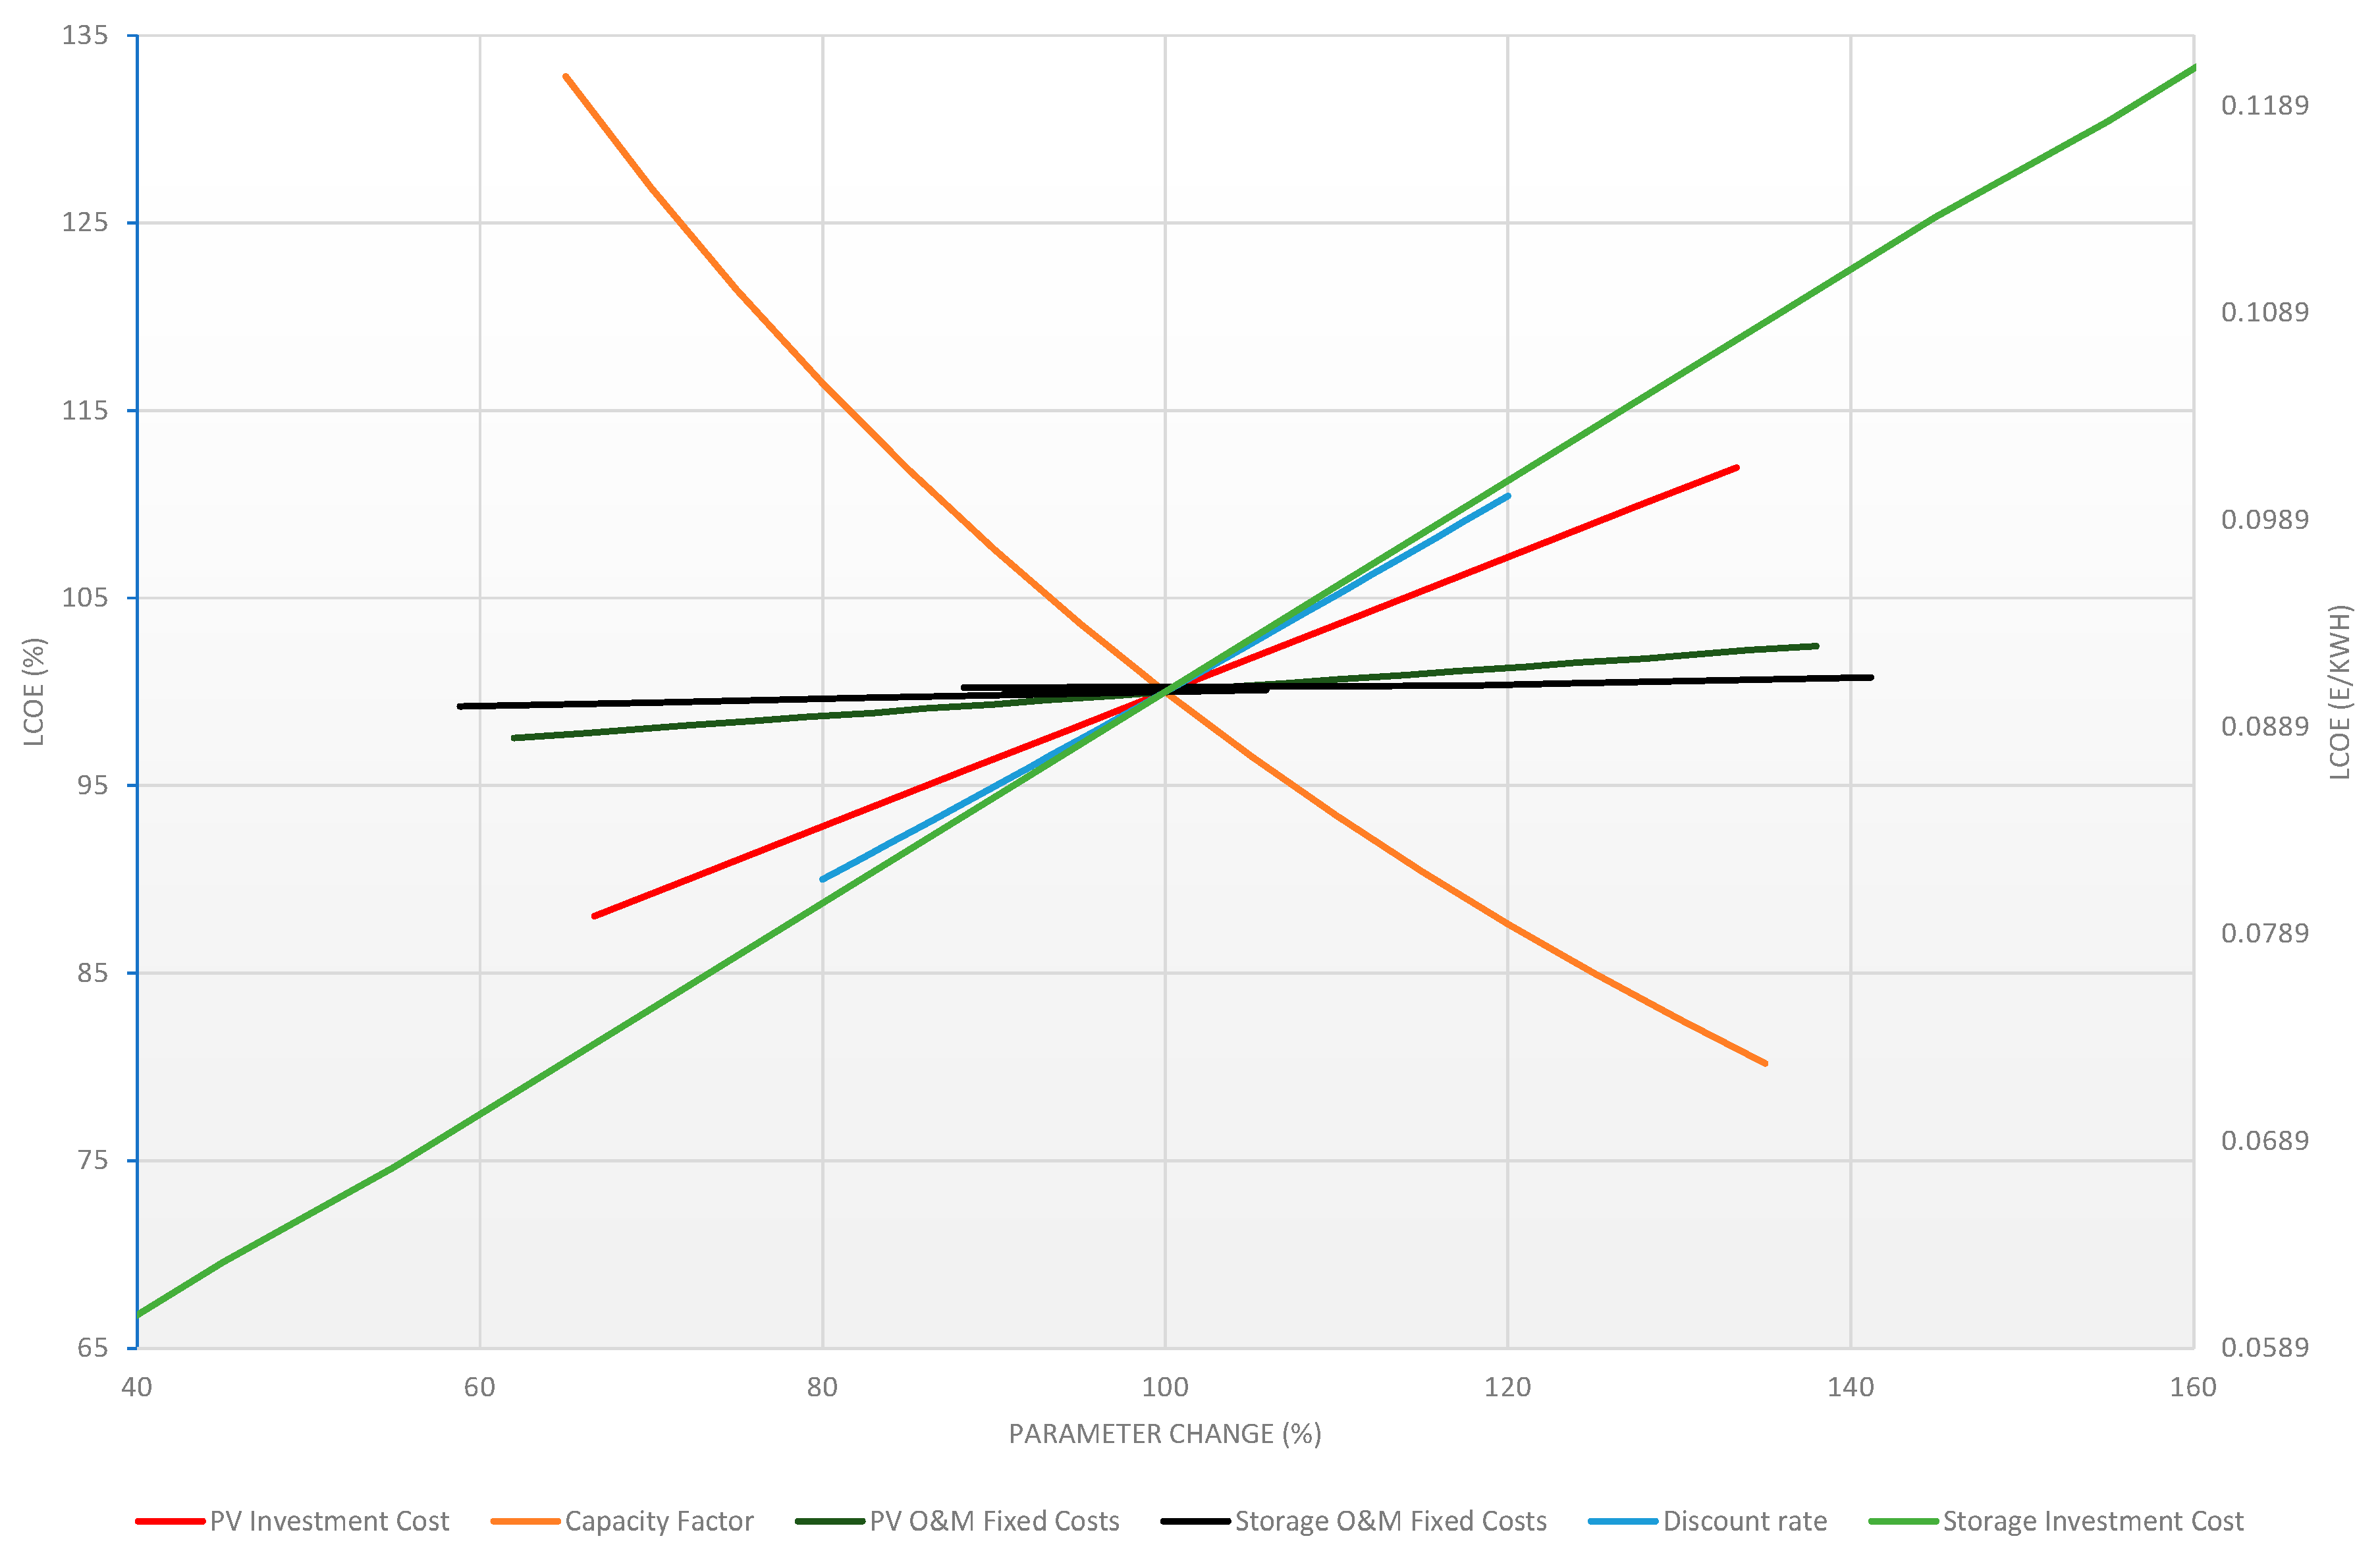
Concerning the first storage scenario for PVs, the cumulative results of the sensitivity analysis are presented in
Figure 3. Considering average values for all studied parameters, the LCOE price is 0.0906 €/kWh. Moreover, NPV calculations returned negative results for all the studied parameters. In addition, the break-even points identified did not correspond to realistic parameter values. Positive NPV values have been attained for both market values considered (103% and 100% for PV electricity), for unrealistic storage costs (<24 €/kWh for 103% and 21 €/kWh for 100%, respectively). As far as the CF is concerned, break even value for the NPV is 47% for market values of 103% and 48% for a market value of 100%, therefore positive values can be identified for CFs over these values. NPV calculations have also led to negative values for a constant cost of ancillary services at 0.025 €/kWh and a wholesale market price ranging between 0.04–0.06 €/kWh. The NPV values are positive only for more than twice the value of average wholesale electricity prices, namely higher than 0.1185 €/kWh and 0.1188 €/kWh, if market values of 103% and 100%, respectively are considered.
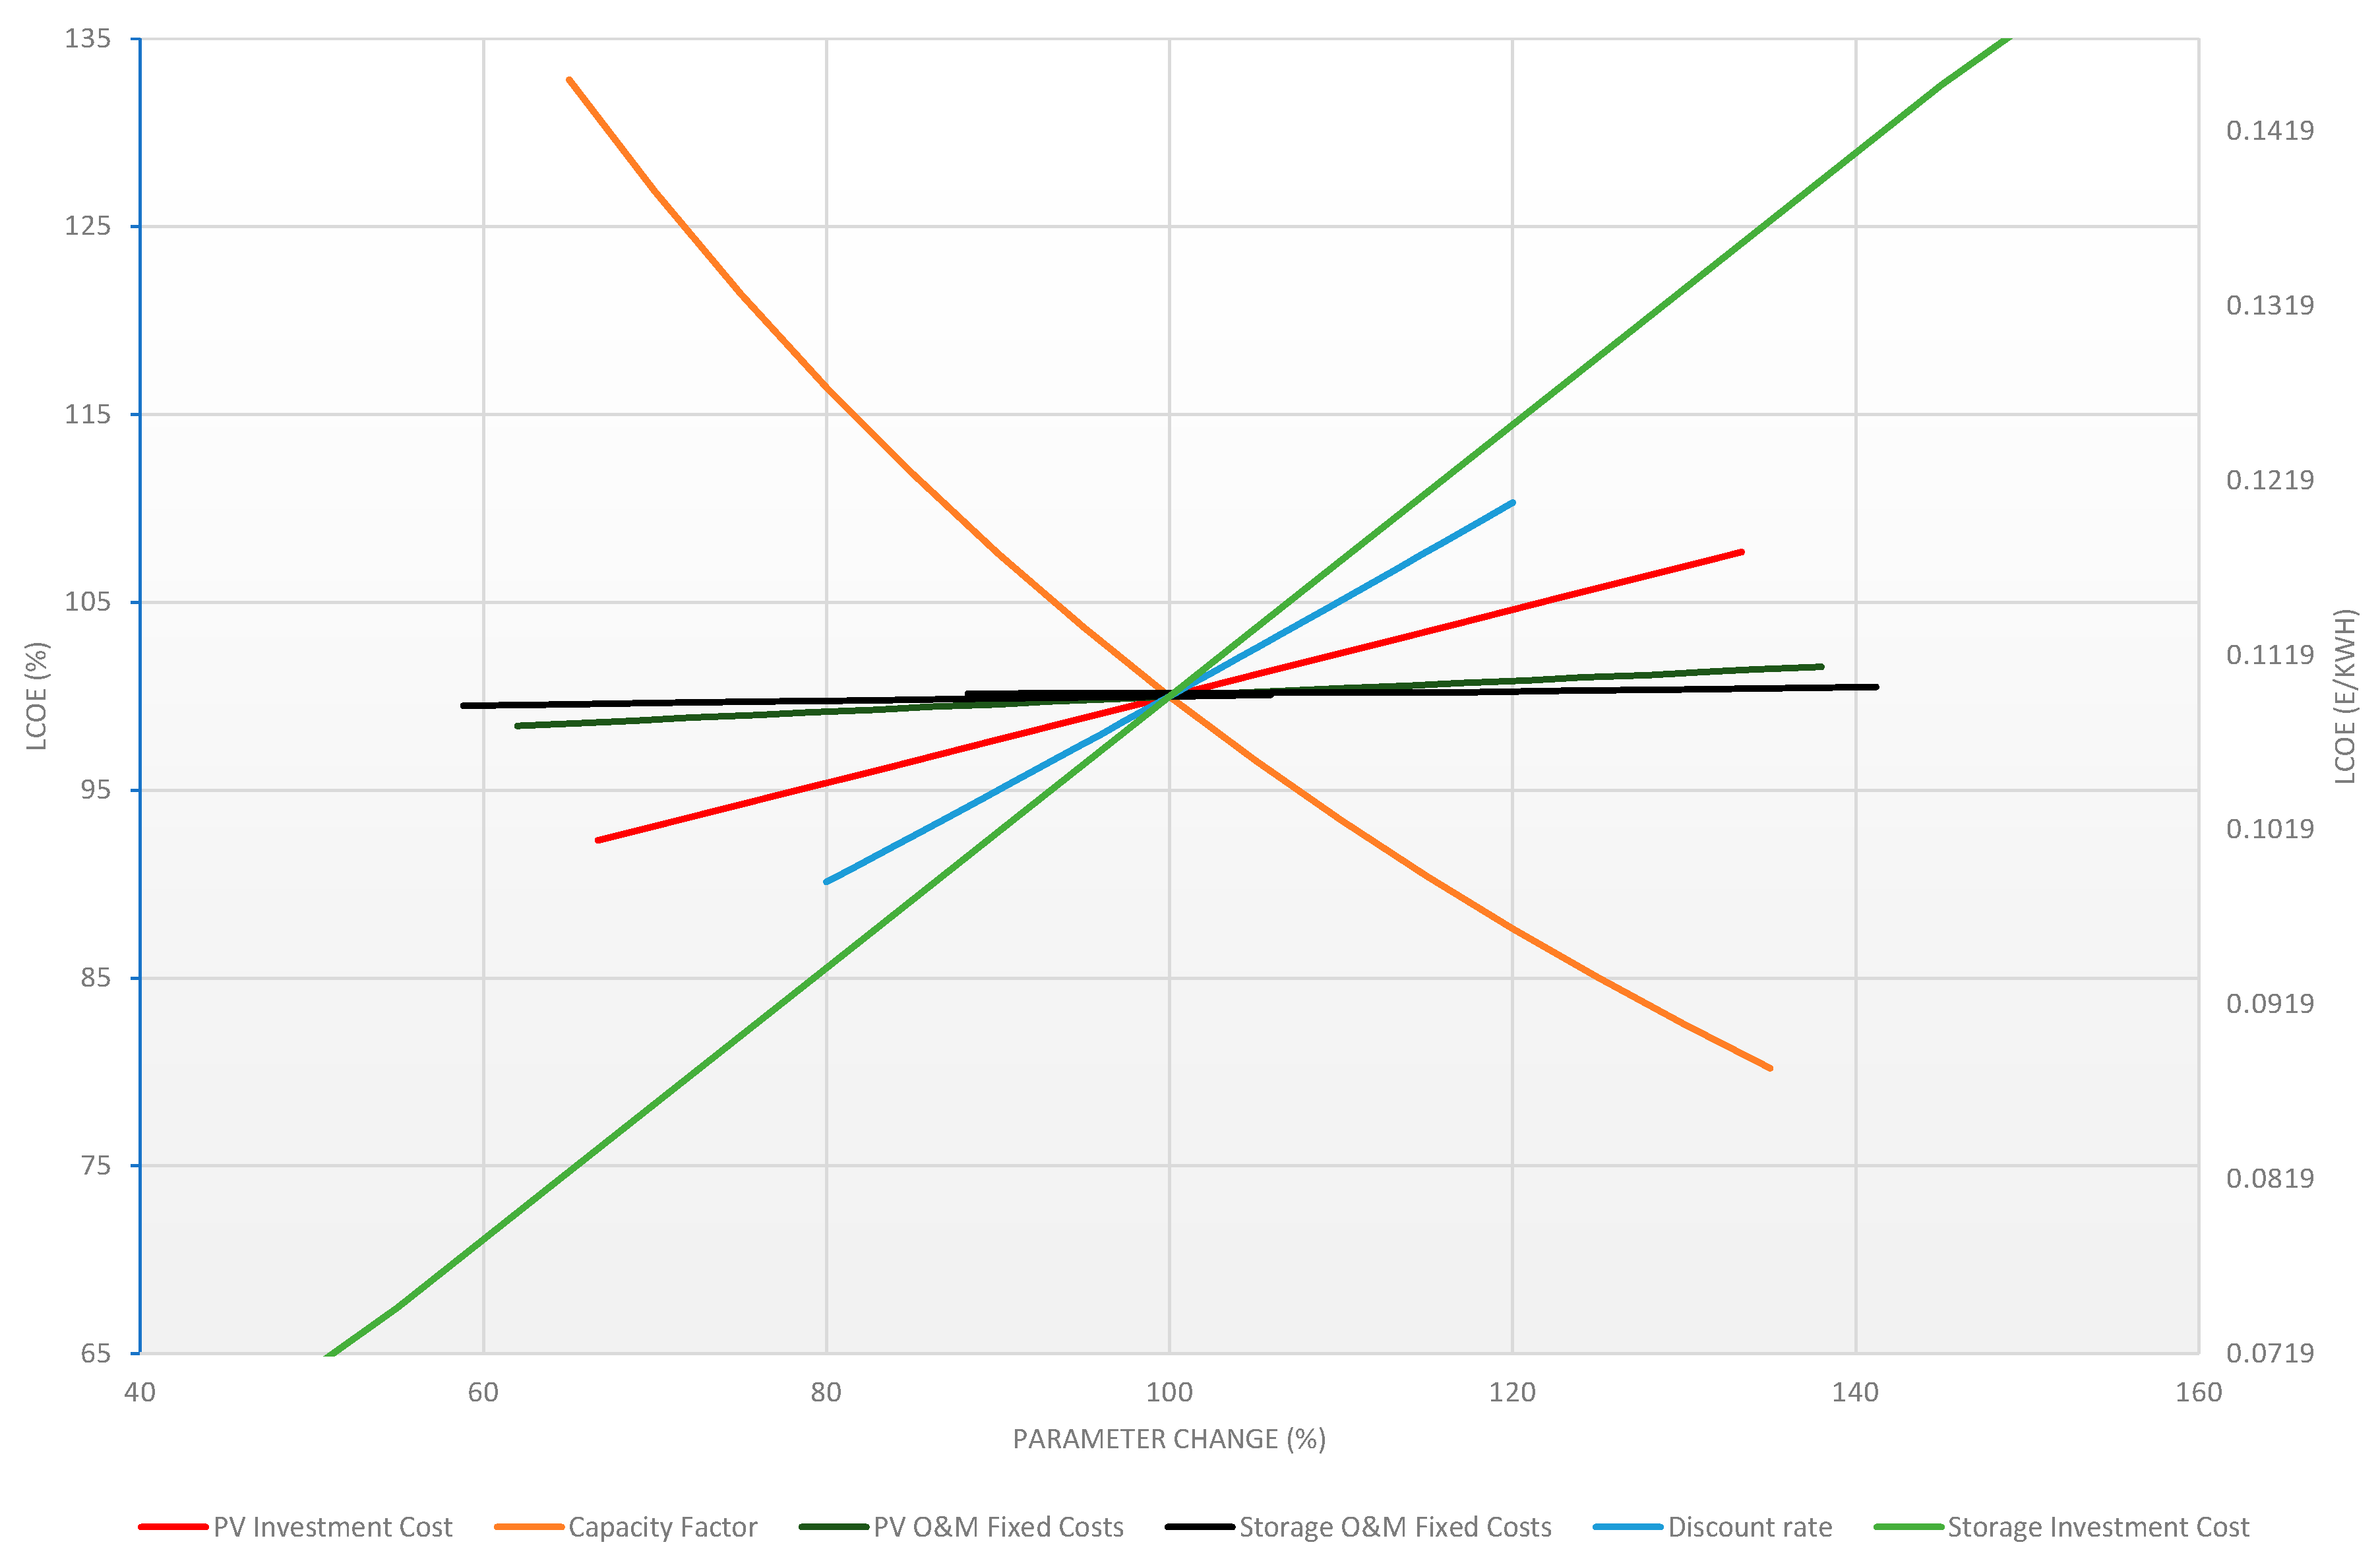
Accordingly, the results of the second storage scenario for PVs are illustrated in
Figure 4. The LCOE is calculated equal to 0.1091 €/kWh, considering average values for all the investigated parameters. No positive NPV values were identified for this scenario as well.
Likewise, the average values and ranges corresponding to the scenarios studied for offshore wind with storage are summarized in
Table 6.
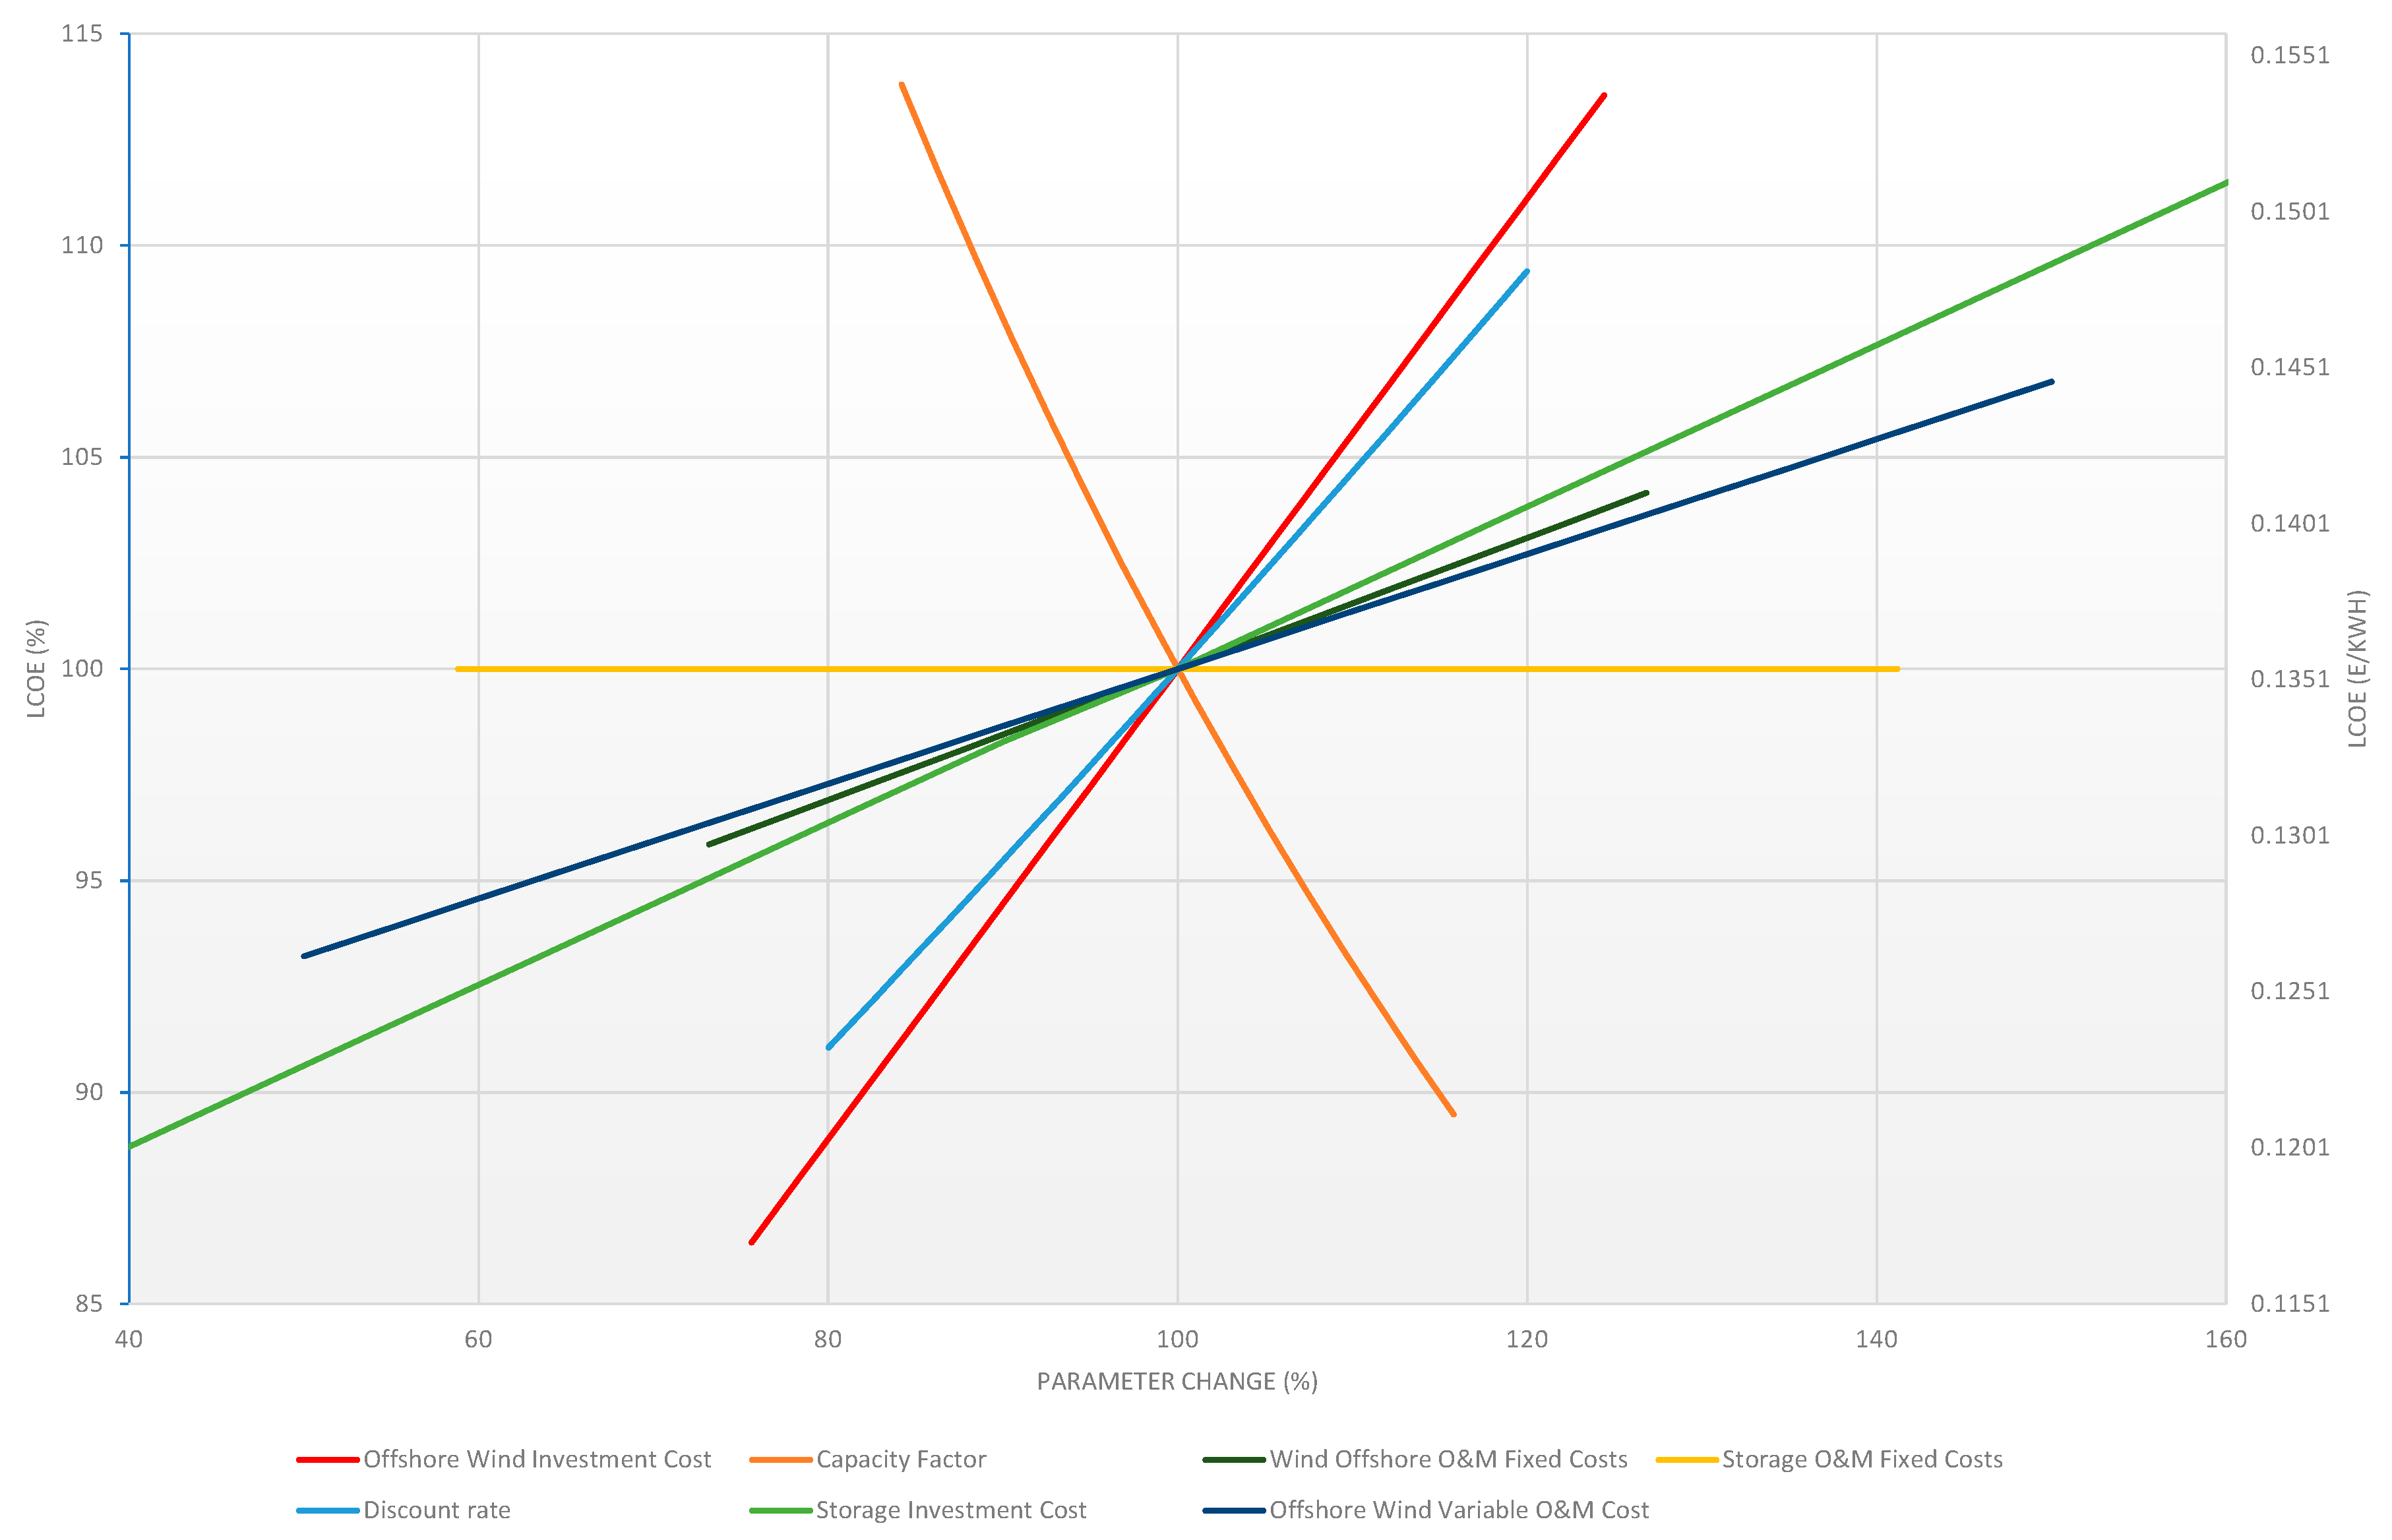
As far as offshore wind is concerned, the results of the first storage scenario are demonstrated in
Figure 5. The LCOE price calculated for constant average values of the studied parameters is 0.1354 €/kWh. In this case, negative NPV values were identified for all the examined parameters. Furthermore, the break-even point for offshore wind values was identified for remarkably high wholesale electricity prices (0.1547 €/kWh and 0.1548 €/kWh for market values of 103% and 100%, respectively).
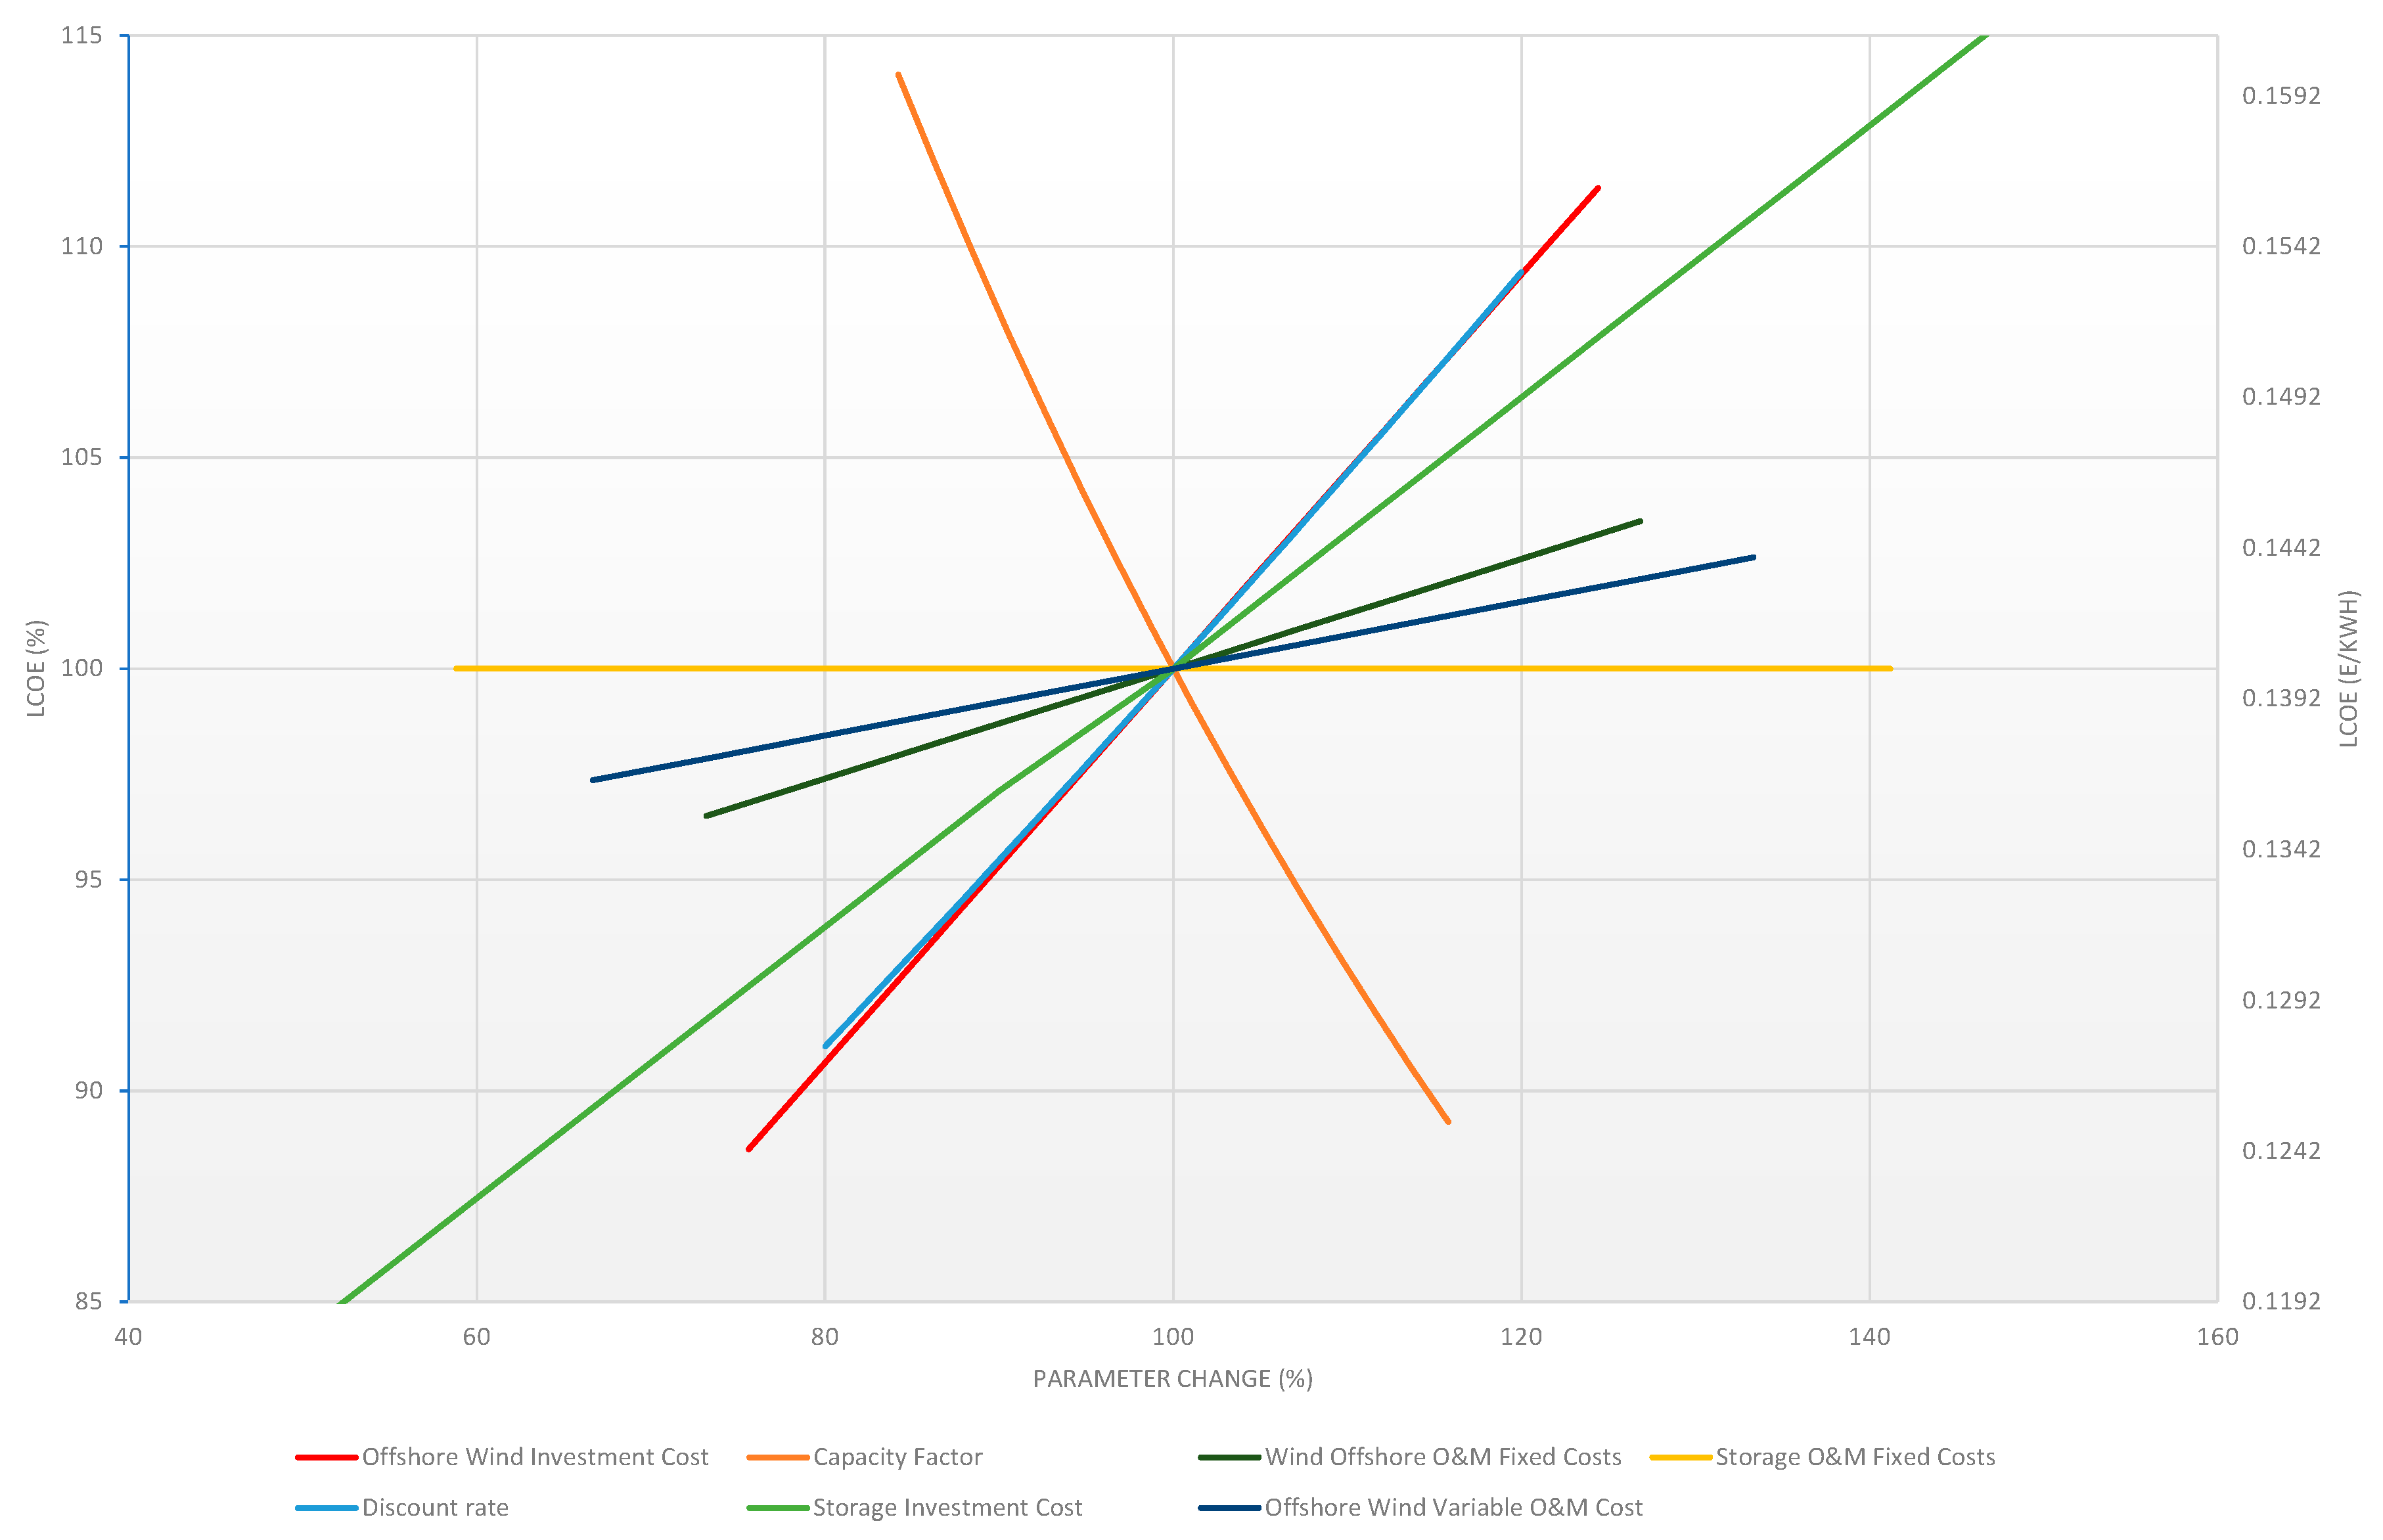
Finally, the results of the second storage scenario for offshore wind are depicted in
Figure 6. If average values are considered for all the parameters, the LCOE price is equal to 0.1402 €/kWh. All NPV values calculated were negative in this case as well.
4. Discussion
As the related analysis indicates, the LCOE values for CSP projects are expected to vary between approximately 0.13 and 0.159 €/kWh—depending on the existing variations in storage capacities. Moreover, higher capacity factors and investment costs are expected to lead to a downward trend of LCOE. The break-even point for NPV has been identified at investment costs equal to 1995 €/kW. These results are in compliance with the ones presented in the CSP study of Lilliestam [
116], as the elicited LCOE prices lie within the above range for recent projects. In addition, the high learning rates of CSP projects with large storage capacities, reaching up to 43% approximately in the case of parabolic trough plants, can set the groundwork for the emergence of investment costs below 2000 €/kW in the coming years. By contrast, the impact of fixed O&M costs can be deemed negligible; a 65–71 €/kW range in their values lead to a range between 0.1421 and 0.1437 €/kWh for LCOE (
Figure 2), namely a 4.4% change in fixed O&M costs results in a 0.5% change in LCOE.
However, the impact of variable O&M costs and the discount rate cannot be neglected. According to the current study, a range between 0.017 and 0.034 €/kWh for O&M variable costs can result in a 0.134–0.154 €/kWh range for LCOE. As the sensitivity analysis in
Figure 2 demonstrates, a 35% change in this parameter causes a 6% change in the LCOE value. Accordingly, for values between 6–9% for the discount rate, the LCOE values are calculated to lie within a range of 0.1301–0.1564 €/kWh, namely a 20% change in the discount rate leads to 9% differentiation for LCOE. All NPV calculations, except for the ones related to the impact of investment costs, resulted in negative prices. As can be clearly seen in
Figure 2, the CSP parameter with the strongest impact on the LCOE is the investment cost, followed by the discount rate and variable O&M costs, whereas the impact of fixed O&M costs is inappreciable. Finally, the LCOE price corresponding to the average values of the studied parameters is equal to 0.1429 €/kWh, which is the highest LCOE price identified in the presented analysis.
Concerning the first scenario for PV with storage, as expected, the impact of the investment cost on LCOE is very high. More precisely, for a PV cost ranging between 600–1200 €/kW, the LCOE values lie within a 0.0798–0.1015 €/kWh range, namely a 33% parameter change leads to a 12% change in LCOE. Negative NPV prices are reasonable in this case, given the low prices of wholesale electricity and ancillary services. The influence exerted by storage investment costs on the LCOE is even more significant. As
Figure 3 shows, for parameter values between 200 and 900 €/kW, the respective LCOE values range from 0.0585 to 0.1228 €/kWh, corresponding to a 35% LCOE change for a 64% change in the parameter values. The positive NPV values achieved do not correspond to current market prices, hence this option cannot be considered viable. The impact of fixed O&M costs for both PV and storage cannot be regarded as significant, given that parameter changes of approximately 40% have resulted in LCOE changes between 1–2%. As expected, negative NPV values were returned in both cases. On the contrary, the impact of the CF is remarkable, as LCOE prices range between 0.1203 and 0.0727 €/kWh for a CF range from 13% to 27%, namely a 35% change in the values of the parameter results in a 33% change in LCOE values. However, CF values achieving the NPV break point cannot be regarded as attainable. The impact of the discount rate is considerable, but not so substantial in order to return positive NPV values. More specifically, considering a 6–9% range for the discount rate, the LCOE ranges between 0.082–0.10 €/kWh, namely a variation of 20% in the discount rate leads to almost 10% change of the LCOE.
Concerning the first PV plus storage scenario,
Figure 3 shows that the CF and the storage investment cost constitute the two most important parameters, followed by the discount rate and the PV investment cost, while the impact of the fixed O&M costs for the PV and the storage components is negligible. The LCOE price corresponding to the average values of all parameters is 0.0906 €/kWh. In the second scenario, the respective LCOE price is equal to 0.1091 €/kWh. Nonetheless, the overall picture remains the same according to
Figure 4, given that there are no differentiations in the ranking of the parameters, as far as their impact on LCOE is concerned. Overall, the LCOE prices achieved in the case of PV plus storage are by far the lowest ones in this analysis. The above-mentioned outcomes are deemed tenable according to the existing literature, given that PVs constitute a considerably mature [
117,
118] and cost-competitive technological option [
119]; as a result, the impact of storage is expected to be dominant [
120].
Concerning the first scenario for offshore wind coupled with storage, the LCOE lies within a range between 0.1171 and 0.1538 €/kWh for offshore wind investment costs between 3100 and 5100 €/kW, according to
Figure 5. These results indicate that a change of 24% in the parameter values leads to a 14% change in LCOE. The values calculated are in line with the studies conducted by IRENA, according to which the global weighted LCOE accounted for 0.126 €/kWh in 2016 [
51], landing at 0.107 €/kWh in 2018 [
107], including also an investment cost for storage. Moreover, the same Figure shows that for storage investment costs between 200–900 €/kWh the LCOE ranges between 0.1191–0.1518 €/kWh, namely a 64% variation of the parameter impacts on the LCOE price by approximately 12%. Regarding both fixed and variable offshore wind O&M costs, their impact on LCOE is deemed weak. More precisely, in the case of fixed costs, LCOE presents a variation by slightly over 4% for a parameter change up to 27%, while in the case of variable costs, a 33% change in the parameter value results in a 3% change in LCOE. Furthermore, the impact of fixed O&M costs for the storage component is regarded as inappreciable, as can be clearly seen in
Figure 5. On the contrary, the impact of the CF is rather significant, as the LCOE receives values from 0.154 to 0.121 €/kWh, corresponding to a 40–55% range for the CF. The sensitivity analysis shows that a 16% change in the parameter’s value results in an almost equal variation of the LCOE, namely 14%. By contrast, the discount rate presents an intermediate impact; more specifically, a parameter variation equal to 20% leads to a 9% change in the LCOE value. No positive NPV values have been identified for the above parameters. As offshore wind constitutes a rather capital-intensive technological option [
121] and the storage component is expected to incur additional costs, such results can be considered reasonable.
As
Figure 5 shows, the strongest impact on the LCOE is presented by the CF, while the second most pivotal parameters are the wind investment cost and the discount rate. The impact of the storage investment cost and the offshore wind O&M costs (both fixed and variable) is less significant, whereas the impact of the storage O&M fixed costs is negligible. The LCOE price calculated for an average value at all parameters is 0.1354 €/kWh in the first storage scenario. This price is significantly higher than the ones corresponding to PV with storage, although it does not exceed the LCOE price of CSP. Nonetheless, the LCOE price achieved in the second storage scenario for offshore wind is equal to 0.1402 €/kWh, thus becoming comparable to CSP. Concerning the impact of the studied parameters on LCOE, no differentiations have occurred in their ranking, as can be clearly seen in
Figure 6.
Overall, achievable positive NPV values were identified only in the case of a CSP plus storage investment cost lower than 1995 €/kW. Positive NPV values achieved by PVs with storage, corresponded either to investment costs below 21–24 €/kWh or CF values exceeding 47%. Hence, they cannot be regarded as feasible. Nevertheless, such an outcome does not imply that positive NPV values cannot be observed in real-life projects for these technologies, but rather indicates that the optimal values of the examined parameters are required. Such an analysis lies beyond the scope of the present study, which is based on reference values, provided by the international literature.
Concerning the LCOE sensitivity analysis, the largest range in the calculated values is experienced for PV coupled with storage, followed by offshore wind with storage. The lowest range achieved in this analysis is attributed to CSP. As regards PV, this result is expected, given the wider impact of storage cost compared to offshore wind and CSP, mainly due to the low investment cost of PV [
122,
123,
124]. The second largest LCOE range presented by offshore wind can be deemed an equally reasonable result; in this case, a relatively weaker impact of storage cost is expected, due to the higher investment costs characterizing the specific technological option [
125,
126,
127]. Therefore, it is evident that the regulating parameter in the LCOE range of these technologies is the storage cost applied.
All things considered, PVs coupled with storage constitute the predominant technological option in both storage scenarios, presenting noticeably lower LCOE values compared to their counterparts. For storage capacities of 0.5 kW per 1 kW of installed generation capacity or less, PVs are followed by offshore wind with storage, while CSP land at the third place. However, when the storage requirements are doubled, the LCOE of offshore wind with four hours of storage becomes comparable to CSP (0.1402 €/kWh for offshore wind against 0.1327–0.1513 €/kWh for CSP with higher CAPEX and thus bigger storage component than 4 h). Besides this, the particular traits of CSP should be considered, namely the remarkably high learning rates, the downward trends related to the LCOE as well as the comparatively higher storage capacities offered. Taking into account all of the above, it is expected that CSP can outperform offshore wind coupled with storage in high RES penetration (and thus high storage scenarios), both in terms of dispatchability and financial feasibility. Furthermore, in the current analysis only CSP plants equipped with at least six hours of storage presented positive NPV values. This conclusion is validated by the analysis carried out by Lovegrove et al. [
128], which points out the competitiveness of CSP plus storage against other dispatchable RES technologies in cases of storage requirements exceeding six hours. Nonetheless, it should be noted that the exact value of the storage capacity threshold, beyond which CSP presents a lead over competing technologies, is significantly determined by the respective assumptions regarding the related costs and discount rates.
5. Conclusions
As the clean energy transition goals become more ambitious, it is evident that the contribution of energy storage to fostering the penetration of renewables will be vital. In this context, the main challenge lies in optimizing the exploitation of RES potential, while at the same time addressing the impact of additional incurred costs of storage technologies [
129], especially in regard with the initial investment costs [
110]. As already mentioned, although solar PVs, offshore wind and CSP plus storage present remarkable differences, the existing literature either delves into these technologies partially or investigates the features of energy storage itself.
Concerning the competitiveness of dispatchable renewables, this study did not aim to identify an optimum technology, but rather to assess the contributing parameters and accent the conditions under which the added value of CSP’s dispatchable nature can really provide a competitive advantage against other comparable technologies, so as to preserve its position until a more advantageous situation emerges for its development. In this framework, PV and offshore wind combined with two different storage options were reviewed and comparatively assessed. In this frame, the comparative analysis of the above-mentioned technologies was based on two complementary metrics; LCOE and NPV. Nevertheless, the elicited conclusions should be treated as a revealing qualitative trend—and not absolute values per se—given that the respective analysis relied on average ranges of data stemming from studies published after 2017.
More specifically, as the sensitivity analysis indicates, the impact of the investment cost on the LCOE of CSP is predominant, followed by the discount rate and the variable O&M costs. On the other hand, the influence of the fixed O&M costs was noticeably weaker. It should be pointed out, though, that CSP presented a high LCOE price, compared to PV and the first storage scenario for offshore wind. By contrast, the LCOE of PV in the first storage scenario is the lowest and depends mainly on the capacity factor and the storage investment cost, whereas the discount rate and the PV investment cost were attributed an intermediate impact. On the other hand, fixed O&M costs for both the PV and storage components affected the LCOE the least. When equipped with the storage capacity of the second scenario, the picture remains similar, besides a slight increase of the LCOE. The LCOE price of offshore wind in the first storage scenario lies between the ones achieved by PV and CSP. However, when the storage capacity is doubled, the LCOE price becomes comparable to CSP. In both cases, it is heavily influenced by the capacity factor, the wind investment cost and the discount rate. The impact of storage, fixed O&M and variable O&M costs is lower, while the impact of storage O&M fixed costs can be deemed inappreciable.
Overall, the lowest LCOE values were achieved by PV with storage in both scenarios, whereas the highest ones by CSP in the first scenario and by offshore wind in the second storage scenario. Furthermore, the LCOE range of PV with storage was by far the largest, while CSP presented the lowest range achieved in this analysis. Regarding the competitiveness of the investigated technologies, PVs prevail in both storage scenarios. As far as the comparative assets of CSP with storage are concerned, the specific technological option has the potential to outperform offshore wind with storage in cases of high storage requirements. Consequently, high RES penetration is expected to result in the emergence of beneficial niches for CSP.
The main limitation of the present study lies in the utilization of value ranges provided by recent literature. Therefore, the elicited results reflect only the current status quo in EU countries as far as the RES penetration levels are concerned. Thus, value deviations emerging in 100% RES penetration scenarios have not been explored. However, significant raises in RES penetration are expected to lead to an increase in total generation costs [
130,
131], given that integration costs are higher for intermittent RES [
132]. In addition, the predominance of volatile energy sources in such scenarios is expected to cause price fluctuations and spikes [
133]. Considering the need for greater flexibility in 100% RES scenarios, the role of energy storage is also deemed pivotal; bulk energy storage options are characterized by high costs [
134,
135], as well as the extensive integration of fast-response units is expected to increase electricity prices [
136].
Within this context, the performance of 100% RES electricity systems will mainly depend on the ratio of the exploited electricity generation technologies, especially on the contextually prevalent one [
137,
138]. In regard with future research prospects, investigating the impact of competing RES technologies on 100% RES systems is recommended. In particular, the authors urge for more studies to explore the deviations caused by different technology ratios in such systems, especially in terms of costs, prices, flexibility and storage requirements. Shedding light on how these parameters are influenced will contribute to more targeted design and implementation efforts towards low-carbon electricity systems.


